

CryptoZeno 1
416 Publicaciones

CryptoZeno 1
Denunciar
Bloquear usuario
Featured Creator on #CoinMarketCap #BinanceSquare and #CryptoQuant | On Chain Research and Market Insights
0 Siguiendo
8 Seguidores
19 Me gusta
Publicaciones
·
--
Ver traducción
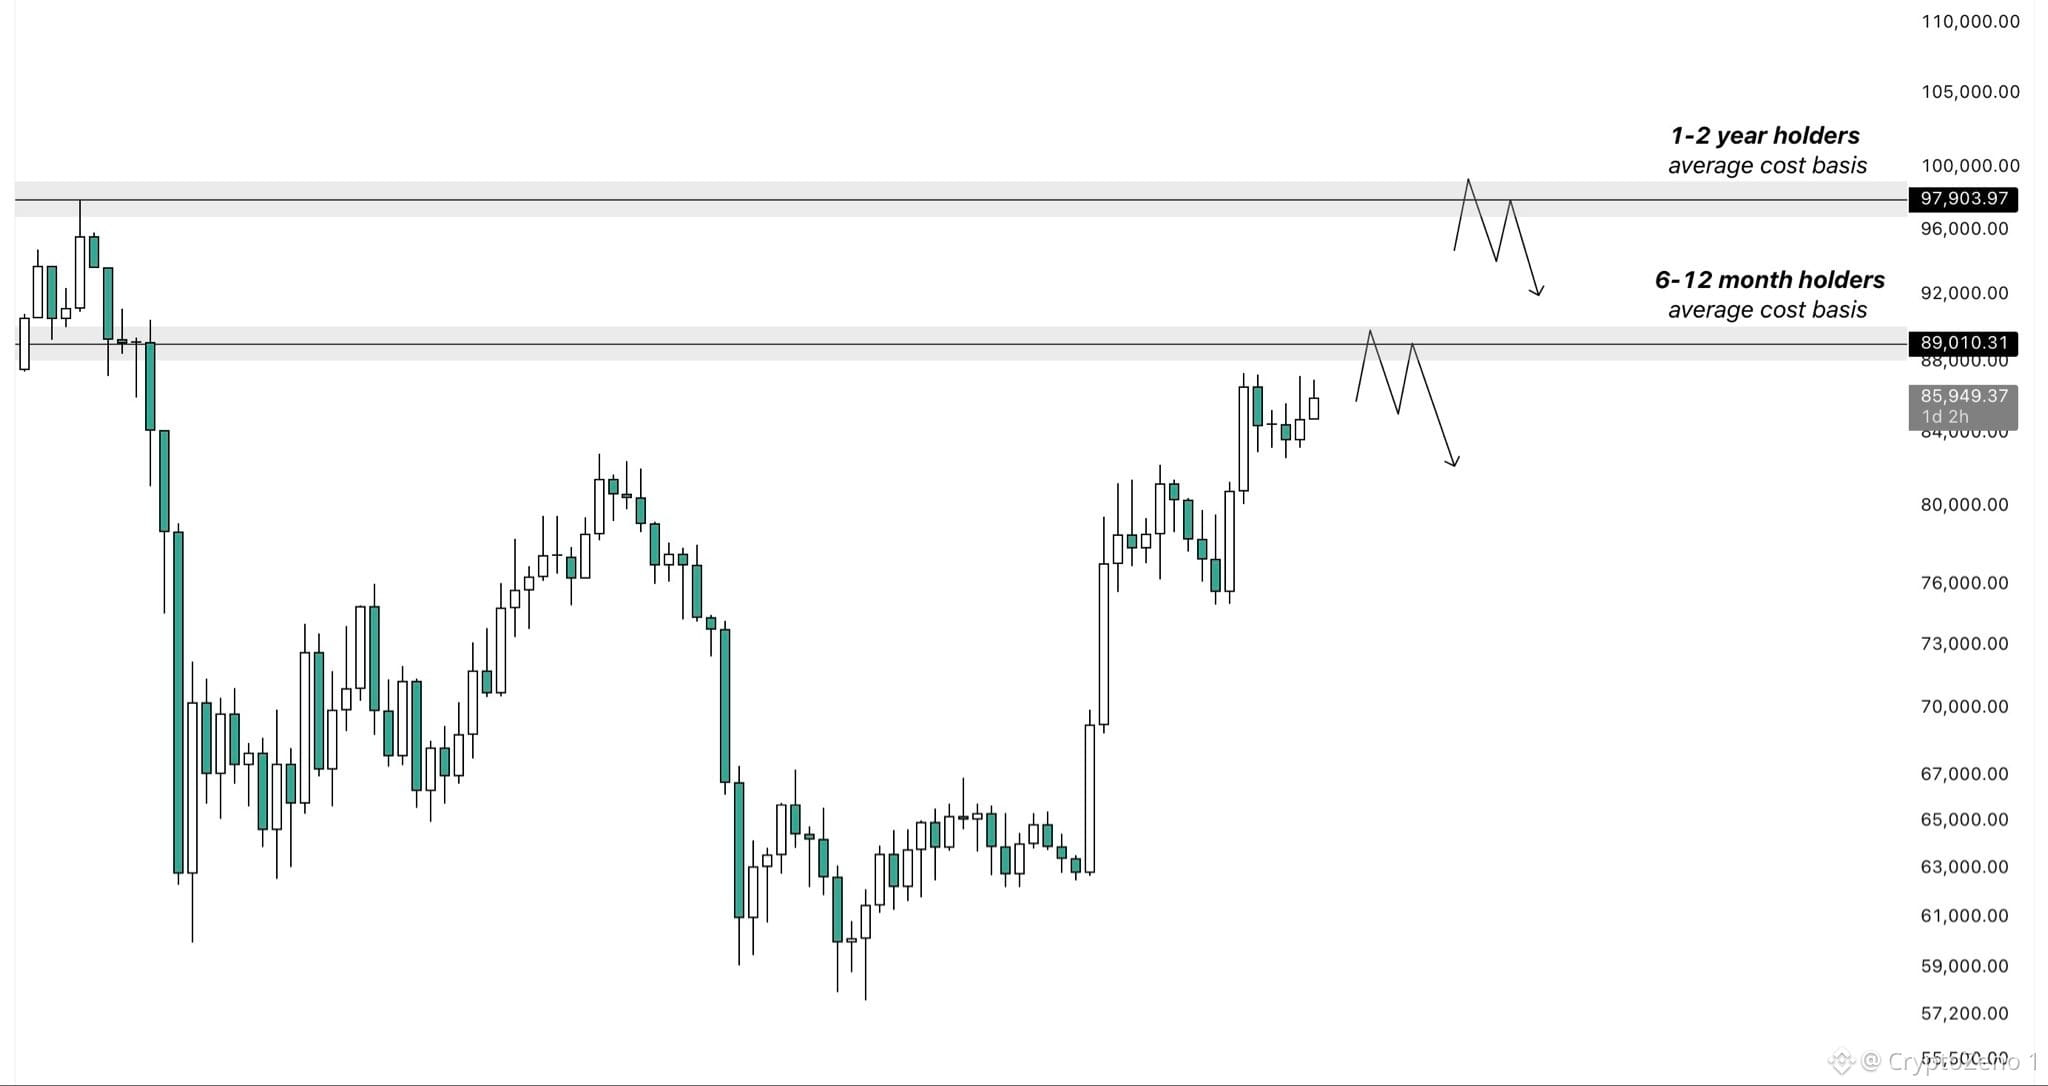
$BTC Even if price breaks above $87k, BTC might run into some additional selling pressure shortly after.
We currently have two important areas above price where large groups of holders would reach breakeven on their investments.
The closest one sits just above the recent highs around $89k, marking the average cost basis of holders who bought 6–12 months ago.
Further up around $97k, we have the breakeven level for the 1–2 year holders, which also lines up almost perfectly with the major swing high.
Holders who bought during the 2025 rally are already selling significantly more than those who accumulated during the decline.
That’s why both of these levels could become important as price approaches them, since holders who have been underwater for a longer period of time may use these opportunities to derisk or even exit their positions around breakeven. #BTC Price Analysis# #Macro Insights#
$BTC Even if price breaks above $87k, BTC might run into some additional selling pressure shortly after.
We currently have two important areas above price where large groups of holders would reach breakeven on their investments.
The closest one sits just above the recent highs around $89k, marking the average cost basis of holders who bought 6–12 months ago.
Further up around $97k, we have the breakeven level for the 1–2 year holders, which also lines up almost perfectly with the major swing high.
Holders who bought during the 2025 rally are already selling significantly more than those who accumulated during the decline.
That’s why both of these levels could become important as price approaches them, since holders who have been underwater for a longer period of time may use these opportunities to derisk or even exit their positions around breakeven. #BTC Price Analysis# #Macro Insights#
We currently have two important areas above price where large groups of holders would reach breakeven on their investments.
The closest one sits just above the recent highs around $89k, marking the average cost basis of holders who bought 6–12 months ago.
Further up around $97k, we have the breakeven level for the 1–2 year holders, which also lines up almost perfectly with the major swing high.
Holders who bought during the 2025 rally are already selling significantly more than those who accumulated during the decline.
That’s why both of these levels could become important as price approaches them, since holders who have been underwater for a longer period of time may use these opportunities to derisk or even exit their positions around breakeven. #BTC Price Analysis# #Macro Insights#
69
·
--
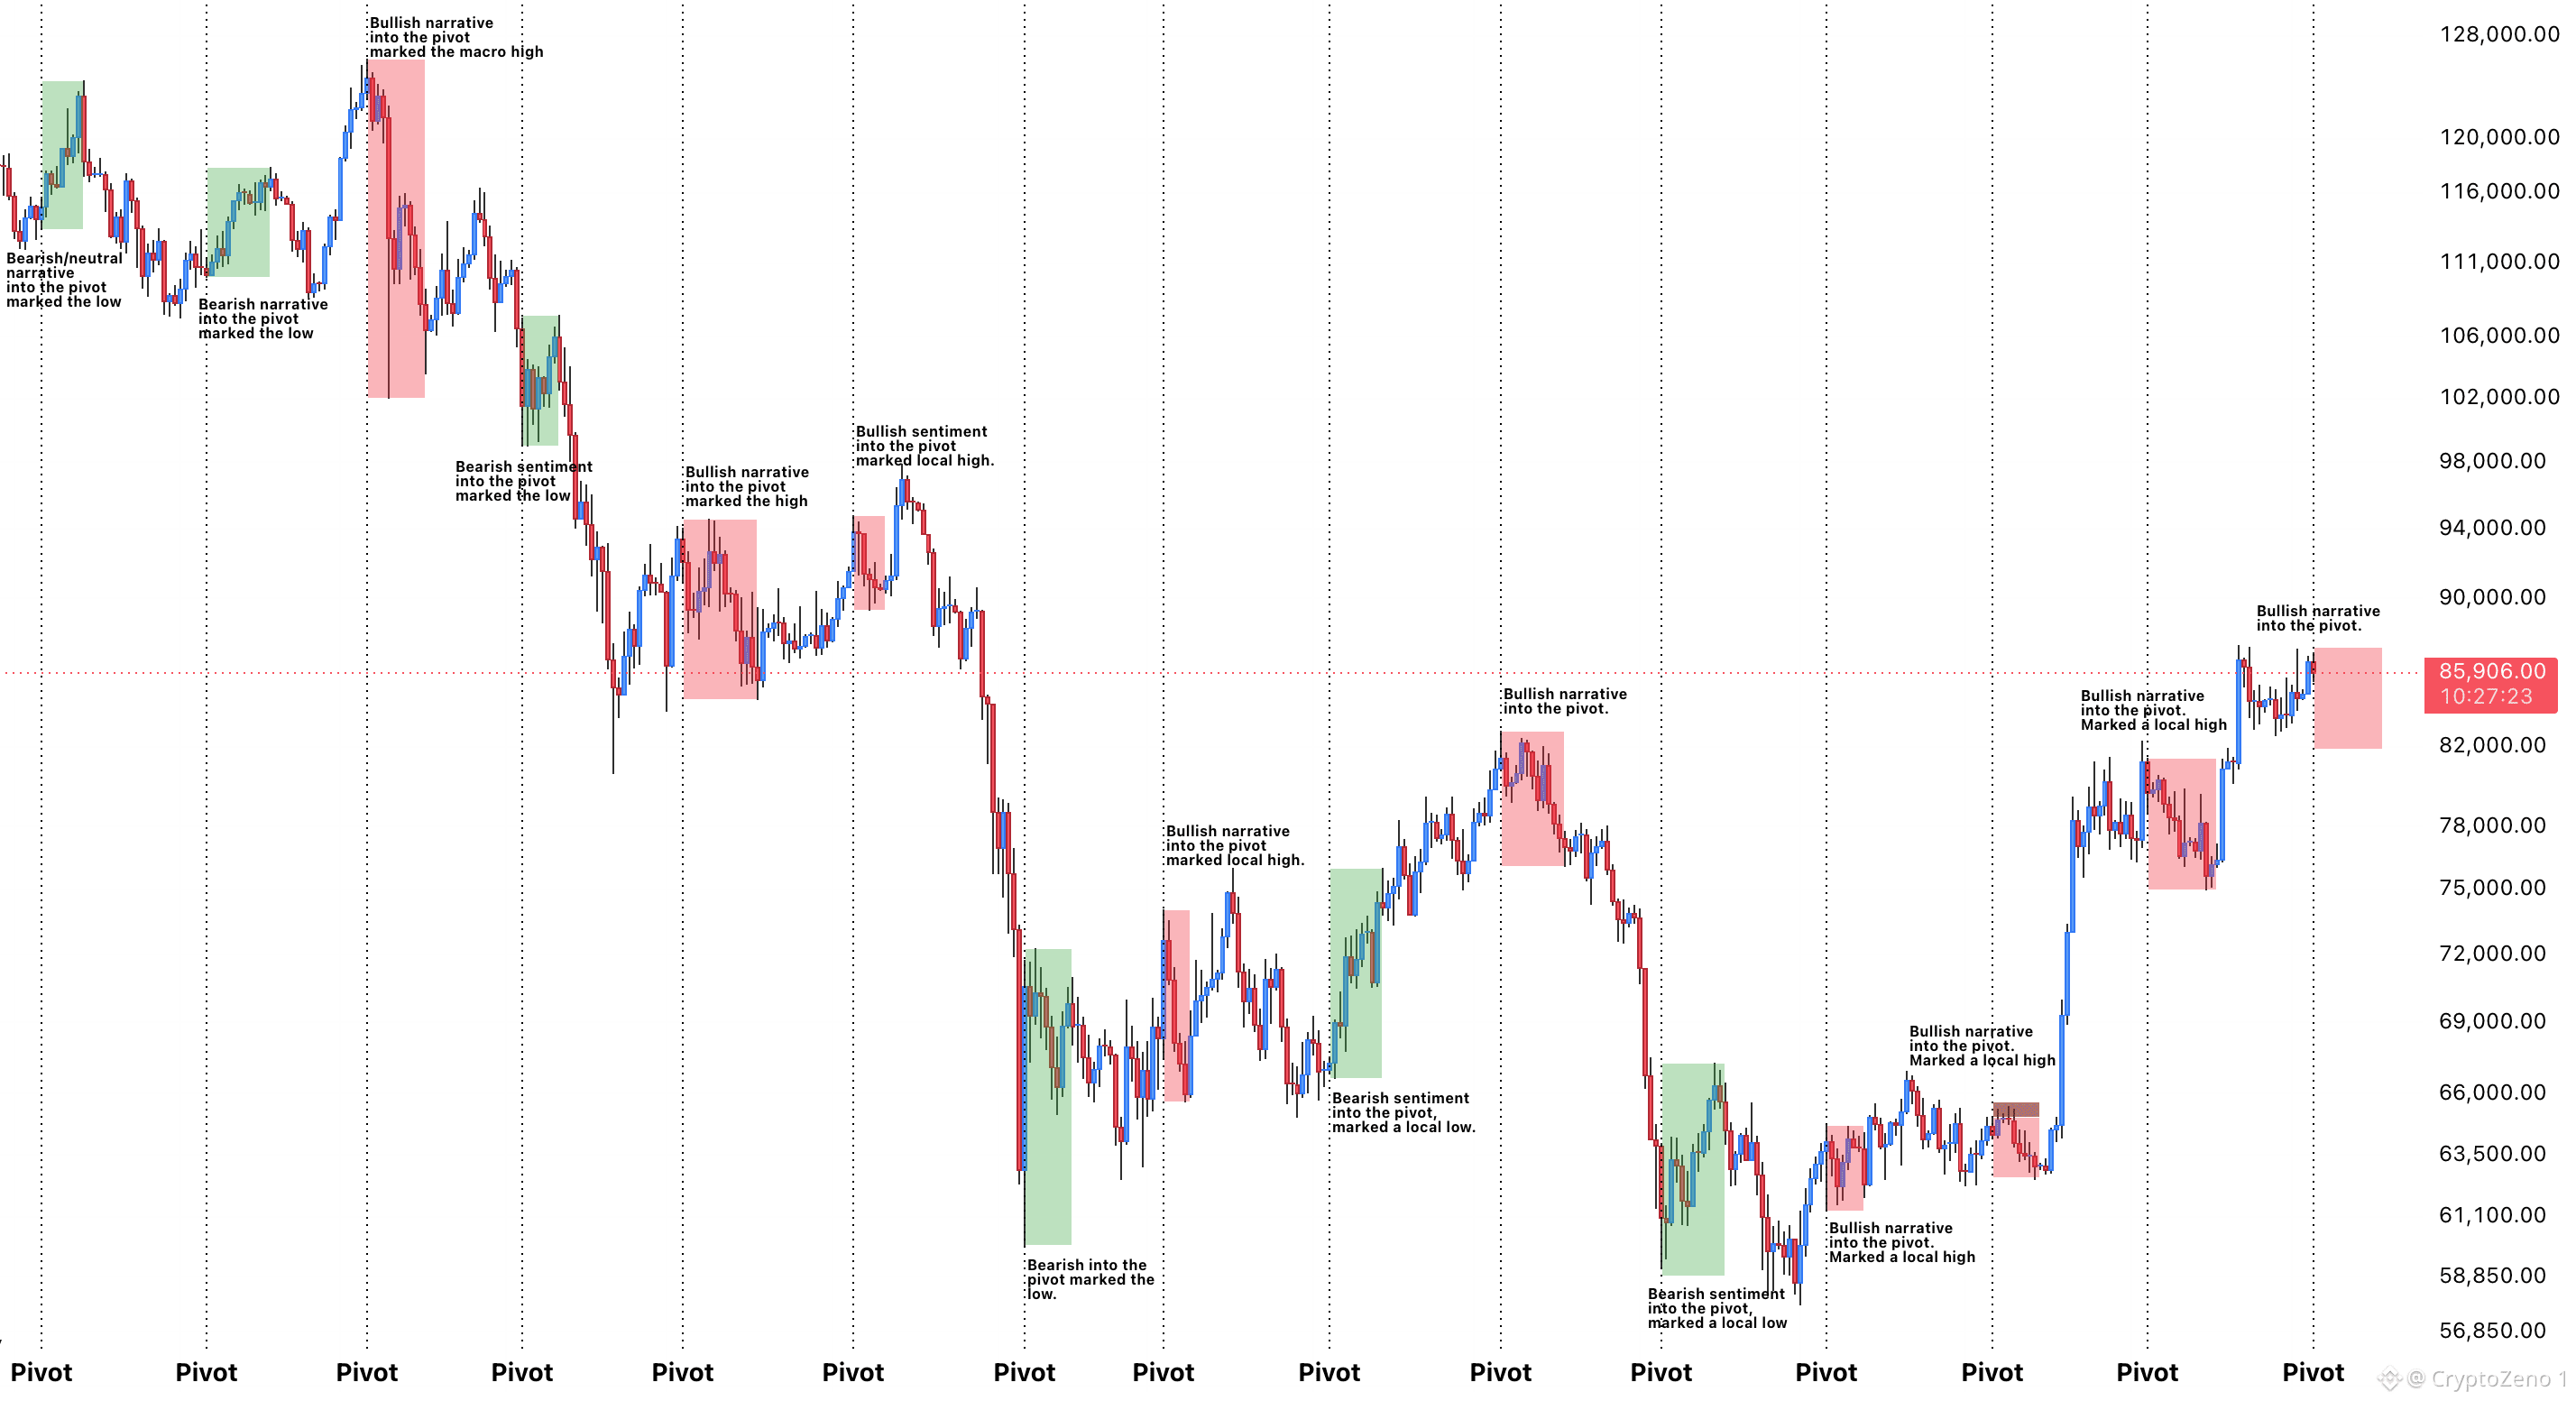
$BTC Construyendo una narrativa alcista de cara a mi punto de pivote...
Históricamente, cada vez que el sentimiento alcista se ha intensificado antes del 4.º al 6.º punto de pivote, se ha marcado un máximo local.
Si la historia se repite, esto podría provocar una caída hacia mediados de octubre.
Eso podría ofrecer una gran oportunidad para abrir posiciones largas en la caída.🃏 #Análisis del precio de BTC# #Perspectivas macroeconómicas#
$BTC Construyendo una narrativa alcista de cara a mi punto de pivote...
Históricamente, cada vez que el sentimiento alcista se ha intensificado antes del 4.º al 6.º punto de pivote, se ha marcado un máximo local.
Si la historia se repite, esto podría provocar una caída hacia mediados de octubre.
Eso podría ofrecer una gran oportunidad para abrir posiciones largas en la caída.🃏 #Análisis del precio de BTC# #Perspectivas macroeconómicas#
Históricamente, cada vez que el sentimiento alcista se ha intensificado antes del 4.º al 6.º punto de pivote, se ha marcado un máximo local.
Si la historia se repite, esto podría provocar una caída hacia mediados de octubre.
Eso podría ofrecer una gran oportunidad para abrir posiciones largas en la caída.🃏 #Análisis del precio de BTC# #Perspectivas macroeconómicas#
56
·
--
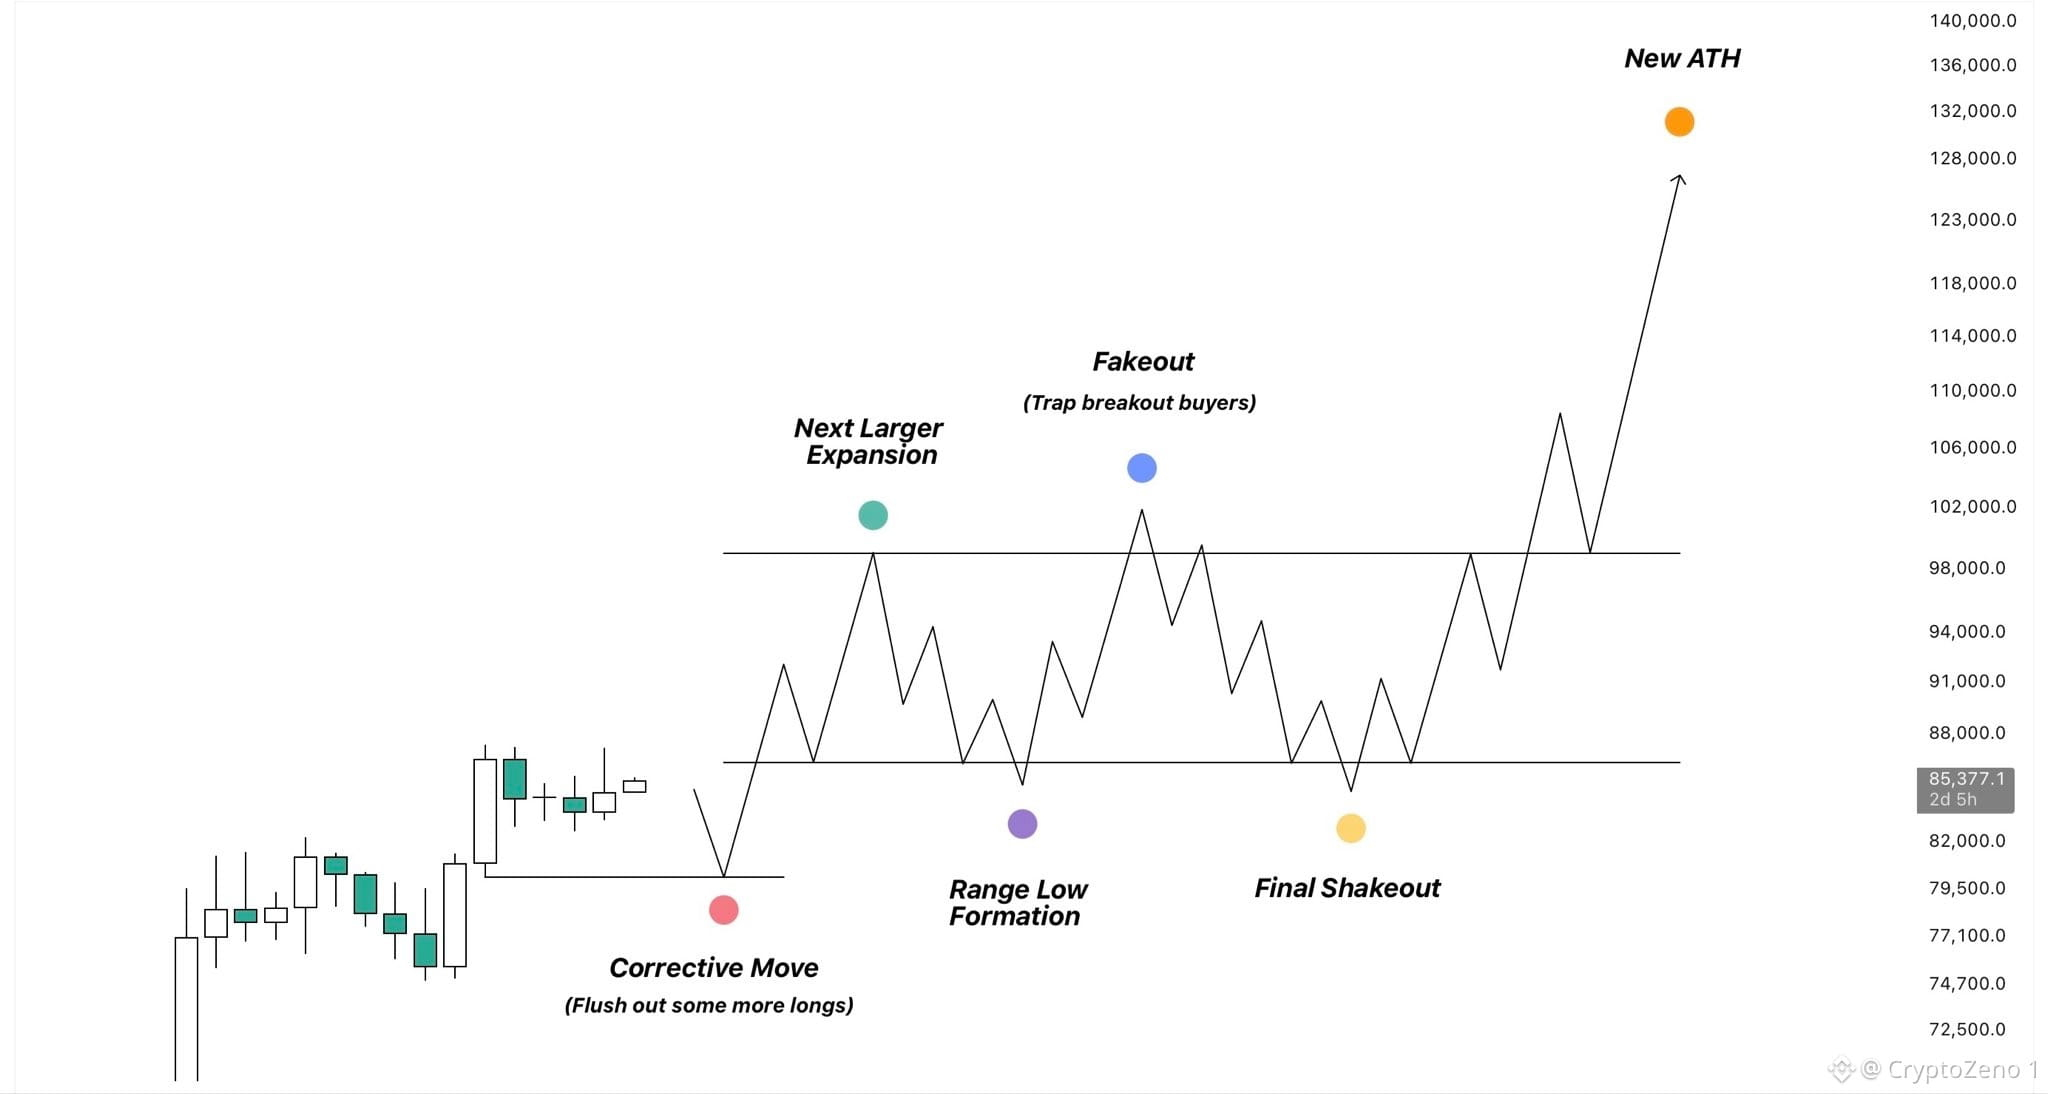
$BTC Es posible que pronto entremos en una de las fases de mercado más aburridas que existen.
Durante el mercado alcista de 2023, BTC formó un rango de reacumulación que duró algo más de siete meses, antes de romperlo violentamente y acabar estableciendo un nuevo máximo histórico.
Si BTC sigue reflejando este patrón de 2023, eso sugeriría que todavía nos queda otro movimiento correctivo, seguido de una expansión alcista decisiva, antes de entrar en una fase de reacumulación similar.
Como ya he mencionado varias veces, los ciclos se están comprimiendo y acortando cada vez más con el paso del tiempo. Por eso, esperaría que estos movimientos se desarrollaran en un periodo más corto y que posiblemente fueran menos pronunciados que en el ciclo anterior.
Por ejemplo, el movimiento correctivo podría ser simplemente otra desviación por debajo de los mínimos del rango actual o un
barrido de liquidez a la baja antes de que comience la expansión más amplia.
Entonces esperaría que esa ruptura llevara a BTC a algún punto de la zona media de los 90.000 $, donde podría empezar a formarse otro rango de reacumulación más amplio.
Ese rango podría extenderse desde los máximos del rango actual, cerca de los 87.000 $, hasta aproximadamente los 97.000 $.
Ahora bien, como dije, no espero que este rango dure ni de lejos tanto como el anterior. Pero, incluso con los ciclos
comprimiéndose, aún podría durar entre tres y cinco meses.
Supongamos que tanto el movimiento correctivo como la expansión posterior tardan hasta noviembre o diciembre en desarrollarse. En ese caso, BTC podría pasar potencialmente la mayor parte del primer trimestre de 2027 consolidándose dentro de este nuevo rango de reacumulación.
Así que, aunque sigo siendo extremadamente alcista respecto a la perspectiva general, existe una posibilidad muy real de que buena parte de los próximos meses resulte mucho más aburrida de lo que la mayoría espera actualmente. #Análisis del precio de BTC# #Perspectivas macro#
$BTC Es posible que pronto entremos en una de las fases de mercado más aburridas que existen.
Durante el mercado alcista de 2023, BTC formó un rango de reacumulación que duró algo más de siete meses, antes de romperlo violentamente y acabar estableciendo un nuevo máximo histórico.
Si BTC sigue reflejando este patrón de 2023, eso sugeriría que todavía nos queda otro movimiento correctivo, seguido de una expansión alcista decisiva, antes de entrar en una fase de reacumulación similar.
Como ya he mencionado varias veces, los ciclos se están comprimiendo y acortando cada vez más con el paso del tiempo. Por eso, esperaría que estos movimientos se desarrollaran en un periodo más corto y que posiblemente fueran menos pronunciados que en el ciclo anterior.
Por ejemplo, el movimiento correctivo podría ser simplemente otra desviación por debajo de los mínimos del rango actual o un
barrido de liquidez a la baja antes de que comience la expansión más amplia.
Entonces esperaría que esa ruptura llevara a BTC a algún punto de la zona media de los 90.000 $, donde podría empezar a formarse otro rango de reacumulación más amplio.
Ese rango podría extenderse desde los máximos del rango actual, cerca de los 87.000 $, hasta aproximadamente los 97.000 $.
Ahora bien, como dije, no espero que este rango dure ni de lejos tanto como el anterior. Pero, incluso con los ciclos
comprimiéndose, aún podría durar entre tres y cinco meses.
Supongamos que tanto el movimiento correctivo como la expansión posterior tardan hasta noviembre o diciembre en desarrollarse. En ese caso, BTC podría pasar potencialmente la mayor parte del primer trimestre de 2027 consolidándose dentro de este nuevo rango de reacumulación.
Así que, aunque sigo siendo extremadamente alcista respecto a la perspectiva general, existe una posibilidad muy real de que buena parte de los próximos meses resulte mucho más aburrida de lo que la mayoría espera actualmente. #Análisis del precio de BTC# #Perspectivas macro#
Durante el mercado alcista de 2023, BTC formó un rango de reacumulación que duró algo más de siete meses, antes de romperlo violentamente y acabar estableciendo un nuevo máximo histórico.
Si BTC sigue reflejando este patrón de 2023, eso sugeriría que todavía nos queda otro movimiento correctivo, seguido de una expansión alcista decisiva, antes de entrar en una fase de reacumulación similar.
Como ya he mencionado varias veces, los ciclos se están comprimiendo y acortando cada vez más con el paso del tiempo. Por eso, esperaría que estos movimientos se desarrollaran en un periodo más corto y que posiblemente fueran menos pronunciados que en el ciclo anterior.
Por ejemplo, el movimiento correctivo podría ser simplemente otra desviación por debajo de los mínimos del rango actual o un
barrido de liquidez a la baja antes de que comience la expansión más amplia.
Entonces esperaría que esa ruptura llevara a BTC a algún punto de la zona media de los 90.000 $, donde podría empezar a formarse otro rango de reacumulación más amplio.
Ese rango podría extenderse desde los máximos del rango actual, cerca de los 87.000 $, hasta aproximadamente los 97.000 $.
Ahora bien, como dije, no espero que este rango dure ni de lejos tanto como el anterior. Pero, incluso con los ciclos
comprimiéndose, aún podría durar entre tres y cinco meses.
Supongamos que tanto el movimiento correctivo como la expansión posterior tardan hasta noviembre o diciembre en desarrollarse. En ese caso, BTC podría pasar potencialmente la mayor parte del primer trimestre de 2027 consolidándose dentro de este nuevo rango de reacumulación.
Así que, aunque sigo siendo extremadamente alcista respecto a la perspectiva general, existe una posibilidad muy real de que buena parte de los próximos meses resulte mucho más aburrida de lo que la mayoría espera actualmente. #Análisis del precio de BTC# #Perspectivas macro#
75
·
--
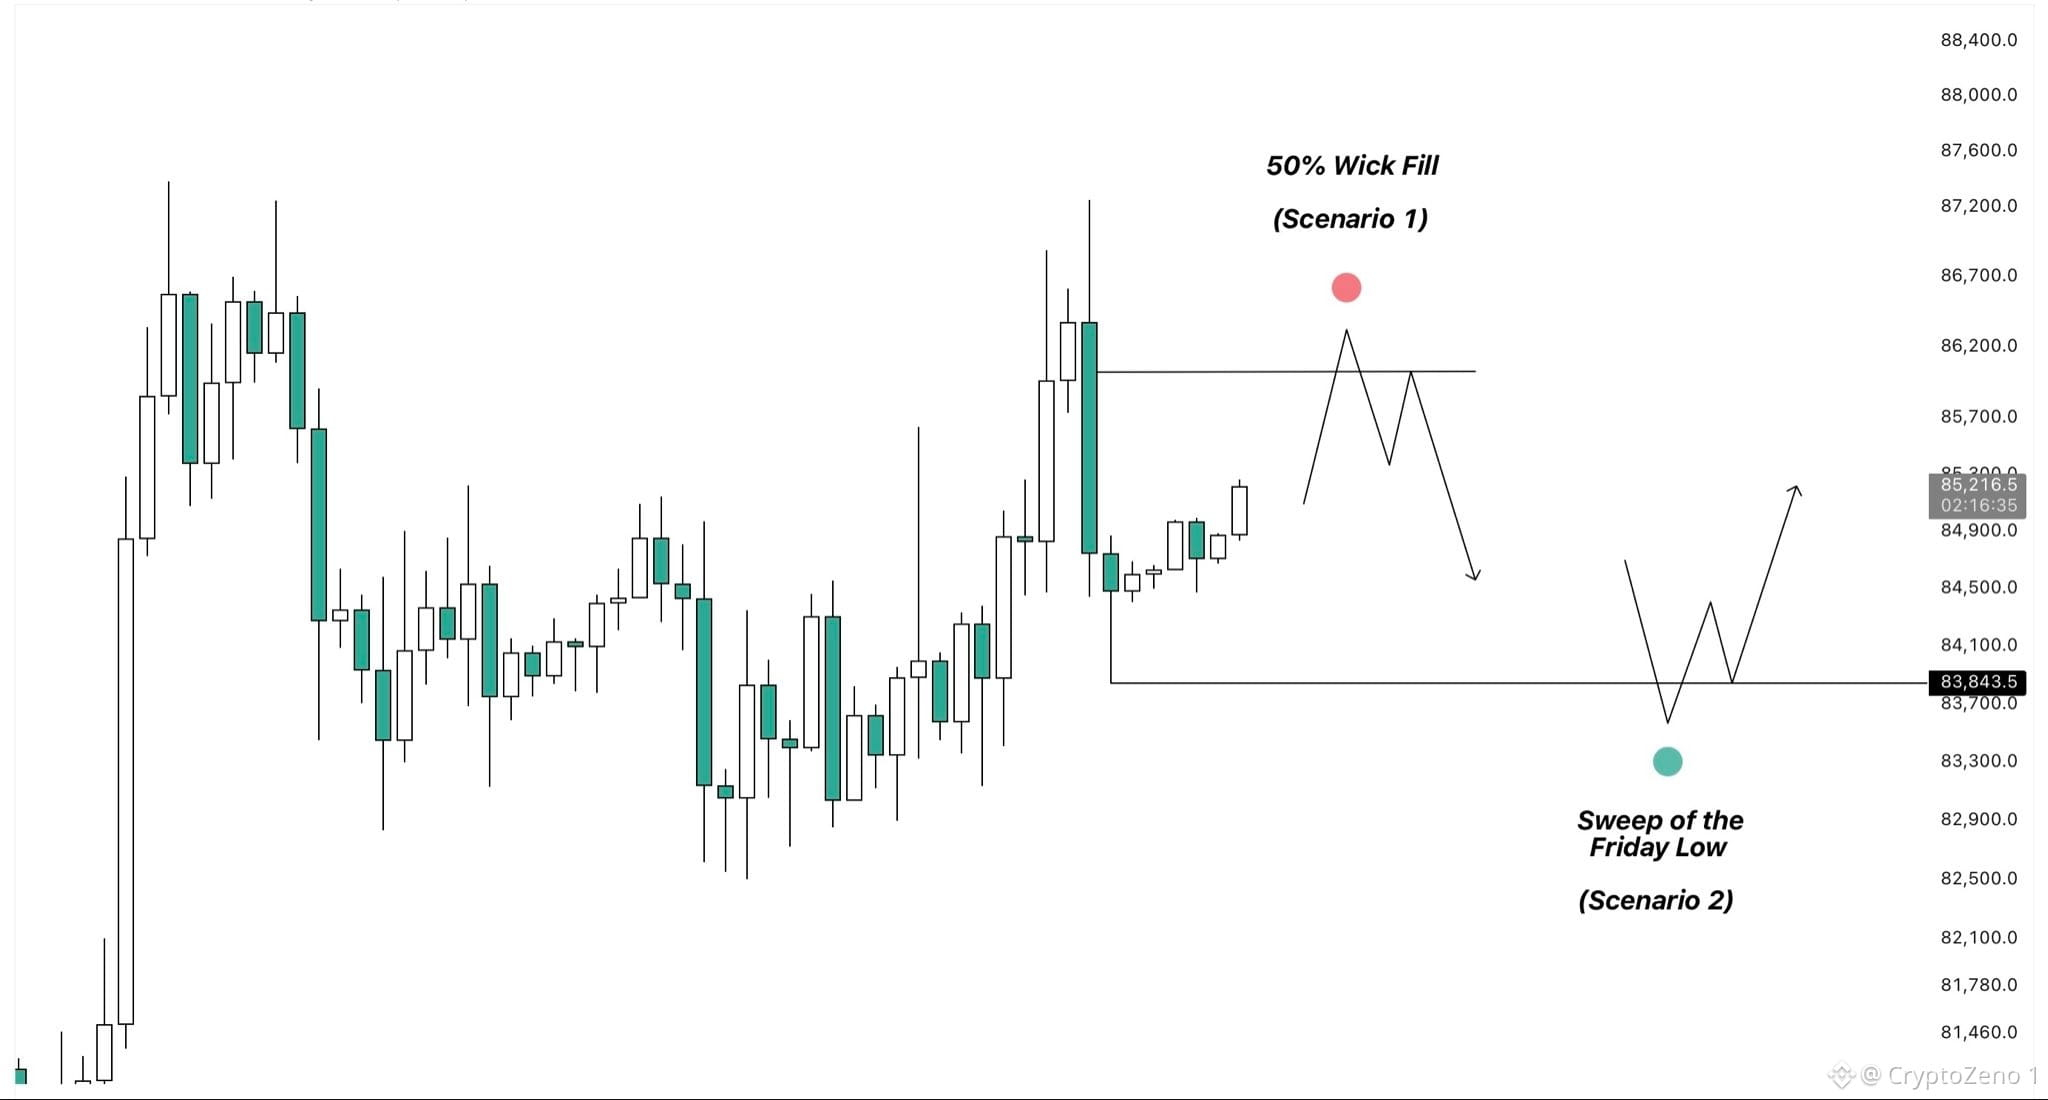
$BTC Si más tarde hoy tenemos algo de volatilidad, veo posibles estos dos escenarios.
Como el precio está volviendo a probar los máximos del rango, podríamos ver un rechazo por esta zona que
haga que el precio vuelva hacia el mínimo del viernes. Aquí podríamos ver una posible barrida seguida de otro rebote.
El otro escenario posible es que BTC siga subiendo primero hasta la zona de los $86k para llenar el 50 % de la mecha de la que he estado hablando, antes de posiblemente volver a girar a la baja.
Ambos escenarios podrían ofrecer buenas oportunidades para hacer scalping.
Una subida hasta la zona de los $86k podría preparar una buena entrada en corto si vemos un rechazo claro allí. Sin embargo, sigue siendo muy posible que haya una barrida de los máximos triples en torno a los $87k, así que aquí sería importante colocar bien el stop.
Si, por otro lado, el precio barre el mínimo del viernes y lo recupera de inmediato, podría darse una operación en largo de continuación.
En cualquier caso, ambos escenarios mantendrían a BTC dentro del rango por ahora, ya que espero que el movimiento más decisivo llegue la próxima semana. #Análisis del precio de BTC# #Perspectivas macroeconómicas#
$BTC Si más tarde hoy tenemos algo de volatilidad, veo posibles estos dos escenarios.
Como el precio está volviendo a probar los máximos del rango, podríamos ver un rechazo por esta zona que
haga que el precio vuelva hacia el mínimo del viernes. Aquí podríamos ver una posible barrida seguida de otro rebote.
El otro escenario posible es que BTC siga subiendo primero hasta la zona de los $86k para llenar el 50 % de la mecha de la que he estado hablando, antes de posiblemente volver a girar a la baja.
Ambos escenarios podrían ofrecer buenas oportunidades para hacer scalping.
Una subida hasta la zona de los $86k podría preparar una buena entrada en corto si vemos un rechazo claro allí. Sin embargo, sigue siendo muy posible que haya una barrida de los máximos triples en torno a los $87k, así que aquí sería importante colocar bien el stop.
Si, por otro lado, el precio barre el mínimo del viernes y lo recupera de inmediato, podría darse una operación en largo de continuación.
En cualquier caso, ambos escenarios mantendrían a BTC dentro del rango por ahora, ya que espero que el movimiento más decisivo llegue la próxima semana. #Análisis del precio de BTC# #Perspectivas macroeconómicas#
Como el precio está volviendo a probar los máximos del rango, podríamos ver un rechazo por esta zona que
haga que el precio vuelva hacia el mínimo del viernes. Aquí podríamos ver una posible barrida seguida de otro rebote.
El otro escenario posible es que BTC siga subiendo primero hasta la zona de los $86k para llenar el 50 % de la mecha de la que he estado hablando, antes de posiblemente volver a girar a la baja.
Ambos escenarios podrían ofrecer buenas oportunidades para hacer scalping.
Una subida hasta la zona de los $86k podría preparar una buena entrada en corto si vemos un rechazo claro allí. Sin embargo, sigue siendo muy posible que haya una barrida de los máximos triples en torno a los $87k, así que aquí sería importante colocar bien el stop.
Si, por otro lado, el precio barre el mínimo del viernes y lo recupera de inmediato, podría darse una operación en largo de continuación.
En cualquier caso, ambos escenarios mantendrían a BTC dentro del rango por ahora, ya que espero que el movimiento más decisivo llegue la próxima semana. #Análisis del precio de BTC# #Perspectivas macroeconómicas#
65
·
--
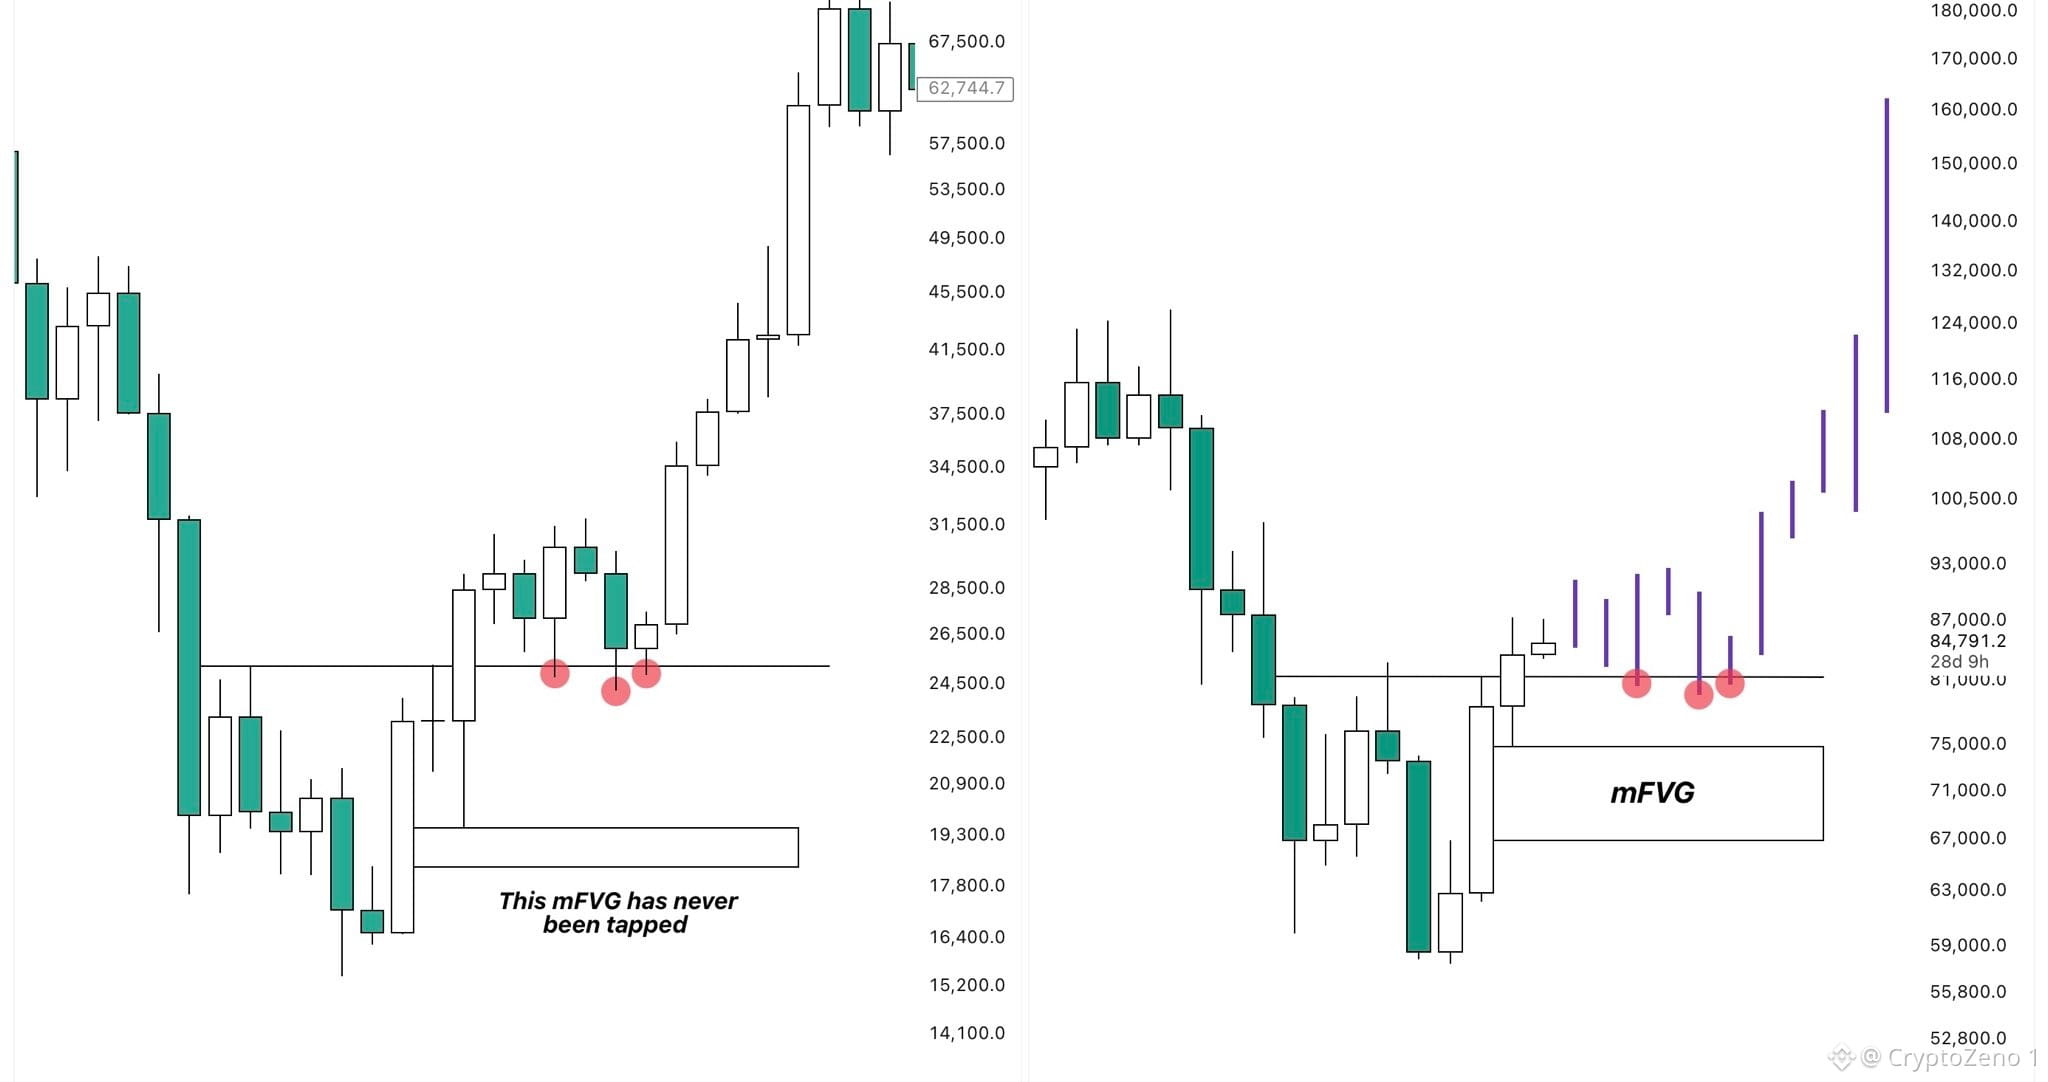
$BTC Aquí tienes un escenario que deberías considerar definitivamente si no quieres quedarte al margen del próximo gran movimiento.
Acabo de terminar de comparar la estructura de mínimos de 2023 con la actual y noté algo muy interesante.
Muchas personas están hablando actualmente sobre el FVG en el marco temporal mensual y cómo es probable que el precio vuelva a tocarlo antes de que comience la próxima gran expansión al alza.
Aunque estoy de acuerdo en que este sería el mejor posible escenario para nosotros, ya que nos daría otra oportunidad de compra absolutamente perfecta, no necesariamente lo consideraría el resultado más probable.
Durante el proceso de formación de mínimos en 2023, también vimos un movimiento explosivo al alza con el que el precio rompió la zona de consolidación de los mínimos. Esto dejó atrás un FVG también, aunque era comparativamente más pequeño.
En lugar de volver a tocar esa zona, BTC retestó los máximos del rango anterior, se consolidó allí durante un tiempo y luego simplemente despegó.
Considerando lo similares que se ven ambas estructuras, creo que hay una posibilidad razonable de que este ciclo se desarrolle de una manera parecida.
Por eso, cualquier desviación por debajo de los mínimos del rango actual es una oportunidad de compra para mí. Aprovecharé estas oportunidades para posicionarme aún mejor para la próxima subida, y si en realidad llegamos a retestar el mFVG, con gusto aprovecharé esa ocasión para comprar aún más. #BTC Price Analysis# #Macro Insights# #Altcoin Season#
$BTC Aquí tienes un escenario que deberías considerar definitivamente si no quieres quedarte al margen del próximo gran movimiento.
Acabo de terminar de comparar la estructura de mínimos de 2023 con la actual y noté algo muy interesante.
Muchas personas están hablando actualmente sobre el FVG en el marco temporal mensual y cómo es probable que el precio vuelva a tocarlo antes de que comience la próxima gran expansión al alza.
Aunque estoy de acuerdo en que este sería el mejor posible escenario para nosotros, ya que nos daría otra oportunidad de compra absolutamente perfecta, no necesariamente lo consideraría el resultado más probable.
Durante el proceso de formación de mínimos en 2023, también vimos un movimiento explosivo al alza con el que el precio rompió la zona de consolidación de los mínimos. Esto dejó atrás un FVG también, aunque era comparativamente más pequeño.
En lugar de volver a tocar esa zona, BTC retestó los máximos del rango anterior, se consolidó allí durante un tiempo y luego simplemente despegó.
Considerando lo similares que se ven ambas estructuras, creo que hay una posibilidad razonable de que este ciclo se desarrolle de una manera parecida.
Por eso, cualquier desviación por debajo de los mínimos del rango actual es una oportunidad de compra para mí. Aprovecharé estas oportunidades para posicionarme aún mejor para la próxima subida, y si en realidad llegamos a retestar el mFVG, con gusto aprovecharé esa ocasión para comprar aún más. #BTC Price Analysis# #Macro Insights# #Altcoin Season#
Acabo de terminar de comparar la estructura de mínimos de 2023 con la actual y noté algo muy interesante.
Muchas personas están hablando actualmente sobre el FVG en el marco temporal mensual y cómo es probable que el precio vuelva a tocarlo antes de que comience la próxima gran expansión al alza.
Aunque estoy de acuerdo en que este sería el mejor posible escenario para nosotros, ya que nos daría otra oportunidad de compra absolutamente perfecta, no necesariamente lo consideraría el resultado más probable.
Durante el proceso de formación de mínimos en 2023, también vimos un movimiento explosivo al alza con el que el precio rompió la zona de consolidación de los mínimos. Esto dejó atrás un FVG también, aunque era comparativamente más pequeño.
En lugar de volver a tocar esa zona, BTC retestó los máximos del rango anterior, se consolidó allí durante un tiempo y luego simplemente despegó.
Considerando lo similares que se ven ambas estructuras, creo que hay una posibilidad razonable de que este ciclo se desarrolle de una manera parecida.
Por eso, cualquier desviación por debajo de los mínimos del rango actual es una oportunidad de compra para mí. Aprovecharé estas oportunidades para posicionarme aún mejor para la próxima subida, y si en realidad llegamos a retestar el mFVG, con gusto aprovecharé esa ocasión para comprar aún más. #BTC Price Analysis# #Macro Insights# #Altcoin Season#
73
·
--
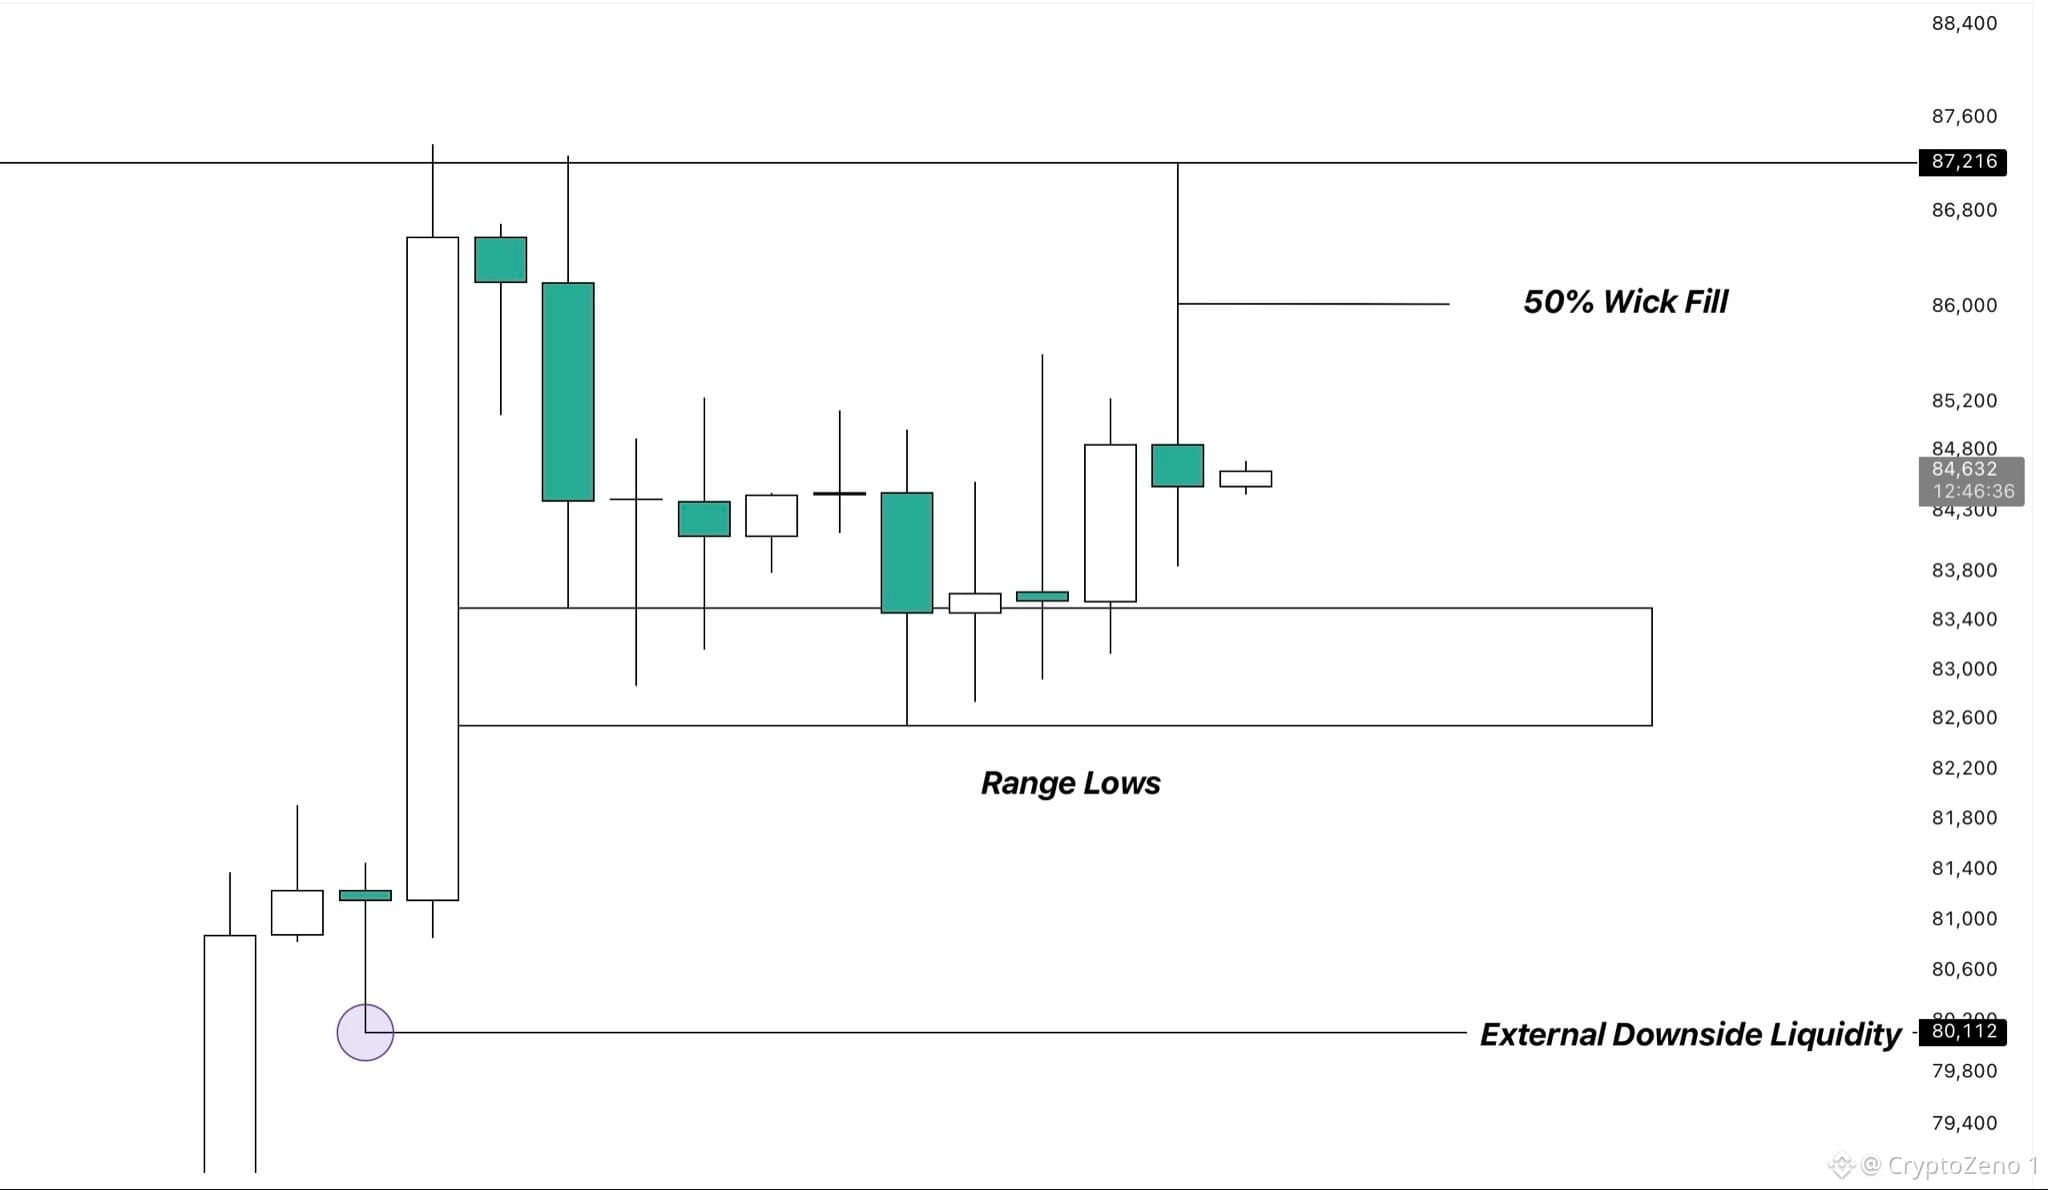
$BTC La vela diaria de ayer dejó una mecha bastante grande hacia arriba.
Cada vez que BTC imprime una mecha así, a menudo tiende a rellenarse al menos en un 50%, ya que movimientos tan violentos suelen dejar mucha liquidez detrás, que el precio luego vuelve para barrer.
Por lo tanto, creo que es probable que el precio vuelva a probar los máximos del rango una vez más antes de potencialmente continuar más abajo hacia los mínimos del rango.
Desde allí, podríamos ver una desviación corta por debajo de esos mínimos, seguida de un rápido reajuste mientras el precio continúa su
tendencia alcista más amplia.
Sin embargo, creo que es más probable que primero sigamos moviéndonos en rango durante un poco más, generando más liquidez en ambos lados antes de que eso ocurra.
Después de todo, el precio solo se ha estado consolidando entre $83k y $87k durante aproximadamente dos semanas ahora, mientras que rangos como este pueden persistir fácilmente durante varias semanas antes de que finalmente obtengamos una ruptura confirmada. #BTC Price Analysis# #Macro Insights#
$BTC La vela diaria de ayer dejó una mecha bastante grande hacia arriba.
Cada vez que BTC imprime una mecha así, a menudo tiende a rellenarse al menos en un 50%, ya que movimientos tan violentos suelen dejar mucha liquidez detrás, que el precio luego vuelve para barrer.
Por lo tanto, creo que es probable que el precio vuelva a probar los máximos del rango una vez más antes de potencialmente continuar más abajo hacia los mínimos del rango.
Desde allí, podríamos ver una desviación corta por debajo de esos mínimos, seguida de un rápido reajuste mientras el precio continúa su
tendencia alcista más amplia.
Sin embargo, creo que es más probable que primero sigamos moviéndonos en rango durante un poco más, generando más liquidez en ambos lados antes de que eso ocurra.
Después de todo, el precio solo se ha estado consolidando entre $83k y $87k durante aproximadamente dos semanas ahora, mientras que rangos como este pueden persistir fácilmente durante varias semanas antes de que finalmente obtengamos una ruptura confirmada. #BTC Price Analysis# #Macro Insights#
Cada vez que BTC imprime una mecha así, a menudo tiende a rellenarse al menos en un 50%, ya que movimientos tan violentos suelen dejar mucha liquidez detrás, que el precio luego vuelve para barrer.
Por lo tanto, creo que es probable que el precio vuelva a probar los máximos del rango una vez más antes de potencialmente continuar más abajo hacia los mínimos del rango.
Desde allí, podríamos ver una desviación corta por debajo de esos mínimos, seguida de un rápido reajuste mientras el precio continúa su
tendencia alcista más amplia.
Sin embargo, creo que es más probable que primero sigamos moviéndonos en rango durante un poco más, generando más liquidez en ambos lados antes de que eso ocurra.
Después de todo, el precio solo se ha estado consolidando entre $83k y $87k durante aproximadamente dos semanas ahora, mientras que rangos como este pueden persistir fácilmente durante varias semanas antes de que finalmente obtengamos una ruptura confirmada. #BTC Price Analysis# #Macro Insights#
70
·
--
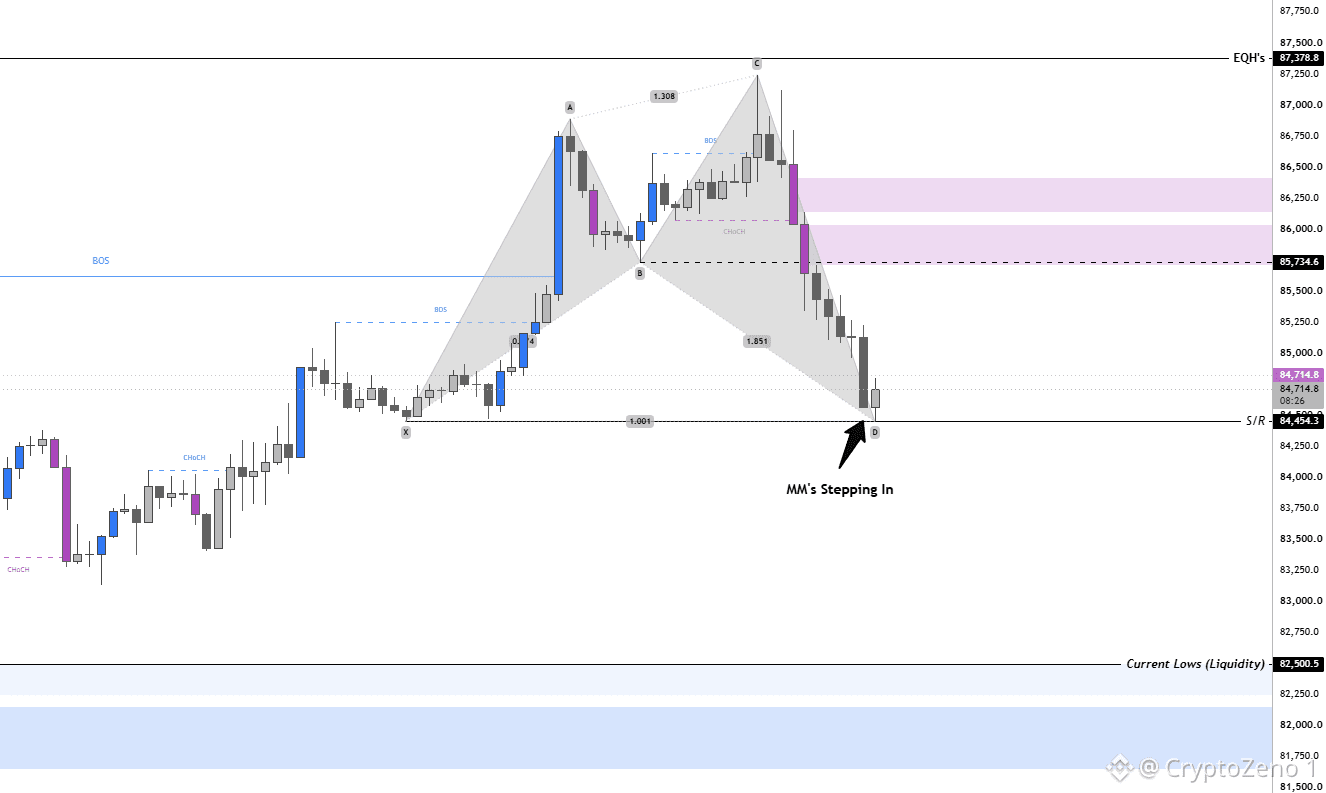
$BTC Frenamos/adelantamos la corrida de los EQH a 87.3k y luego vimos 9 velas bajistas seguidas en 30M.
Esto muestra que los MM tomaron el volante y se adelantaron a los máximos para poder eliminar a los que se quedaron tarde en el long y perseguían este pump antes.
Ahora, la razón por la que este movimiento a la baja es un sacudón (shakeout) es simplemente porque no hubo acción alcista durante toda la caída.
Una caída directa del 3% sin darles ninguna oportunidad a los alcistas de tomar el control.
Obviamente, esto significa que la liquidez/el desbalance no se ha acumulado hacia el lado alcista, ya que no se apuntó a ningún short durante esta caída.
Ahora, vimos que la última vela de 30M cerró como un fondo “afeitado” (shaved bottom), representando la entrada nuevamente de Smart Money, por eso la vela actual está cerrando en verde.
Los MM van a empujar el precio más arriba desde aquí simplemente porque fabricaron más liquidez hacia el alza durante esta caída.
Es más que probable que haya un retest de 85.7k si seguimos manteniendo 84.4k.
Si logramos recuperar 85.7k, entonces esta liquidez les va a ayudar a empujar el precio de vuelta hacia los EQH que quedaron sin tomar.
Los MM no solo cazan liquidez; también la fabrican. #BTC Price Analysis# #Macro Insights#
$BTC Frenamos/adelantamos la corrida de los EQH a 87.3k y luego vimos 9 velas bajistas seguidas en 30M.
Esto muestra que los MM tomaron el volante y se adelantaron a los máximos para poder eliminar a los que se quedaron tarde en el long y perseguían este pump antes.
Ahora, la razón por la que este movimiento a la baja es un sacudón (shakeout) es simplemente porque no hubo acción alcista durante toda la caída.
Una caída directa del 3% sin darles ninguna oportunidad a los alcistas de tomar el control.
Obviamente, esto significa que la liquidez/el desbalance no se ha acumulado hacia el lado alcista, ya que no se apuntó a ningún short durante esta caída.
Ahora, vimos que la última vela de 30M cerró como un fondo “afeitado” (shaved bottom), representando la entrada nuevamente de Smart Money, por eso la vela actual está cerrando en verde.
Los MM van a empujar el precio más arriba desde aquí simplemente porque fabricaron más liquidez hacia el alza durante esta caída.
Es más que probable que haya un retest de 85.7k si seguimos manteniendo 84.4k.
Si logramos recuperar 85.7k, entonces esta liquidez les va a ayudar a empujar el precio de vuelta hacia los EQH que quedaron sin tomar.
Los MM no solo cazan liquidez; también la fabrican. #BTC Price Analysis# #Macro Insights#
Esto muestra que los MM tomaron el volante y se adelantaron a los máximos para poder eliminar a los que se quedaron tarde en el long y perseguían este pump antes.
Ahora, la razón por la que este movimiento a la baja es un sacudón (shakeout) es simplemente porque no hubo acción alcista durante toda la caída.
Una caída directa del 3% sin darles ninguna oportunidad a los alcistas de tomar el control.
Obviamente, esto significa que la liquidez/el desbalance no se ha acumulado hacia el lado alcista, ya que no se apuntó a ningún short durante esta caída.
Ahora, vimos que la última vela de 30M cerró como un fondo “afeitado” (shaved bottom), representando la entrada nuevamente de Smart Money, por eso la vela actual está cerrando en verde.
Los MM van a empujar el precio más arriba desde aquí simplemente porque fabricaron más liquidez hacia el alza durante esta caída.
Es más que probable que haya un retest de 85.7k si seguimos manteniendo 84.4k.
Si logramos recuperar 85.7k, entonces esta liquidez les va a ayudar a empujar el precio de vuelta hacia los EQH que quedaron sin tomar.
Los MM no solo cazan liquidez; también la fabrican. #BTC Price Analysis# #Macro Insights#
40
·
--
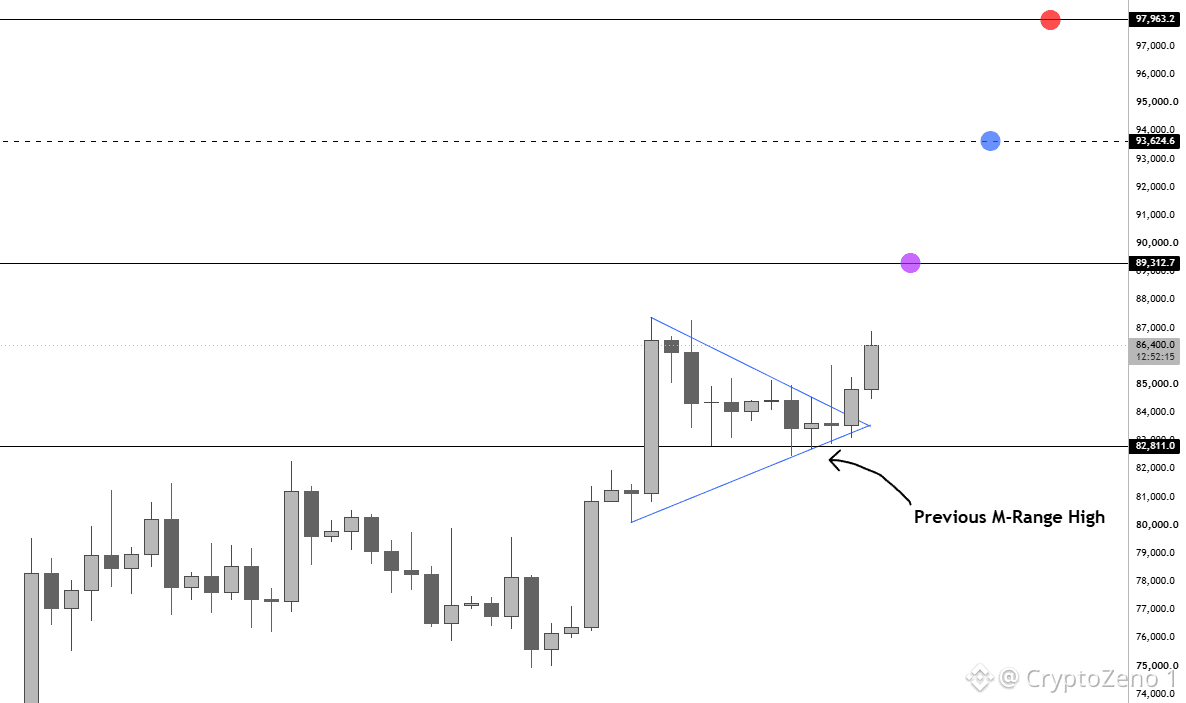
$BTC Ruptura de Pennant + Rebotó desde la M-High anterior.
El nuevo mes acaba de empezar y ya estamos empujando al alza justo al inicio del mes.
Ahora normalmente, el primer movimiento después de que comienza un mes nuevo es uno falso: para fabricar liquidez y atrapar al retail antes de revertir.
Si ese es el caso aquí, entonces deberíamos ver un rechazo después del barrido de la zona de máximos locales actuales (87.5K-89.3K).
Ese rechazo validaría un retroceso para romper los mínimos del rango actual antes de volver a empujar al alza.
Sin embargo, dado que también salimos de un pennant, hay también la posibilidad de que se desarrolle un movimiento completo medido de ruptura hacia la zona de 93.6K antes de la reversión.
La tendencia es alcista, y es mucho más rentable hacer long en cada retroceso que intentar hacer short a un pico pequeño y captar un retroceso reducido.
Mi tesis actual es que veremos un empuje hacia la zona 93.6K-97.9K en las próximas 2 semanas antes de entrar en un rango prolongado, que probablemente se extienda hasta el próximo año, antes de la siguiente pierna al alza.
Seré un poco cuidadoso con los shorts, pero una vez que lleguemos a las zonas de 90K, empezaré a inclinarme hacia abrir hedge shorts, asegurando ganancias de los longs, y luego recargar esos longs nuevamente en el retroceso. #BTC Price Analysis# #Macro Insights#
$BTC Ruptura de Pennant + Rebotó desde la M-High anterior.
El nuevo mes acaba de empezar y ya estamos empujando al alza justo al inicio del mes.
Ahora normalmente, el primer movimiento después de que comienza un mes nuevo es uno falso: para fabricar liquidez y atrapar al retail antes de revertir.
Si ese es el caso aquí, entonces deberíamos ver un rechazo después del barrido de la zona de máximos locales actuales (87.5K-89.3K).
Ese rechazo validaría un retroceso para romper los mínimos del rango actual antes de volver a empujar al alza.
Sin embargo, dado que también salimos de un pennant, hay también la posibilidad de que se desarrolle un movimiento completo medido de ruptura hacia la zona de 93.6K antes de la reversión.
La tendencia es alcista, y es mucho más rentable hacer long en cada retroceso que intentar hacer short a un pico pequeño y captar un retroceso reducido.
Mi tesis actual es que veremos un empuje hacia la zona 93.6K-97.9K en las próximas 2 semanas antes de entrar en un rango prolongado, que probablemente se extienda hasta el próximo año, antes de la siguiente pierna al alza.
Seré un poco cuidadoso con los shorts, pero una vez que lleguemos a las zonas de 90K, empezaré a inclinarme hacia abrir hedge shorts, asegurando ganancias de los longs, y luego recargar esos longs nuevamente en el retroceso. #BTC Price Analysis# #Macro Insights#
El nuevo mes acaba de empezar y ya estamos empujando al alza justo al inicio del mes.
Ahora normalmente, el primer movimiento después de que comienza un mes nuevo es uno falso: para fabricar liquidez y atrapar al retail antes de revertir.
Si ese es el caso aquí, entonces deberíamos ver un rechazo después del barrido de la zona de máximos locales actuales (87.5K-89.3K).
Ese rechazo validaría un retroceso para romper los mínimos del rango actual antes de volver a empujar al alza.
Sin embargo, dado que también salimos de un pennant, hay también la posibilidad de que se desarrolle un movimiento completo medido de ruptura hacia la zona de 93.6K antes de la reversión.
La tendencia es alcista, y es mucho más rentable hacer long en cada retroceso que intentar hacer short a un pico pequeño y captar un retroceso reducido.
Mi tesis actual es que veremos un empuje hacia la zona 93.6K-97.9K en las próximas 2 semanas antes de entrar en un rango prolongado, que probablemente se extienda hasta el próximo año, antes de la siguiente pierna al alza.
Seré un poco cuidadoso con los shorts, pero una vez que lleguemos a las zonas de 90K, empezaré a inclinarme hacia abrir hedge shorts, asegurando ganancias de los longs, y luego recargar esos longs nuevamente en el retroceso. #BTC Price Analysis# #Macro Insights#
56
·
--
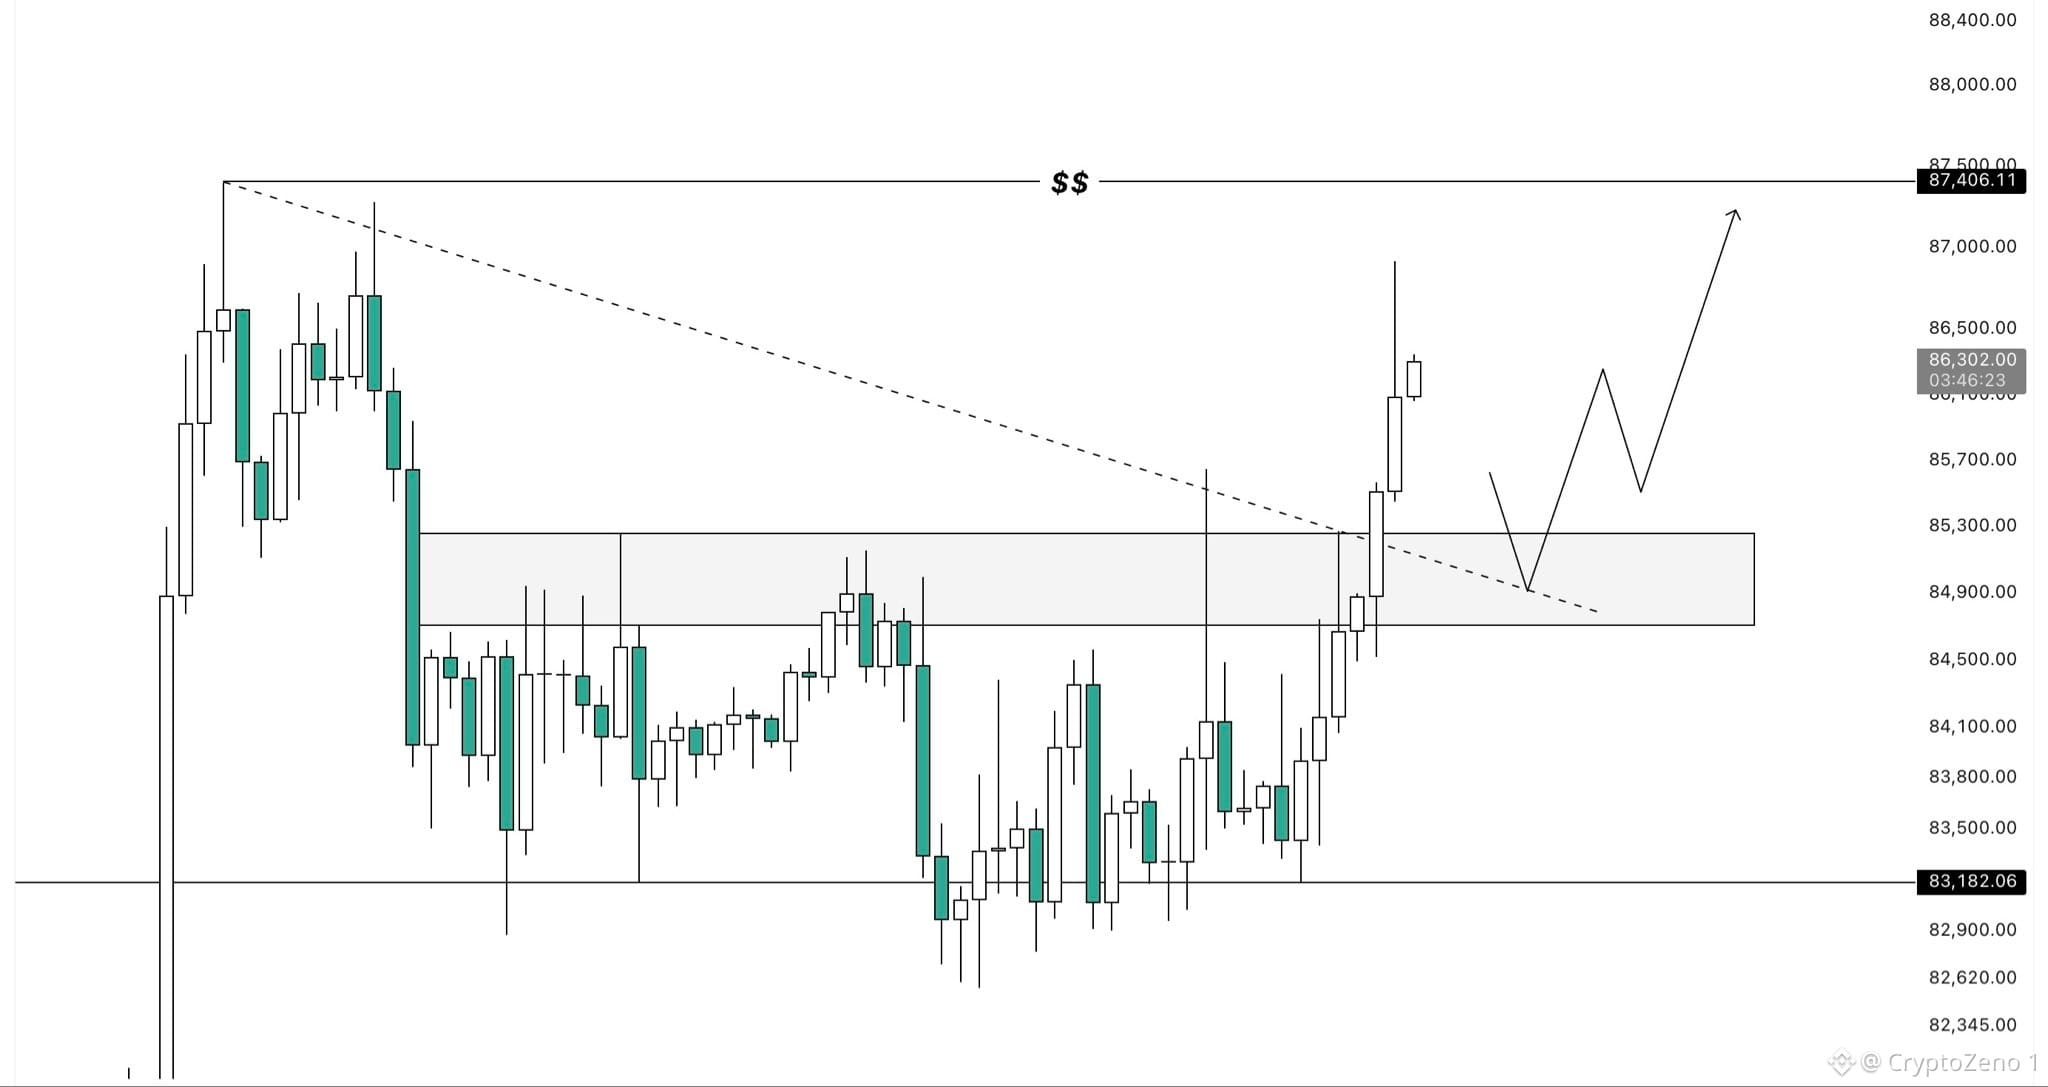
$BTC Estaba equivocado. Considerando que el BTC todavía estaba operando dentro de un rango y que el precio se estaba acercando tanto a los máximos del rango como a la línea de tendencia descendente, esperaba otra rechaz.
En cambio, el precio rompió esa zona con impulso y continuó hasta $86.9k.
A pesar de ese movimiento, los máximos alrededor de $87.3k siguen sin haberse barrido y el grupo de liquidez por encima aún no se ha tocado.
Eso deja dos posibles escenarios desde aquí. O bien el BTC continúa más arriba directamente para barrer esos máximos, o primero vemos un retroceso hacia los máximos del rango antes de otro movimiento al alza.
De cualquier manera, todavía espero que esos máximos sean tomados pronto. #Análisis del precio de BTC# #Perspectivas macro#
$BTC Estaba equivocado. Considerando que el BTC todavía estaba operando dentro de un rango y que el precio se estaba acercando tanto a los máximos del rango como a la línea de tendencia descendente, esperaba otra rechaz.
En cambio, el precio rompió esa zona con impulso y continuó hasta $86.9k.
A pesar de ese movimiento, los máximos alrededor de $87.3k siguen sin haberse barrido y el grupo de liquidez por encima aún no se ha tocado.
Eso deja dos posibles escenarios desde aquí. O bien el BTC continúa más arriba directamente para barrer esos máximos, o primero vemos un retroceso hacia los máximos del rango antes de otro movimiento al alza.
De cualquier manera, todavía espero que esos máximos sean tomados pronto. #Análisis del precio de BTC# #Perspectivas macro#
En cambio, el precio rompió esa zona con impulso y continuó hasta $86.9k.
A pesar de ese movimiento, los máximos alrededor de $87.3k siguen sin haberse barrido y el grupo de liquidez por encima aún no se ha tocado.
Eso deja dos posibles escenarios desde aquí. O bien el BTC continúa más arriba directamente para barrer esos máximos, o primero vemos un retroceso hacia los máximos del rango antes de otro movimiento al alza.
De cualquier manera, todavía espero que esos máximos sean tomados pronto. #Análisis del precio de BTC# #Perspectivas macro#
68
·
--
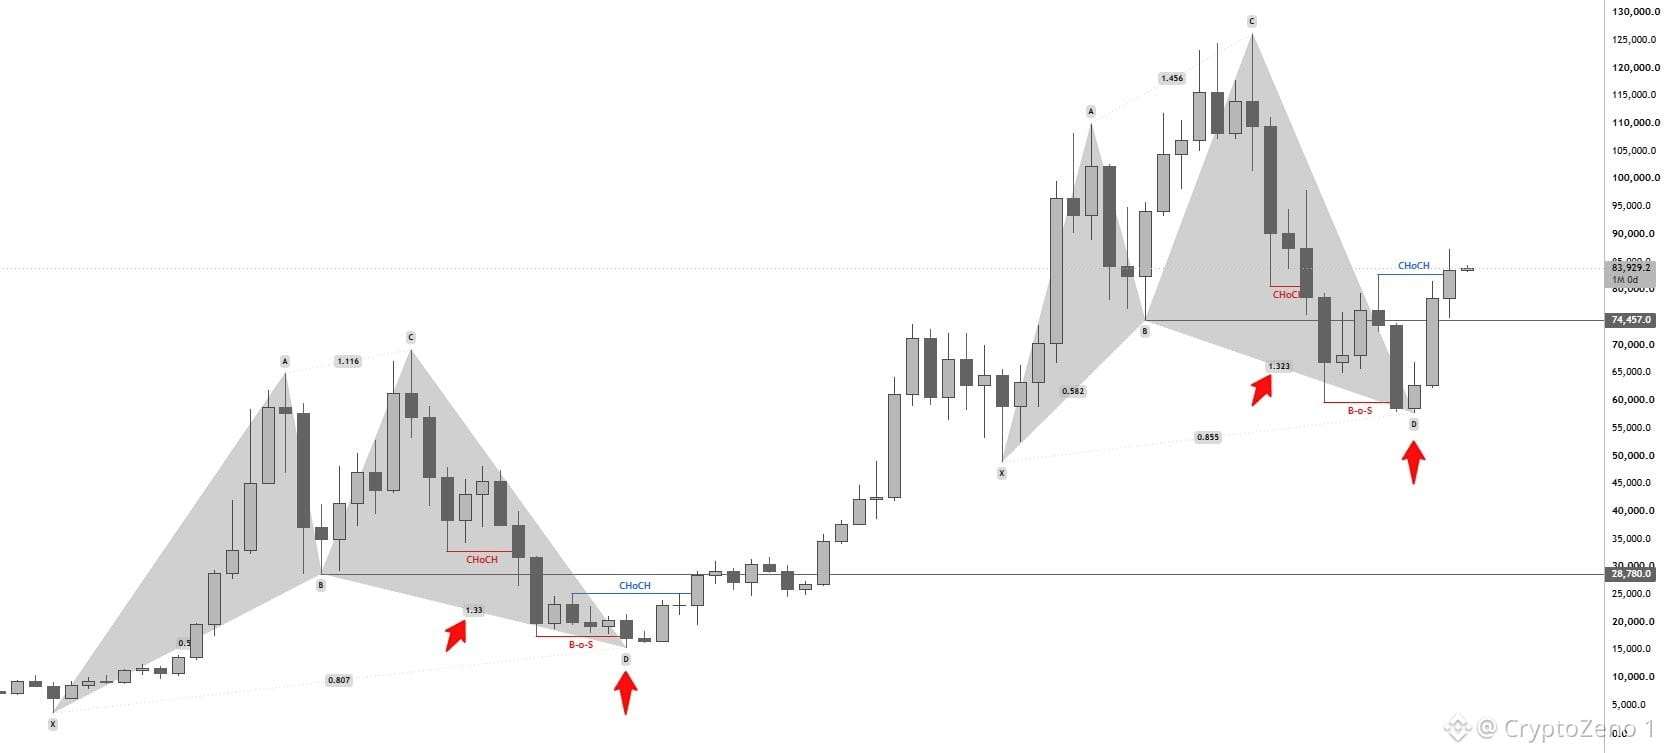
$BTC Era solo cuestión de tiempo...
El CHoCH Mensual está EN & La Tendencia es oficialmente Alcista en el Marco Temporal Mensual.
Lo llamé en LARGO antes de que sucediera.
Ahora es momento de montarlo. #BTC Price Analysis# #Macro Insights#
$BTC Era solo cuestión de tiempo...
El CHoCH Mensual está EN & La Tendencia es oficialmente Alcista en el Marco Temporal Mensual.
Lo llamé en LARGO antes de que sucediera.
Ahora es momento de montarlo. #BTC Price Analysis# #Macro Insights#
El CHoCH Mensual está EN & La Tendencia es oficialmente Alcista en el Marco Temporal Mensual.
Lo llamé en LARGO antes de que sucediera.
Ahora es momento de montarlo. #BTC Price Analysis# #Macro Insights#
74
·
--
Bitcoin está recuperando el impulso mientras los tenedores a largo plazo ajustan la oferta
$BTC
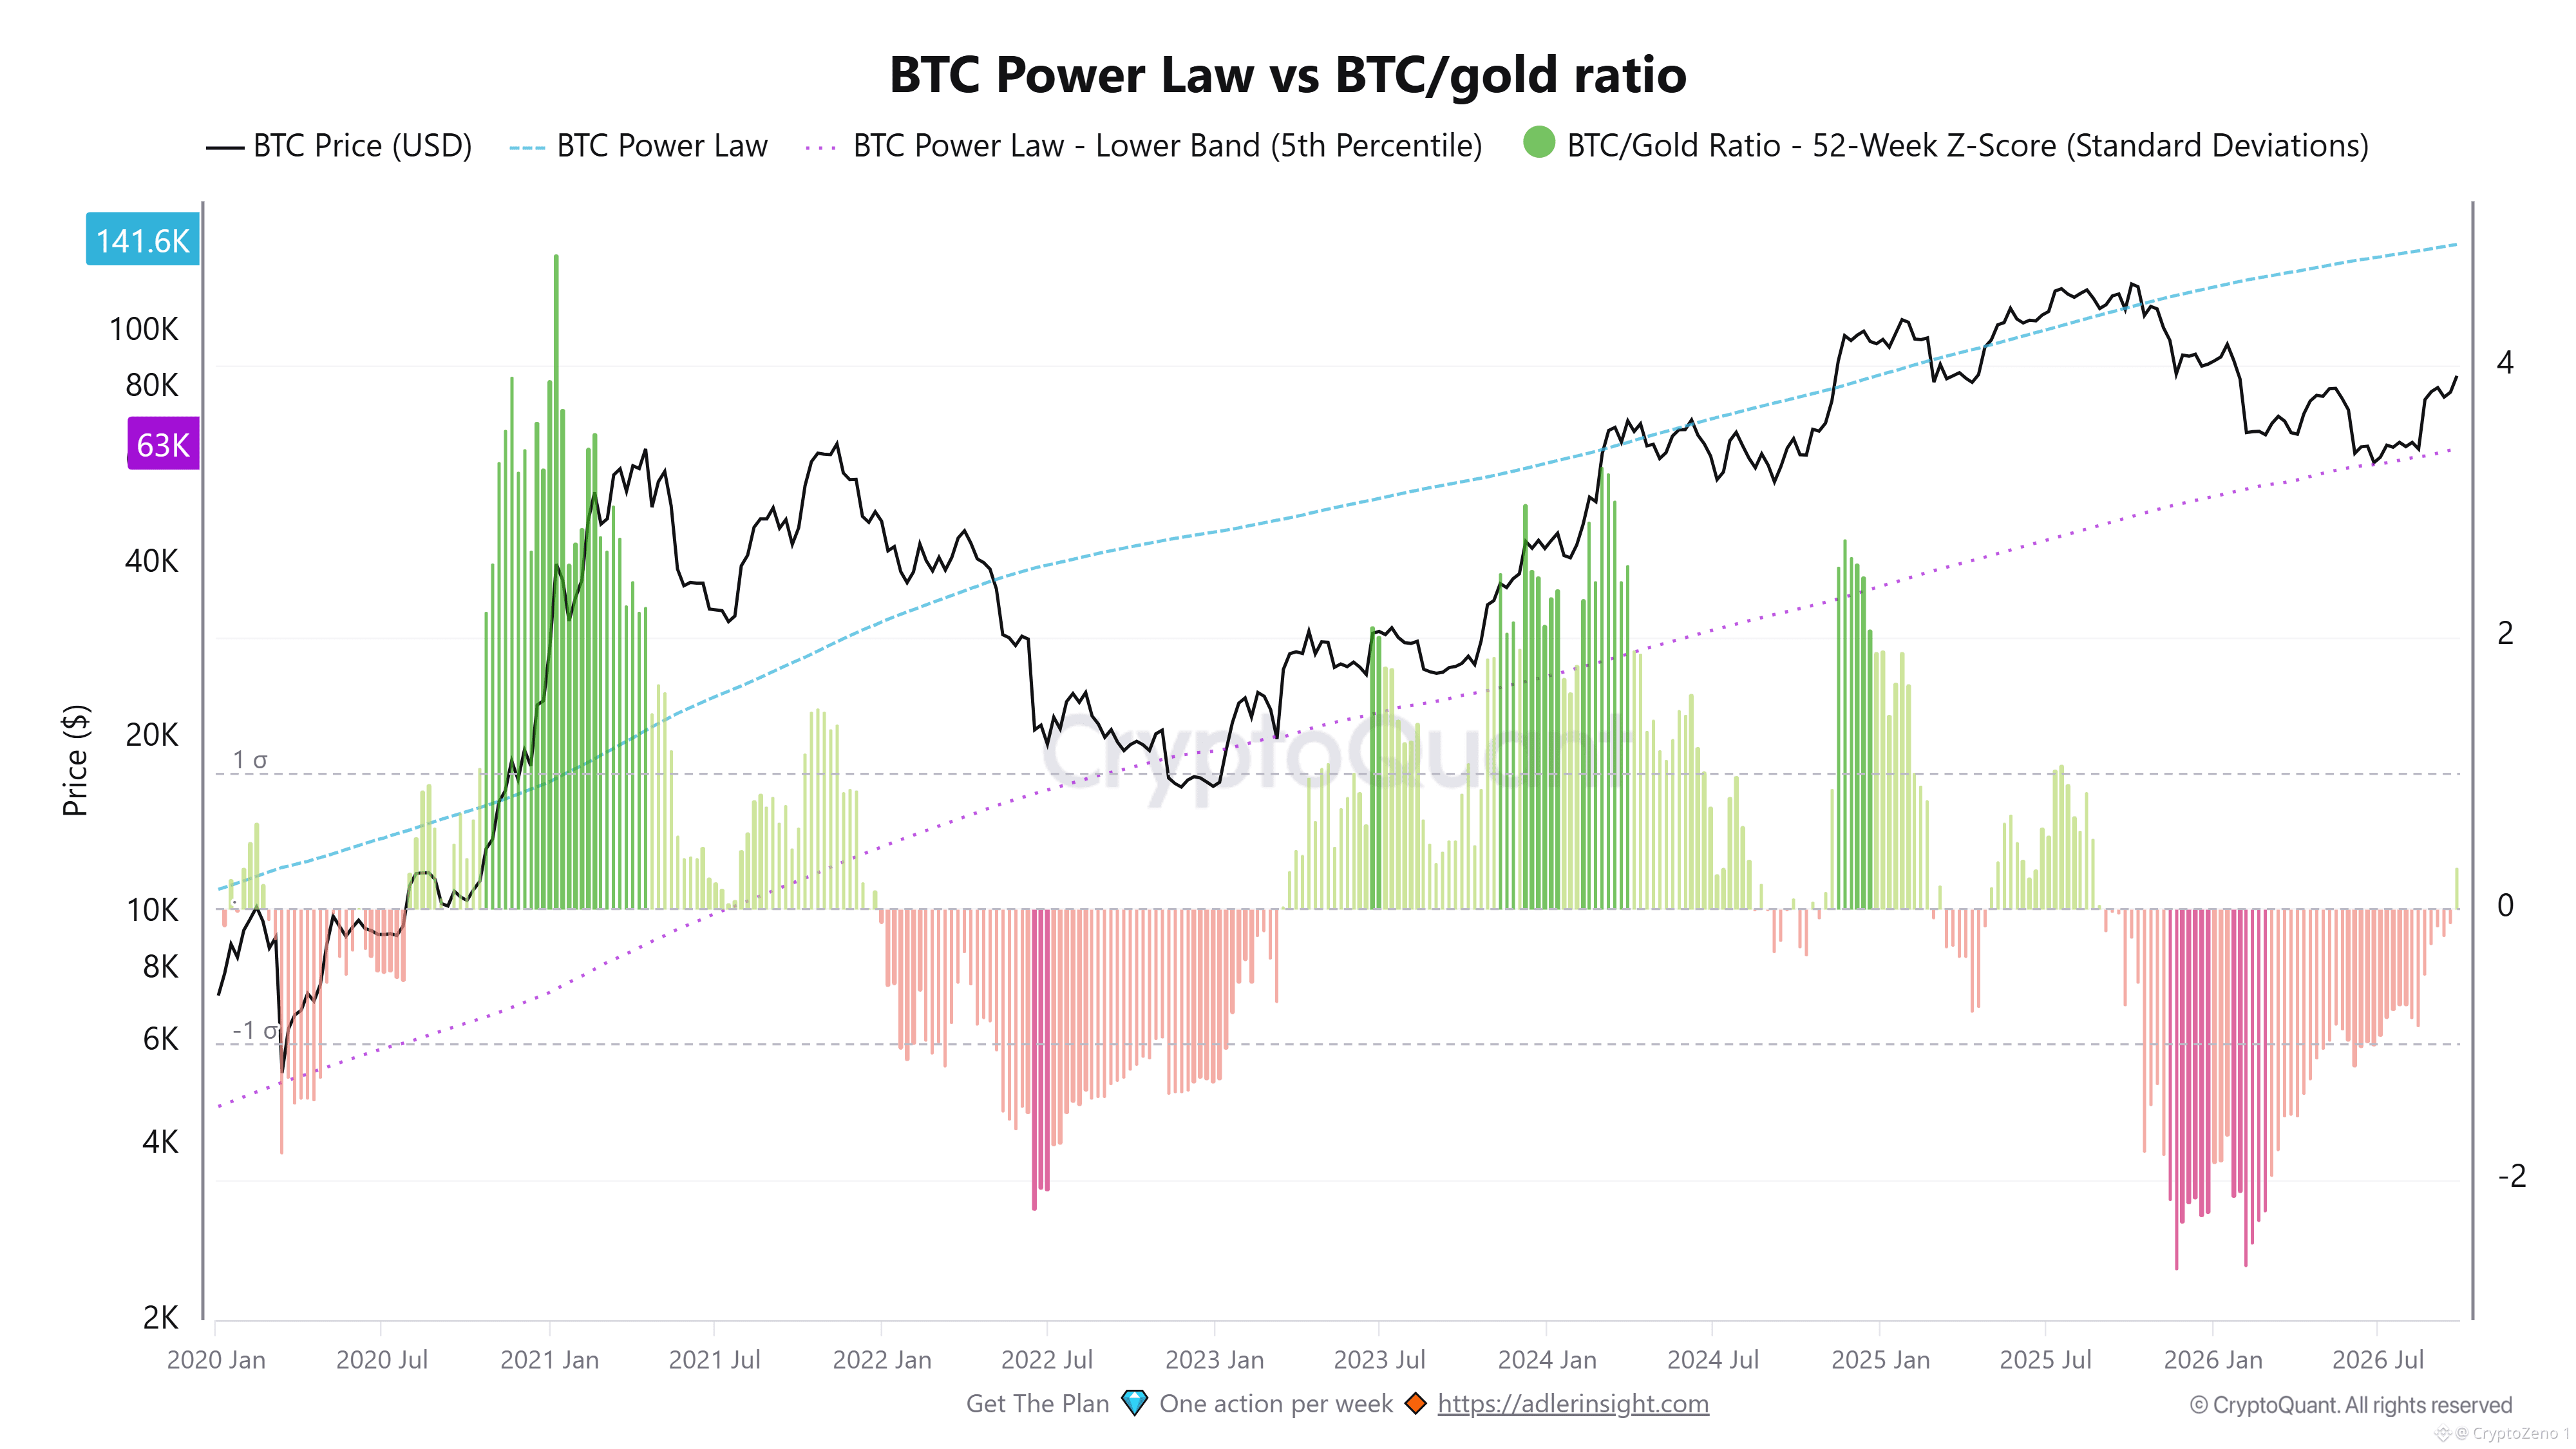
actualmente cotiza alrededor de $83K, todavía muy por encima de la banda inferior de la Power Law cerca de $63K, pero por debajo de la tendencia del modelo alrededor de $140K. Esto sitúa a BTC en una zona de valoración con soporte estructural, más que en un régimen de sobrevaloración extrema. El Z-Score BTC/Oro de 52 semanas también sigue profundamente deprimido después de un prolongado período negativo, lo que muestra que Bitcoin ha superado significativamente a oro en términos relativos a la baja y aún no ha regresado a extremos históricos.
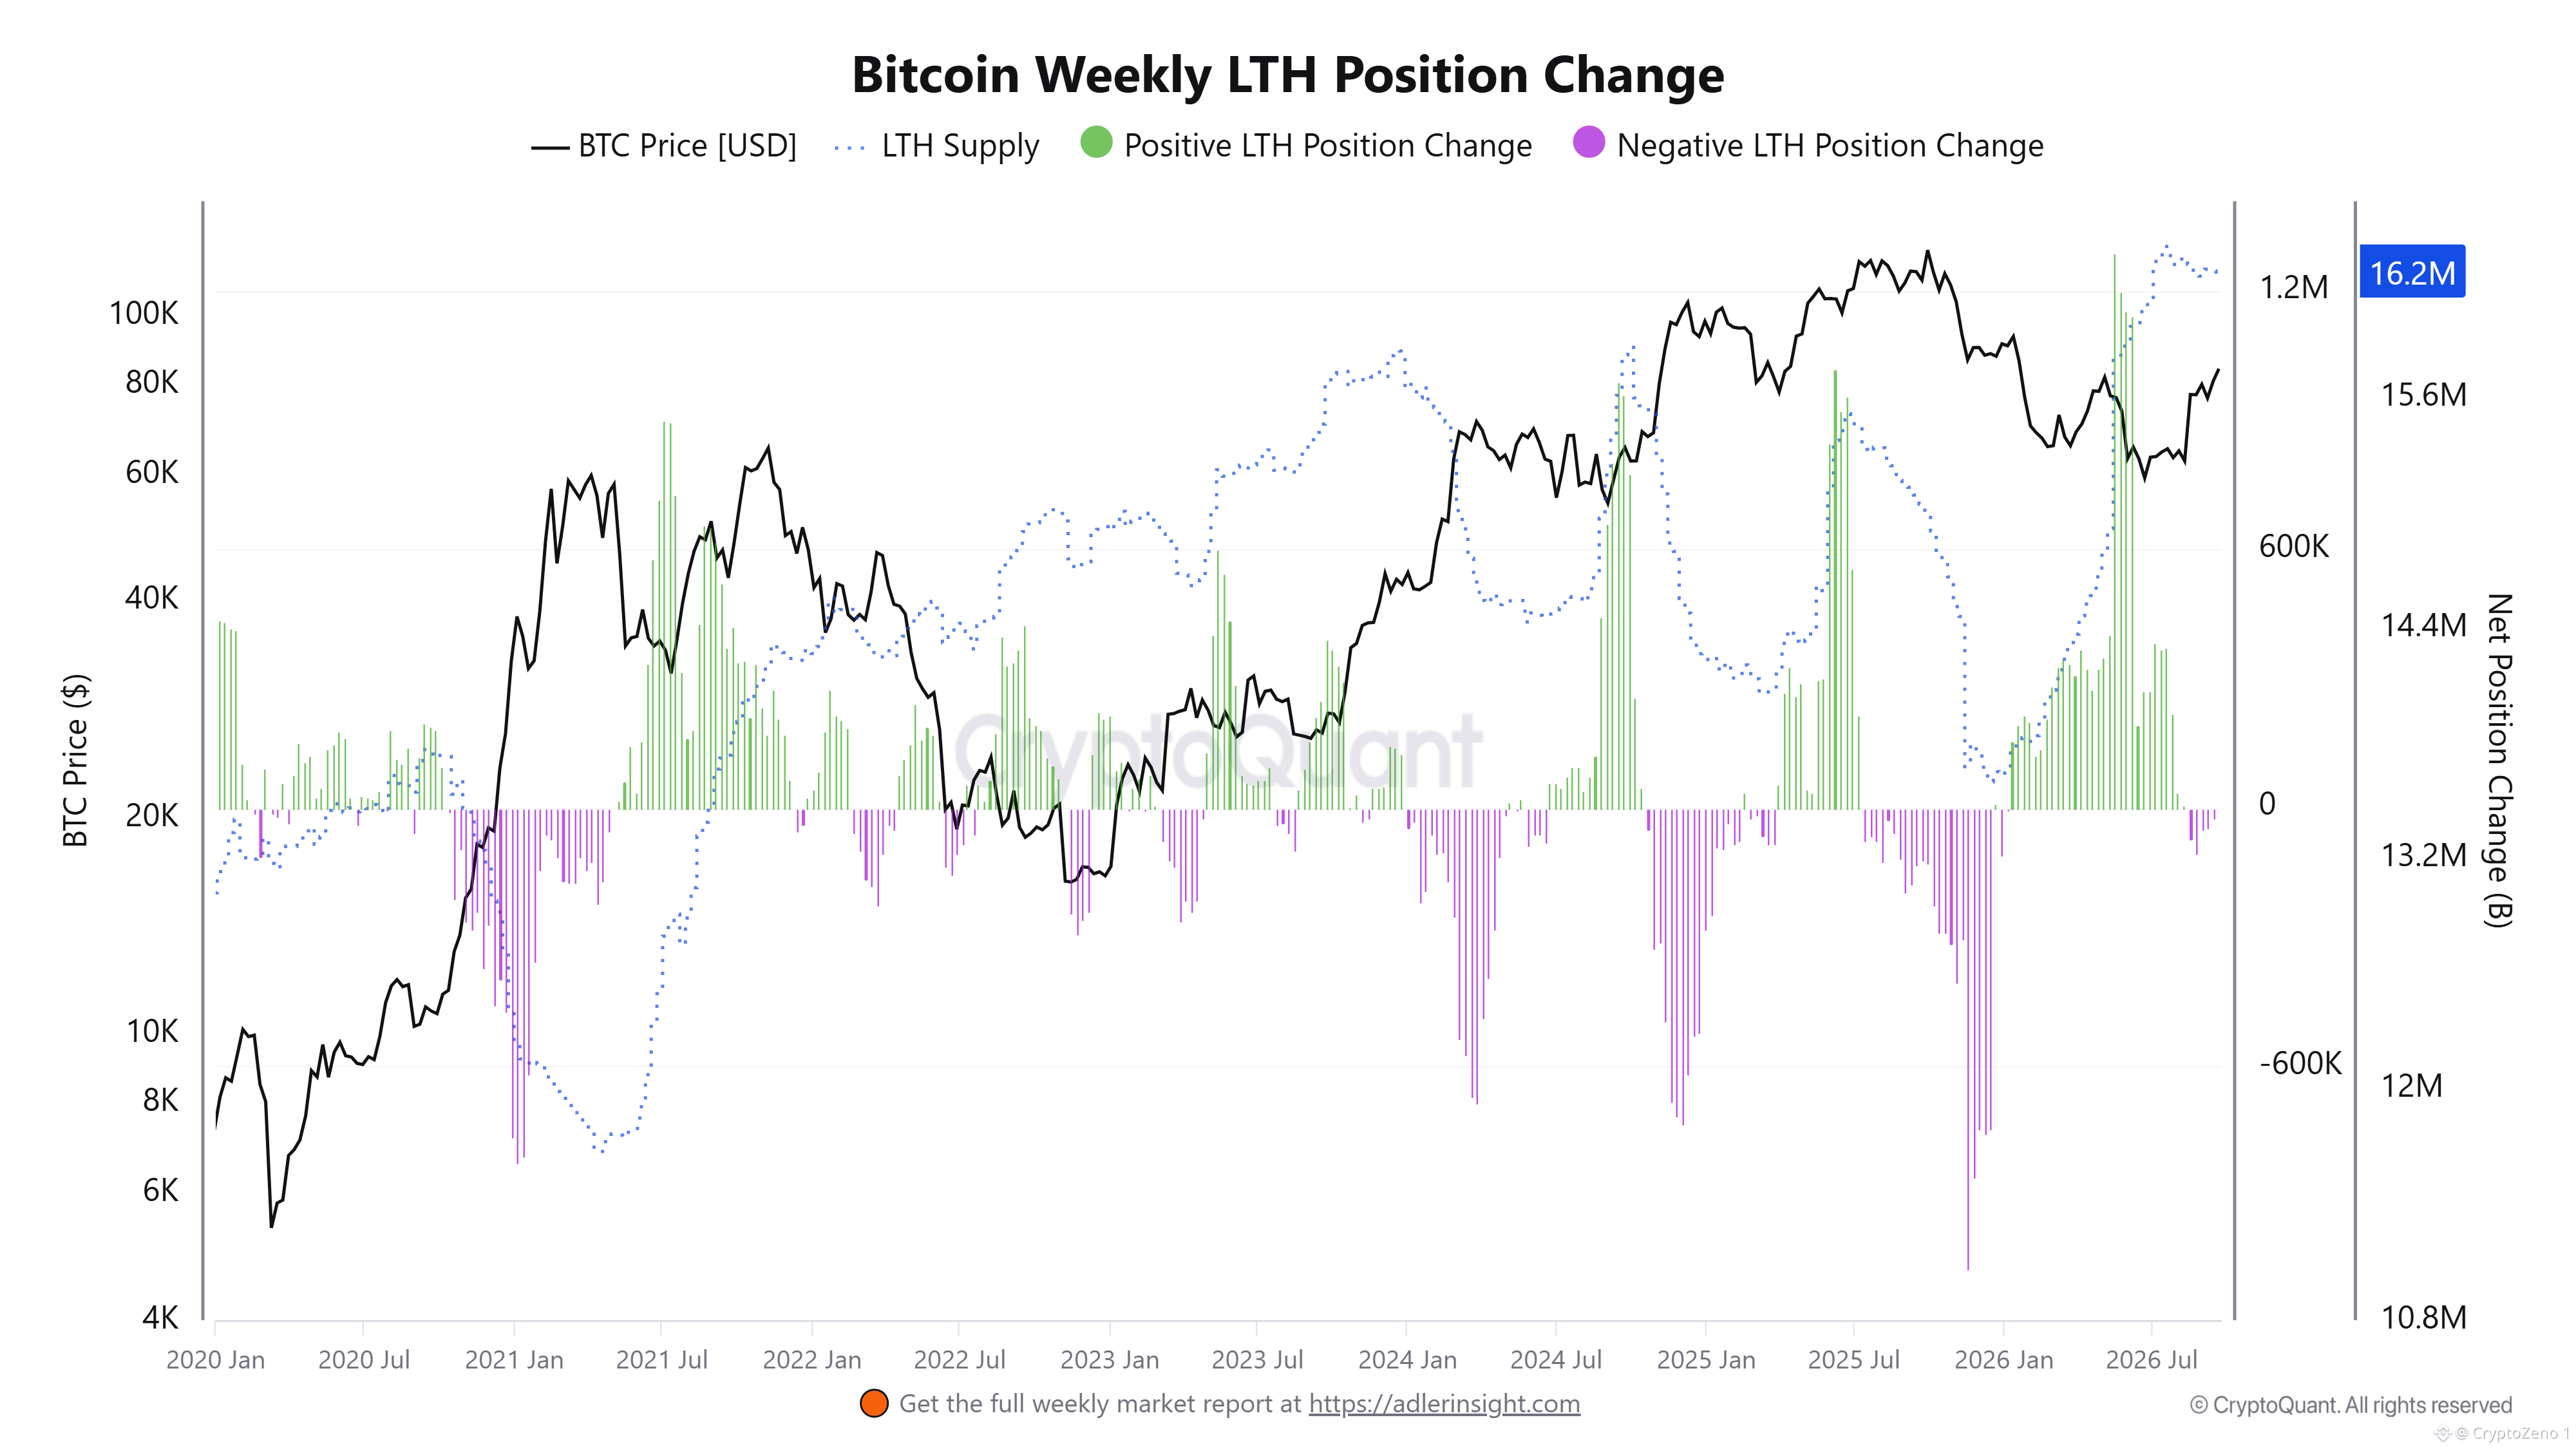
La señal más importante proviene del comportamiento de los tenedores a largo plazo. El Cambio de Posición de los LTH (Long-Term Holders) ha cambiado recientemente de forma marcadamente positiva, con varios picos grandes de acumulación que aparecen cuando BTC se recuperó de la zona de $60K. Al mismo tiempo, la oferta de los LTH ha subido hacia 16.2M BTC, lo que sugiere que las monedas se están moviendo cada vez más hacia tenencias de mayor duración, en lugar de distribuirse de manera constante en el mercado.
Esto crea una divergencia interesante entre la valoración relativa y la convicción on-chain. BTC sigue muy por debajo de su trayectoria de Power Law, mientras que la relación BTC/Oro aún está comprimida; sin embargo, los tenedores a largo plazo están ampliando su posición. Históricamente, los aumentos sostenidos en la oferta de LTH pueden reducir la oferta líquida disponible para una venta inmediata, creando una base más sólida cuando la demanda comienza a acelerarse.
La estructura clave a monitorear es si esta acumulación de LTH persiste mientras BTC se mantiene por encima de la banda inferior de la Power Law cerca de $63K. Una recuperación sostenida en la relación BTC/Oro junto con la continuación de la acumulación de LTH indicaría una mejora de la fortaleza relativa y condiciones de oferta más ajustadas. Hasta entonces, los datos apuntan a un mercado que se está recuperando de un período de debilidad relativa intensa, pero que aún no ha alcanzado el tipo de extremos de valoración típicamente asociados con el sobrecalentamiento de fin de ciclo. #BTC Price Analysis# #Macro Insights#
Bitcoin está recuperando el impulso mientras los tenedores a largo plazo ajustan la oferta
$BTC
actualmente cotiza alrededor de $83K, todavía muy por encima de la banda inferior de la Power Law cerca de $63K, pero por debajo de la tendencia del modelo alrededor de $140K. Esto sitúa a BTC en una zona de valoración con soporte estructural, más que en un régimen de sobrevaloración extrema. El Z-Score BTC/Oro de 52 semanas también sigue profundamente deprimido después de un prolongado período negativo, lo que muestra que Bitcoin ha superado significativamente a oro en términos relativos a la baja y aún no ha regresado a extremos históricos.
La señal más importante proviene del comportamiento de los tenedores a largo plazo. El Cambio de Posición de los LTH (Long-Term Holders) ha cambiado recientemente de forma marcadamente positiva, con varios picos grandes de acumulación que aparecen cuando BTC se recuperó de la zona de $60K. Al mismo tiempo, la oferta de los LTH ha subido hacia 16.2M BTC, lo que sugiere que las monedas se están moviendo cada vez más hacia tenencias de mayor duración, en lugar de distribuirse de manera constante en el mercado.
Esto crea una divergencia interesante entre la valoración relativa y la convicción on-chain. BTC sigue muy por debajo de su trayectoria de Power Law, mientras que la relación BTC/Oro aún está comprimida; sin embargo, los tenedores a largo plazo están ampliando su posición. Históricamente, los aumentos sostenidos en la oferta de LTH pueden reducir la oferta líquida disponible para una venta inmediata, creando una base más sólida cuando la demanda comienza a acelerarse.
La estructura clave a monitorear es si esta acumulación de LTH persiste mientras BTC se mantiene por encima de la banda inferior de la Power Law cerca de $63K. Una recuperación sostenida en la relación BTC/Oro junto con la continuación de la acumulación de LTH indicaría una mejora de la fortaleza relativa y condiciones de oferta más ajustadas. Hasta entonces, los datos apuntan a un mercado que se está recuperando de un período de debilidad relativa intensa, pero que aún no ha alcanzado el tipo de extremos de valoración típicamente asociados con el sobrecalentamiento de fin de ciclo. #BTC Price Analysis# #Macro Insights#
$BTC
actualmente cotiza alrededor de $83K, todavía muy por encima de la banda inferior de la Power Law cerca de $63K, pero por debajo de la tendencia del modelo alrededor de $140K. Esto sitúa a BTC en una zona de valoración con soporte estructural, más que en un régimen de sobrevaloración extrema. El Z-Score BTC/Oro de 52 semanas también sigue profundamente deprimido después de un prolongado período negativo, lo que muestra que Bitcoin ha superado significativamente a oro en términos relativos a la baja y aún no ha regresado a extremos históricos.
La señal más importante proviene del comportamiento de los tenedores a largo plazo. El Cambio de Posición de los LTH (Long-Term Holders) ha cambiado recientemente de forma marcadamente positiva, con varios picos grandes de acumulación que aparecen cuando BTC se recuperó de la zona de $60K. Al mismo tiempo, la oferta de los LTH ha subido hacia 16.2M BTC, lo que sugiere que las monedas se están moviendo cada vez más hacia tenencias de mayor duración, en lugar de distribuirse de manera constante en el mercado.
Esto crea una divergencia interesante entre la valoración relativa y la convicción on-chain. BTC sigue muy por debajo de su trayectoria de Power Law, mientras que la relación BTC/Oro aún está comprimida; sin embargo, los tenedores a largo plazo están ampliando su posición. Históricamente, los aumentos sostenidos en la oferta de LTH pueden reducir la oferta líquida disponible para una venta inmediata, creando una base más sólida cuando la demanda comienza a acelerarse.
La estructura clave a monitorear es si esta acumulación de LTH persiste mientras BTC se mantiene por encima de la banda inferior de la Power Law cerca de $63K. Una recuperación sostenida en la relación BTC/Oro junto con la continuación de la acumulación de LTH indicaría una mejora de la fortaleza relativa y condiciones de oferta más ajustadas. Hasta entonces, los datos apuntan a un mercado que se está recuperando de un período de debilidad relativa intensa, pero que aún no ha alcanzado el tipo de extremos de valoración típicamente asociados con el sobrecalentamiento de fin de ciclo. #BTC Price Analysis# #Macro Insights#
46
·
--
💥 #Bitcoin Se está recuperando mientras el riesgo en cadena sigue contenido
$BTC se ha recuperado hacia la zona de $84K, pero la estructura en cadena aún luce lejos de las condiciones que históricamente acompañaron el sobrecalentamiento de finales de ciclo. La configuración actual es más consistente con un mercado que vuelve a construir fuerza tras un reinicio prolongado en utilidades realizadas y presión de venta.
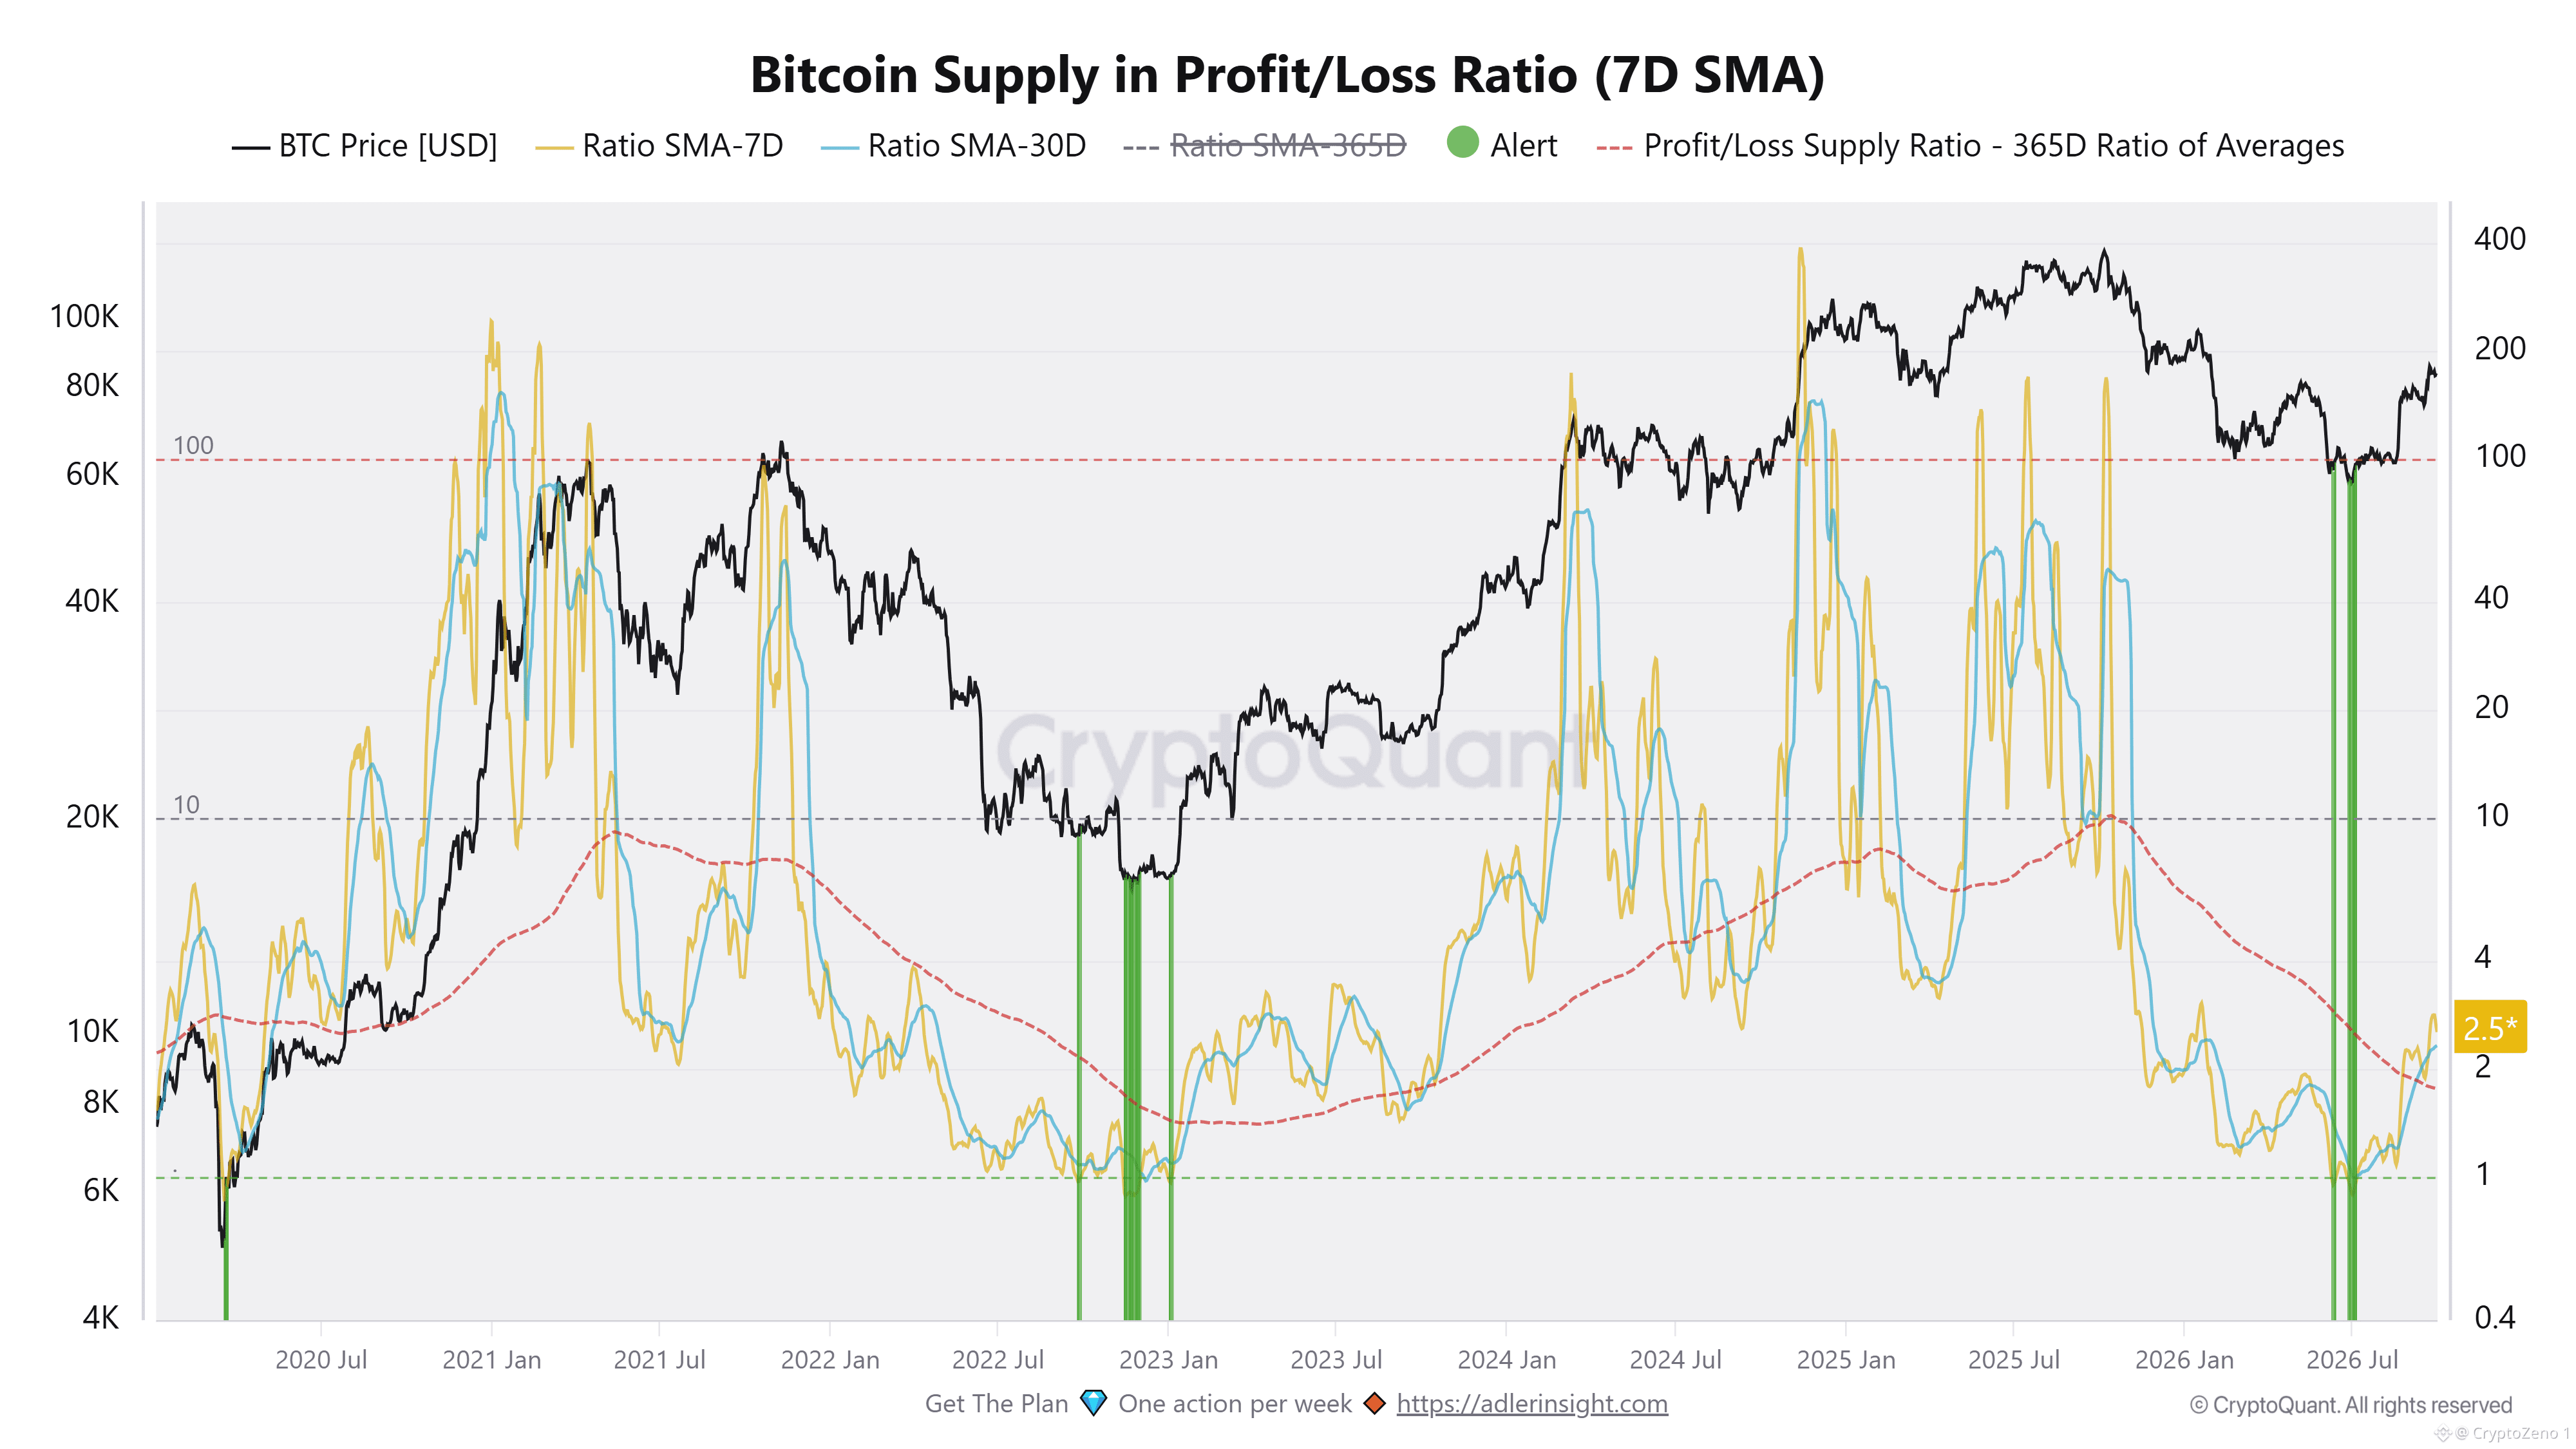
La Relación de Oferta en Ganancia/Pérdida está ahora alrededor de 2,5, muy por encima del nivel de 1,0 que antes marcó periodos de capitulación generalizada, pero todavía muy por debajo de las lecturas de 10+ observadas durante fases más fuertes de toma de beneficios. Esto es importante porque la recuperación de precio más reciente aún no ha llevado la relación a una zona donde la oferta rentable se convierta en una fuente evidente de distribución agresiva. Las medias de 7 y 30 días también están girando al alza, mostrando que la mejora está ganando cierta persistencia en lugar de ser solo un movimiento de un día.
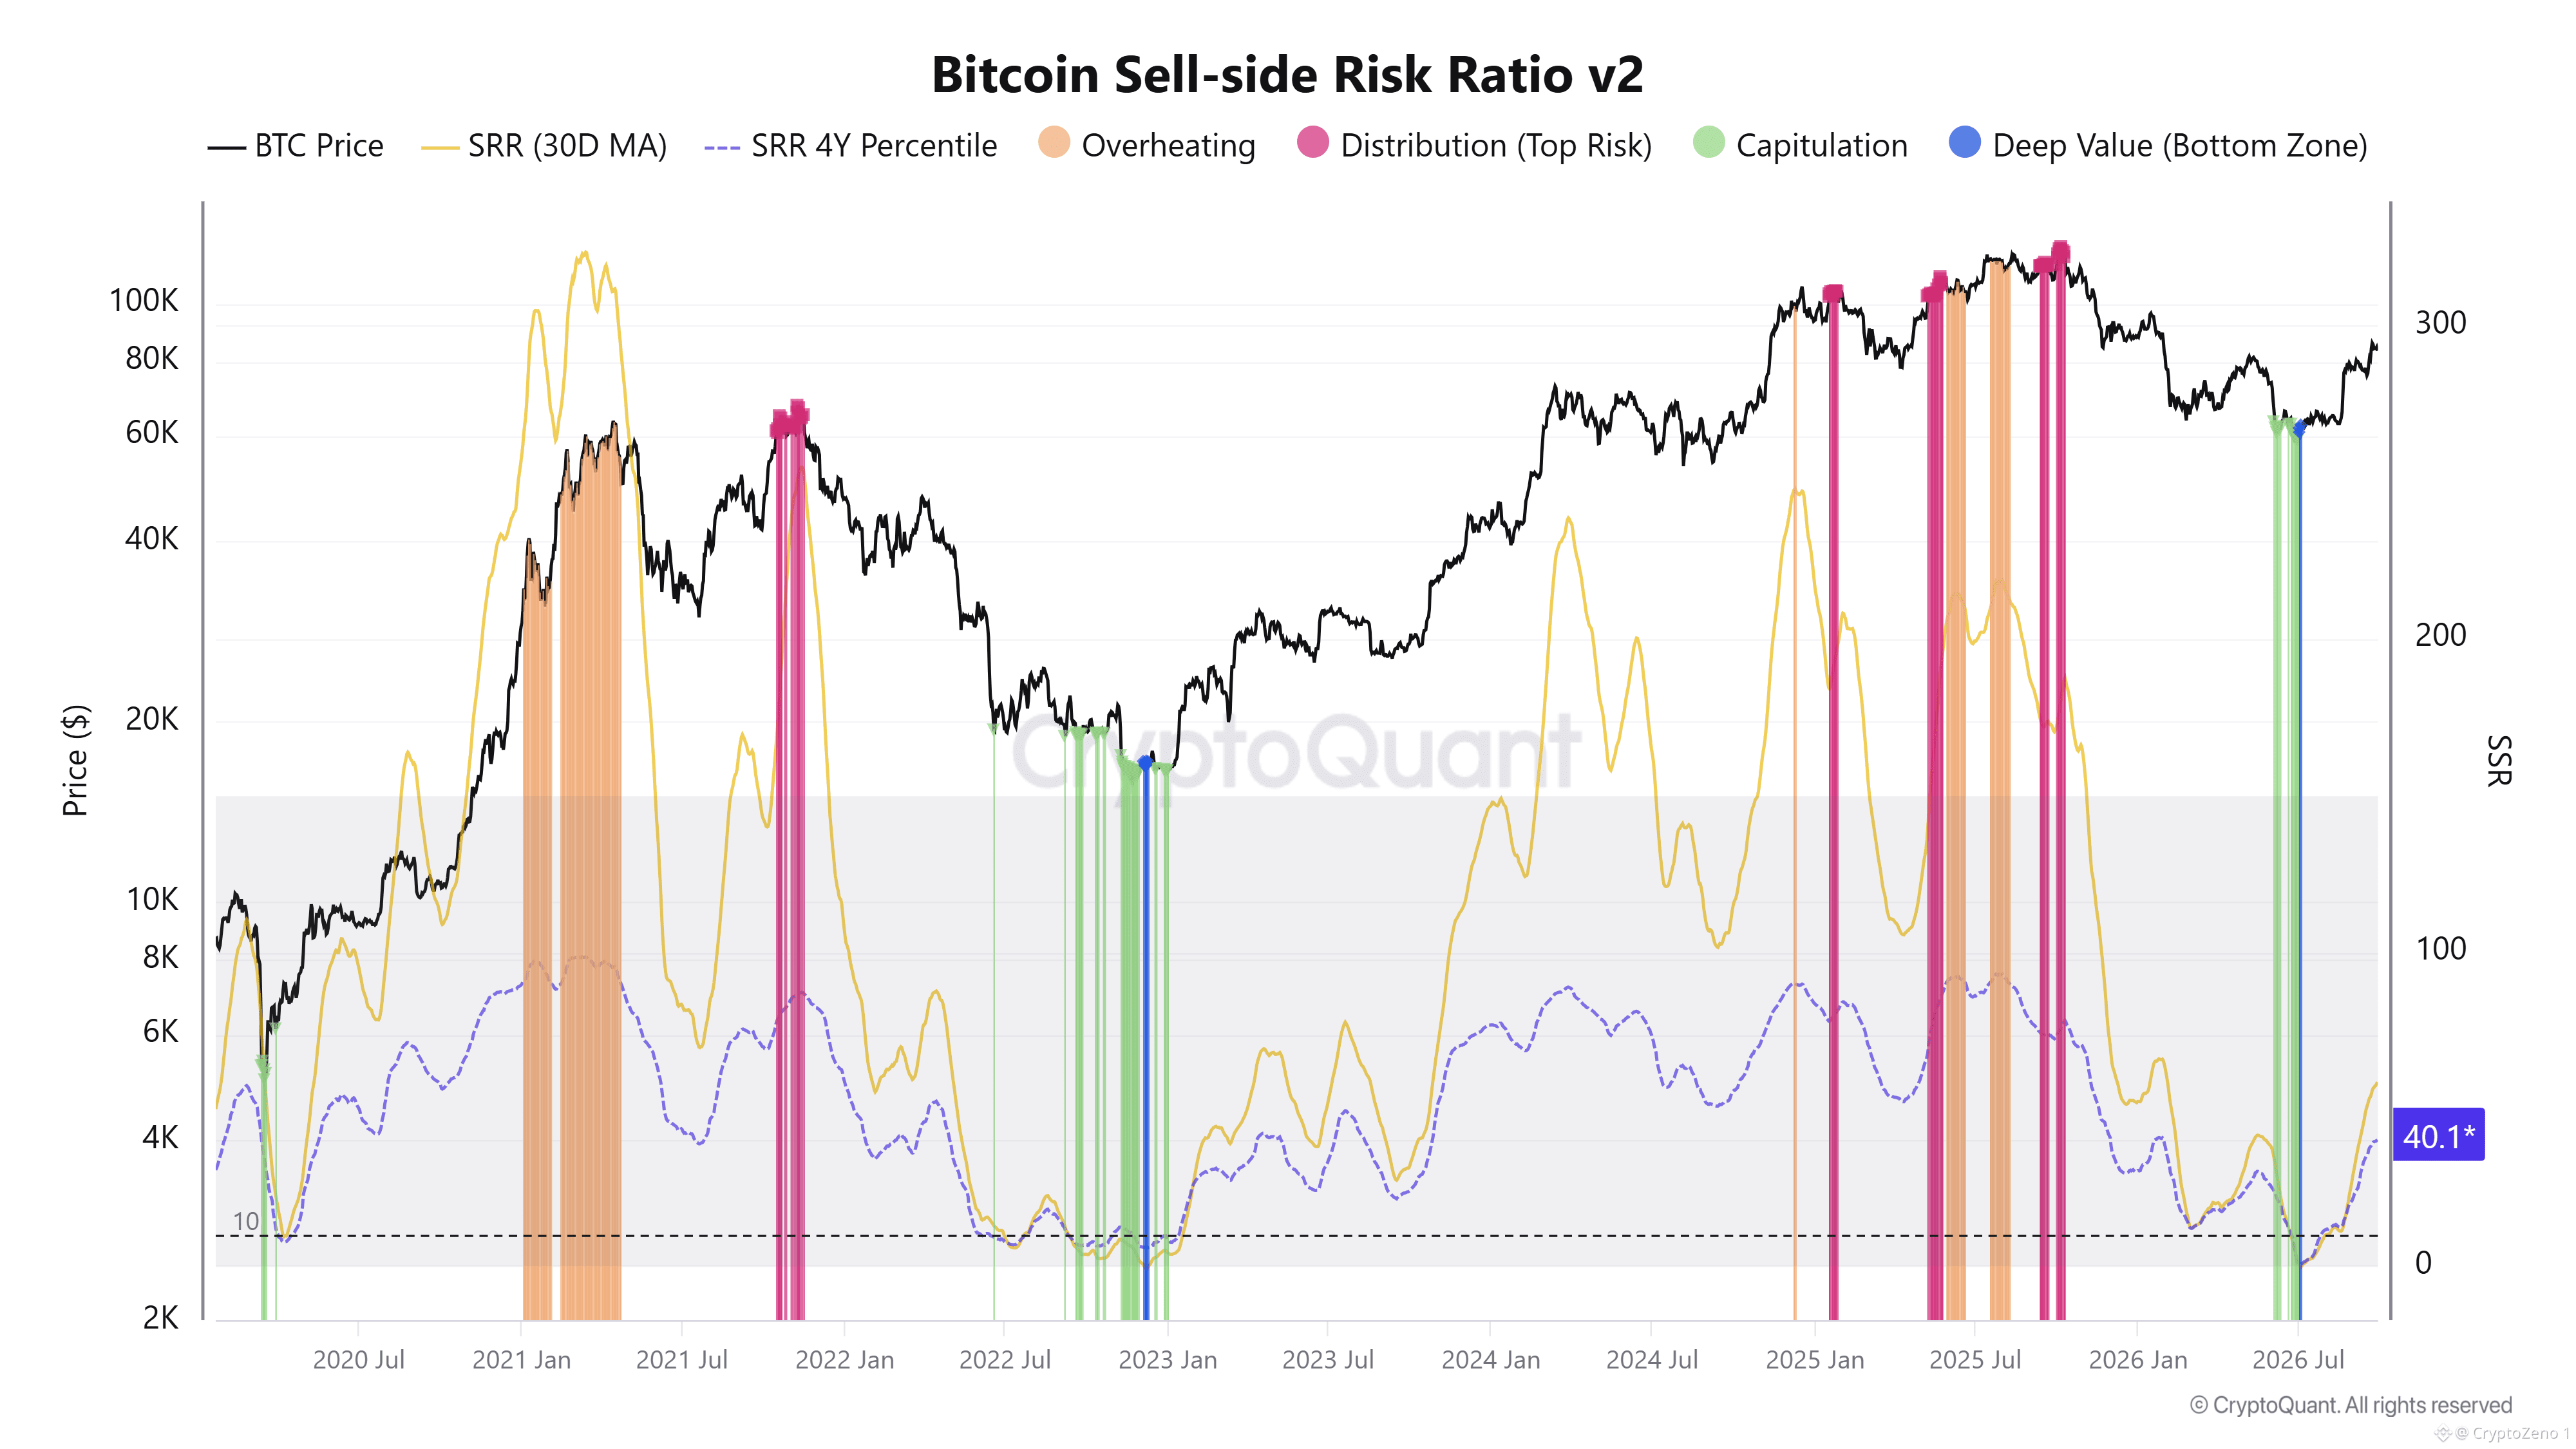
La Relación de Riesgo del Lado Vendedor añade otra capa al panorama. Su lectura actual es de alrededor de 40,1, después de caer con fuerza hacia el rango inferior a principios de 2026. Históricamente, descensos profundos en este indicador han aparecido cuando el mercado ha agotado una gran parte de sus ventas forzadas o impulsadas emocionalmente. El rebote reciente, por lo tanto, sugiere que la toma de beneficios realizada está regresando a medida que el precio se recupera, pero el indicador sigue muy por debajo de los niveles elevados asociados con el sobrecalentamiento y la distribución importante.
Esto deja a Bitcoin en una transición interesante. El precio ha recuperado el impulso, mientras que las métricas de riesgo en cadena aún no han alcanzado los extremos que normalmente definen una fase especulativa madura. Eso no elimina la posibilidad de otra corrección, especialmente si la liquidez macro o el apetito por riesgo se deterioran, pero sí sugiere que el avance actual está ocurriendo sin un exceso en cadena claramente evidente. La próxima señal a vigilar es si estas relaciones continúan subiendo con el precio o si comienzan a acelerarse hacia zonas históricas de riesgo. #AnálisisDelPrecioDeBTC# #PerspectivasMacro#
💥 #Bitcoin Se está recuperando mientras el riesgo en cadena sigue contenido
$BTC se ha recuperado hacia la zona de $84K, pero la estructura en cadena aún luce lejos de las condiciones que históricamente acompañaron el sobrecalentamiento de finales de ciclo. La configuración actual es más consistente con un mercado que vuelve a construir fuerza tras un reinicio prolongado en utilidades realizadas y presión de venta.
La Relación de Oferta en Ganancia/Pérdida está ahora alrededor de 2,5, muy por encima del nivel de 1,0 que antes marcó periodos de capitulación generalizada, pero todavía muy por debajo de las lecturas de 10+ observadas durante fases más fuertes de toma de beneficios. Esto es importante porque la recuperación de precio más reciente aún no ha llevado la relación a una zona donde la oferta rentable se convierta en una fuente evidente de distribución agresiva. Las medias de 7 y 30 días también están girando al alza, mostrando que la mejora está ganando cierta persistencia en lugar de ser solo un movimiento de un día.
La Relación de Riesgo del Lado Vendedor añade otra capa al panorama. Su lectura actual es de alrededor de 40,1, después de caer con fuerza hacia el rango inferior a principios de 2026. Históricamente, descensos profundos en este indicador han aparecido cuando el mercado ha agotado una gran parte de sus ventas forzadas o impulsadas emocionalmente. El rebote reciente, por lo tanto, sugiere que la toma de beneficios realizada está regresando a medida que el precio se recupera, pero el indicador sigue muy por debajo de los niveles elevados asociados con el sobrecalentamiento y la distribución importante.
Esto deja a Bitcoin en una transición interesante. El precio ha recuperado el impulso, mientras que las métricas de riesgo en cadena aún no han alcanzado los extremos que normalmente definen una fase especulativa madura. Eso no elimina la posibilidad de otra corrección, especialmente si la liquidez macro o el apetito por riesgo se deterioran, pero sí sugiere que el avance actual está ocurriendo sin un exceso en cadena claramente evidente. La próxima señal a vigilar es si estas relaciones continúan subiendo con el precio o si comienzan a acelerarse hacia zonas históricas de riesgo. #AnálisisDelPrecioDeBTC# #PerspectivasMacro#
$BTC se ha recuperado hacia la zona de $84K, pero la estructura en cadena aún luce lejos de las condiciones que históricamente acompañaron el sobrecalentamiento de finales de ciclo. La configuración actual es más consistente con un mercado que vuelve a construir fuerza tras un reinicio prolongado en utilidades realizadas y presión de venta.
La Relación de Oferta en Ganancia/Pérdida está ahora alrededor de 2,5, muy por encima del nivel de 1,0 que antes marcó periodos de capitulación generalizada, pero todavía muy por debajo de las lecturas de 10+ observadas durante fases más fuertes de toma de beneficios. Esto es importante porque la recuperación de precio más reciente aún no ha llevado la relación a una zona donde la oferta rentable se convierta en una fuente evidente de distribución agresiva. Las medias de 7 y 30 días también están girando al alza, mostrando que la mejora está ganando cierta persistencia en lugar de ser solo un movimiento de un día.
La Relación de Riesgo del Lado Vendedor añade otra capa al panorama. Su lectura actual es de alrededor de 40,1, después de caer con fuerza hacia el rango inferior a principios de 2026. Históricamente, descensos profundos en este indicador han aparecido cuando el mercado ha agotado una gran parte de sus ventas forzadas o impulsadas emocionalmente. El rebote reciente, por lo tanto, sugiere que la toma de beneficios realizada está regresando a medida que el precio se recupera, pero el indicador sigue muy por debajo de los niveles elevados asociados con el sobrecalentamiento y la distribución importante.
Esto deja a Bitcoin en una transición interesante. El precio ha recuperado el impulso, mientras que las métricas de riesgo en cadena aún no han alcanzado los extremos que normalmente definen una fase especulativa madura. Eso no elimina la posibilidad de otra corrección, especialmente si la liquidez macro o el apetito por riesgo se deterioran, pero sí sugiere que el avance actual está ocurriendo sin un exceso en cadena claramente evidente. La próxima señal a vigilar es si estas relaciones continúan subiendo con el precio o si comienzan a acelerarse hacia zonas históricas de riesgo. #AnálisisDelPrecioDeBTC# #PerspectivasMacro#
83
·
--
$BTC El suelo local podría estar realmente aquí.
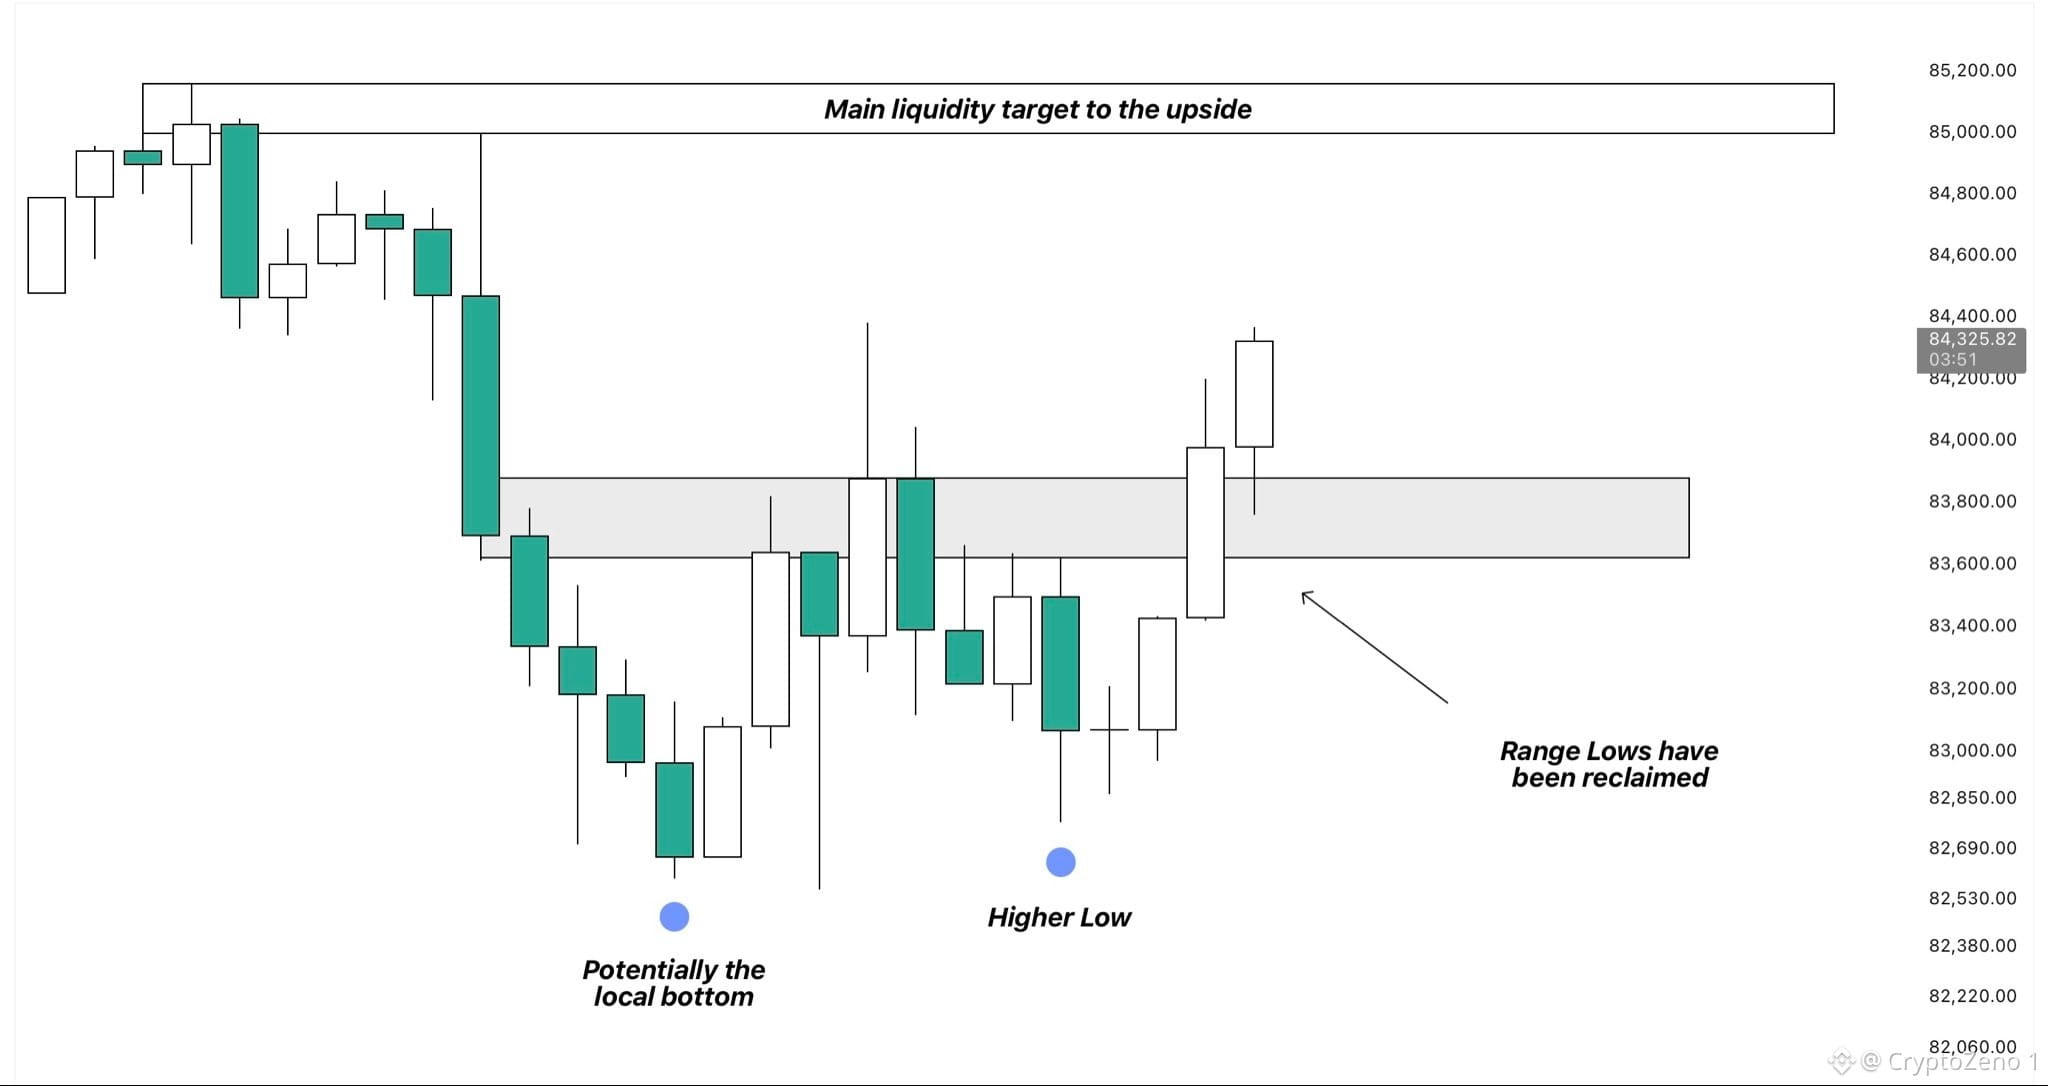
El precio ha recuperado oficialmente los mínimos del rango y sigue encontrando aceptación por encima de ellos.
En el marco temporal LTF, BTC ya ha impreso un mínimo más alto y ahora está cerca de formar también un máximo más alto.
Desde aquí, creo que es muy probable una continuación hacia la zona de $85k, ya que también es donde actualmente se concentra la mayor parte de la liquidez a corto plazo.
Si el impulso alcista es lo suficientemente fuerte como para superar ese nivel, entonces podríamos ver una continuación de vuelta hacia los máximos alrededor de $87k.
Un rechazo en cambio mantendría a BTC dentro del rango por ahora. #Análisis de Precio de BTC# #Perspectivas Macroeconómicas#
$BTC El suelo local podría estar realmente aquí.
El precio ha recuperado oficialmente los mínimos del rango y sigue encontrando aceptación por encima de ellos.
En el marco temporal LTF, BTC ya ha impreso un mínimo más alto y ahora está cerca de formar también un máximo más alto.
Desde aquí, creo que es muy probable una continuación hacia la zona de $85k, ya que también es donde actualmente se concentra la mayor parte de la liquidez a corto plazo.
Si el impulso alcista es lo suficientemente fuerte como para superar ese nivel, entonces podríamos ver una continuación de vuelta hacia los máximos alrededor de $87k.
Un rechazo en cambio mantendría a BTC dentro del rango por ahora. #Análisis de Precio de BTC# #Perspectivas Macroeconómicas#
El precio ha recuperado oficialmente los mínimos del rango y sigue encontrando aceptación por encima de ellos.
En el marco temporal LTF, BTC ya ha impreso un mínimo más alto y ahora está cerca de formar también un máximo más alto.
Desde aquí, creo que es muy probable una continuación hacia la zona de $85k, ya que también es donde actualmente se concentra la mayor parte de la liquidez a corto plazo.
Si el impulso alcista es lo suficientemente fuerte como para superar ese nivel, entonces podríamos ver una continuación de vuelta hacia los máximos alrededor de $87k.
Un rechazo en cambio mantendría a BTC dentro del rango por ahora. #Análisis de Precio de BTC# #Perspectivas Macroeconómicas#
96
·
--
$BTC No eran lo mismo...
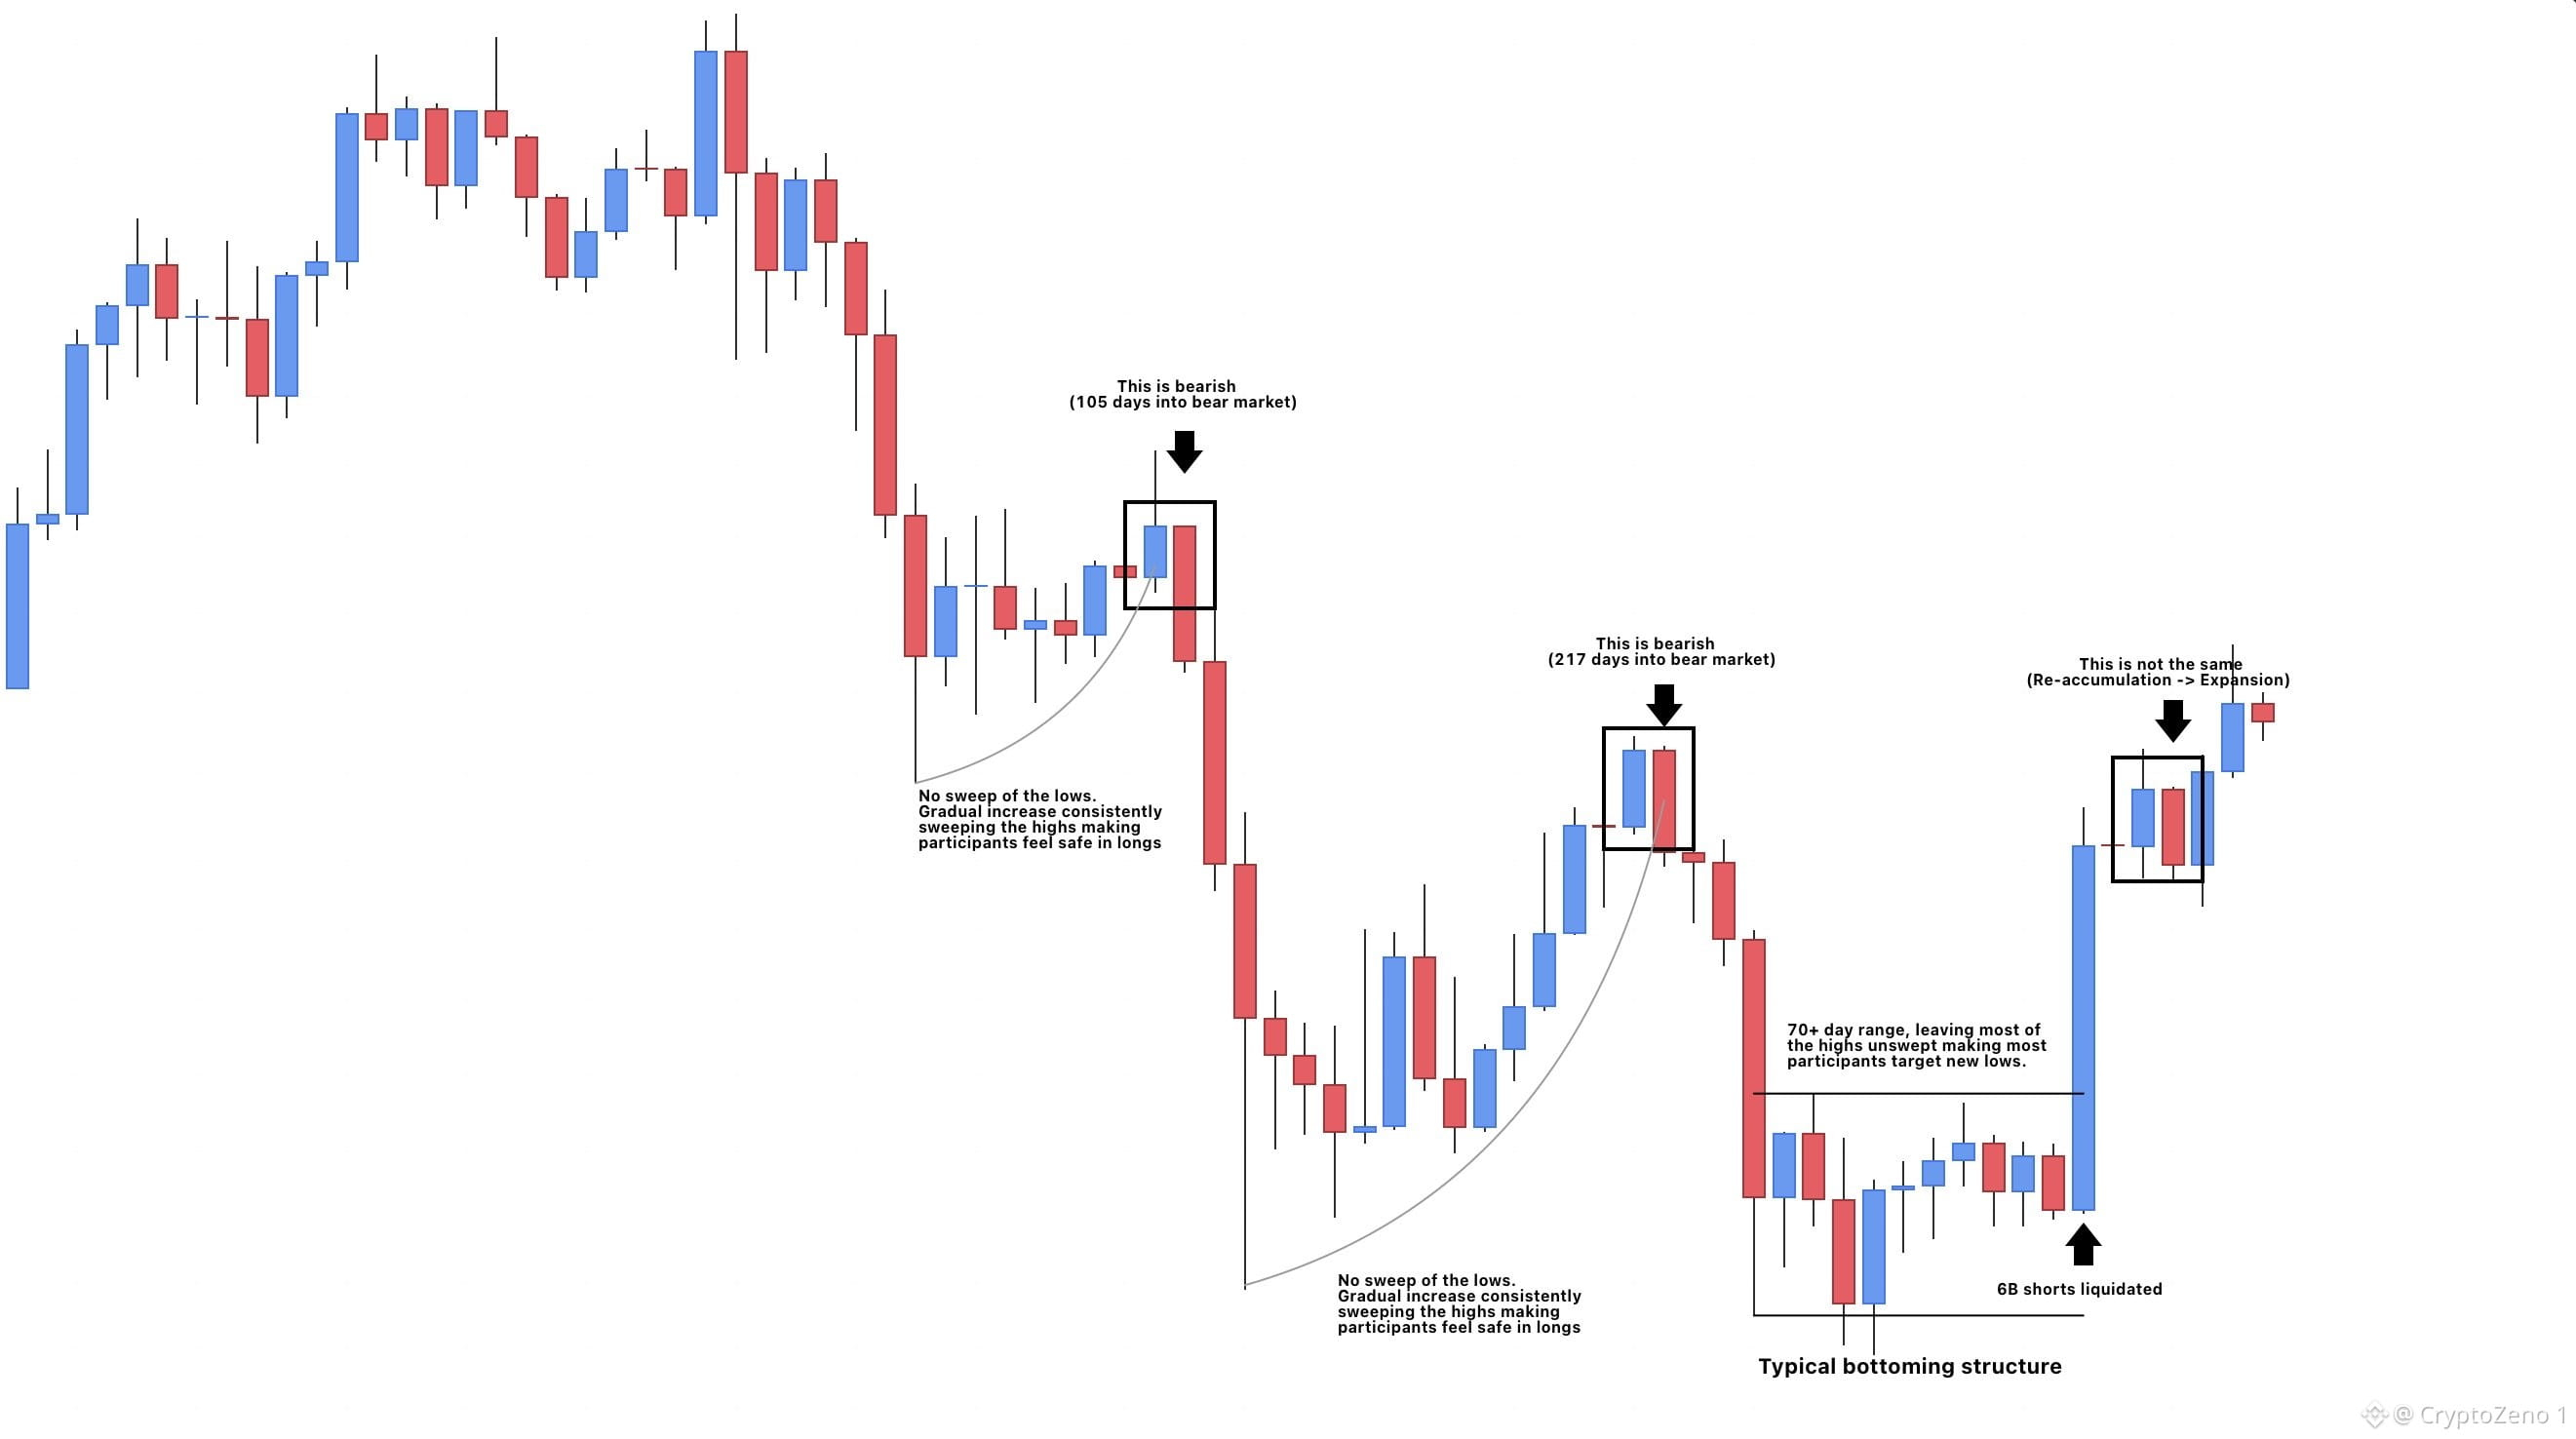
La estructura antes y durante el movimiento importa. ¿Fueron los tres candelas bajistas envolventes? Sí. Pero mira la estructura que rodea cada aparición.
La tercera ocurrió después de una ruptura de un rango de 2+ meses, liquidando $6B en cortos. Eso es muy diferente a las dos instancias anteriores, donde el precio seguía apuntando a los cortos mientras dejaba casi todos los mínimos de las mechas sin barrer, haciendo que los participantes se sintieran seguros en posiciones largas.
El contexto importa. Esta es una indicación clara de que el fondo ya está y que vienen precios más altos.🎲 #Análisis de Precio de BTC# #Perspectivas Macroeconómicas#
$BTC No eran lo mismo...
La estructura antes y durante el movimiento importa. ¿Fueron los tres candelas bajistas envolventes? Sí. Pero mira la estructura que rodea cada aparición.
La tercera ocurrió después de una ruptura de un rango de 2+ meses, liquidando $6B en cortos. Eso es muy diferente a las dos instancias anteriores, donde el precio seguía apuntando a los cortos mientras dejaba casi todos los mínimos de las mechas sin barrer, haciendo que los participantes se sintieran seguros en posiciones largas.
El contexto importa. Esta es una indicación clara de que el fondo ya está y que vienen precios más altos.🎲 #Análisis de Precio de BTC# #Perspectivas Macroeconómicas#
La estructura antes y durante el movimiento importa. ¿Fueron los tres candelas bajistas envolventes? Sí. Pero mira la estructura que rodea cada aparición.
La tercera ocurrió después de una ruptura de un rango de 2+ meses, liquidando $6B en cortos. Eso es muy diferente a las dos instancias anteriores, donde el precio seguía apuntando a los cortos mientras dejaba casi todos los mínimos de las mechas sin barrer, haciendo que los participantes se sintieran seguros en posiciones largas.
El contexto importa. Esta es una indicación clara de que el fondo ya está y que vienen precios más altos.🎲 #Análisis de Precio de BTC# #Perspectivas Macroeconómicas#
78
·
--
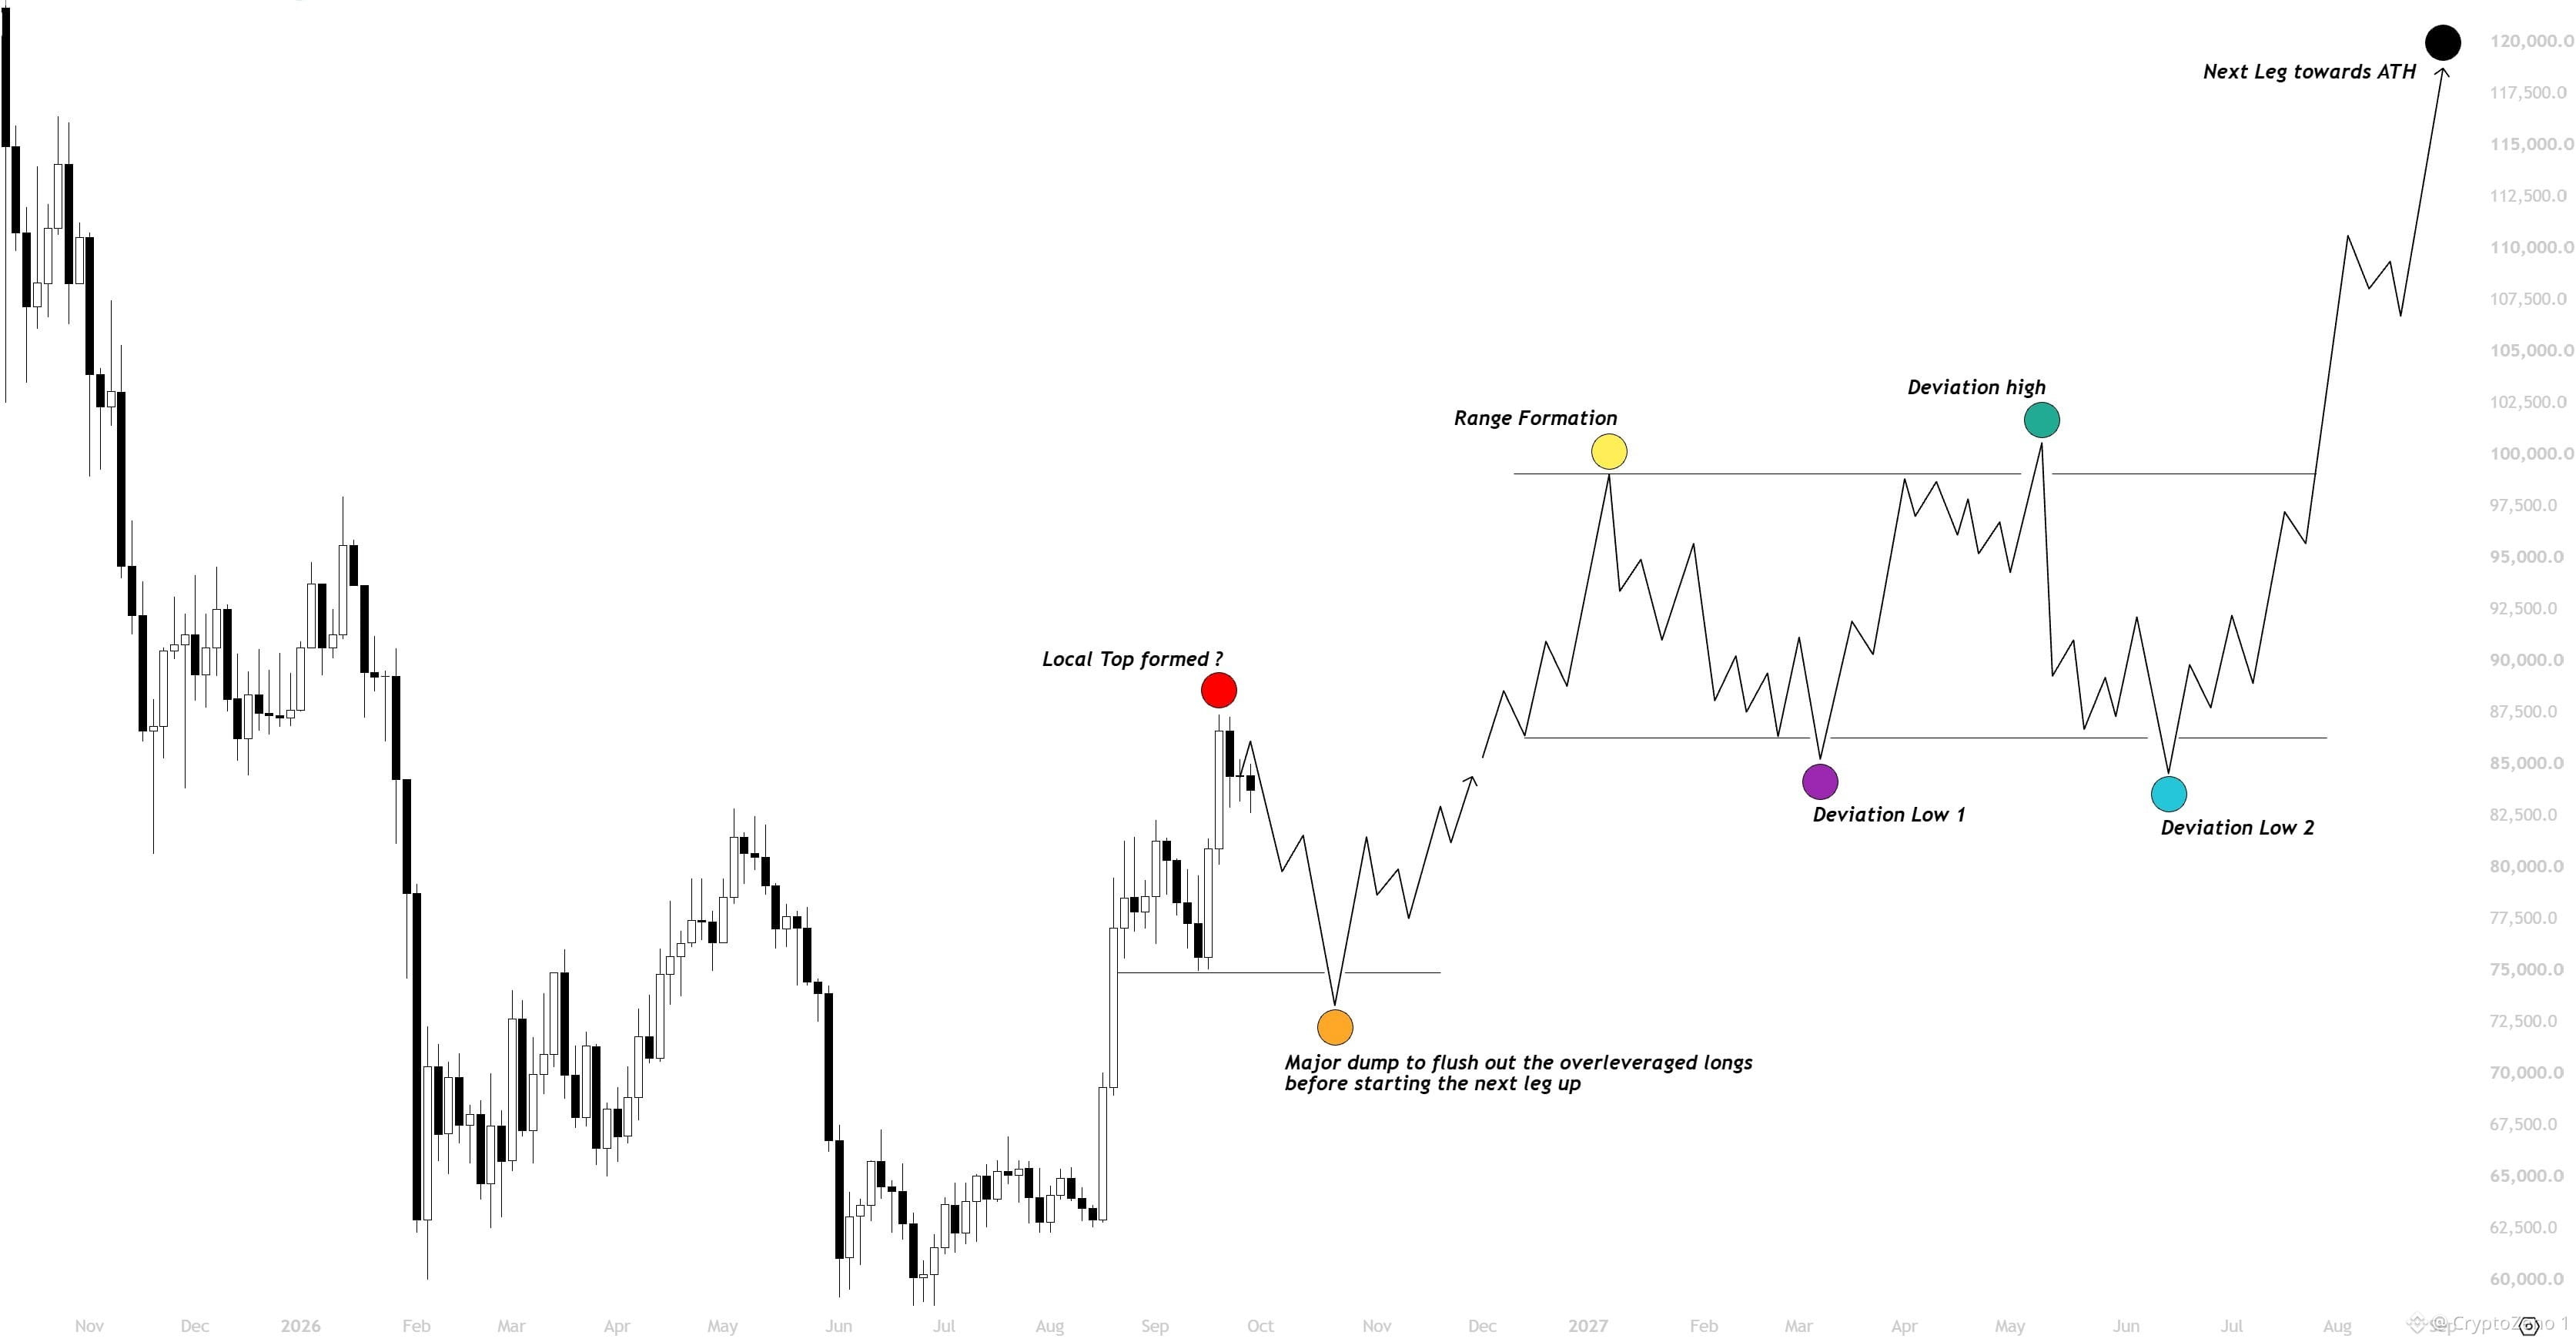
$BTC El precio del BTC está empezando a perder impulso alrededor del tope esperado,
Podríamos ver otro impulso hasta 85.5k como un re-test bajista,
Pero después, espero que el precio empiece a caer hacia la liquidez del lado bajista,
Estoy esperando que esta caída ocurra durante las próximas 1-2 semanas, a medida que comienza la nueva vela mensual.
Así que básicamente, octubre va a ser el último buen mes para acumular antes de que nos vayamos completamente parabólicos.
Para que el precio alcance 100k, no creo que ocurra este año; quizá en el primer trimestre de 2027.
En general, este es mi plan actual para el próximo Q4. #BTC Price Analysis# #Macro Insights# #Meme Alpha#
$BTC El precio del BTC está empezando a perder impulso alrededor del tope esperado,
Podríamos ver otro impulso hasta 85.5k como un re-test bajista,
Pero después, espero que el precio empiece a caer hacia la liquidez del lado bajista,
Estoy esperando que esta caída ocurra durante las próximas 1-2 semanas, a medida que comienza la nueva vela mensual.
Así que básicamente, octubre va a ser el último buen mes para acumular antes de que nos vayamos completamente parabólicos.
Para que el precio alcance 100k, no creo que ocurra este año; quizá en el primer trimestre de 2027.
En general, este es mi plan actual para el próximo Q4. #BTC Price Analysis# #Macro Insights# #Meme Alpha#
Podríamos ver otro impulso hasta 85.5k como un re-test bajista,
Pero después, espero que el precio empiece a caer hacia la liquidez del lado bajista,
Estoy esperando que esta caída ocurra durante las próximas 1-2 semanas, a medida que comienza la nueva vela mensual.
Así que básicamente, octubre va a ser el último buen mes para acumular antes de que nos vayamos completamente parabólicos.
Para que el precio alcance 100k, no creo que ocurra este año; quizá en el primer trimestre de 2027.
En general, este es mi plan actual para el próximo Q4. #BTC Price Analysis# #Macro Insights# #Meme Alpha#
55
·
--
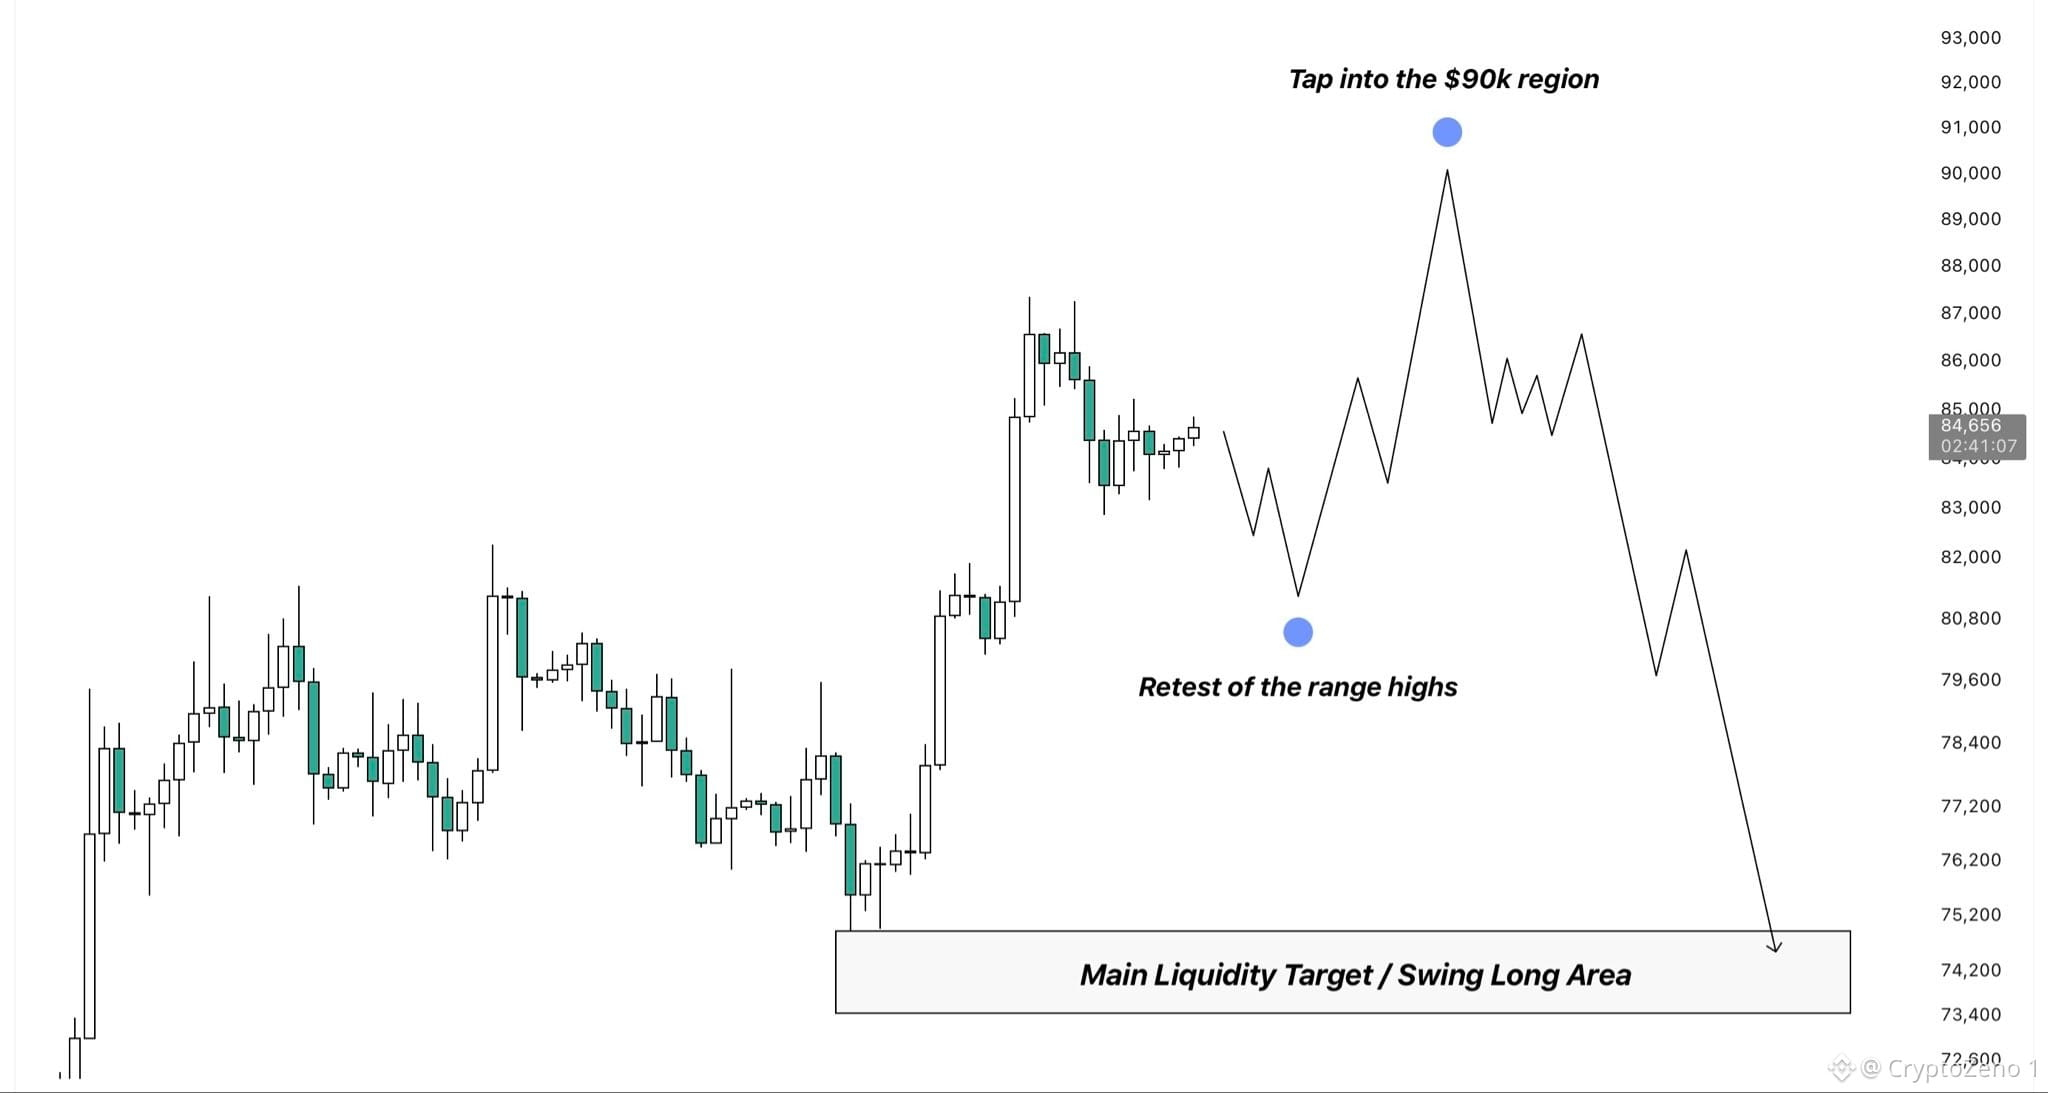
$BTC Aquí tienes tu guía para las próximas semanas.
Primero, quiero ver un cierre semanal por encima de $82.8k para confirmar un cambio de estructura alcista en el HTF.
Después, podría ver que BTC vuelve a probar los máximos del rango anterior para liquidar algunas posiciones largas más, seguido de otra expansión al alza hacia la zona de $90k.
Aquí es donde me interesaría un posible swing short, apuntando a los mínimos del reciente rally. Esa zona inferior es actualmente mi principal objetivo a la baja según la liquidez y, al mismo tiempo, mi área preferida para otro swing long.
Creo que este escenario no solo es muy realista desde la perspectiva del gráfico, sino que también tiene mucho sentido desde el punto de vista de la liquidez, ya que permitiría que BTC liquide liquidez en ambos lados antes de que comience la siguiente pierna al alza. #BTC Price Analysis# #Macro Insights#
$BTC Aquí tienes tu guía para las próximas semanas.
Primero, quiero ver un cierre semanal por encima de $82.8k para confirmar un cambio de estructura alcista en el HTF.
Después, podría ver que BTC vuelve a probar los máximos del rango anterior para liquidar algunas posiciones largas más, seguido de otra expansión al alza hacia la zona de $90k.
Aquí es donde me interesaría un posible swing short, apuntando a los mínimos del reciente rally. Esa zona inferior es actualmente mi principal objetivo a la baja según la liquidez y, al mismo tiempo, mi área preferida para otro swing long.
Creo que este escenario no solo es muy realista desde la perspectiva del gráfico, sino que también tiene mucho sentido desde el punto de vista de la liquidez, ya que permitiría que BTC liquide liquidez en ambos lados antes de que comience la siguiente pierna al alza. #BTC Price Analysis# #Macro Insights#
Primero, quiero ver un cierre semanal por encima de $82.8k para confirmar un cambio de estructura alcista en el HTF.
Después, podría ver que BTC vuelve a probar los máximos del rango anterior para liquidar algunas posiciones largas más, seguido de otra expansión al alza hacia la zona de $90k.
Aquí es donde me interesaría un posible swing short, apuntando a los mínimos del reciente rally. Esa zona inferior es actualmente mi principal objetivo a la baja según la liquidez y, al mismo tiempo, mi área preferida para otro swing long.
Creo que este escenario no solo es muy realista desde la perspectiva del gráfico, sino que también tiene mucho sentido desde el punto de vista de la liquidez, ya que permitiría que BTC liquide liquidez en ambos lados antes de que comience la siguiente pierna al alza. #BTC Price Analysis# #Macro Insights#
76
·
--
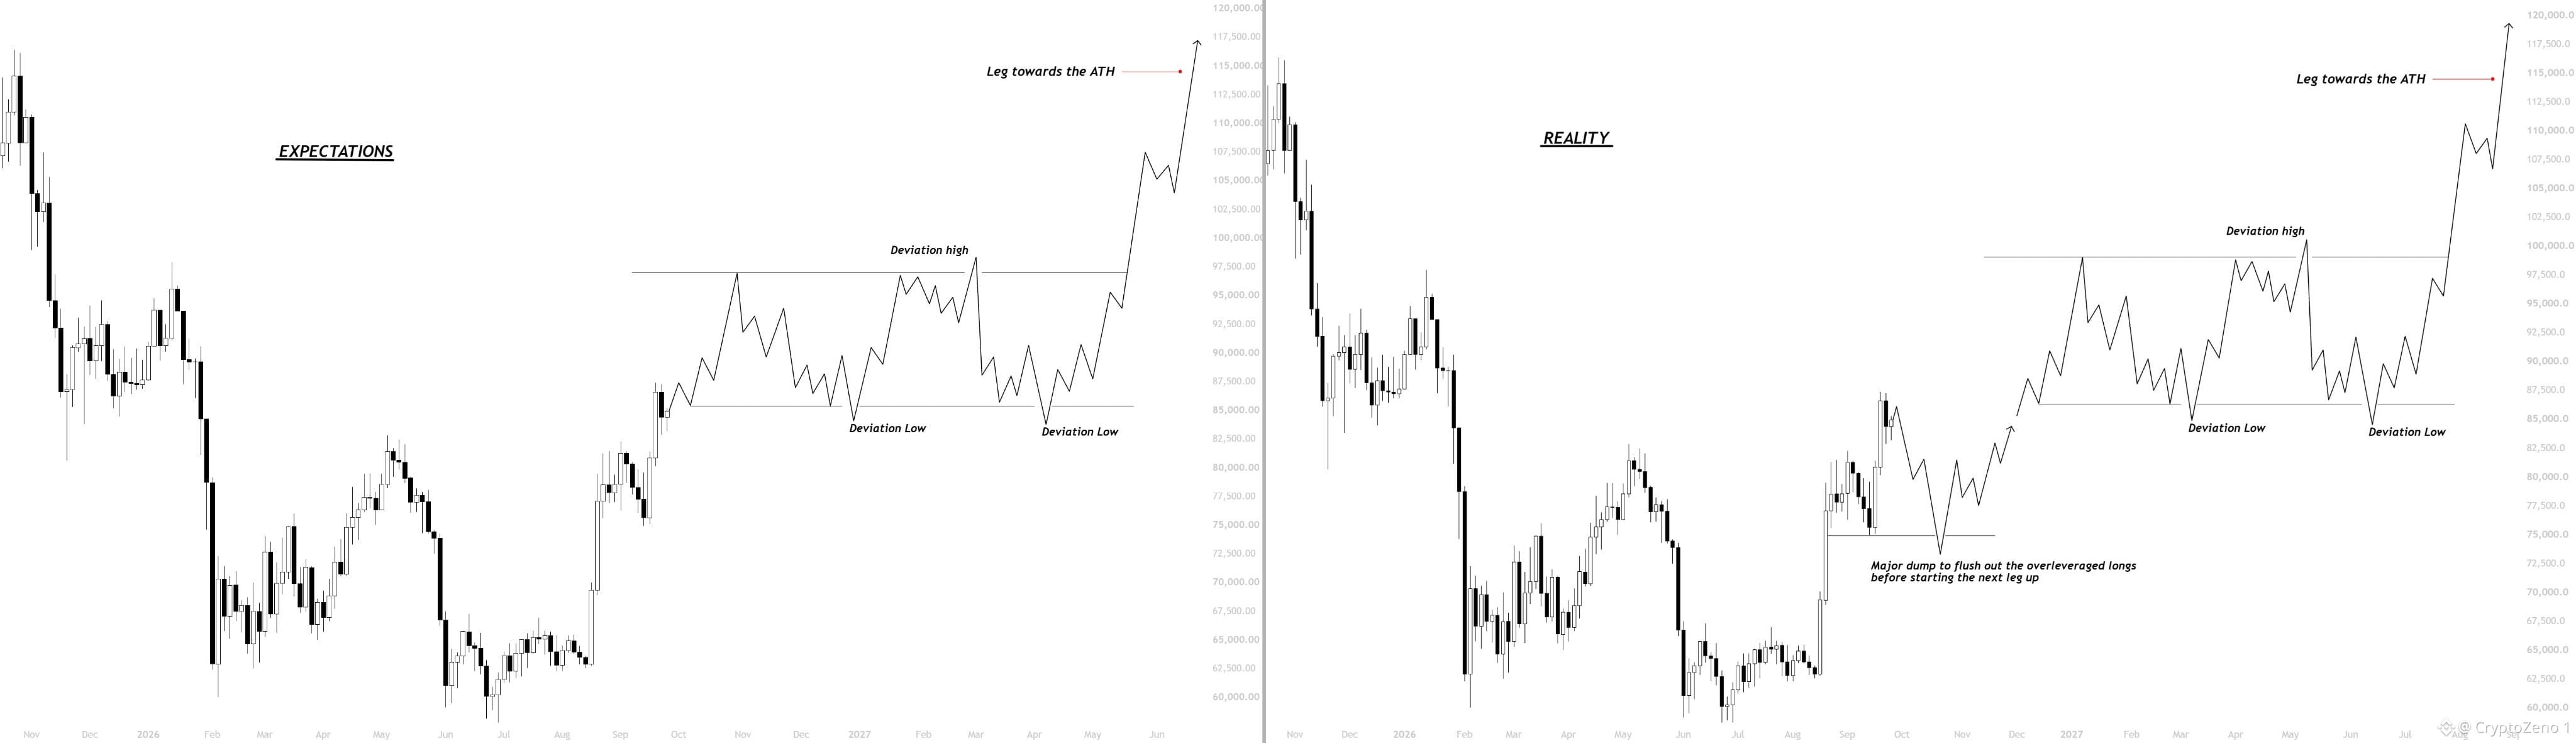
$BTC El precio se disparó por encima de 83k y ahora la gente apunta a 100k sin ninguna corrección,
Todo el CT espera que formemos directamente el enorme rango de acumulación y luego iniciemos la fase hacia el ATH,
Pero una vez más, nada sale como la mayoría planea en estos mercados,
Y la realidad, por supuesto, será muy diferente, especialmente con todo este fomo que estamos viendo alrededor del máximo local.
Espero que el precio primero liquide el exceso de apalancamiento/fomo en posiciones largas hasta 75k,
Luego dar la siguiente subida hasta 95-100k y formar allí el enorme rango de acumulación antes de ir al ATH.
En general, mi sesgo sigue siendo bajista hasta que se produzca la limpieza hacia 75k. #BTC Price Analysis# #Macro Insights#
$BTC El precio se disparó por encima de 83k y ahora la gente apunta a 100k sin ninguna corrección,
Todo el CT espera que formemos directamente el enorme rango de acumulación y luego iniciemos la fase hacia el ATH,
Pero una vez más, nada sale como la mayoría planea en estos mercados,
Y la realidad, por supuesto, será muy diferente, especialmente con todo este fomo que estamos viendo alrededor del máximo local.
Espero que el precio primero liquide el exceso de apalancamiento/fomo en posiciones largas hasta 75k,
Luego dar la siguiente subida hasta 95-100k y formar allí el enorme rango de acumulación antes de ir al ATH.
En general, mi sesgo sigue siendo bajista hasta que se produzca la limpieza hacia 75k. #BTC Price Analysis# #Macro Insights#
Todo el CT espera que formemos directamente el enorme rango de acumulación y luego iniciemos la fase hacia el ATH,
Pero una vez más, nada sale como la mayoría planea en estos mercados,
Y la realidad, por supuesto, será muy diferente, especialmente con todo este fomo que estamos viendo alrededor del máximo local.
Espero que el precio primero liquide el exceso de apalancamiento/fomo en posiciones largas hasta 75k,
Luego dar la siguiente subida hasta 95-100k y formar allí el enorme rango de acumulación antes de ir al ATH.
En general, mi sesgo sigue siendo bajista hasta que se produzca la limpieza hacia 75k. #BTC Price Analysis# #Macro Insights#
78
·
--
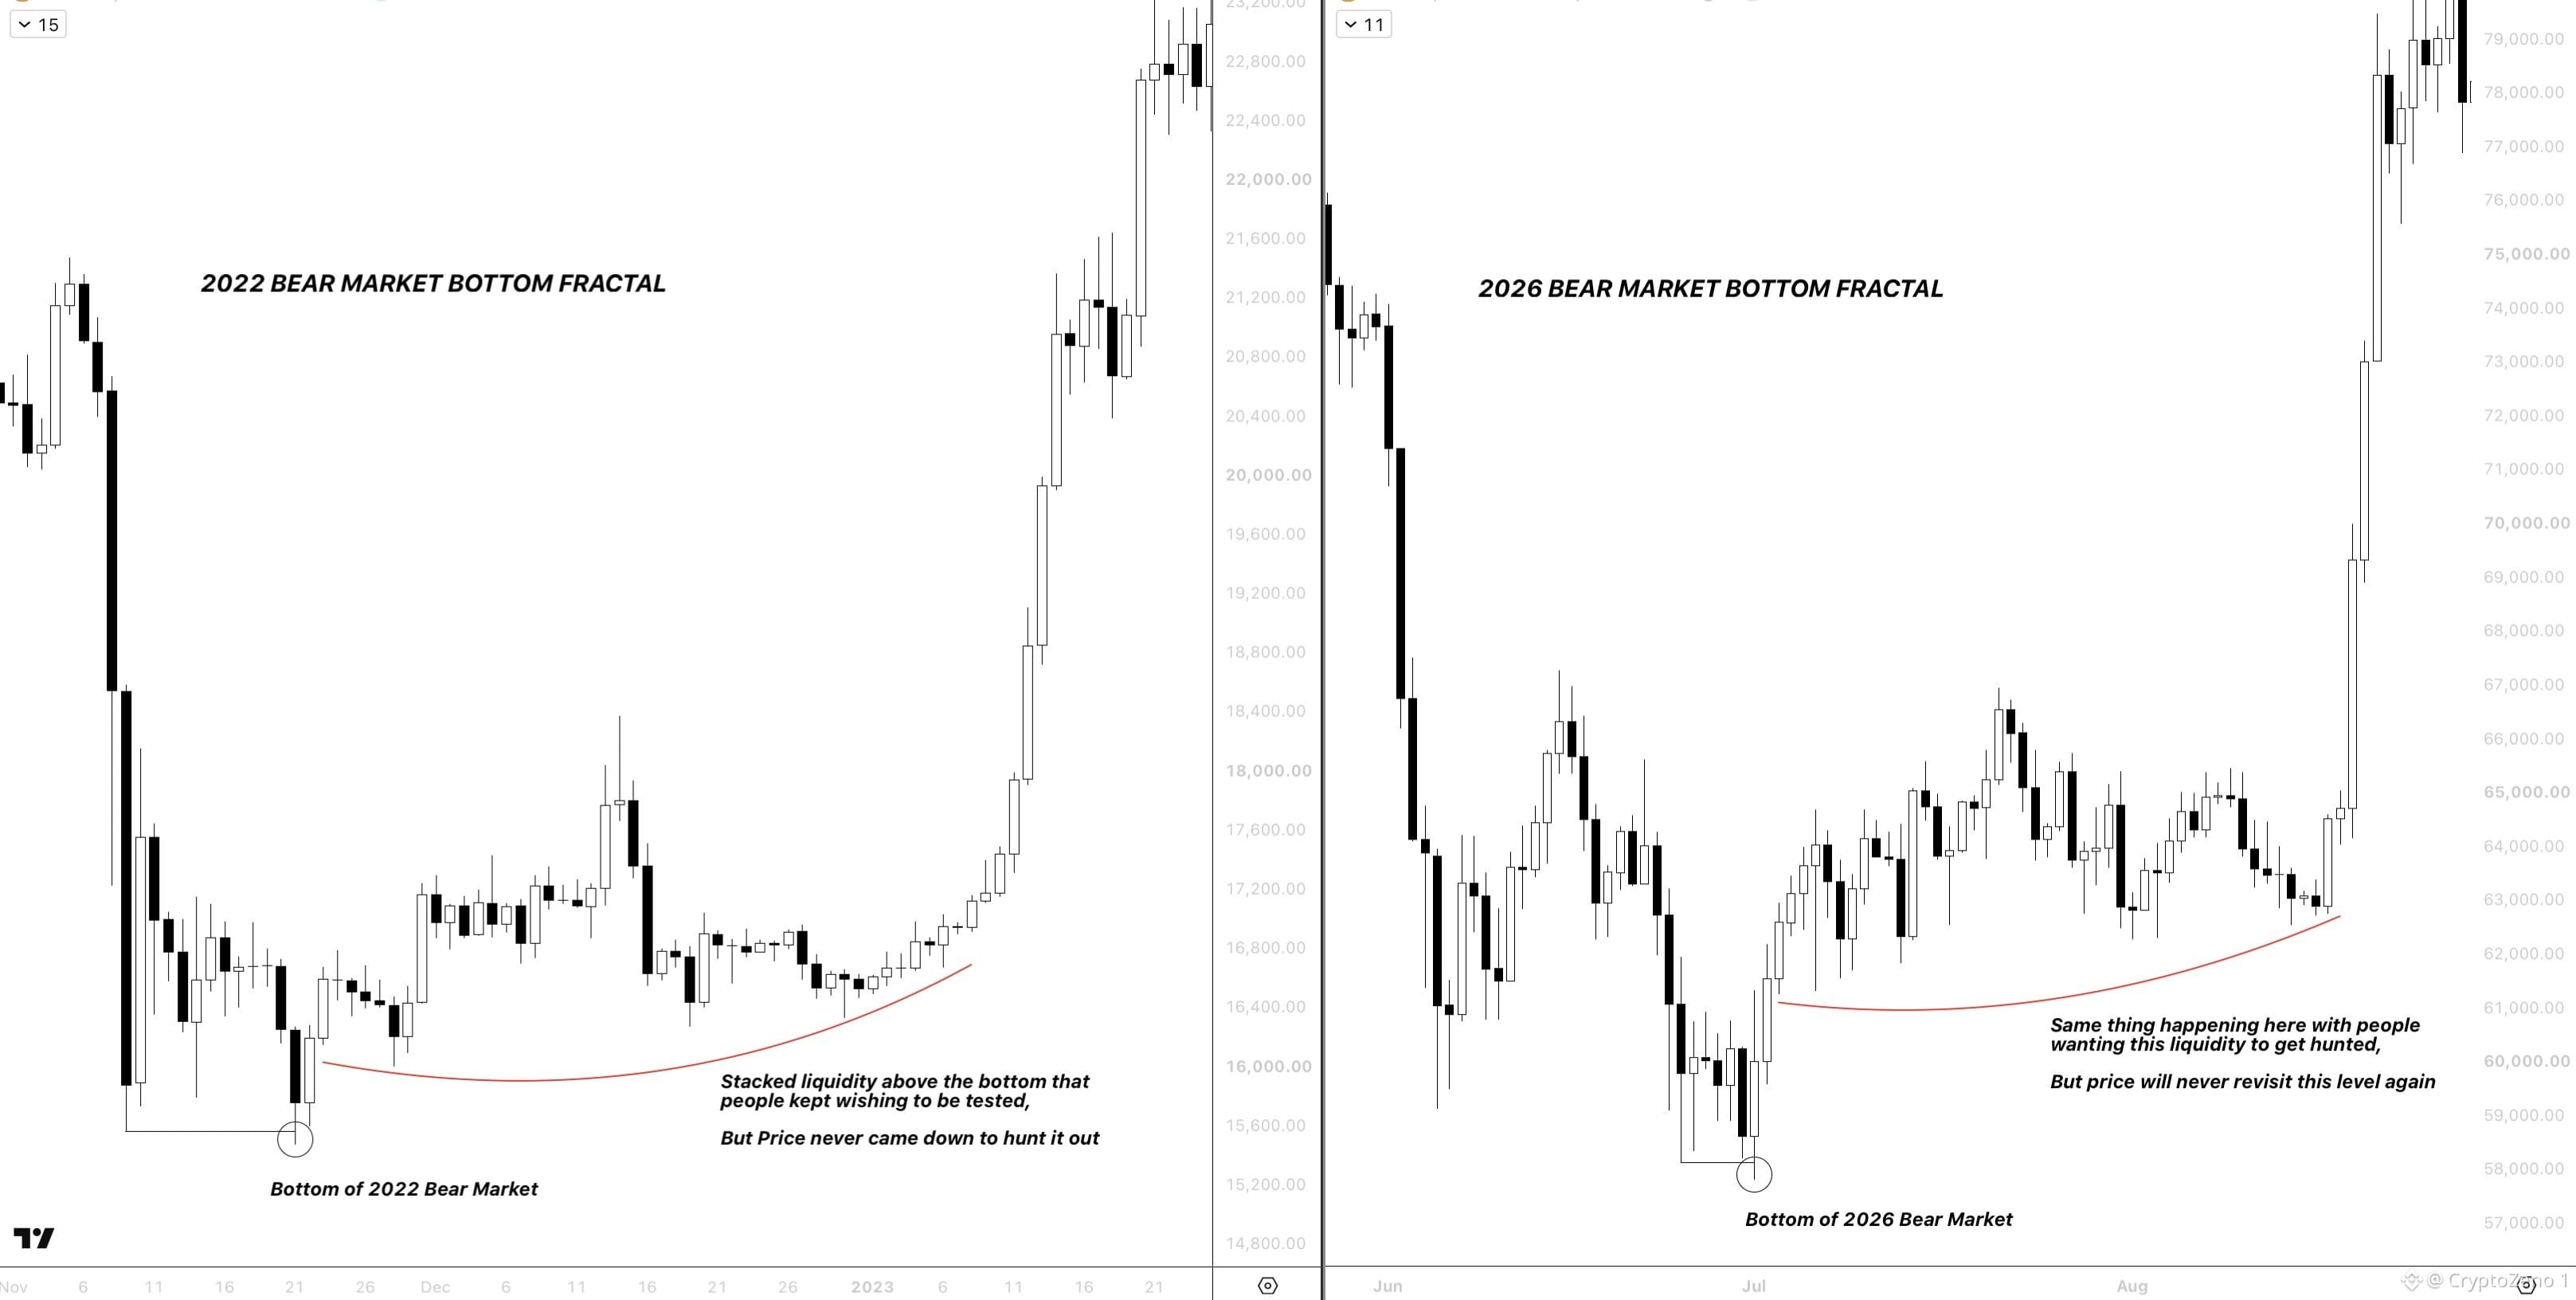
$BTC Aquí está por qué creo que el precio no va a crear otro mínimo,
Mucha gente está apuntando al enorme cúmulo de liquidez que está apilado alrededor de los 60s,
Pero si comparas la estructura del fondo de nuestro mercado bajista actual con la estructura del fondo del último mercado bajista,
Te darás cuenta de que formamos una estructura de “formación de suelo” muy similar y también teníamos mínimos no barridos apilados allí, lo que también significa liquidez apilada,
Pero una vez más, el precio nunca volvió para barrer esos niveles y simplemente continuó subiendo después de un gran “flush”.
En general, la conclusión es que, si ustedes están esperando nuevos mínimos solo porque están de lado, entonces no los van a conseguir,
Así que en lugar de esperar un nivel que no va a llegar, solo esperen el próximo gran retroceso y añadan ahí, porque todavía nos queda toda la carrera. #Análisis del precio de BTC# #Perspectivas macro#
$BTC Aquí está por qué creo que el precio no va a crear otro mínimo,
Mucha gente está apuntando al enorme cúmulo de liquidez que está apilado alrededor de los 60s,
Pero si comparas la estructura del fondo de nuestro mercado bajista actual con la estructura del fondo del último mercado bajista,
Te darás cuenta de que formamos una estructura de “formación de suelo” muy similar y también teníamos mínimos no barridos apilados allí, lo que también significa liquidez apilada,
Pero una vez más, el precio nunca volvió para barrer esos niveles y simplemente continuó subiendo después de un gran “flush”.
En general, la conclusión es que, si ustedes están esperando nuevos mínimos solo porque están de lado, entonces no los van a conseguir,
Así que en lugar de esperar un nivel que no va a llegar, solo esperen el próximo gran retroceso y añadan ahí, porque todavía nos queda toda la carrera. #Análisis del precio de BTC# #Perspectivas macro#
Mucha gente está apuntando al enorme cúmulo de liquidez que está apilado alrededor de los 60s,
Pero si comparas la estructura del fondo de nuestro mercado bajista actual con la estructura del fondo del último mercado bajista,
Te darás cuenta de que formamos una estructura de “formación de suelo” muy similar y también teníamos mínimos no barridos apilados allí, lo que también significa liquidez apilada,
Pero una vez más, el precio nunca volvió para barrer esos niveles y simplemente continuó subiendo después de un gran “flush”.
En general, la conclusión es que, si ustedes están esperando nuevos mínimos solo porque están de lado, entonces no los van a conseguir,
Así que en lugar de esperar un nivel que no va a llegar, solo esperen el próximo gran retroceso y añadan ahí, porque todavía nos queda toda la carrera. #Análisis del precio de BTC# #Perspectivas macro#
34
·
--
$ZEC
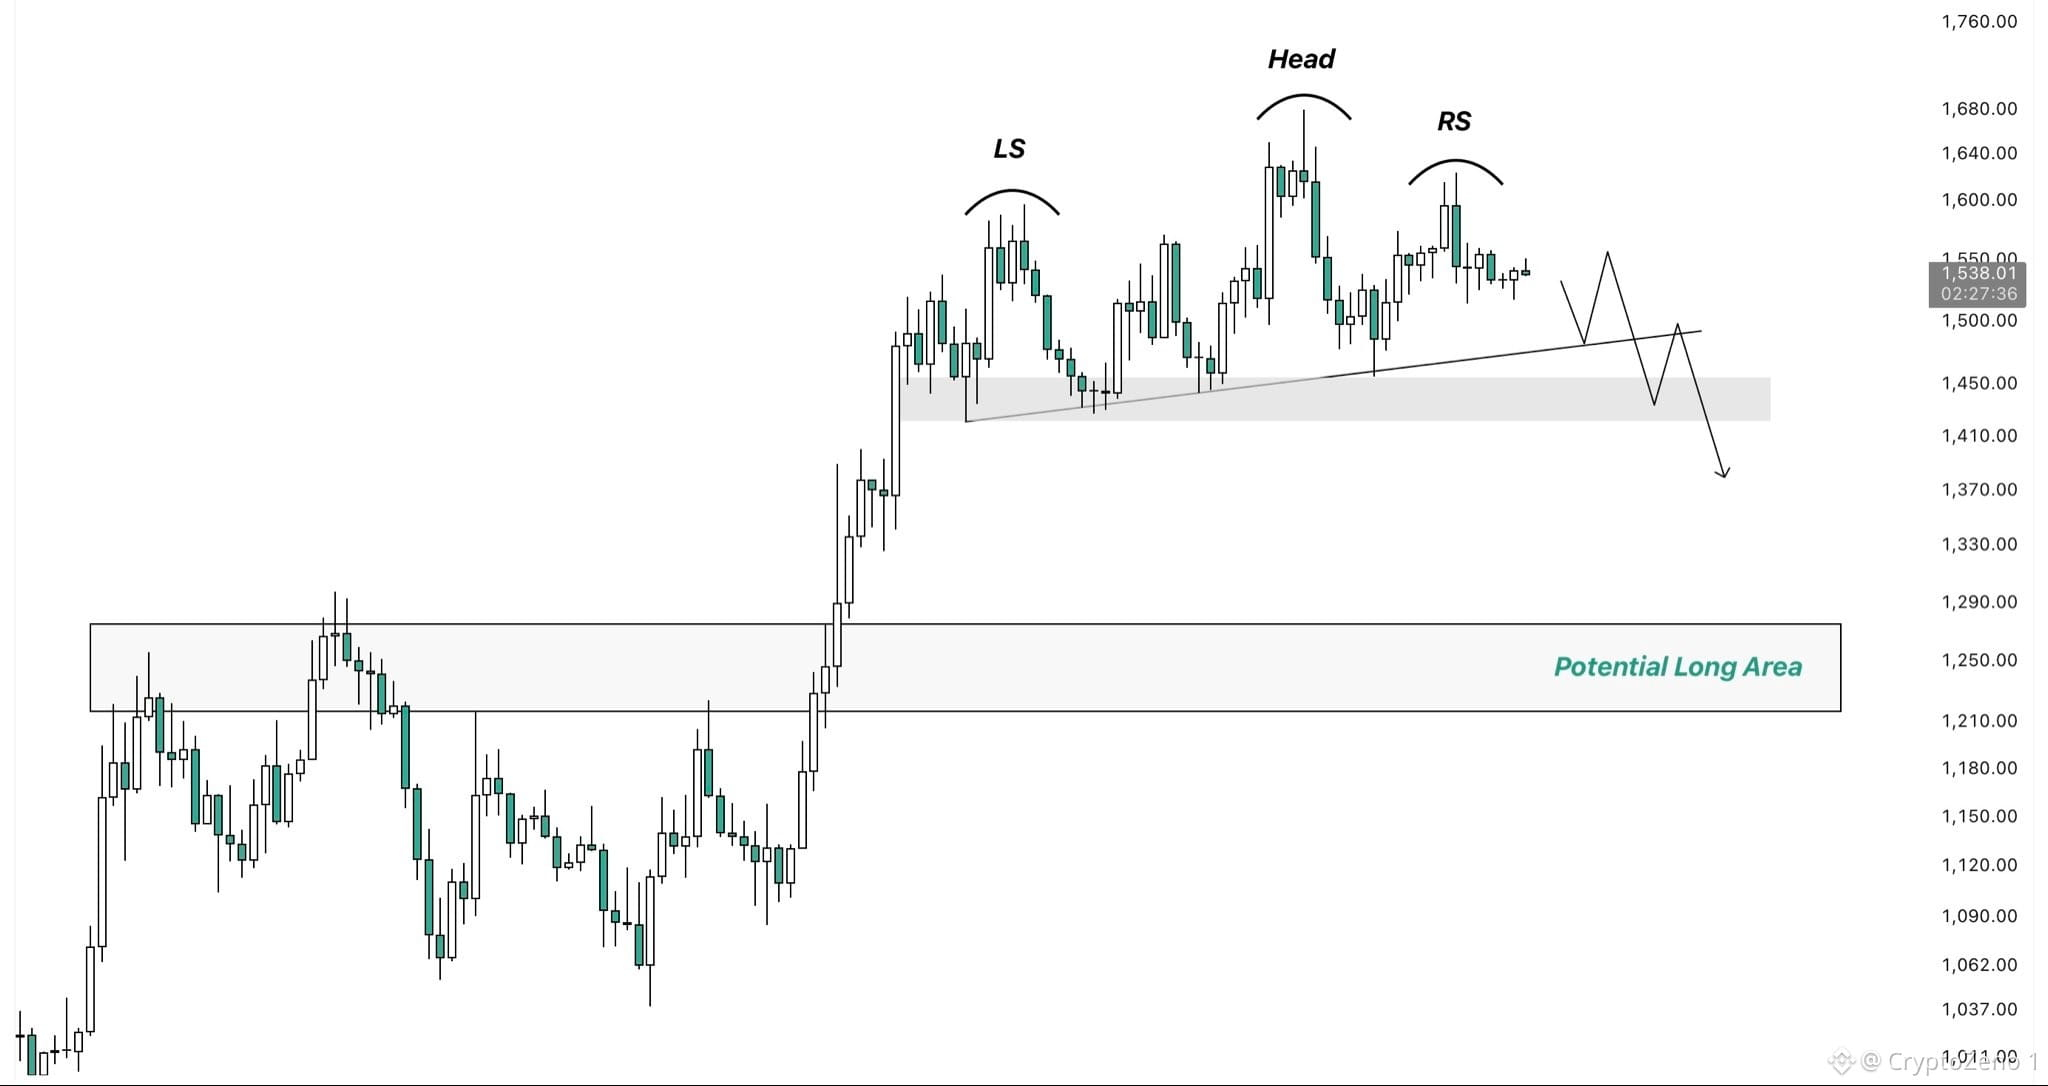
Acá tenemos un posible setup de corto que se está formando.
El precio actualmente está desarrollando un patrón de hombros y cabeza bastante limpio justo por encima de una zona clave de soporte.
Si obtenemos una ruptura confirmada por debajo de la línea del cuello/soporte, buscaré un corto apuntando a la región de $1,200–$1,300.
Esa zona coincide con los máximos del rango anterior del que salimos recientemente, lo que la convierte en un nivel interesante para observar una reacción.
Un retesteo ahí podría luego ofrecer una buena oportunidad larga para la siguiente expansión al alza. #BTC Price Analysis# #Macro Insights#
$ZEC
Acá tenemos un posible setup de corto que se está formando.
El precio actualmente está desarrollando un patrón de hombros y cabeza bastante limpio justo por encima de una zona clave de soporte.
Si obtenemos una ruptura confirmada por debajo de la línea del cuello/soporte, buscaré un corto apuntando a la región de $1,200–$1,300.
Esa zona coincide con los máximos del rango anterior del que salimos recientemente, lo que la convierte en un nivel interesante para observar una reacción.
Un retesteo ahí podría luego ofrecer una buena oportunidad larga para la siguiente expansión al alza. #BTC Price Analysis# #Macro Insights#
Acá tenemos un posible setup de corto que se está formando.
El precio actualmente está desarrollando un patrón de hombros y cabeza bastante limpio justo por encima de una zona clave de soporte.
Si obtenemos una ruptura confirmada por debajo de la línea del cuello/soporte, buscaré un corto apuntando a la región de $1,200–$1,300.
Esa zona coincide con los máximos del rango anterior del que salimos recientemente, lo que la convierte en un nivel interesante para observar una reacción.
Un retesteo ahí podría luego ofrecer una buena oportunidad larga para la siguiente expansión al alza. #BTC Price Analysis# #Macro Insights#
37
·
--
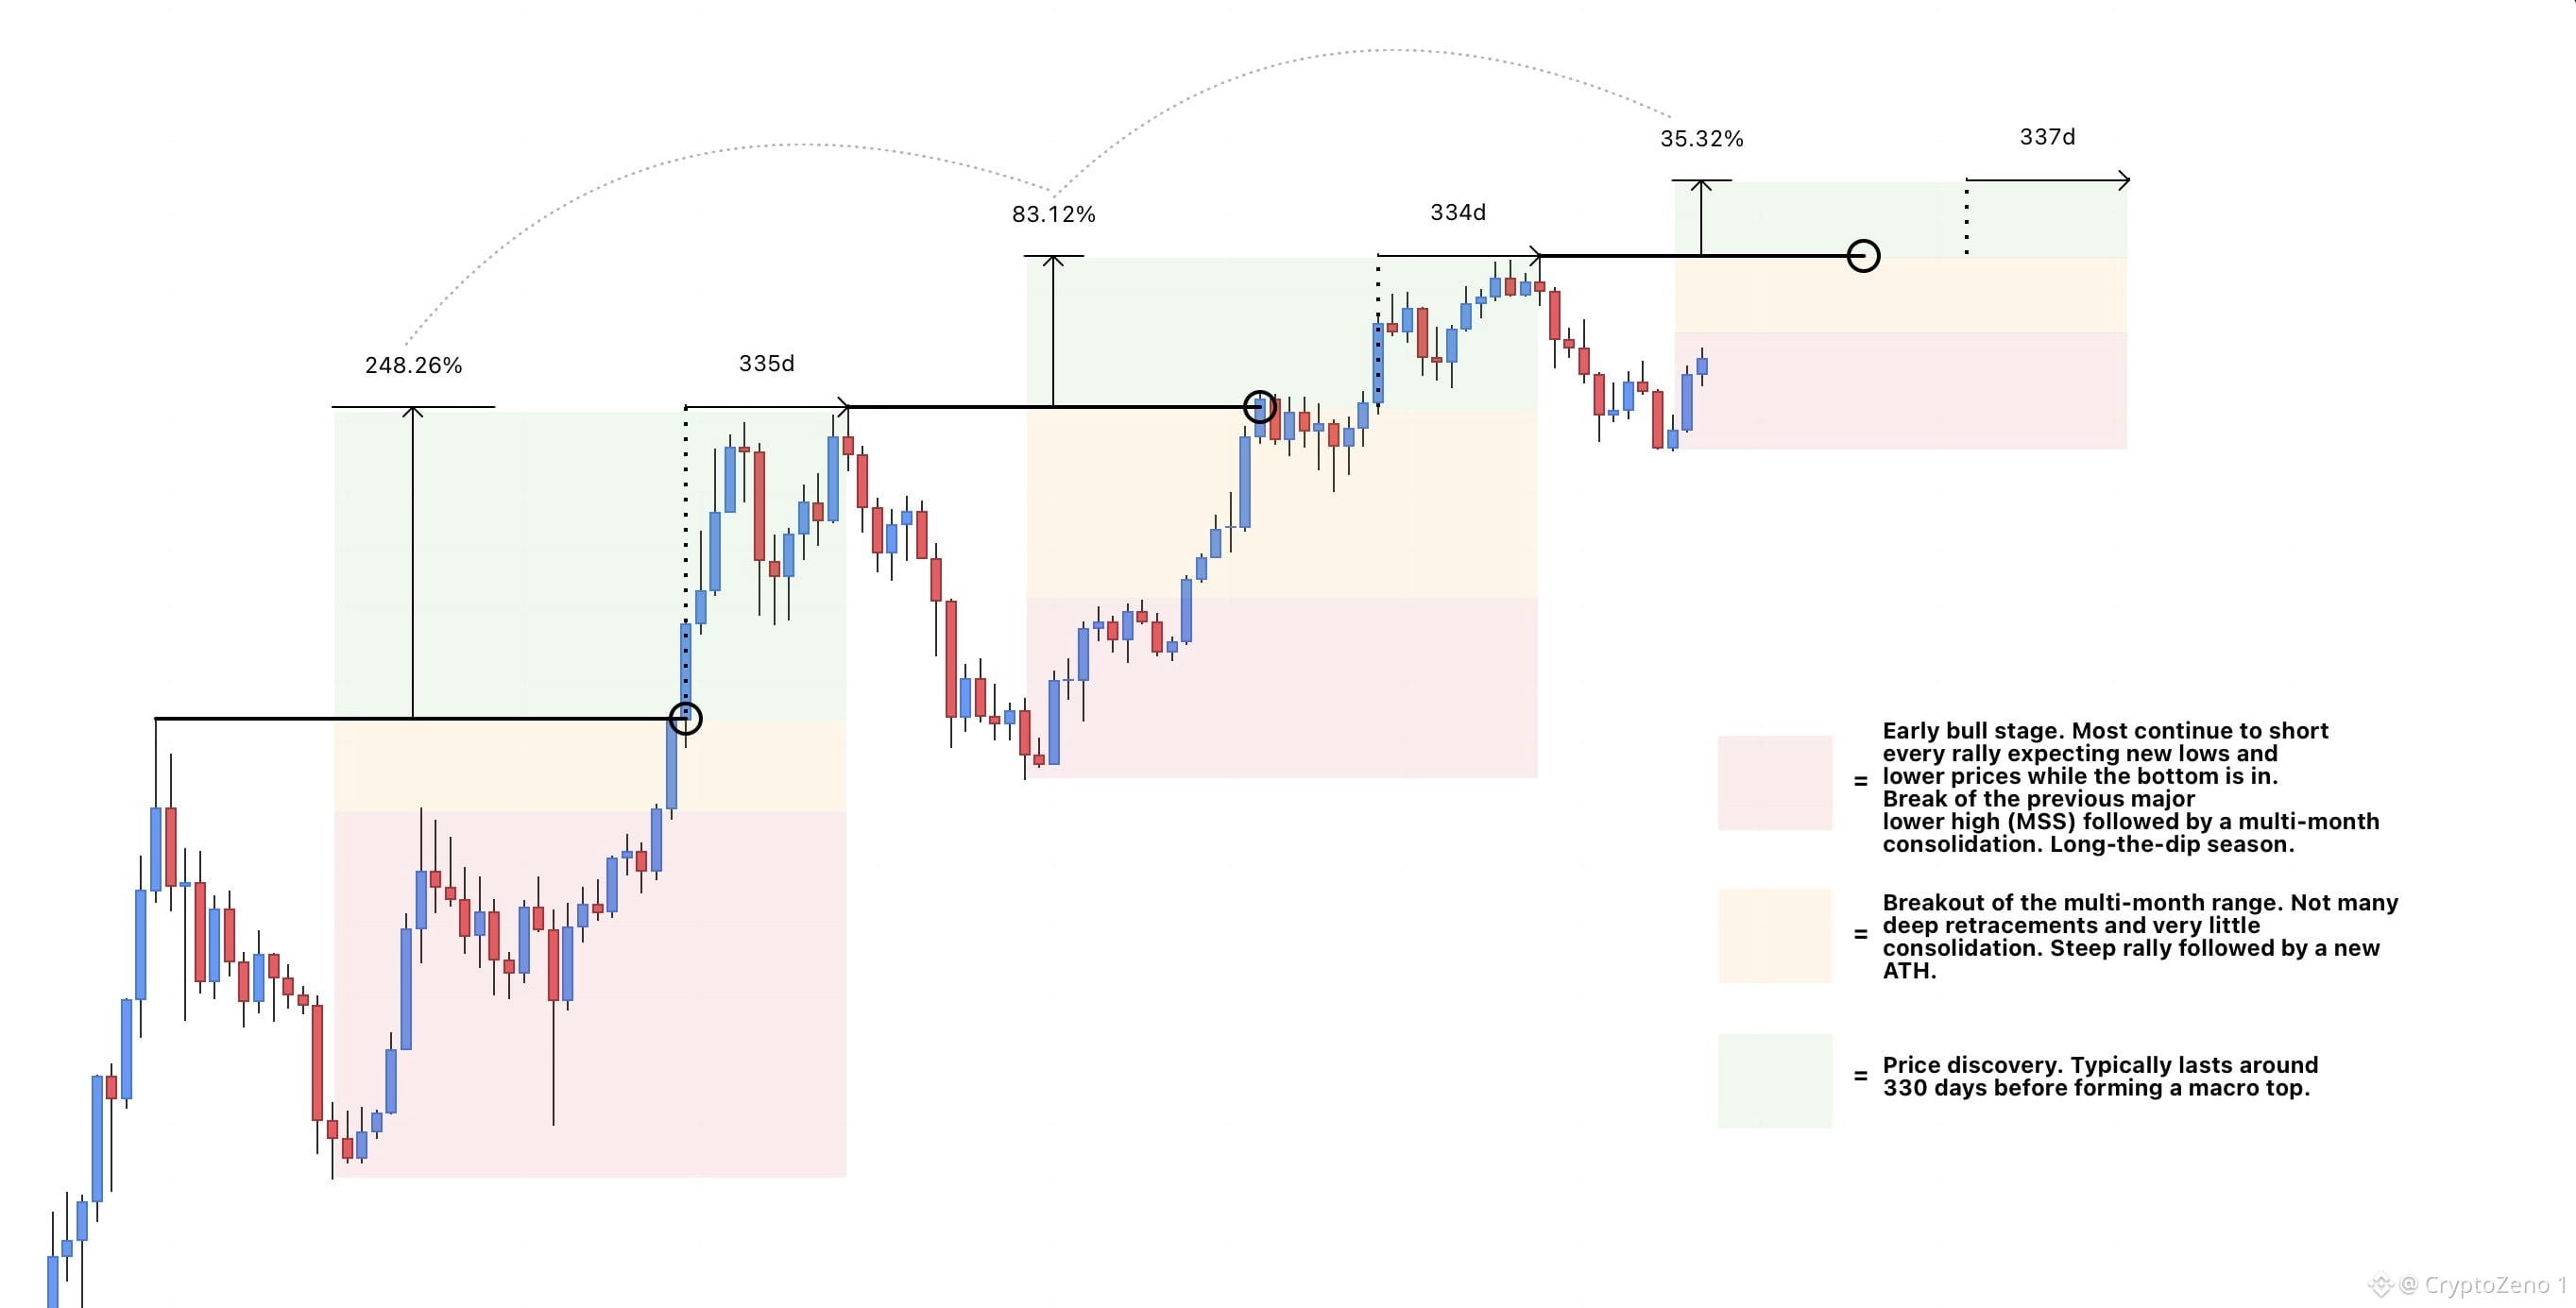
$BTC En retrospectiva será obvio...
Estas etapas son todas iguales, solo evolucionan con cada ciclo.
Aprovecha las caídas y disfruta la subida.🎲 #Análisis del precio de BTC# #Perspectivas macro#
$BTC En retrospectiva será obvio...
Estas etapas son todas iguales, solo evolucionan con cada ciclo.
Aprovecha las caídas y disfruta la subida.🎲 #Análisis del precio de BTC# #Perspectivas macro#
Estas etapas son todas iguales, solo evolucionan con cada ciclo.
Aprovecha las caídas y disfruta la subida.🎲 #Análisis del precio de BTC# #Perspectivas macro#
63
Inicia sesión para explorar más contenidos
Únete a usuarios de criptomonedas de todo el mundo en Binance Square
⚡️ Obtén la información más reciente y útil sobre criptomonedas.
💬 Confía en el mayor exchange de criptomonedas del mundo.
👍 Descubre opiniones reales de creadores verificados.
Correo electrónico/número de teléfono
Temas en tendencia
BinanceLaunchesBinanceIntelligence
160,759 visualizaciones
1,495 participa(n) en el debate
#BinanceLaunchesBinanceIntelligence
🚨 ¡EL MERCADO SE MUEVE RÁPIDO! AI en Binance, Compras Masivas de BTC y Movimientos en XRP 🔥
¿Te diste cuenta de cómo amaneció el mercado hoy? 📊 Las narrativas están cambiando y las grandes instituciones están ejecutando movimientos clave. Aquí te resumo las 3 noticias en tendencia que DEBES seguir de cerca hoy: 👇
1️⃣ #BinanceLaunchesBinanceIntelligence 🤖🤖
Binance acaba de dar un golpe sobre la mesa al lanzar Binance Intelligence, una suite impulsada por Inteligencia Artificial diseñada para revolucionar el trading.
¿Qué incluye? Inteligencia para análisis, Binance AI Pro para convertir tus estrategias en código/flujos ejecutables y Agent OS para desarrolladores.
💡 ¿La IA reemplazará la investigación manual en crypto? Definitivamente es el paso más grande hacia la automatización accesible para todos.
lerya
·2 «Me gusta»
·3k visualizaciones
StriveBuys2000BTCFor$169M
6,858 visualizaciones
68 participa(n) en el debate
EvernorthXRPTreasuryCompletesSPACMerger
95,942 visualizaciones
925 participa(n) en el debate