$BTC
I observed a major macro trendline setup playing out on this Bitcoin weekly chart.
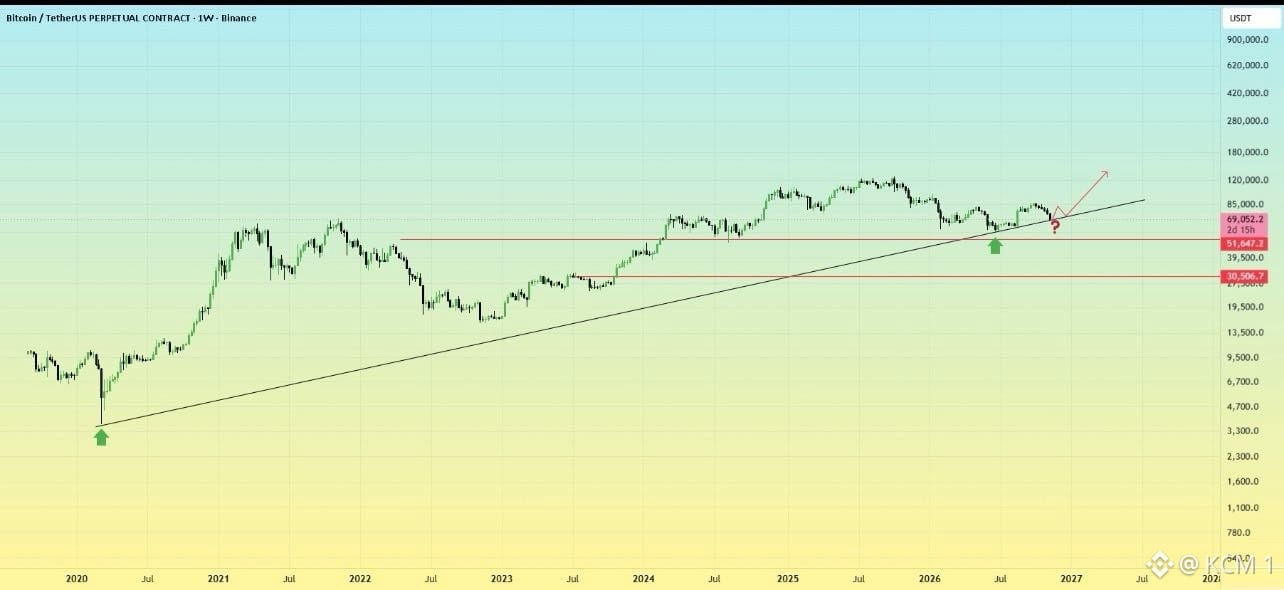
Prices are currently trading around the $69,000 region, testing a critical multi-year ascending trendline that originates from the 2020 lows.
Key horizontal support zones sit below near $51,647 and $30,506, while long-term resistance extends upward toward previous cycle boundaries.
For anyone looking to trade or position around this setup, watching how price action reacts right along this macro trendline is essential.
If the support holds and confirms a bullish bounce (marked by the question mark), it opens up potential upside continuation; however, managing risk tightly below the trendline is crucial in case of a breakdown.
I observed a major macro trendline setup playing out on this Bitcoin weekly chart.
Prices are currently trading around the $69,000 region, testing a critical multi-year ascending trendline that originates from the 2020 lows.
Key horizontal support zones sit below near $51,647 and $30,506, while long-term resistance extends upward toward previous cycle boundaries.
For anyone looking to trade or position around this setup, watching how price action reacts right along this macro trendline is essential.
If the support holds and confirms a bullish bounce (marked by the question mark), it opens up potential upside continuation; however, managing risk tightly below the trendline is crucial in case of a breakdown.