
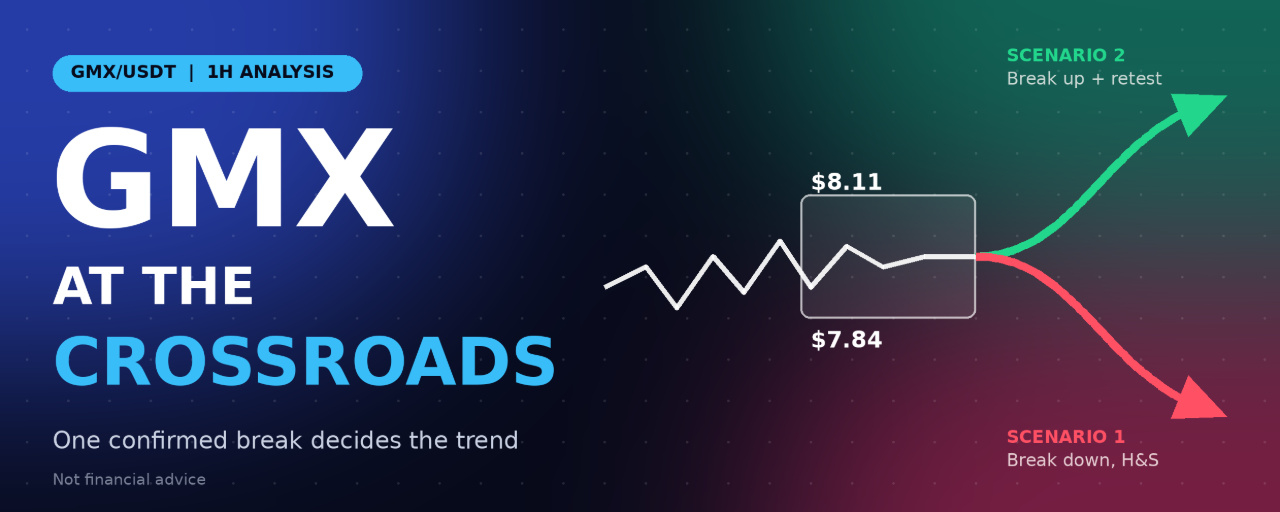


GMX is trading near $7.93, pinned just above a support line that has held since November 2. After a rally to a Higher High near $9.30 and a steady slide of lower highs, price is now squeezed inside a tight box between roughly $7.75 and $8.11. Traders should not guess the direction. The smarter approach is to wait for a confirmed break and trade the reaction. Here are both paths.
What the 1H Chart Is Telling Us
1. A head-and-shoulders style structure is visible. The chart shows a lower high near $8.35, a sharp rally to the Higher High near $9.30 (the head), then a lower high near $8.60 (the right shoulder). The flat green support near $7.84 acts as the neckline. The pattern only counts as confirmed if the neckline breaks.
2. Sellers are in control of the short-term trend. Since the head, the market has printed lower highs and lower lows, with stacked bearish Fair Value Gaps (FVGs) between $8.20 and $9.10 acting as supply. The latest bounce topped near $8.11 and was rejected.
3. Support is being tested repeatedly. Price has touched the $7.84 area several times. Each retest weakens a support level, and a wick already dipped near $7.76 before recovering. Repeated tests often precede a decisive break.
4. The range is the decision zone. The box from about $7.75 to $8.11 shows compression. A confirmed 1H close outside it should start an expansion move in one direction.
Key Levels to Watch
$9.30 – Head (Higher High). Major resistance, far above current price.
$8.60 – Right shoulder (Lower High). Key upside target in a recovery.
$8.11 – Range top. The level bulls must close above.
$7.84 – Neckline and support. The line in the sand.
$7.75 – Range bottom. Wick low and last defense inside the box.
$7.46 – Chart target. First major downside objective if support fails.
Scenario 1: Downside Confirmation (Bearish Head-and-Shoulders Continuation)
If price breaks and closes below support, the pattern is confirmed and the downtrend continues.
Trigger: A 1H candle close below $7.75
Entry: Retest of $7.78 to $7.84 from below, showing rejection (long upper wicks, red 1H close)
Stop loss: $8.02 (back inside the range, above the broken neckline)
Take profit 1: $7.60
Take profit 2: $7.46
Take profit 3: $7.33
Risk to reward on the second target is about 1:2.2 from the middle of the entry zone. The measured move of the pattern (head to neckline, about $1.48) projects a much deeper extension, so consider trailing the stop on the last portion rather than closing everything at once.
Why it works: A neckline break after repeated support tests shows buyers have run out of strength. The retest entry gives a tighter stop than selling the breakdown candle itself.
Scenario 2: Upside Confirmation (Bullish Break With Retracement)
If buyers reclaim the range, the head-and-shoulders idea fails and a recovery toward the lower highs opens up.
Trigger: A 1H candle close above $8.11
Entry: Pullback (retracement) into $8.05 to $8.12 that holds as new support
Stop loss: $7.92 (back inside the range)
Take profit 1: $8.35
Take profit 2: $8.60
Take profit 3: $9.00
Risk to reward on the second target is above 1:3. Be aware that bearish FVGs sit around $8.20 and above, so expect resistance and consider taking partial profit at the first target.
Why it works: Entering on the retest instead of the breakout candle avoids chasing and tests whether the old resistance has truly flipped into support.
Invalidation: When to Step Aside
Scenario 1 is invalid if price closes back above $8.11.
Scenario 2 is invalid if price closes back below $7.84 after breaking out.
If price keeps chopping inside $7.75 to $8.11, there is no edge. Wait for the close.
A wick outside the range that closes back inside is a fake-out, not a confirmation.
Risk Management Rules
Risk 1% to 2% of your account per trade at most.
Always use a stop loss and do not move it further away.
Take partial profits at the first target and shift the stop to break-even.
GMX is a mid-cap altcoin and can move sharply on thin liquidity, so keep leverage low.
Bitcoin leads the market. Check BTC direction before entering any altcoin trade.
Final Thoughts
GMX is at a clear decision point. A close below $7.75 favors the bearish head-and-shoulders continuation toward $7.46 and lower. A close above $8.11 followed by a successful retest favors a recovery toward $8.60. Until one of them happens, patience is the best position. Wait for confirmation, enter on the retest, and let the stop loss protect you.
Disclaimer: This article is for educational and informational purposes only and is not financial advice. Cryptocurrency trading carries a high level of risk and may not be suitable for all investors. Entry and exit levels are based on technical analysis of a single chart and can fail. Always do your own research and never risk more than you can afford to lose.
@Binance Square Official #BinanceReopensWithdrawalsForHYPE&APT #SouthKoreaDraftLawTargets15To20%ShareholderCap #TradFiForBeginners #Binance #ChartSniper