
#chartsniper
chartsniper
109,886 visualizaciones
427 participa(n) en el debate
Populares
Novedades

·
--
Artículo
Ver traducción
ONT/USDT: The Higher Low That Could Flip This Downtrend on Its Head$ONT
{future}(ONTUSDT)
Ontology (ONT) has spent the better part of three sessions grinding lower against Tether, but the 15-minute chart is now showing the first real signs that sellers are losing their grip. After stamping a fresh Lower Low, price has carved out a Higher Low — and that single shift in structure is the crack in the downtrend that traders should be watching closely right now.
Reading the Structure
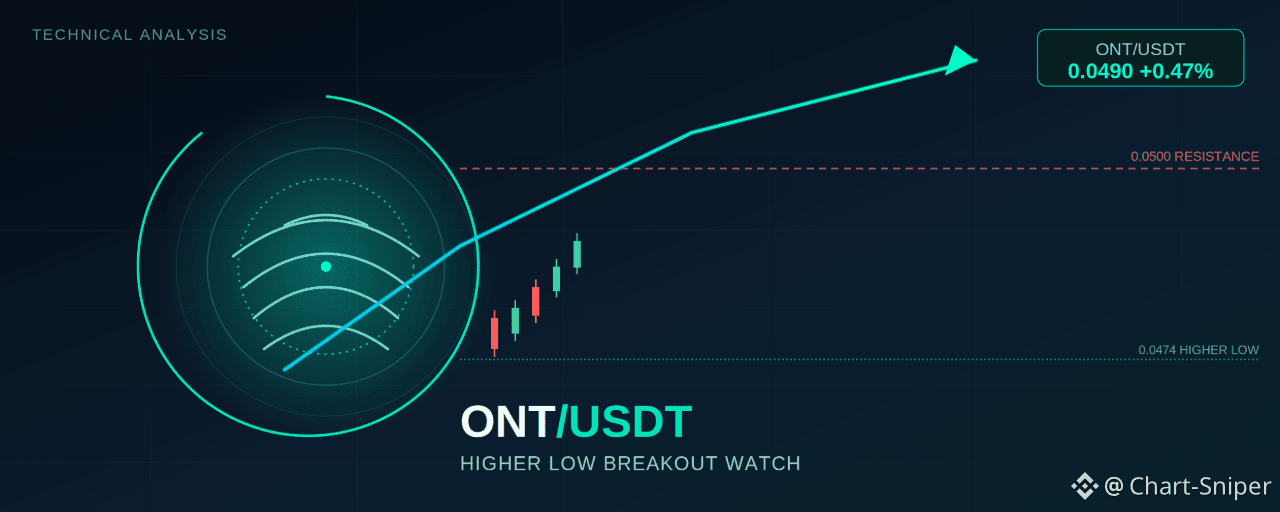
The chart tells a clean story of a fading downtrend. ONT/USDT printed a Lower Low, then rallied into a Lower High, rolled over again into a second Lower High, and finally found buyers at a Higher Low near 0.0474. That HL is the key development — it's the first sign in this sequence that sellers are no longer able to push price to a new floor.
Since that Higher Low, ONT has been building a tight base directly beneath a horizontal resistance shelf sitting between 0.0493 and 0.0500. A descending trendline connecting the two Lower Highs is converging on that same zone, creating a confluence of resistance right around current price. This is effectively a compression zone: a falling trendline pressing down, a horizontal ceiling capping upside, and a rising floor of higher lows pushing from below. Squeezes like this typically resolve with a decisive move, and right now momentum is leaning in the bulls' favor.
Momentum Confirms the Shift
RSI (14) is sitting at 60.95, with its moving average at 55.12 — both comfortably above the 50 midline and both sloping upward. That's a meaningful tell. During the initial leg down, RSI was pinned well below 50; the fact that it's now pushing into bullish territory alongside the Higher Low adds confluence to the idea that buyers are stepping back in rather than this being a dead-cat bounce.
Price last traded at 0.04901, up 0.47% on the session, and is currently pressing directly into the 0.0493 level — the lower boundary of the resistance shelf and, not coincidentally, right where the descending trendline is also cutting through.
Trade Setup
The bullish case: A clean breakout and hold above the 0.0493–0.0500 resistance shelf, especially if it comes with a retest that holds as new support, would confirm the downtrend is broken and open the door for a move back toward the origin of the last Lower High swing.
Aggressive entry: 0.0493–0.0496, on strength through the shelf with RSI staying above 55Conservative entry: 0.0500–0.0505, on a confirmed close above the resistance zone with a successful retest of 0.0500 as supportStop-loss: Below 0.0474 (beneath the Higher Low) — a break back under this level invalidates the reversal structure entirelyTarget 1: 0.0520Target 2: 0.0540 (near the origin of the prior Lower High swing)Target 3 (extended): 0.0570, only on strong volume follow-through
The bearish case: If price gets rejected at the 0.0493–0.0500 confluence zone again — this would be at least the third rejection from this general area — the descending trendline stays in control, and a retest of the 0.0474 Higher Low, followed by a break of it, would resume the broader downtrend toward new lows.
Short trigger: Rejection candle at 0.0495–0.0500 with RSI turning back down through 55Stop-loss: Above 0.0505Target 1: 0.0474Target 2: 0.0450 (measured move of the recent range)
The Bottom Line
ONT/USDT is at a genuine inflection point. The Higher Low plus rising RSI gives the bulls the benefit of the doubt short-term, but the 0.0493–0.0500 zone is a real wall that has already capped two prior rallies via the descending trendline. Watch how price behaves right at this level over the next few candles — a decisive close above 0.0500 is the confirmation bulls need, while continued rejection keeps this range-bound and tilts risk back toward the downside.
This analysis is based on technical chart structure and is for informational purposes only. It is not financial advice. Cryptocurrency markets are highly volatile — always do your own research and manage risk according to your own trading plan before entering any position.
@Binance_Square_Official #FedRateWatch #ZcashRises6% #XRPSinks10% #Binance #ChartSniper
ONT/USDT: The Higher Low That Could Flip This Downtrend on Its Head
$ONT
Ontology (ONT) has spent the better part of three sessions grinding lower against Tether, but the 15-minute chart is now showing the first real signs that sellers are losing their grip. After stamping a fresh Lower Low, price has carved out a Higher Low — and that single shift in structure is the crack in the downtrend that traders should be watching closely right now.
Reading the Structure
The chart tells a clean story of a fading downtrend. ONT/USDT printed a Lower Low, then rallied into a Lower High, rolled over again into a second Lower High, and finally found buyers at a Higher Low near 0.0474. That HL is the key development — it's the first sign in this sequence that sellers are no longer able to push price to a new floor.
Since that Higher Low, ONT has been building a tight base directly beneath a horizontal resistance shelf sitting between 0.0493 and 0.0500. A descending trendline connecting the two Lower Highs is converging on that same zone, creating a confluence of resistance right around current price. This is effectively a compression zone: a falling trendline pressing down, a horizontal ceiling capping upside, and a rising floor of higher lows pushing from below. Squeezes like this typically resolve with a decisive move, and right now momentum is leaning in the bulls' favor.
Momentum Confirms the Shift
RSI (14) is sitting at 60.95, with its moving average at 55.12 — both comfortably above the 50 midline and both sloping upward. That's a meaningful tell. During the initial leg down, RSI was pinned well below 50; the fact that it's now pushing into bullish territory alongside the Higher Low adds confluence to the idea that buyers are stepping back in rather than this being a dead-cat bounce.
Price last traded at 0.04901, up 0.47% on the session, and is currently pressing directly into the 0.0493 level — the lower boundary of the resistance shelf and, not coincidentally, right where the descending trendline is also cutting through.
Trade Setup
The bullish case: A clean breakout and hold above the 0.0493–0.0500 resistance shelf, especially if it comes with a retest that holds as new support, would confirm the downtrend is broken and open the door for a move back toward the origin of the last Lower High swing.
Aggressive entry: 0.0493–0.0496, on strength through the shelf with RSI staying above 55Conservative entry: 0.0500–0.0505, on a confirmed close above the resistance zone with a successful retest of 0.0500 as supportStop-loss: Below 0.0474 (beneath the Higher Low) — a break back under this level invalidates the reversal structure entirelyTarget 1: 0.0520Target 2: 0.0540 (near the origin of the prior Lower High swing)Target 3 (extended): 0.0570, only on strong volume follow-through
The bearish case: If price gets rejected at the 0.0493–0.0500 confluence zone again — this would be at least the third rejection from this general area — the descending trendline stays in control, and a retest of the 0.0474 Higher Low, followed by a break of it, would resume the broader downtrend toward new lows.
Short trigger: Rejection candle at 0.0495–0.0500 with RSI turning back down through 55Stop-loss: Above 0.0505Target 1: 0.0474Target 2: 0.0450 (measured move of the recent range)
The Bottom Line
ONT/USDT is at a genuine inflection point. The Higher Low plus rising RSI gives the bulls the benefit of the doubt short-term, but the 0.0493–0.0500 zone is a real wall that has already capped two prior rallies via the descending trendline. Watch how price behaves right at this level over the next few candles — a decisive close above 0.0500 is the confirmation bulls need, while continued rejection keeps this range-bound and tilts risk back toward the downside.
This analysis is based on technical chart structure and is for informational purposes only. It is not financial advice. Cryptocurrency markets are highly volatile — always do your own research and manage risk according to your own trading plan before entering any position.
@Binance Square Official #FedRateWatch #ZcashRises6% #XRPSinks10% #Binance #ChartSniper
Ontology (ONT) has spent the better part of three sessions grinding lower against Tether, but the 15-minute chart is now showing the first real signs that sellers are losing their grip. After stamping a fresh Lower Low, price has carved out a Higher Low — and that single shift in structure is the crack in the downtrend that traders should be watching closely right now.
Reading the Structure
The chart tells a clean story of a fading downtrend. ONT/USDT printed a Lower Low, then rallied into a Lower High, rolled over again into a second Lower High, and finally found buyers at a Higher Low near 0.0474. That HL is the key development — it's the first sign in this sequence that sellers are no longer able to push price to a new floor.
Since that Higher Low, ONT has been building a tight base directly beneath a horizontal resistance shelf sitting between 0.0493 and 0.0500. A descending trendline connecting the two Lower Highs is converging on that same zone, creating a confluence of resistance right around current price. This is effectively a compression zone: a falling trendline pressing down, a horizontal ceiling capping upside, and a rising floor of higher lows pushing from below. Squeezes like this typically resolve with a decisive move, and right now momentum is leaning in the bulls' favor.
Momentum Confirms the Shift
RSI (14) is sitting at 60.95, with its moving average at 55.12 — both comfortably above the 50 midline and both sloping upward. That's a meaningful tell. During the initial leg down, RSI was pinned well below 50; the fact that it's now pushing into bullish territory alongside the Higher Low adds confluence to the idea that buyers are stepping back in rather than this being a dead-cat bounce.
Price last traded at 0.04901, up 0.47% on the session, and is currently pressing directly into the 0.0493 level — the lower boundary of the resistance shelf and, not coincidentally, right where the descending trendline is also cutting through.
Trade Setup
The bullish case: A clean breakout and hold above the 0.0493–0.0500 resistance shelf, especially if it comes with a retest that holds as new support, would confirm the downtrend is broken and open the door for a move back toward the origin of the last Lower High swing.
Aggressive entry: 0.0493–0.0496, on strength through the shelf with RSI staying above 55Conservative entry: 0.0500–0.0505, on a confirmed close above the resistance zone with a successful retest of 0.0500 as supportStop-loss: Below 0.0474 (beneath the Higher Low) — a break back under this level invalidates the reversal structure entirelyTarget 1: 0.0520Target 2: 0.0540 (near the origin of the prior Lower High swing)Target 3 (extended): 0.0570, only on strong volume follow-through
The bearish case: If price gets rejected at the 0.0493–0.0500 confluence zone again — this would be at least the third rejection from this general area — the descending trendline stays in control, and a retest of the 0.0474 Higher Low, followed by a break of it, would resume the broader downtrend toward new lows.
Short trigger: Rejection candle at 0.0495–0.0500 with RSI turning back down through 55Stop-loss: Above 0.0505Target 1: 0.0474Target 2: 0.0450 (measured move of the recent range)
The Bottom Line
ONT/USDT is at a genuine inflection point. The Higher Low plus rising RSI gives the bulls the benefit of the doubt short-term, but the 0.0493–0.0500 zone is a real wall that has already capped two prior rallies via the descending trendline. Watch how price behaves right at this level over the next few candles — a decisive close above 0.0500 is the confirmation bulls need, while continued rejection keeps this range-bound and tilts risk back toward the downside.
This analysis is based on technical chart structure and is for informational purposes only. It is not financial advice. Cryptocurrency markets are highly volatile — always do your own research and manage risk according to your own trading plan before entering any position.
@Binance Square Official #FedRateWatch #ZcashRises6% #XRPSinks10% #Binance #ChartSniper
56
·
--
Artículo
AGLD/USDT Se Mantiene Encima de una Tendencia Alcista — ¿Adventure Gold Está Consolidando Silenciosamente para un Movimiento?$AGLD
Gráfico de 1H | Binance Spot | AGLDUSDT | 16 de septiembre de 2026
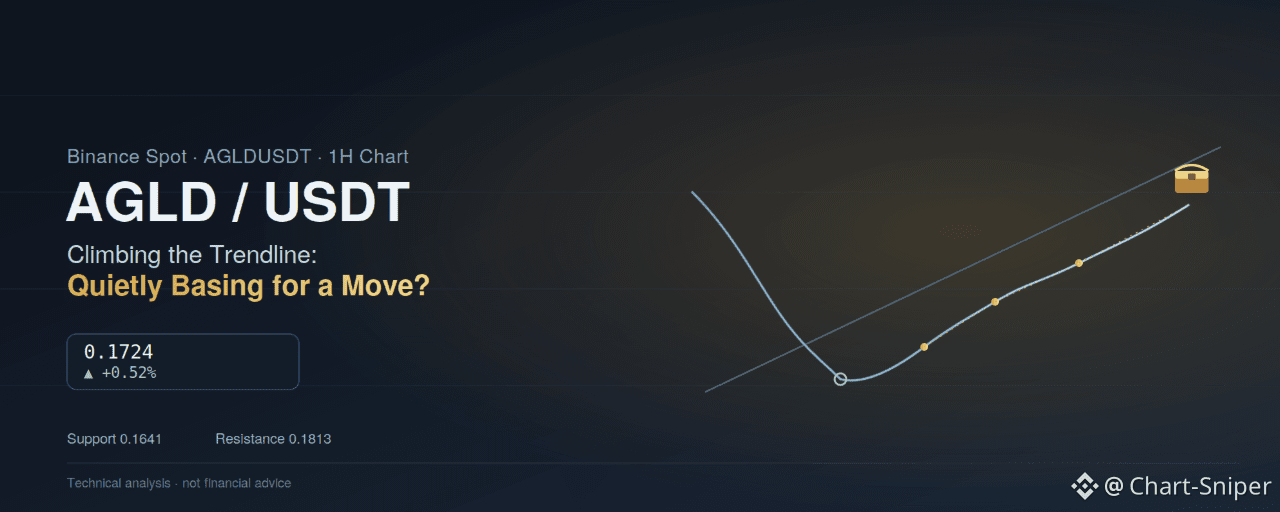
Adventure Gold (AGLD) cotiza a 0.1724, con una subida modesta de +0.52% en la sesión después de abrir en 0.1716 y moverse en un rango entre 0.1716 y 0.1729. En comparación con configuraciones más agudas y explosivas en otras partes del tablero en este momento, el gráfico de AGLD está más tranquilo: pero debajo de esa calma hay una estructura que merece la pena vigilar. Se trata de un token que cayó con fuerza desde un máximo reciente, encontró un suelo y ha pasado el último día y medio subiendo lentamente desde una línea de tendencia defendida, acercándose de nuevo a la resistencia que frenó su último rebote.
AGLD/USDT Se Mantiene Encima de una Tendencia Alcista — ¿Adventure Gold Está Consolidando Silenciosamente para un Movimiento?
$AGLD
Gráfico de 1H | Binance Spot | AGLDUSDT | 16 de septiembre de 2026
Adventure Gold (AGLD) cotiza a 0.1724, con una subida modesta de +0.52% en la sesión después de abrir en 0.1716 y moverse en un rango entre 0.1716 y 0.1729. En comparación con configuraciones más agudas y explosivas en otras partes del tablero en este momento, el gráfico de AGLD está más tranquilo: pero debajo de esa calma hay una estructura que merece la pena vigilar. Se trata de un token que cayó con fuerza desde un máximo reciente, encontró un suelo y ha pasado el último día y medio subiendo lentamente desde una línea de tendencia defendida, acercándose de nuevo a la resistencia que frenó su último rebote.
Gráfico de 1H | Binance Spot | AGLDUSDT | 16 de septiembre de 2026
Adventure Gold (AGLD) cotiza a 0.1724, con una subida modesta de +0.52% en la sesión después de abrir en 0.1716 y moverse en un rango entre 0.1716 y 0.1729. En comparación con configuraciones más agudas y explosivas en otras partes del tablero en este momento, el gráfico de AGLD está más tranquilo: pero debajo de esa calma hay una estructura que merece la pena vigilar. Se trata de un token que cayó con fuerza desde un máximo reciente, encontró un suelo y ha pasado el último día y medio subiendo lentamente desde una línea de tendencia defendida, acercándose de nuevo a la resistencia que frenó su último rebote.
37
·
--
Artículo
HEI/USDT Se dispara saliendo de una base de varios días — ¿Puede el canal seguir escalando?$HEI
Gráfico 15M | Binance Perpetual | HEIUSDT | 16 de septiembre de 2026
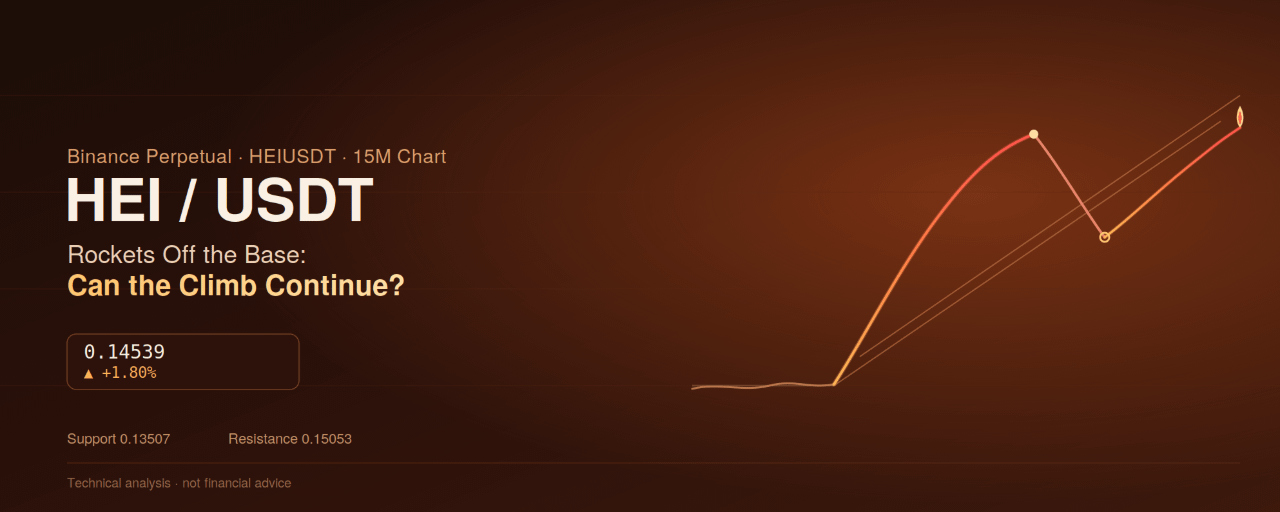
Heima (HEI) cotiza a 0.14539, con una subida marcada de +1.80% en la sesión después de abrir en 0.14282 y moverse entre 0.14143 y 0.14608. Ese número diario apenas refleja la magnitud de lo ocurrido en las últimas 24 horas: HEI ha salido de una base larga y plana y se ha vuelto casi parabólico, con una subida de más del 30% desde los mínimos de la sesión inicial hasta un nuevo máximo antes de enfriarse con un retroceso típico de manual, que ahora está resolviéndose de nuevo al alza.
HEI/USDT Se dispara saliendo de una base de varios días — ¿Puede el canal seguir escalando?
$HEI
Gráfico 15M | Binance Perpetual | HEIUSDT | 16 de septiembre de 2026
Heima (HEI) cotiza a 0.14539, con una subida marcada de +1.80% en la sesión después de abrir en 0.14282 y moverse entre 0.14143 y 0.14608. Ese número diario apenas refleja la magnitud de lo ocurrido en las últimas 24 horas: HEI ha salido de una base larga y plana y se ha vuelto casi parabólico, con una subida de más del 30% desde los mínimos de la sesión inicial hasta un nuevo máximo antes de enfriarse con un retroceso típico de manual, que ahora está resolviéndose de nuevo al alza.
Gráfico 15M | Binance Perpetual | HEIUSDT | 16 de septiembre de 2026
Heima (HEI) cotiza a 0.14539, con una subida marcada de +1.80% en la sesión después de abrir en 0.14282 y moverse entre 0.14143 y 0.14608. Ese número diario apenas refleja la magnitud de lo ocurrido en las últimas 24 horas: HEI ha salido de una base larga y plana y se ha vuelto casi parabólico, con una subida de más del 30% desde los mínimos de la sesión inicial hasta un nuevo máximo antes de enfriarse con un retroceso típico de manual, que ahora está resolviéndose de nuevo al alza.
113
·
--
Artículo
Ver traducción
LA/USDT Climbs Inside a Rising Channel — Is the Next Breakout Already Loading?$LA
{future}(LAUSDT)
15M Chart | Binance Perpetual | LAUSDT | September 16, 2026
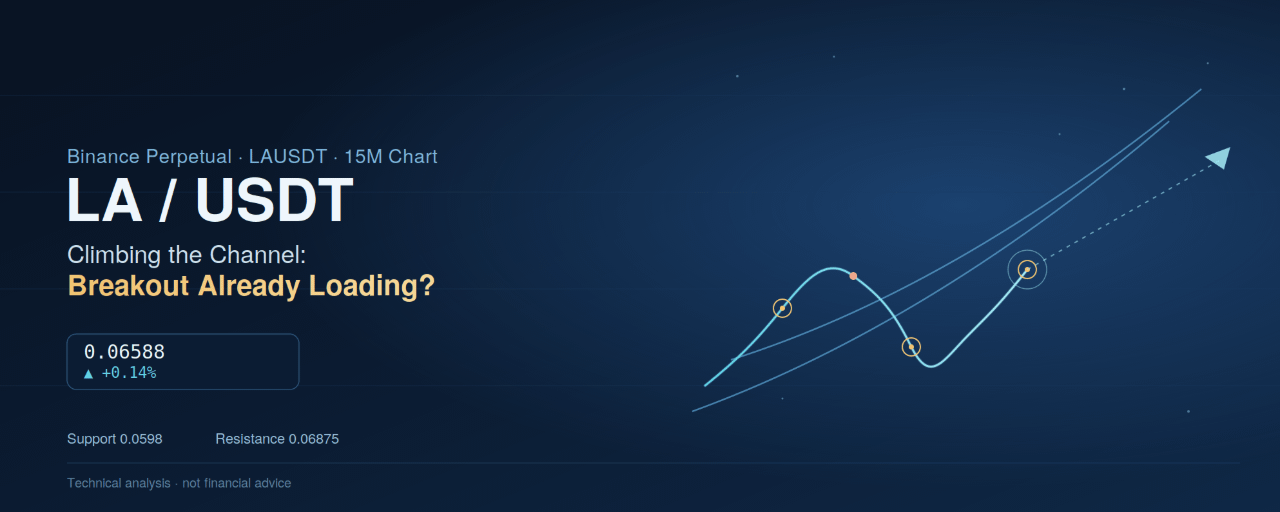
Lagrange (LA) is trading at 0.06588, up a modest +0.14% on the session after opening at 0.06578 and ranging between a high of 0.06597 and a low of 0.06561. The daily candle looks flat, but the structure underneath is anything but static — after a sharp two-day selloff earlier in the week, LA has spent the last day and a half building a genuine rising channel, bouncing off its lower rail for a third time as it grinds back toward the resistance that capped its last rally attempt.
Reading the Structure
The move starts with a volatile spike into a higher high near 0.0741 on September 14, followed almost immediately by a sharp pullback into the low-0.065 zone, a second push to a fresh high near 0.0738, and then a hard reversal that broke the prior structure entirely — dropping LA all the way down to a base near 0.0598 by September 16. That decline wiped out more than 19% from the September 15 high in under a day, a capitulation-style flush that often marks exhaustion on the sell side.
From that low, LA has been climbing inside a well-defined ascending channel, marked by two parallel rising trendlines on the chart. Price pushed up sharply to a lower high near 0.0687, tagging the horizontal resistance at 0.06875 almost exactly, before rolling over and sliding back down to retest the lower rail of the channel. That retest is happening right now — LA has bounced off the lower trendline and is pushing back up toward 0.06588, the third clean touch of that rising support line since the base formed.
RSI (14) reflects the choppy but improving picture: it dipped toward 30 during the capitulation low, spiked to nearly 75 on the rally into the 0.0687 high, and has since cooled to a more neutral 61.45 (signal at 48.10) — elevated but not overbought, consistent with a market still finding its footing inside an uptrend rather than exhausting it.
Key Levels to Watch
Major resistance: 0.06875 — the horizontal level that capped the last rally and the lower-high on the chart; this is the level that needs to break for LA to make a genuine run at the September highs.Extended resistance: 0.0738 – 0.0741 — the prior swing highs from September 14-15; a much bigger target if 0.06875 clears with volume.Immediate support: the rising lower channel trendline, currently tracking through roughly 0.0640–0.0650 and rising.Major support / invalidation: 0.0598 — the base of the entire recovery structure; a clean break below this with volume would undo the channel thesis and open a retest of lower levels.Midline support: the horizontal 0.0651 level (the prior lower-low pivot), which sits inside the channel and can act as a secondary cushion on dips.
Two Ways to Approach the Trade
1. Channel support bounce (favored, trend-aligned): Buying the current bounce off the lower trendline, near where price is sitting right now, offers a defined-risk way to play the continuation of the channel.
Entry zone: 0.0655 – 0.0665Stop-loss: below 0.0640 (below the rising trendline and the 0.0651 pivot)Target 1: 0.0687Target 2: 0.0738, on a confirmed break of the 0.06875 resistance
2. Breakout continuation (momentum play): For traders who want confirmation first, a sustained close above 0.06875 with rising volume would validate that the channel is resolving higher rather than just oscillating inside it.
Entry trigger: sustained close above 0.06875Stop-loss: 0.0665 (back inside the channel)Target 1: 0.0710Target 2: 0.0738 – 0.0741 (prior swing highs)
Given that this is the third respected touch of the rising trendline and RSI has stayed constructive through each dip, the setup favors continuation — but 0.06875 remains the level standing between a healthy channel and a confirmed breakout toward the September highs.
Next Gainer?
LA's price action since the 0.0598 base has been a clean, repeatable pattern: higher lows on every trendline touch, RSI holding above neutral, and a resistance level being retested with increasing conviction. That kind of coiling structure often precedes a decisive move once it resolves. If LA holds the channel and clears 0.06875 with volume, it has a credible path back toward the 0.0738–0.0741 highs, putting it firmly in the conversation for a short-term mover. The key risk is the channel itself — a break of the lower trendline and the 0.0598 base would flip the bias back toward consolidation or renewed downside.
This is not financial advice. Crypto perpetual contracts are highly leveraged, highly volatile instruments, and prices can move sharply against a position in minutes. Always do your own research, size positions responsibly, and use stop-losses before entering any trade.
@Binance_Square_Official #FedRateWatch #ZcashRises6% #XRPSinks10% #Binance #ChartSniper
LA/USDT Climbs Inside a Rising Channel — Is the Next Breakout Already Loading?
$LA
15M Chart | Binance Perpetual | LAUSDT | September 16, 2026
Lagrange (LA) is trading at 0.06588, up a modest +0.14% on the session after opening at 0.06578 and ranging between a high of 0.06597 and a low of 0.06561. The daily candle looks flat, but the structure underneath is anything but static — after a sharp two-day selloff earlier in the week, LA has spent the last day and a half building a genuine rising channel, bouncing off its lower rail for a third time as it grinds back toward the resistance that capped its last rally attempt.
Reading the Structure
The move starts with a volatile spike into a higher high near 0.0741 on September 14, followed almost immediately by a sharp pullback into the low-0.065 zone, a second push to a fresh high near 0.0738, and then a hard reversal that broke the prior structure entirely — dropping LA all the way down to a base near 0.0598 by September 16. That decline wiped out more than 19% from the September 15 high in under a day, a capitulation-style flush that often marks exhaustion on the sell side.
From that low, LA has been climbing inside a well-defined ascending channel, marked by two parallel rising trendlines on the chart. Price pushed up sharply to a lower high near 0.0687, tagging the horizontal resistance at 0.06875 almost exactly, before rolling over and sliding back down to retest the lower rail of the channel. That retest is happening right now — LA has bounced off the lower trendline and is pushing back up toward 0.06588, the third clean touch of that rising support line since the base formed.
RSI (14) reflects the choppy but improving picture: it dipped toward 30 during the capitulation low, spiked to nearly 75 on the rally into the 0.0687 high, and has since cooled to a more neutral 61.45 (signal at 48.10) — elevated but not overbought, consistent with a market still finding its footing inside an uptrend rather than exhausting it.
Key Levels to Watch
Major resistance: 0.06875 — the horizontal level that capped the last rally and the lower-high on the chart; this is the level that needs to break for LA to make a genuine run at the September highs.Extended resistance: 0.0738 – 0.0741 — the prior swing highs from September 14-15; a much bigger target if 0.06875 clears with volume.Immediate support: the rising lower channel trendline, currently tracking through roughly 0.0640–0.0650 and rising.Major support / invalidation: 0.0598 — the base of the entire recovery structure; a clean break below this with volume would undo the channel thesis and open a retest of lower levels.Midline support: the horizontal 0.0651 level (the prior lower-low pivot), which sits inside the channel and can act as a secondary cushion on dips.
Two Ways to Approach the Trade
1. Channel support bounce (favored, trend-aligned): Buying the current bounce off the lower trendline, near where price is sitting right now, offers a defined-risk way to play the continuation of the channel.
Entry zone: 0.0655 – 0.0665Stop-loss: below 0.0640 (below the rising trendline and the 0.0651 pivot)Target 1: 0.0687Target 2: 0.0738, on a confirmed break of the 0.06875 resistance
2. Breakout continuation (momentum play): For traders who want confirmation first, a sustained close above 0.06875 with rising volume would validate that the channel is resolving higher rather than just oscillating inside it.
Entry trigger: sustained close above 0.06875Stop-loss: 0.0665 (back inside the channel)Target 1: 0.0710Target 2: 0.0738 – 0.0741 (prior swing highs)
Given that this is the third respected touch of the rising trendline and RSI has stayed constructive through each dip, the setup favors continuation — but 0.06875 remains the level standing between a healthy channel and a confirmed breakout toward the September highs.
Next Gainer?
LA's price action since the 0.0598 base has been a clean, repeatable pattern: higher lows on every trendline touch, RSI holding above neutral, and a resistance level being retested with increasing conviction. That kind of coiling structure often precedes a decisive move once it resolves. If LA holds the channel and clears 0.06875 with volume, it has a credible path back toward the 0.0738–0.0741 highs, putting it firmly in the conversation for a short-term mover. The key risk is the channel itself — a break of the lower trendline and the 0.0598 base would flip the bias back toward consolidation or renewed downside.
This is not financial advice. Crypto perpetual contracts are highly leveraged, highly volatile instruments, and prices can move sharply against a position in minutes. Always do your own research, size positions responsibly, and use stop-losses before entering any trade.
@Binance Square Official #FedRateWatch #ZcashRises6% #XRPSinks10% #Binance #ChartSniper
15M Chart | Binance Perpetual | LAUSDT | September 16, 2026
Lagrange (LA) is trading at 0.06588, up a modest +0.14% on the session after opening at 0.06578 and ranging between a high of 0.06597 and a low of 0.06561. The daily candle looks flat, but the structure underneath is anything but static — after a sharp two-day selloff earlier in the week, LA has spent the last day and a half building a genuine rising channel, bouncing off its lower rail for a third time as it grinds back toward the resistance that capped its last rally attempt.
Reading the Structure
The move starts with a volatile spike into a higher high near 0.0741 on September 14, followed almost immediately by a sharp pullback into the low-0.065 zone, a second push to a fresh high near 0.0738, and then a hard reversal that broke the prior structure entirely — dropping LA all the way down to a base near 0.0598 by September 16. That decline wiped out more than 19% from the September 15 high in under a day, a capitulation-style flush that often marks exhaustion on the sell side.
From that low, LA has been climbing inside a well-defined ascending channel, marked by two parallel rising trendlines on the chart. Price pushed up sharply to a lower high near 0.0687, tagging the horizontal resistance at 0.06875 almost exactly, before rolling over and sliding back down to retest the lower rail of the channel. That retest is happening right now — LA has bounced off the lower trendline and is pushing back up toward 0.06588, the third clean touch of that rising support line since the base formed.
RSI (14) reflects the choppy but improving picture: it dipped toward 30 during the capitulation low, spiked to nearly 75 on the rally into the 0.0687 high, and has since cooled to a more neutral 61.45 (signal at 48.10) — elevated but not overbought, consistent with a market still finding its footing inside an uptrend rather than exhausting it.
Key Levels to Watch
Major resistance: 0.06875 — the horizontal level that capped the last rally and the lower-high on the chart; this is the level that needs to break for LA to make a genuine run at the September highs.Extended resistance: 0.0738 – 0.0741 — the prior swing highs from September 14-15; a much bigger target if 0.06875 clears with volume.Immediate support: the rising lower channel trendline, currently tracking through roughly 0.0640–0.0650 and rising.Major support / invalidation: 0.0598 — the base of the entire recovery structure; a clean break below this with volume would undo the channel thesis and open a retest of lower levels.Midline support: the horizontal 0.0651 level (the prior lower-low pivot), which sits inside the channel and can act as a secondary cushion on dips.
Two Ways to Approach the Trade
1. Channel support bounce (favored, trend-aligned): Buying the current bounce off the lower trendline, near where price is sitting right now, offers a defined-risk way to play the continuation of the channel.
Entry zone: 0.0655 – 0.0665Stop-loss: below 0.0640 (below the rising trendline and the 0.0651 pivot)Target 1: 0.0687Target 2: 0.0738, on a confirmed break of the 0.06875 resistance
2. Breakout continuation (momentum play): For traders who want confirmation first, a sustained close above 0.06875 with rising volume would validate that the channel is resolving higher rather than just oscillating inside it.
Entry trigger: sustained close above 0.06875Stop-loss: 0.0665 (back inside the channel)Target 1: 0.0710Target 2: 0.0738 – 0.0741 (prior swing highs)
Given that this is the third respected touch of the rising trendline and RSI has stayed constructive through each dip, the setup favors continuation — but 0.06875 remains the level standing between a healthy channel and a confirmed breakout toward the September highs.
Next Gainer?
LA's price action since the 0.0598 base has been a clean, repeatable pattern: higher lows on every trendline touch, RSI holding above neutral, and a resistance level being retested with increasing conviction. That kind of coiling structure often precedes a decisive move once it resolves. If LA holds the channel and clears 0.06875 with volume, it has a credible path back toward the 0.0738–0.0741 highs, putting it firmly in the conversation for a short-term mover. The key risk is the channel itself — a break of the lower trendline and the 0.0598 base would flip the bias back toward consolidation or renewed downside.
This is not financial advice. Crypto perpetual contracts are highly leveraged, highly volatile instruments, and prices can move sharply against a position in minutes. Always do your own research, size positions responsibly, and use stop-losses before entering any trade.
@Binance Square Official #FedRateWatch #ZcashRises6% #XRPSinks10% #Binance #ChartSniper
125
·
--
📉 $ZEC USDT — CONFIGURACIÓN CORTA
ZEC está alrededor de $1,178–$1,217, después de una corrección reciente y pronunciada desde arriba de $1,200. El impulso se mantiene volátil, con vendedores activos después de la reversión.
🔴 ENTRADA CORTA: Precio de mercado
🛑 SL: $1,300
🎯 TP1: $1,100
🎯 TP2: $1,020
🎯 TP3: $950
⚡ Entrada: Precio de mercado — ejecutable ahora.
⚠️ No es asesoramiento financiero. Gestiona el riesgo con cuidado.
@Binance_Square_Official #FedRateWatch #ZcashRises6% #XRPSinks10% #Binance #ChartSniper
{future}(ZECUSDT)
📉 $ZEC USDT — CONFIGURACIÓN CORTA
ZEC está alrededor de $1,178–$1,217, después de una corrección reciente y pronunciada desde arriba de $1,200. El impulso se mantiene volátil, con vendedores activos después de la reversión.
🔴 ENTRADA CORTA: Precio de mercado
🛑 SL: $1,300
🎯 TP1: $1,100
🎯 TP2: $1,020
🎯 TP3: $950
⚡ Entrada: Precio de mercado — ejecutable ahora.
⚠️ No es asesoramiento financiero. Gestiona el riesgo con cuidado.
@Binance Square Official #FedRateWatch #ZcashRises6% #XRPSinks10% #Binance #ChartSniper
ZEC está alrededor de $1,178–$1,217, después de una corrección reciente y pronunciada desde arriba de $1,200. El impulso se mantiene volátil, con vendedores activos después de la reversión.
🔴 ENTRADA CORTA: Precio de mercado
🛑 SL: $1,300
🎯 TP1: $1,100
🎯 TP2: $1,020
🎯 TP3: $950
⚡ Entrada: Precio de mercado — ejecutable ahora.
⚠️ No es asesoramiento financiero. Gestiona el riesgo con cuidado.
@Binance Square Official #FedRateWatch #ZcashRises6% #XRPSinks10% #Binance #ChartSniper
191
·
--

Artículo
NOT/USDT Se tensiona en un cruce — ¿Hacia dónde rompe Notcoin?$NOT
Gráfico de 1H | Binance Spot | NOTUSDT | 11 de septiembre de 2026
Notcoin (NOT) cotiza en 0.000431, con un modesto +0.70% durante el día, después de abrir en 0.000428 y moverse entre 0.000428 y 0.000432. A diferencia de los movimientos agudos y decisivos que aparecen ahora mismo en otras partes del tablero, el gráfico de NOT cuenta una historia de indecisión: un token atrapado entre un uptrend roto y un nivel de soporte que ha resistido durante más de una semana, con el precio comprimiéndose en un rango cada vez más estrecho a medida que se acerca a un punto de decisión claro.
NOT/USDT Se tensiona en un cruce — ¿Hacia dónde rompe Notcoin?
$NOT
Gráfico de 1H | Binance Spot | NOTUSDT | 11 de septiembre de 2026
Notcoin (NOT) cotiza en 0.000431, con un modesto +0.70% durante el día, después de abrir en 0.000428 y moverse entre 0.000428 y 0.000432. A diferencia de los movimientos agudos y decisivos que aparecen ahora mismo en otras partes del tablero, el gráfico de NOT cuenta una historia de indecisión: un token atrapado entre un uptrend roto y un nivel de soporte que ha resistido durante más de una semana, con el precio comprimiéndose en un rango cada vez más estrecho a medida que se acerca a un punto de decisión claro.
Gráfico de 1H | Binance Spot | NOTUSDT | 11 de septiembre de 2026
Notcoin (NOT) cotiza en 0.000431, con un modesto +0.70% durante el día, después de abrir en 0.000428 y moverse entre 0.000428 y 0.000432. A diferencia de los movimientos agudos y decisivos que aparecen ahora mismo en otras partes del tablero, el gráfico de NOT cuenta una historia de indecisión: un token atrapado entre un uptrend roto y un nivel de soporte que ha resistido durante más de una semana, con el precio comprimiéndose en un rango cada vez más estrecho a medida que se acerca a un punto de decisión claro.
136
·
--

Artículo
CATI/USDT Construye una Escalera desde los Mínimos: ¿Se Carga el Próximo Tramo al alza?$CATI
Gráfico 1H | Binance Perpetual | CATIUSDT | 11 de septiembre de 2026
Catizen (CATI) cotiza a 0.06116, arriba +0.81% durante el día, después de abrir en 0.06066 y moverse entre un máximo de 0.06148 y un mínimo de 0.06061. Ese es un rango diario tranquilo, pero se asienta sobre una de las estructuras de recuperación más constructivas del tablero: un token que cayó con fuerza, encontró un mínimo sólido y ha pasado la última semana construyendo una escalera genuina de máximos más altos por debajo de un nivel de resistencia bien definido.
Leer la Estructura
CATI/USDT Construye una Escalera desde los Mínimos: ¿Se Carga el Próximo Tramo al alza?
$CATI
Gráfico 1H | Binance Perpetual | CATIUSDT | 11 de septiembre de 2026
Catizen (CATI) cotiza a 0.06116, arriba +0.81% durante el día, después de abrir en 0.06066 y moverse entre un máximo de 0.06148 y un mínimo de 0.06061. Ese es un rango diario tranquilo, pero se asienta sobre una de las estructuras de recuperación más constructivas del tablero: un token que cayó con fuerza, encontró un mínimo sólido y ha pasado la última semana construyendo una escalera genuina de máximos más altos por debajo de un nivel de resistencia bien definido.
Leer la Estructura
Gráfico 1H | Binance Perpetual | CATIUSDT | 11 de septiembre de 2026
Catizen (CATI) cotiza a 0.06116, arriba +0.81% durante el día, después de abrir en 0.06066 y moverse entre un máximo de 0.06148 y un mínimo de 0.06061. Ese es un rango diario tranquilo, pero se asienta sobre una de las estructuras de recuperación más constructivas del tablero: un token que cayó con fuerza, encontró un mínimo sólido y ha pasado la última semana construyendo una escalera genuina de máximos más altos por debajo de un nivel de resistencia bien definido.
Leer la Estructura
loseere:
bro I am in Big problem lost my all money Wich was 700 hundred it was for my mother treatment plz help what do 🙏
1
127
·
--

Artículo
THETA/USDT Explota Desde los Mínimos — ¿Acaso Está Empezando una Nueva Tendencia Alcista?$THETA
Gráfico 1H | Binance Perpetual | THETAUSDT | 11 de septiembre de 2026
El token Theta se está negociando a 0.1906, con una subida de +1.06% durante el día después de abrir en 0.1886 y oscilar entre un mínimo de 0.1884 y un máximo de 0.1914. La vela diaria no parece especialmente destacable por sí sola, pero está apoyada sobre uno de los movimientos impulsivos más intensos que THETA ha hecho en semanas: un rally que llevó el precio desde un mínimo reciente cerca de 0.1685 hasta un máximo más alto por encima de 0.2073 en cuestión de horas, antes de enfriarse en una corrección saludable que ahora está preparando el siguiente punto de decisión.
THETA/USDT Explota Desde los Mínimos — ¿Acaso Está Empezando una Nueva Tendencia Alcista?
$THETA
Gráfico 1H | Binance Perpetual | THETAUSDT | 11 de septiembre de 2026
El token Theta se está negociando a 0.1906, con una subida de +1.06% durante el día después de abrir en 0.1886 y oscilar entre un mínimo de 0.1884 y un máximo de 0.1914. La vela diaria no parece especialmente destacable por sí sola, pero está apoyada sobre uno de los movimientos impulsivos más intensos que THETA ha hecho en semanas: un rally que llevó el precio desde un mínimo reciente cerca de 0.1685 hasta un máximo más alto por encima de 0.2073 en cuestión de horas, antes de enfriarse en una corrección saludable que ahora está preparando el siguiente punto de decisión.
Gráfico 1H | Binance Perpetual | THETAUSDT | 11 de septiembre de 2026
El token Theta se está negociando a 0.1906, con una subida de +1.06% durante el día después de abrir en 0.1886 y oscilar entre un mínimo de 0.1884 y un máximo de 0.1914. La vela diaria no parece especialmente destacable por sí sola, pero está apoyada sobre uno de los movimientos impulsivos más intensos que THETA ha hecho en semanas: un rally que llevó el precio desde un mínimo reciente cerca de 0.1685 hasta un máximo más alto por encima de 0.2073 en cuestión de horas, antes de enfriarse en una corrección saludable que ahora está preparando el siguiente punto de decisión.
70
·
--

Artículo
AT/USDT Recupera Todos los Niveles que Perdió — ¿Se Invirtió el Tendencia?$AT
Gráfico 1H | Binance Perpetual | ATUSDT | 11 de septiembre de 2026
AT cotiza en 0.1529, con una subida de +0.53% en la sesión después de marcar un máximo de 0.1536 y un mínimo de 0.1519. Ese modesto número diario no refleja lo que acaba de ocurrir en el gráfico: en las últimas 24 horas, AT realizó uno de los giros más bruscos de su rango reciente, abriéndose paso directamente a través de un grupo de niveles de resistencia previa que había frenado cada repunte desde el máximo del 7 de septiembre. Este tipo de movimiento convierte un gráfico de "vigilar y esperar" en un escenario activo.
AT/USDT Recupera Todos los Niveles que Perdió — ¿Se Invirtió el Tendencia?
$AT
Gráfico 1H | Binance Perpetual | ATUSDT | 11 de septiembre de 2026
AT cotiza en 0.1529, con una subida de +0.53% en la sesión después de marcar un máximo de 0.1536 y un mínimo de 0.1519. Ese modesto número diario no refleja lo que acaba de ocurrir en el gráfico: en las últimas 24 horas, AT realizó uno de los giros más bruscos de su rango reciente, abriéndose paso directamente a través de un grupo de niveles de resistencia previa que había frenado cada repunte desde el máximo del 7 de septiembre. Este tipo de movimiento convierte un gráfico de "vigilar y esperar" en un escenario activo.
Gráfico 1H | Binance Perpetual | ATUSDT | 11 de septiembre de 2026
AT cotiza en 0.1529, con una subida de +0.53% en la sesión después de marcar un máximo de 0.1536 y un mínimo de 0.1519. Ese modesto número diario no refleja lo que acaba de ocurrir en el gráfico: en las últimas 24 horas, AT realizó uno de los giros más bruscos de su rango reciente, abriéndose paso directamente a través de un grupo de niveles de resistencia previa que había frenado cada repunte desde el máximo del 7 de septiembre. Este tipo de movimiento convierte un gráfico de "vigilar y esperar" en un escenario activo.
96
·
--

Artículo
LIT/USDT Rechazado de Nuevo — ¿El Downtrend Está Listo para una Nueva Pierna Más Abajo?$LIT
15M Chart | Binance Perpetual | LITUSDT | 11 de septiembre de 2026
Lighter (LIT) cotiza a 4.4168 después de abrir la sesión en 4.4160 y moverse entre un máximo de 4.4340 y un mínimo de 4.3645: una vela tranquila y casi plana a simple vista, pero la estructura que hay debajo cuenta una historia más decisiva. Desde que marcó un máximo más alto cerca de 5.25 el 9 de septiembre, LIT ha estado trazando un canal descendente de manual: máximos más bajos, una ruptura limpia del mínimo del rango previo y un rechazo en una tendencia de resistencia bien definida que ahora se ha probado y se le ha negado en tres ocasiones distintas.
LIT/USDT Rechazado de Nuevo — ¿El Downtrend Está Listo para una Nueva Pierna Más Abajo?
$LIT
15M Chart | Binance Perpetual | LITUSDT | 11 de septiembre de 2026
Lighter (LIT) cotiza a 4.4168 después de abrir la sesión en 4.4160 y moverse entre un máximo de 4.4340 y un mínimo de 4.3645: una vela tranquila y casi plana a simple vista, pero la estructura que hay debajo cuenta una historia más decisiva. Desde que marcó un máximo más alto cerca de 5.25 el 9 de septiembre, LIT ha estado trazando un canal descendente de manual: máximos más bajos, una ruptura limpia del mínimo del rango previo y un rechazo en una tendencia de resistencia bien definida que ahora se ha probado y se le ha negado en tres ocasiones distintas.
15M Chart | Binance Perpetual | LITUSDT | 11 de septiembre de 2026
Lighter (LIT) cotiza a 4.4168 después de abrir la sesión en 4.4160 y moverse entre un máximo de 4.4340 y un mínimo de 4.3645: una vela tranquila y casi plana a simple vista, pero la estructura que hay debajo cuenta una historia más decisiva. Desde que marcó un máximo más alto cerca de 5.25 el 9 de septiembre, LIT ha estado trazando un canal descendente de manual: máximos más bajos, una ruptura limpia del mínimo del rango previo y un rechazo en una tendencia de resistencia bien definida que ahora se ha probado y se le ha negado en tres ocasiones distintas.
234
·
--

Artículo
MMT/USDT: Se Perdió el Impulso — El Efecto Dominó Sigue Derribando el Soporte$MMT
Activo: MMT/USDT Perpetuo | Marco temporal: 15M | Intercambio: Binance
El gráfico de MMT se lee como una cascada de dominós cayendo. Tras consolidar durante dos días en el rango 0.1670–0.1710 (marcado por un Máximo Más Bajo claro), los vendedores tomaron el control el 9–10 de septiembre y llevaron el precio directamente a través del soporte en una sola pierna impulsiva agresiva hacia un Mínimo Más Bajo cerca de 0.155. Desde entonces, la pareja ha estado bajando lentamente dentro de una línea de tendencia descendente bien definida, finalmente formando un Mínimo Más Alto en 0.1484 antes de un intento de rebote hacia 0.1550 —que fue rechazado de inmediato, devolviendo el precio a la línea de tendencia. Ahora el precio se sitúa en 0.1508, con una caída del 0.79% en la sesión, y aún atrapado debajo de esa línea de resistencia descendente.
MMT/USDT: Se Perdió el Impulso — El Efecto Dominó Sigue Derribando el Soporte
$MMT
Activo: MMT/USDT Perpetuo | Marco temporal: 15M | Intercambio: Binance
El gráfico de MMT se lee como una cascada de dominós cayendo. Tras consolidar durante dos días en el rango 0.1670–0.1710 (marcado por un Máximo Más Bajo claro), los vendedores tomaron el control el 9–10 de septiembre y llevaron el precio directamente a través del soporte en una sola pierna impulsiva agresiva hacia un Mínimo Más Bajo cerca de 0.155. Desde entonces, la pareja ha estado bajando lentamente dentro de una línea de tendencia descendente bien definida, finalmente formando un Mínimo Más Alto en 0.1484 antes de un intento de rebote hacia 0.1550 —que fue rechazado de inmediato, devolviendo el precio a la línea de tendencia. Ahora el precio se sitúa en 0.1508, con una caída del 0.79% en la sesión, y aún atrapado debajo de esa línea de resistencia descendente.
Activo: MMT/USDT Perpetuo | Marco temporal: 15M | Intercambio: Binance
El gráfico de MMT se lee como una cascada de dominós cayendo. Tras consolidar durante dos días en el rango 0.1670–0.1710 (marcado por un Máximo Más Bajo claro), los vendedores tomaron el control el 9–10 de septiembre y llevaron el precio directamente a través del soporte en una sola pierna impulsiva agresiva hacia un Mínimo Más Bajo cerca de 0.155. Desde entonces, la pareja ha estado bajando lentamente dentro de una línea de tendencia descendente bien definida, finalmente formando un Mínimo Más Alto en 0.1484 antes de un intento de rebote hacia 0.1550 —que fue rechazado de inmediato, devolviendo el precio a la línea de tendencia. Ahora el precio se sitúa en 0.1508, con una caída del 0.79% en la sesión, y aún atrapado debajo de esa línea de resistencia descendente.
313
·
--

Artículo
PUMP/USDT: El Ritmo Cardíaco Se Apaga — La Estructura Se Agrieta Debajo del Soporte Clave$PUMP
Activo: PUMP/USDT Perpetuo | Periodo: 1H | Exchange: Binance
PUMP acaba de dar una lección de manual sobre lo rápido que el sentimiento puede cambiar en un token cercano a los memes. Después de rebotar desde su base de principios de septiembre cerca de 0.0035 en una pierna impulsiva y limpia hacia 0.0048, el precio marcó un Máximo Más Alto — y luego, de inmediato, comenzó a imprimir estructura más baja. El gráfico de 1H ahora muestra una secuencia completada LH → HH → LL → HL, y la vela más reciente acaba de romper por debajo del HL, atravesando con el mecha el nivel de 0 Fibonacci (0.003506) antes de cerrar en 0.003539, con una caída de más del 4% en la sesión.
PUMP/USDT: El Ritmo Cardíaco Se Apaga — La Estructura Se Agrieta Debajo del Soporte Clave
$PUMP
Activo: PUMP/USDT Perpetuo | Periodo: 1H | Exchange: Binance
PUMP acaba de dar una lección de manual sobre lo rápido que el sentimiento puede cambiar en un token cercano a los memes. Después de rebotar desde su base de principios de septiembre cerca de 0.0035 en una pierna impulsiva y limpia hacia 0.0048, el precio marcó un Máximo Más Alto — y luego, de inmediato, comenzó a imprimir estructura más baja. El gráfico de 1H ahora muestra una secuencia completada LH → HH → LL → HL, y la vela más reciente acaba de romper por debajo del HL, atravesando con el mecha el nivel de 0 Fibonacci (0.003506) antes de cerrar en 0.003539, con una caída de más del 4% en la sesión.
Activo: PUMP/USDT Perpetuo | Periodo: 1H | Exchange: Binance
PUMP acaba de dar una lección de manual sobre lo rápido que el sentimiento puede cambiar en un token cercano a los memes. Después de rebotar desde su base de principios de septiembre cerca de 0.0035 en una pierna impulsiva y limpia hacia 0.0048, el precio marcó un Máximo Más Alto — y luego, de inmediato, comenzó a imprimir estructura más baja. El gráfico de 1H ahora muestra una secuencia completada LH → HH → LL → HL, y la vela más reciente acaba de romper por debajo del HL, atravesando con el mecha el nivel de 0 Fibonacci (0.003506) antes de cerrar en 0.003539, con una caída de más del 4% en la sesión.
195
·
--
📈 $DEXE USDT — CONFIGURACIÓN LONG
DEXE cotiza alrededor de $1.96, con una presión vendedora reciente que crea una posible zona de soporte. Mantenerse por encima de $1.90–$1.95 podría activar una recuperación hacia los próximos niveles de resistencia. La estructura técnica favorece una configuración de rebote con cautela.
🟢 ENTRADA: $1.96
🛑 SL: $1.84
🎯 TP1: $2.10
🎯 TP2: $2.25
🎯 TP3: $2.40
⚡ La entrada es ejecutable ahora.
⚠️ No es asesoramiento financiero. Gestiona el riesgo con cuidado.
@Binance_Square_Official #USAugustPPIRisesLessThanExpected #SECApprovesNasdaqTexasCommodityTrustRule #ECBRaisesRatesSecondTimeTo2.5% #Binance #ChartSniper
{future}(DEXEUSDT)
📈 $DEXE USDT — CONFIGURACIÓN LONG
DEXE cotiza alrededor de $1.96, con una presión vendedora reciente que crea una posible zona de soporte. Mantenerse por encima de $1.90–$1.95 podría activar una recuperación hacia los próximos niveles de resistencia. La estructura técnica favorece una configuración de rebote con cautela.
🟢 ENTRADA: $1.96
🛑 SL: $1.84
🎯 TP1: $2.10
🎯 TP2: $2.25
🎯 TP3: $2.40
⚡ La entrada es ejecutable ahora.
⚠️ No es asesoramiento financiero. Gestiona el riesgo con cuidado.
@Binance Square Official #USAugustPPIRisesLessThanExpected #SECApprovesNasdaqTexasCommodityTrustRule #ECBRaisesRatesSecondTimeTo2.5% #Binance #ChartSniper
DEXE cotiza alrededor de $1.96, con una presión vendedora reciente que crea una posible zona de soporte. Mantenerse por encima de $1.90–$1.95 podría activar una recuperación hacia los próximos niveles de resistencia. La estructura técnica favorece una configuración de rebote con cautela.
🟢 ENTRADA: $1.96
🛑 SL: $1.84
🎯 TP1: $2.10
🎯 TP2: $2.25
🎯 TP3: $2.40
⚡ La entrada es ejecutable ahora.
⚠️ No es asesoramiento financiero. Gestiona el riesgo con cuidado.
@Binance Square Official #USAugustPPIRisesLessThanExpected #SECApprovesNasdaqTexasCommodityTrustRule #ECBRaisesRatesSecondTimeTo2.5% #Binance #ChartSniper
206
·
--
📉 $SAGA USDT — CONFIGURACIÓN CORTA
SAGA se está negociando cerca de $0.0142, con una caída de alrededor de 3–4% en 24H. El precio se mantiene por debajo de la resistencia reciente de $0.0150, mostrando presión bajista después del rechazo.
🔴 ENTRADA CORTA: $0.01420
🛑 SL: $0.01480
🎯 TP1: $0.01370
🎯 TP2: $0.01320
🎯 TP3: $0.01280
⚡ La entrada se puede ejecutar al precio actual del mercado.
⚠️ No es asesoramiento financiero. Gestiona el riesgo con cuidado.
@Binance_Square_Official #USAugustPPIRisesLessThanExpected #SECApprovesNasdaqTexasCommodityTrustRule #ECBRaisesRatesSecondTimeTo2.5% #Binance #ChartSniper
{future}(SAGAUSDT)
📉 $SAGA USDT — CONFIGURACIÓN CORTA
SAGA se está negociando cerca de $0.0142, con una caída de alrededor de 3–4% en 24H. El precio se mantiene por debajo de la resistencia reciente de $0.0150, mostrando presión bajista después del rechazo.
🔴 ENTRADA CORTA: $0.01420
🛑 SL: $0.01480
🎯 TP1: $0.01370
🎯 TP2: $0.01320
🎯 TP3: $0.01280
⚡ La entrada se puede ejecutar al precio actual del mercado.
⚠️ No es asesoramiento financiero. Gestiona el riesgo con cuidado.
@Binance Square Official #USAugustPPIRisesLessThanExpected #SECApprovesNasdaqTexasCommodityTrustRule #ECBRaisesRatesSecondTimeTo2.5% #Binance #ChartSniper
SAGA se está negociando cerca de $0.0142, con una caída de alrededor de 3–4% en 24H. El precio se mantiene por debajo de la resistencia reciente de $0.0150, mostrando presión bajista después del rechazo.
🔴 ENTRADA CORTA: $0.01420
🛑 SL: $0.01480
🎯 TP1: $0.01370
🎯 TP2: $0.01320
🎯 TP3: $0.01280
⚡ La entrada se puede ejecutar al precio actual del mercado.
⚠️ No es asesoramiento financiero. Gestiona el riesgo con cuidado.
@Binance Square Official #USAugustPPIRisesLessThanExpected #SECApprovesNasdaqTexasCommodityTrustRule #ECBRaisesRatesSecondTimeTo2.5% #Binance #ChartSniper
126
·
--
Artículo
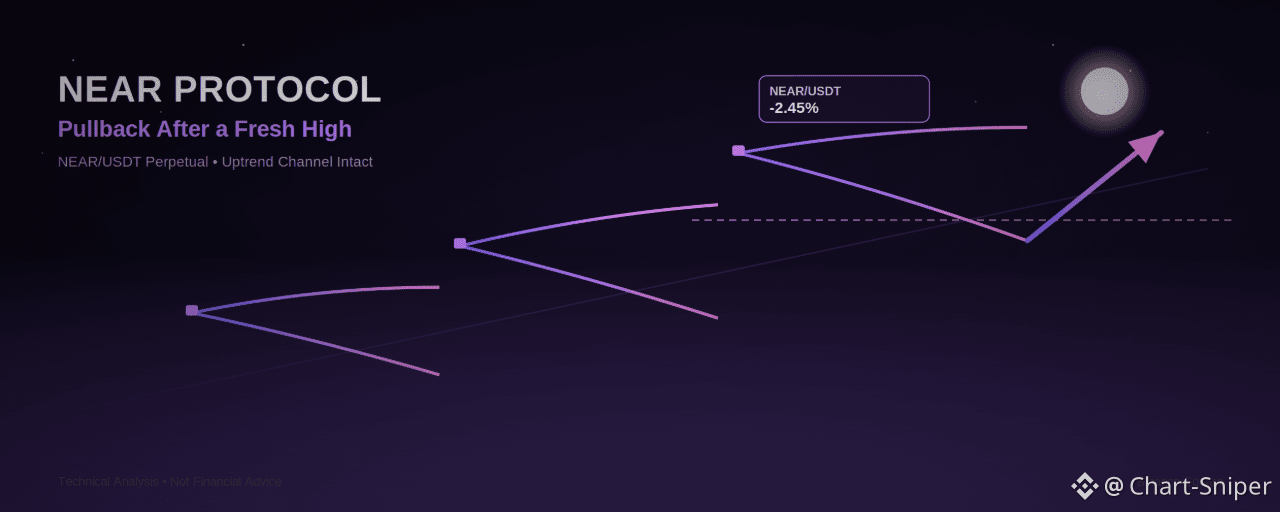
NEAR Protocol retrocede desde un máximo reciente: ¿sigue en pie el puente de la tendencia alcista?$NEAR
NEAR (NEAR/USDT Perpetual) se está enfriando después de marcar un nuevo máximo local. En el gráfico de 1H, el precio abrió en 2.616, hizo un pico en 2.639 y luego cayó hasta un mínimo de 2.526 antes de asentarse alrededor de 2.552, dejando una vela con -2.45%. Tras un fuerte rally de varios días desde el mínimo de principios de septiembre, esto parece un retroceso rutinario dentro de una tendencia alcista que aún se mantiene en pie, más que un cambio de tendencia; pero las próximas velas en el estante de soporte actual dirán la historia real.
Leer la estructura
El movimiento más amplio en este gráfico es un rally limpio e impulsivo: el precio tocó un mínimo más bajo (LL) cerca de 1.882, rebotó hacia un área de máximo más bajo (LH), volvió a caer, y luego rompió con decisión al alza en una secuencia de máximos más altos (HH): primero probando resistencia en el rango de 2.30 a 2.40 (la caja de la "Zona de Retroceso" en el gráfico), consolidando ahí, y luego impulsándose hasta el HH más reciente en 2.639.
NEAR Protocol retrocede desde un máximo reciente: ¿sigue en pie el puente de la tendencia alcista?
$NEAR
NEAR (NEAR/USDT Perpetual) se está enfriando después de marcar un nuevo máximo local. En el gráfico de 1H, el precio abrió en 2.616, hizo un pico en 2.639 y luego cayó hasta un mínimo de 2.526 antes de asentarse alrededor de 2.552, dejando una vela con -2.45%. Tras un fuerte rally de varios días desde el mínimo de principios de septiembre, esto parece un retroceso rutinario dentro de una tendencia alcista que aún se mantiene en pie, más que un cambio de tendencia; pero las próximas velas en el estante de soporte actual dirán la historia real.
Leer la estructura
El movimiento más amplio en este gráfico es un rally limpio e impulsivo: el precio tocó un mínimo más bajo (LL) cerca de 1.882, rebotó hacia un área de máximo más bajo (LH), volvió a caer, y luego rompió con decisión al alza en una secuencia de máximos más altos (HH): primero probando resistencia en el rango de 2.30 a 2.40 (la caja de la "Zona de Retroceso" en el gráfico), consolidando ahí, y luego impulsándose hasta el HH más reciente en 2.639.
NEAR (NEAR/USDT Perpetual) se está enfriando después de marcar un nuevo máximo local. En el gráfico de 1H, el precio abrió en 2.616, hizo un pico en 2.639 y luego cayó hasta un mínimo de 2.526 antes de asentarse alrededor de 2.552, dejando una vela con -2.45%. Tras un fuerte rally de varios días desde el mínimo de principios de septiembre, esto parece un retroceso rutinario dentro de una tendencia alcista que aún se mantiene en pie, más que un cambio de tendencia; pero las próximas velas en el estante de soporte actual dirán la historia real.
Leer la estructura
El movimiento más amplio en este gráfico es un rally limpio e impulsivo: el precio tocó un mínimo más bajo (LL) cerca de 1.882, rebotó hacia un área de máximo más bajo (LH), volvió a caer, y luego rompió con decisión al alza en una secuencia de máximos más altos (HH): primero probando resistencia en el rango de 2.30 a 2.40 (la caja de la "Zona de Retroceso" en el gráfico), consolidando ahí, y luego impulsándose hasta el HH más reciente en 2.639.
74
·
--
Artículo
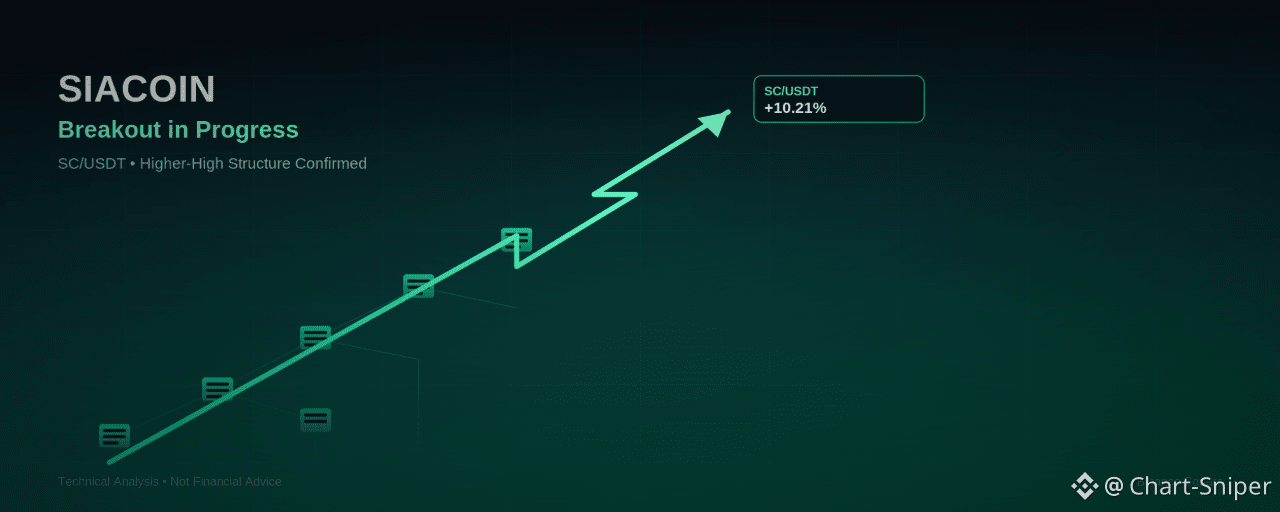
Siacoin Rompe la Estructura: ¿SC/USDT se Está Preparando para el Próximo Máximo Más Alto?$SC
Siacoin (SC/USDT) ha logrado volver a captar la atención de los traders después de un fuerte movimiento intradía. En el gráfico de 1H, el precio sube un +10.21%, pasando de una apertura de 0.000871 a un máximo de 0.000993, antes de enfriarse para cotizar alrededor de 0.000961 en el momento de redactar este informe. Para una moneda que pasó gran parte de la semana avanzando en un rango estrecho, este tipo de vela de expansión es el tipo de movimiento que aparece en los buscadores de "mayores ganadores"; y la estructura del mercado detrás de ello sugiere que esto podría no ser algo de un solo vistazo.
Siacoin Rompe la Estructura: ¿SC/USDT se Está Preparando para el Próximo Máximo Más Alto?
$SC
Siacoin (SC/USDT) ha logrado volver a captar la atención de los traders después de un fuerte movimiento intradía. En el gráfico de 1H, el precio sube un +10.21%, pasando de una apertura de 0.000871 a un máximo de 0.000993, antes de enfriarse para cotizar alrededor de 0.000961 en el momento de redactar este informe. Para una moneda que pasó gran parte de la semana avanzando en un rango estrecho, este tipo de vela de expansión es el tipo de movimiento que aparece en los buscadores de "mayores ganadores"; y la estructura del mercado detrás de ello sugiere que esto podría no ser algo de un solo vistazo.
Siacoin (SC/USDT) ha logrado volver a captar la atención de los traders después de un fuerte movimiento intradía. En el gráfico de 1H, el precio sube un +10.21%, pasando de una apertura de 0.000871 a un máximo de 0.000993, antes de enfriarse para cotizar alrededor de 0.000961 en el momento de redactar este informe. Para una moneda que pasó gran parte de la semana avanzando en un rango estrecho, este tipo de vela de expansión es el tipo de movimiento que aparece en los buscadores de "mayores ganadores"; y la estructura del mercado detrás de ello sugiere que esto podría no ser algo de un solo vistazo.
63
·
--
📊 $BANK USDT — CONFIGURACIÓN TÉCNICA
El BANK se está negociando cerca de $0.0353, consolidándose alrededor de un soporte tras la reciente volatilidad. La zona de $0.0340 es un soporte clave, mientras que $0.0360–$0.0370 es la primera zona de resistencia. Un regreso por encima de $0.036 puede abrir espacio hacia $0.040.
🟢 ENTRADA LARGO: $0.03530
🛑 SL: $0.03380
🎯 TP1: $0.03700
🎯 TP2: $0.04000
🎯 TP3: $0.04500
⚡ La entrada es ejecutable ahora.
⚠️ No es asesoramiento financiero. Gestiona el riesgo con cuidado
@Binance_Square_Official #AEROSurges17%In24Hours #IranSaysItCapturedUSUnmannedSubmarine #SaudiHaltsSouthernEnergySitesAfterAttacks #Binance #ChartSniper
{future}(BANKUSDT)
📊 $BANK USDT — CONFIGURACIÓN TÉCNICA
El BANK se está negociando cerca de $0.0353, consolidándose alrededor de un soporte tras la reciente volatilidad. La zona de $0.0340 es un soporte clave, mientras que $0.0360–$0.0370 es la primera zona de resistencia. Un regreso por encima de $0.036 puede abrir espacio hacia $0.040.
🟢 ENTRADA LARGO: $0.03530
🛑 SL: $0.03380
🎯 TP1: $0.03700
🎯 TP2: $0.04000
🎯 TP3: $0.04500
⚡ La entrada es ejecutable ahora.
⚠️ No es asesoramiento financiero. Gestiona el riesgo con cuidado
@Binance Square Official #AEROSurges17%In24Hours #IranSaysItCapturedUSUnmannedSubmarine #SaudiHaltsSouthernEnergySitesAfterAttacks #Binance #ChartSniper
El BANK se está negociando cerca de $0.0353, consolidándose alrededor de un soporte tras la reciente volatilidad. La zona de $0.0340 es un soporte clave, mientras que $0.0360–$0.0370 es la primera zona de resistencia. Un regreso por encima de $0.036 puede abrir espacio hacia $0.040.
🟢 ENTRADA LARGO: $0.03530
🛑 SL: $0.03380
🎯 TP1: $0.03700
🎯 TP2: $0.04000
🎯 TP3: $0.04500
⚡ La entrada es ejecutable ahora.
⚠️ No es asesoramiento financiero. Gestiona el riesgo con cuidado
@Binance Square Official #AEROSurges17%In24Hours #IranSaysItCapturedUSUnmannedSubmarine #SaudiHaltsSouthernEnergySitesAfterAttacks #Binance #ChartSniper
303
·
--
📈 PI USDT — CONFIGURACIÓN LARGA
PI está operando cerca de $0.09635, mostrando un impulso alcista moderado. El precio se mantiene alrededor de la zona de soporte de $0.096, mientras que una ruptura por encima de $0.100 podría fortalecer la continuación de la configuración.
🟢 ENTRADA LARGO: $0.09635
🛑 SL: $0.09200
🎯 TP1: $0.10000
🎯 TP2: $0.10500
🎯 TP3: $0.11200
⚡ Entrada: Precio de Mercado Actual
⚠️ No es asesoramiento financiero. Gestiona el riesgo con cuidado.
@Binance_Square_Official #IranSaysItCapturedUSUnmannedSubmarine #AEROSurges17%In24Hours #SaudiHaltsSouthernEnergySitesAfterAttacks #Binance #ChartSniper
📈 PI USDT — CONFIGURACIÓN LARGA
PI está operando cerca de $0.09635, mostrando un impulso alcista moderado. El precio se mantiene alrededor de la zona de soporte de $0.096, mientras que una ruptura por encima de $0.100 podría fortalecer la continuación de la configuración.
🟢 ENTRADA LARGO: $0.09635
🛑 SL: $0.09200
🎯 TP1: $0.10000
🎯 TP2: $0.10500
🎯 TP3: $0.11200
⚡ Entrada: Precio de Mercado Actual
⚠️ No es asesoramiento financiero. Gestiona el riesgo con cuidado.
@Binance Square Official #IranSaysItCapturedUSUnmannedSubmarine #AEROSurges17%In24Hours #SaudiHaltsSouthernEnergySitesAfterAttacks #Binance #ChartSniper
PI está operando cerca de $0.09635, mostrando un impulso alcista moderado. El precio se mantiene alrededor de la zona de soporte de $0.096, mientras que una ruptura por encima de $0.100 podría fortalecer la continuación de la configuración.
🟢 ENTRADA LARGO: $0.09635
🛑 SL: $0.09200
🎯 TP1: $0.10000
🎯 TP2: $0.10500
🎯 TP3: $0.11200
⚡ Entrada: Precio de Mercado Actual
⚠️ No es asesoramiento financiero. Gestiona el riesgo con cuidado.
@Binance Square Official #IranSaysItCapturedUSUnmannedSubmarine #AEROSurges17%In24Hours #SaudiHaltsSouthernEnergySitesAfterAttacks #Binance #ChartSniper
50
·
--
📈 $XRP USDT — CONFIGURACIÓN LARGA
XRP está alrededor de $1.42, con RSI cerca de 57 y la mayoría de las medias móviles mostrando una señal de compra. El precio se mantiene por encima de la zona de $1.40, respaldando una configuración de continuación alcista.
🟢 ENTRADA LARGA: $1.42
🛑 SL: $1.38
🎯 TP1: $1.47
🎯 TP2: $1.55
🎯 TP3: $1.68
⚡ La entrada es ejecutable al precio actual del mercado.
⚠️ No es asesoramiento financiero. Gestiona el riesgo con cuidado.
@Binance_Square_Official #AEROSurges17%In24Hours #IranSaysItCapturedUSUnmannedSubmarine #SaudiHaltsSouthernEnergySitesAfterAttacks #Binance #ChartSniper
{future}(XRPUSDT)
📈 $XRP USDT — CONFIGURACIÓN LARGA
XRP está alrededor de $1.42, con RSI cerca de 57 y la mayoría de las medias móviles mostrando una señal de compra. El precio se mantiene por encima de la zona de $1.40, respaldando una configuración de continuación alcista.
🟢 ENTRADA LARGA: $1.42
🛑 SL: $1.38
🎯 TP1: $1.47
🎯 TP2: $1.55
🎯 TP3: $1.68
⚡ La entrada es ejecutable al precio actual del mercado.
⚠️ No es asesoramiento financiero. Gestiona el riesgo con cuidado.
@Binance Square Official #AEROSurges17%In24Hours #IranSaysItCapturedUSUnmannedSubmarine #SaudiHaltsSouthernEnergySitesAfterAttacks #Binance #ChartSniper
XRP está alrededor de $1.42, con RSI cerca de 57 y la mayoría de las medias móviles mostrando una señal de compra. El precio se mantiene por encima de la zona de $1.40, respaldando una configuración de continuación alcista.
🟢 ENTRADA LARGA: $1.42
🛑 SL: $1.38
🎯 TP1: $1.47
🎯 TP2: $1.55
🎯 TP3: $1.68
⚡ La entrada es ejecutable al precio actual del mercado.
⚠️ No es asesoramiento financiero. Gestiona el riesgo con cuidado.
@Binance Square Official #AEROSurges17%In24Hours #IranSaysItCapturedUSUnmannedSubmarine #SaudiHaltsSouthernEnergySitesAfterAttacks #Binance #ChartSniper
79
·
--
🔥 $DOT USDT — MONEDA CALIENTE TOP
DOT muestra un impulso fuerte, cotizando cerca de $1.08 y con una subida de más del 10% hoy. El precio está empujando hacia la zona de resistencia $1.10–$1.12; mantenerse por encima de $1.00 mantiene la estructura a corto plazo alcista.
🟢 ENTRADA LARGO: $1.08
🛑 SL: $1.00
🎯 TP1: $1.15
🎯 TP2: $1.22
🎯 TP3: $1.30
⚡ Señal: Impulso fuerte
⚠️ No es asesoramiento financiero. Gestiona el riesgo con cuidado.
@Binance_Square_Official #USIranTradeTankerStrikesEscalate #CanadaToImpose15%To50%TariffsOnUSGoods #ZcashRises45%WeeklyToHighestSince2016 #Binance #ChartSniper
{future}(DOTUSDT)
🔥 $DOT USDT — MONEDA CALIENTE TOP
DOT muestra un impulso fuerte, cotizando cerca de $1.08 y con una subida de más del 10% hoy. El precio está empujando hacia la zona de resistencia $1.10–$1.12; mantenerse por encima de $1.00 mantiene la estructura a corto plazo alcista.
🟢 ENTRADA LARGO: $1.08
🛑 SL: $1.00
🎯 TP1: $1.15
🎯 TP2: $1.22
🎯 TP3: $1.30
⚡ Señal: Impulso fuerte
⚠️ No es asesoramiento financiero. Gestiona el riesgo con cuidado.
@Binance Square Official #USIranTradeTankerStrikesEscalate #CanadaToImpose15%To50%TariffsOnUSGoods #ZcashRises45%WeeklyToHighestSince2016 #Binance #ChartSniper
DOT muestra un impulso fuerte, cotizando cerca de $1.08 y con una subida de más del 10% hoy. El precio está empujando hacia la zona de resistencia $1.10–$1.12; mantenerse por encima de $1.00 mantiene la estructura a corto plazo alcista.
🟢 ENTRADA LARGO: $1.08
🛑 SL: $1.00
🎯 TP1: $1.15
🎯 TP2: $1.22
🎯 TP3: $1.30
⚡ Señal: Impulso fuerte
⚠️ No es asesoramiento financiero. Gestiona el riesgo con cuidado.
@Binance Square Official #USIranTradeTankerStrikesEscalate #CanadaToImpose15%To50%TariffsOnUSGoods #ZcashRises45%WeeklyToHighestSince2016 #Binance #ChartSniper
129
Inicia sesión para explorar más contenidos
Únete a usuarios de criptomonedas de todo el mundo en Binance Square
⚡️ Obtén la información más reciente y útil sobre criptomonedas.
💬 Confía en el mayor exchange de criptomonedas del mundo.
👍 Descubre opiniones reales de creadores verificados.
Correo electrónico/número de teléfono
Temas en tendencia
1
#FedRateWatch
1.6M visualizaciones
6,990 participa(n) en el debate
2
#ZcashRises6%
72,133 visualizaciones
757 participa(n) en el debate
3
#XRPSinks10%
46,420 visualizaciones
499 participa(n) en el debate
4
#BitcoinETFsShed$450M
8,739 visualizaciones
103 participa(n) en el debate
5
#CircleOpensArcMainnet
21,194 visualizaciones
317 participa(n) en el debate
6
#ZcashHoldersBackNU7Upgrade
33,848 visualizaciones
479 participa(n) en el debate
7
#MSTRTradingVolumeSurpassesMorganStanley
30,793 visualizaciones
629 participa(n) en el debate
8
#BitcoinFalls4%
61,548 visualizaciones
976 participa(n) en el debate
9
#SKHynixInTalksToMakeMemoryChipsInUS
23,274 visualizaciones
377 participa(n) en el debate
10
#OpenAIDiscussesNewFundingAt$1.2TValuation
6,512 visualizaciones
62 participa(n) en el debate