S Could Finally Run If Sellers Lose This Zone 🔥
This weekly chart has that almost feeling. S is pressing the band, but almost is not a break, and I am not chasing the pump line.
🔥 Why I am watching
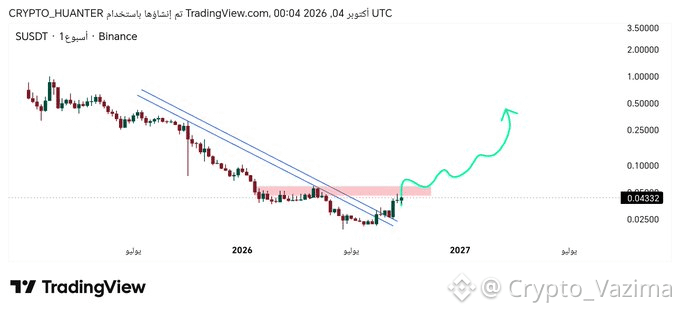
- The falling channel has owned this chart for a long time.
- Price is parked near 0.04332, kissing the shaded resistance.
- Buyers already bounced the lows, yet sellers still own the ceiling.
- The green path stays a hope sketch until the band actually breaks.
🚀 The part that matters
- A hold above resistance is the first real shift in control.
- A wick through the band and a close back inside is just noise.
- I want the market to prove the launch, not promise it.
⚡ How I would play it
1. Wait for the resistance break.
2. Check that the close holds.
3. Step back fast if price is rejected.
🎯 My trade idea
- Bias: Long after the break
- Trigger: resistance band lost by sellers
- Invalidation: failed break and loss of the recent base
- Confidence: 63 percent
Break or fakeout - which one are you leaning toward? 👇
Tell me the risk line you would respect on this weekly chart.
Not investment advice - research on your own! 🚀
$S
This weekly chart has that almost feeling. S is pressing the band, but almost is not a break, and I am not chasing the pump line.
🔥 Why I am watching
- The falling channel has owned this chart for a long time.
- Price is parked near 0.04332, kissing the shaded resistance.
- Buyers already bounced the lows, yet sellers still own the ceiling.
- The green path stays a hope sketch until the band actually breaks.
🚀 The part that matters
- A hold above resistance is the first real shift in control.
- A wick through the band and a close back inside is just noise.
- I want the market to prove the launch, not promise it.
⚡ How I would play it
1. Wait for the resistance break.
2. Check that the close holds.
3. Step back fast if price is rejected.
🎯 My trade idea
- Bias: Long after the break
- Trigger: resistance band lost by sellers
- Invalidation: failed break and loss of the recent base
- Confidence: 63 percent
Break or fakeout - which one are you leaning toward? 👇
Tell me the risk line you would respect on this weekly chart.
Not investment advice - research on your own! 🚀
$S