
User-3e39fa49
7 Publicaciones

User-3e39fa49
0 Siguiendo
1 Seguidores
0 Me gusta
Publicaciones
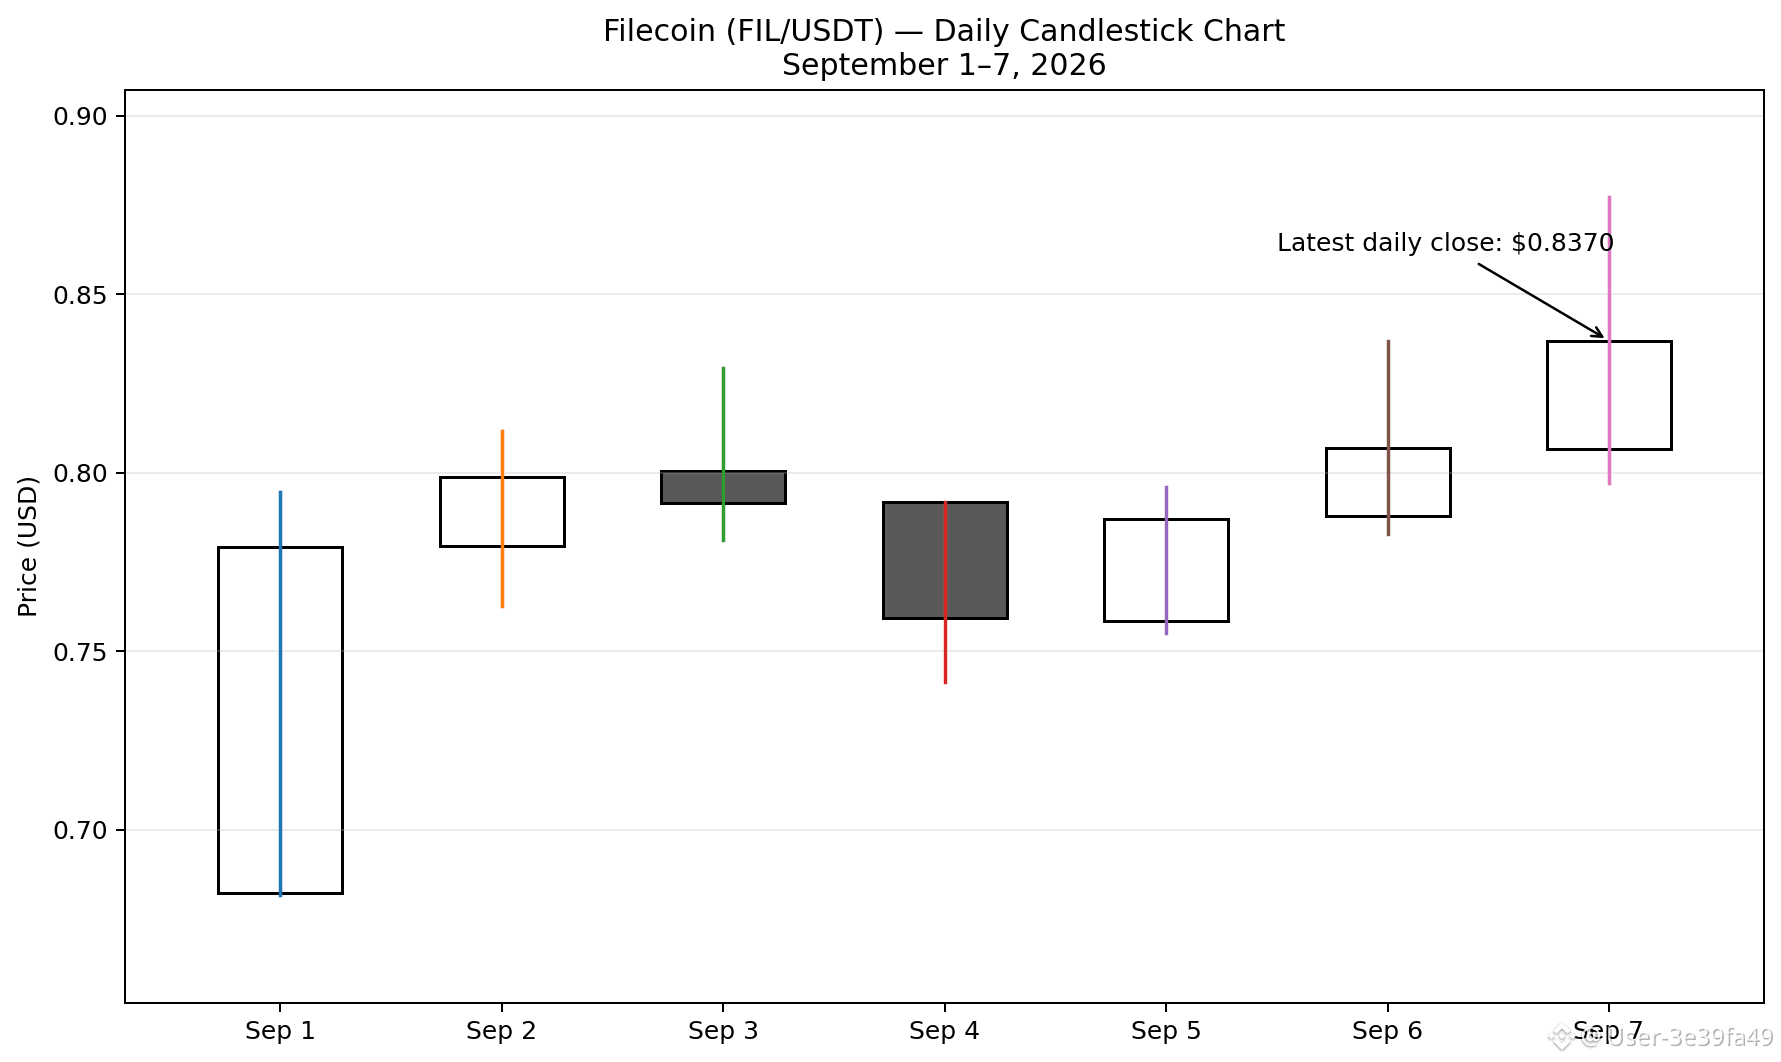
alrededor de $0.84–$0.85 por $FIL
Capitalización bursátil: aproximadamente $0.69–$0.70 mil millones
Volumen 24h: alrededor de $140–155 millones
Perspectiva del mercado:
FIL ha mostrado una fuerte recuperación a corto plazo, ganando aproximadamente 21% en los últimos 7 días.
Las velas recientes muestran un impulso alcista en mejora, con la vela diaria del 7 de septiembre cerrando alrededor de $0.837 después de alcanzar aproximadamente $0.877.
Resistencia: ~$0.86–$0.88. Una ruptura clara por encima de esta zona podría fortalecer el movimiento alcista.
Soporte: ~$0.81–$0.82. Perder esta zona podría provocar una corrección hacia ~$0.79.
En general, el impulso a corto plazo es alcista, pero FIL sigue siendo altamente volátil y aún está muy por debajo de su máximo histórico.
#FILUSDT #bitcoin #CanadaToImpose15%To50%TariffsOnUSGoods #SaudiHaltsSouthernEnergySitesAfterAttacks #IMFSaysElSalvadorBTCNoPublicFunds
Capitalización bursátil: aproximadamente $0.69–$0.70 mil millones
Volumen 24h: alrededor de $140–155 millones
Perspectiva del mercado:
FIL ha mostrado una fuerte recuperación a corto plazo, ganando aproximadamente 21% en los últimos 7 días.
Las velas recientes muestran un impulso alcista en mejora, con la vela diaria del 7 de septiembre cerrando alrededor de $0.837 después de alcanzar aproximadamente $0.877.
Resistencia: ~$0.86–$0.88. Una ruptura clara por encima de esta zona podría fortalecer el movimiento alcista.
Soporte: ~$0.81–$0.82. Perder esta zona podría provocar una corrección hacia ~$0.79.
En general, el impulso a corto plazo es alcista, pero FIL sigue siendo altamente volátil y aún está muy por debajo de su máximo histórico.
#FILUSDT #bitcoin #CanadaToImpose15%To50%TariffsOnUSGoods #SaudiHaltsSouthernEnergySitesAfterAttacks #IMFSaysElSalvadorBTCNoPublicFunds
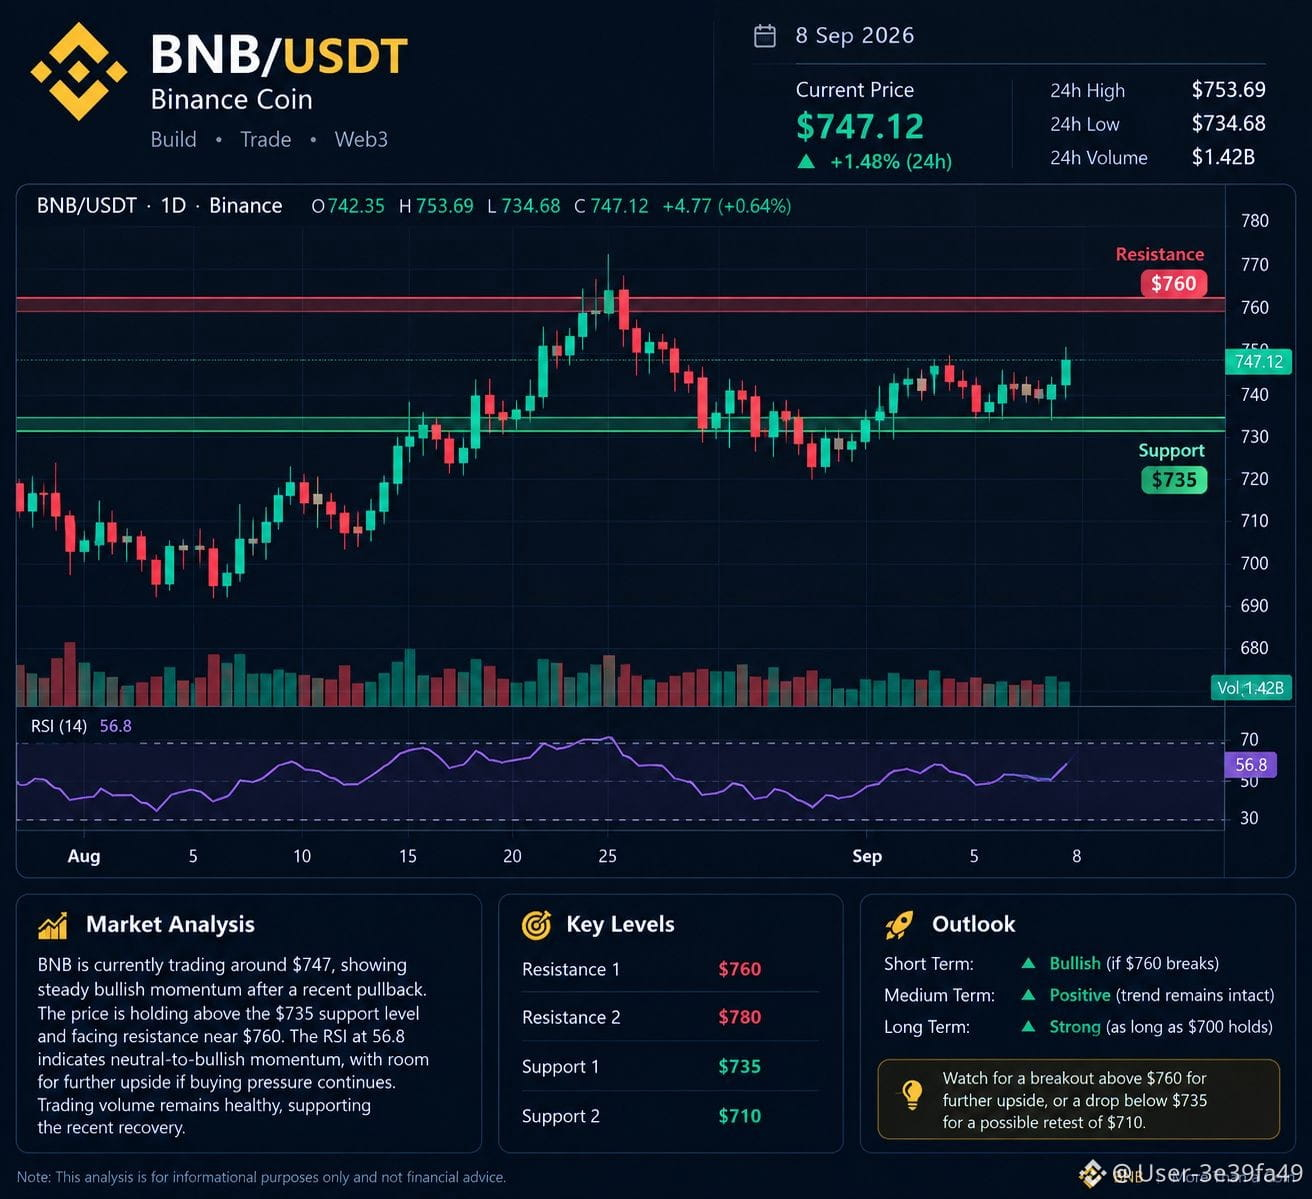
$BNB is actualmente alrededor de $748, con trading intradía aproximadamente entre $735–$754. El impulso reciente sigue siendo positivo, aunque el precio es volátil después de su fuerte rally a principios de septiembre.
Vista técnica:
🟢 Tendencia: Alcista / impulso positivo
🛡️ Soporte: $720–$735
🔥 Resistencia: $760
🚀 Ruptura por encima de $760: Podría abrir el camino hacia $800–$825
⚠️ Por debajo de $720: Riesgo de una corrección más profunda hacia $685–$700
Las medias móviles de BNB actualmente son alcistas, con las medias de 5, 20, 50, 100 y 200 días indicando todas condiciones alcistas.
🟢 Alcista, pero con cautela. Un cierre diario confirmado por encima de $760 con fuerte volumen reforzaría el escenario alcista. Si no se mantiene el área $720–$735, podría llevar a toma de ganancias.#YenBreaks155NearingYearHigh #BNB_Market_Update #ZcashRises45%WeeklyToHighestSince2016
Vista técnica:
🟢 Tendencia: Alcista / impulso positivo
🛡️ Soporte: $720–$735
🔥 Resistencia: $760
🚀 Ruptura por encima de $760: Podría abrir el camino hacia $800–$825
⚠️ Por debajo de $720: Riesgo de una corrección más profunda hacia $685–$700
Las medias móviles de BNB actualmente son alcistas, con las medias de 5, 20, 50, 100 y 200 días indicando todas condiciones alcistas.
🟢 Alcista, pero con cautela. Un cierre diario confirmado por encima de $760 con fuerte volumen reforzaría el escenario alcista. Si no se mantiene el área $720–$735, podría llevar a toma de ganancias.#YenBreaks155NearingYearHigh #BNB_Market_Update #ZcashRises45%WeeklyToHighestSince2016
Ver traducción
$ETH
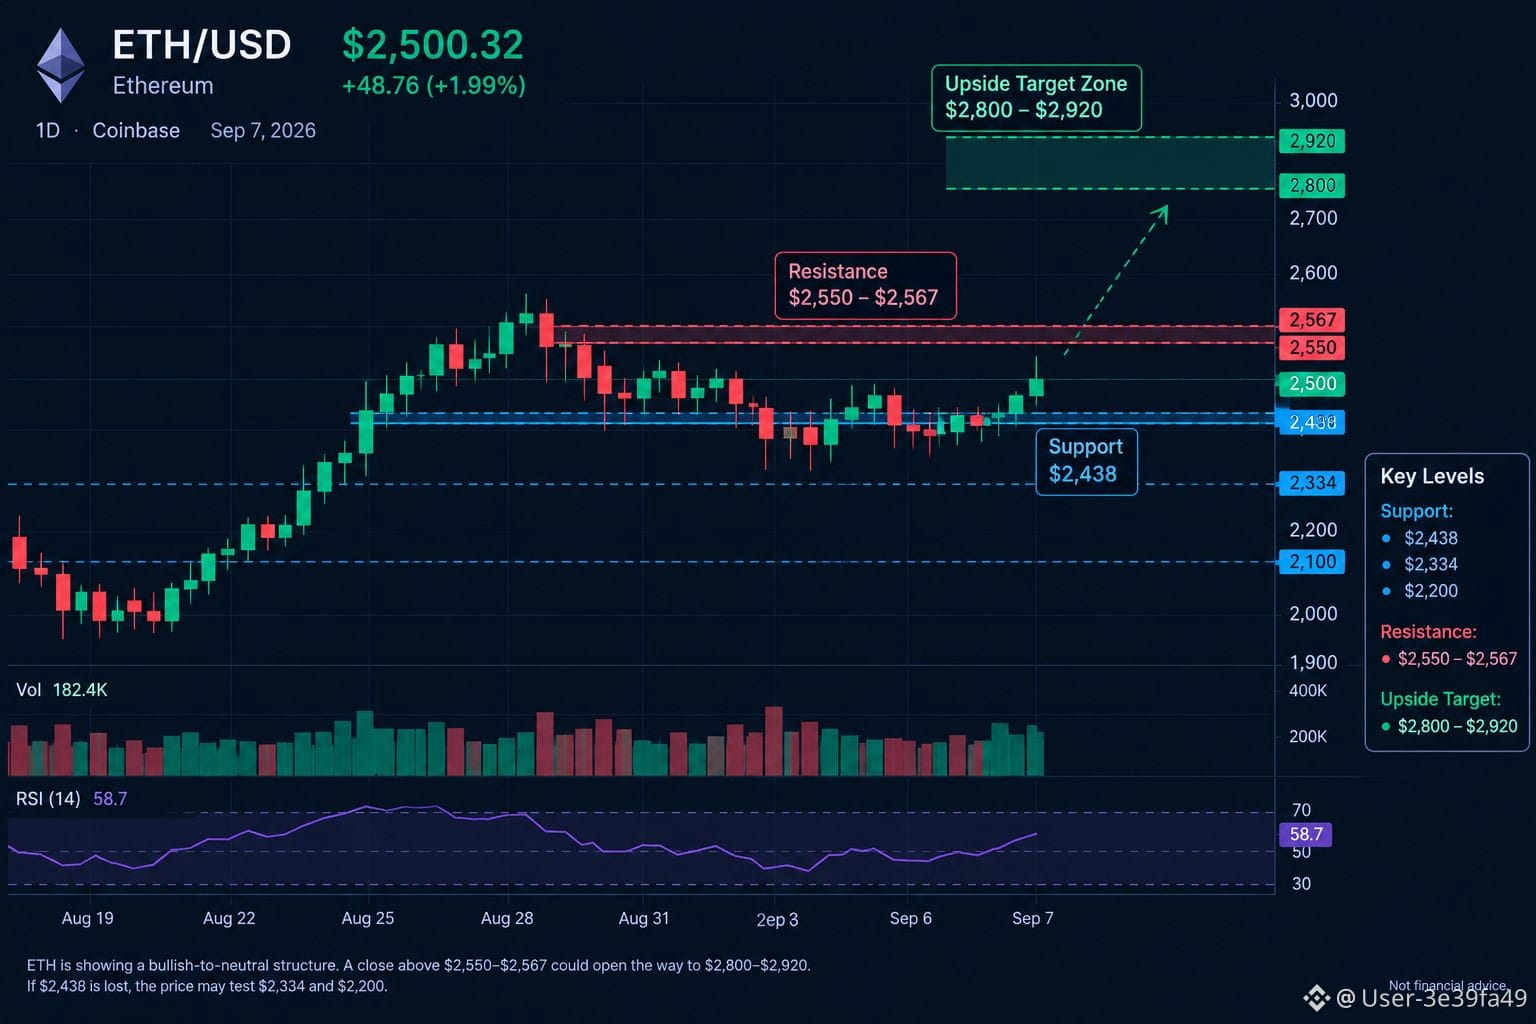
is showing a bullish-to-neutral short-term structure. ETH is currently around $2,500, after recovering strongly from the August breakout. Recent analysis puts $2,440–$2,480 as an important support area, while $2,550–$2,600 is the key resistance zone.
Key levels:
🟢 Support: $2,440 → $2,334 → $2,200
🔴 Resistance: $2,550 → $2,600
🚀 Bullish target: $2,800–$2,920 if ETH breaks and holds above resistance.
⚠️ Bearish scenario: A sustained break below $2,440 could expose $2,220 and potentially $2,000.
Overall, ETH looks cautiously bullish, but confirmation above $2,550–$2,600 would make the upside setup stronger.#ETHETFsApproved #ETHERİUM #IranSaysItHit3USShips3Tankers
is showing a bullish-to-neutral short-term structure. ETH is currently around $2,500, after recovering strongly from the August breakout. Recent analysis puts $2,440–$2,480 as an important support area, while $2,550–$2,600 is the key resistance zone.
Key levels:
🟢 Support: $2,440 → $2,334 → $2,200
🔴 Resistance: $2,550 → $2,600
🚀 Bullish target: $2,800–$2,920 if ETH breaks and holds above resistance.
⚠️ Bearish scenario: A sustained break below $2,440 could expose $2,220 and potentially $2,000.
Overall, ETH looks cautiously bullish, but confirmation above $2,550–$2,600 would make the upside setup stronger.#ETHETFsApproved #ETHERİUM #IranSaysItHit3USShips3Tankers
$LINK
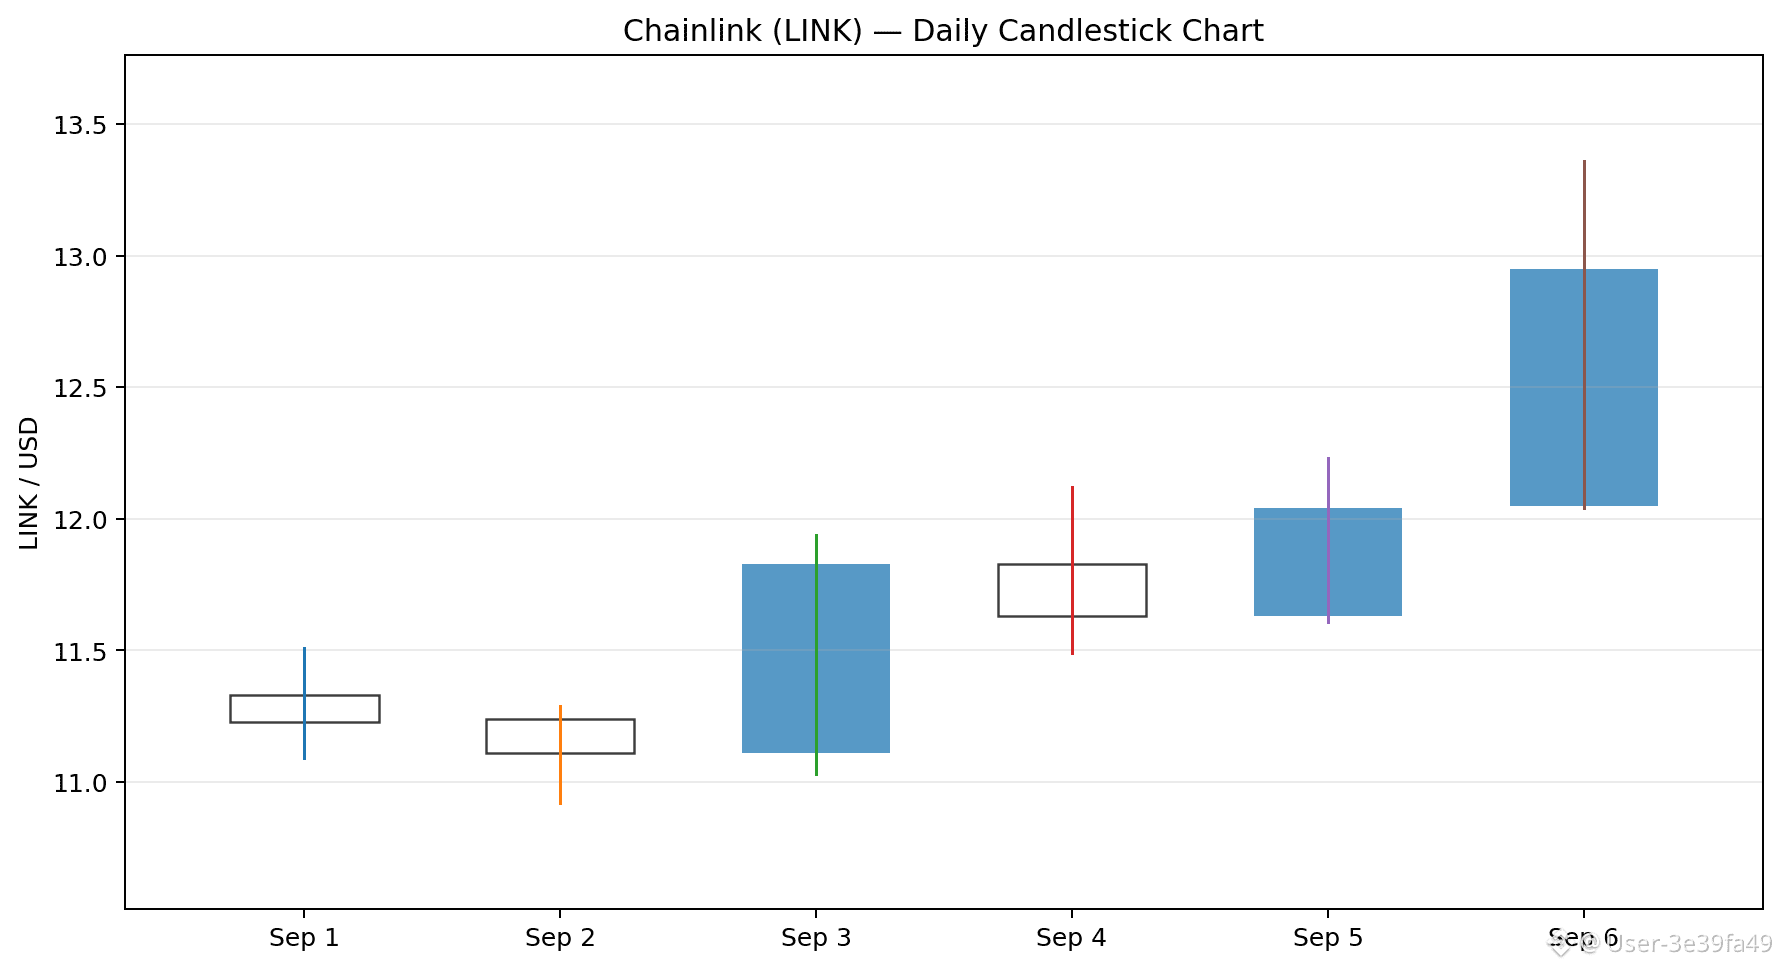
$ está cotizando alrededor de $13, después de un fuerte movimiento desde aproximadamente $11.1–$11.3 a principios de septiembre. El 6 de septiembre, LINK alcanzó un máximo intradía cerca de $13.36, mostrando un renovado impulso alcista.
Perspectiva técnica:
🟢 Alcista: Un movimiento sostenido por encima de $13.30–$13.50 podría abrir el camino hacia $14.50–$15.00.
🟡 Soporte: La primera zona importante está alrededor de $12.00–$12.20, seguida de $11.00–$11.30.
🔴 Una ruptura por debajo de $11 podría debilitar la configuración alcista a corto plazo.
Fundamentales: La perspectiva de Chainlink sigue siendo interesante porque LINK impulsa los pagos, la seguridad de la red y los incentivos dentro del ecosistema de Chainlink. Chainlink informa más de $33T en valor de transacciones acumulado habilitado, mientras que la adopción de CCIP continúa expandiéndose.
Perspectiva futura
Si el mercado cripto más amplio se mantiene alcista y Chainlink sigue ganando adopción en DeFi, infraestructura entre cadenas y finanzas institucionales, LINK podría tener un fuerte potencial a largo plazo. Chainlink también reportó un crecimiento significativo de CCIP, incluyendo un 78% de crecimiento en la transferencia de volumen trimestre contra trimestre en el Q1 2026.
Mi escenario:
Corto plazo: Alcista por encima de $12
Mediano plazo: $15–$20 es posible si el impulso continúa
Fuerte mercado alcista cripto: $20+ es posible, pero este es un escenario especulativo, no un objetivo garantizado.
#LINK #USStrikesIranTankersTehranRestrictsHormuz #ChainlinkUpdate
$ está cotizando alrededor de $13, después de un fuerte movimiento desde aproximadamente $11.1–$11.3 a principios de septiembre. El 6 de septiembre, LINK alcanzó un máximo intradía cerca de $13.36, mostrando un renovado impulso alcista.
Perspectiva técnica:
🟢 Alcista: Un movimiento sostenido por encima de $13.30–$13.50 podría abrir el camino hacia $14.50–$15.00.
🟡 Soporte: La primera zona importante está alrededor de $12.00–$12.20, seguida de $11.00–$11.30.
🔴 Una ruptura por debajo de $11 podría debilitar la configuración alcista a corto plazo.
Fundamentales: La perspectiva de Chainlink sigue siendo interesante porque LINK impulsa los pagos, la seguridad de la red y los incentivos dentro del ecosistema de Chainlink. Chainlink informa más de $33T en valor de transacciones acumulado habilitado, mientras que la adopción de CCIP continúa expandiéndose.
Perspectiva futura
Si el mercado cripto más amplio se mantiene alcista y Chainlink sigue ganando adopción en DeFi, infraestructura entre cadenas y finanzas institucionales, LINK podría tener un fuerte potencial a largo plazo. Chainlink también reportó un crecimiento significativo de CCIP, incluyendo un 78% de crecimiento en la transferencia de volumen trimestre contra trimestre en el Q1 2026.
Mi escenario:
Corto plazo: Alcista por encima de $12
Mediano plazo: $15–$20 es posible si el impulso continúa
Fuerte mercado alcista cripto: $20+ es posible, pero este es un escenario especulativo, no un objetivo garantizado.
#LINK #USStrikesIranTankersTehranRestrictsHormuz #ChainlinkUpdate
Ver traducción
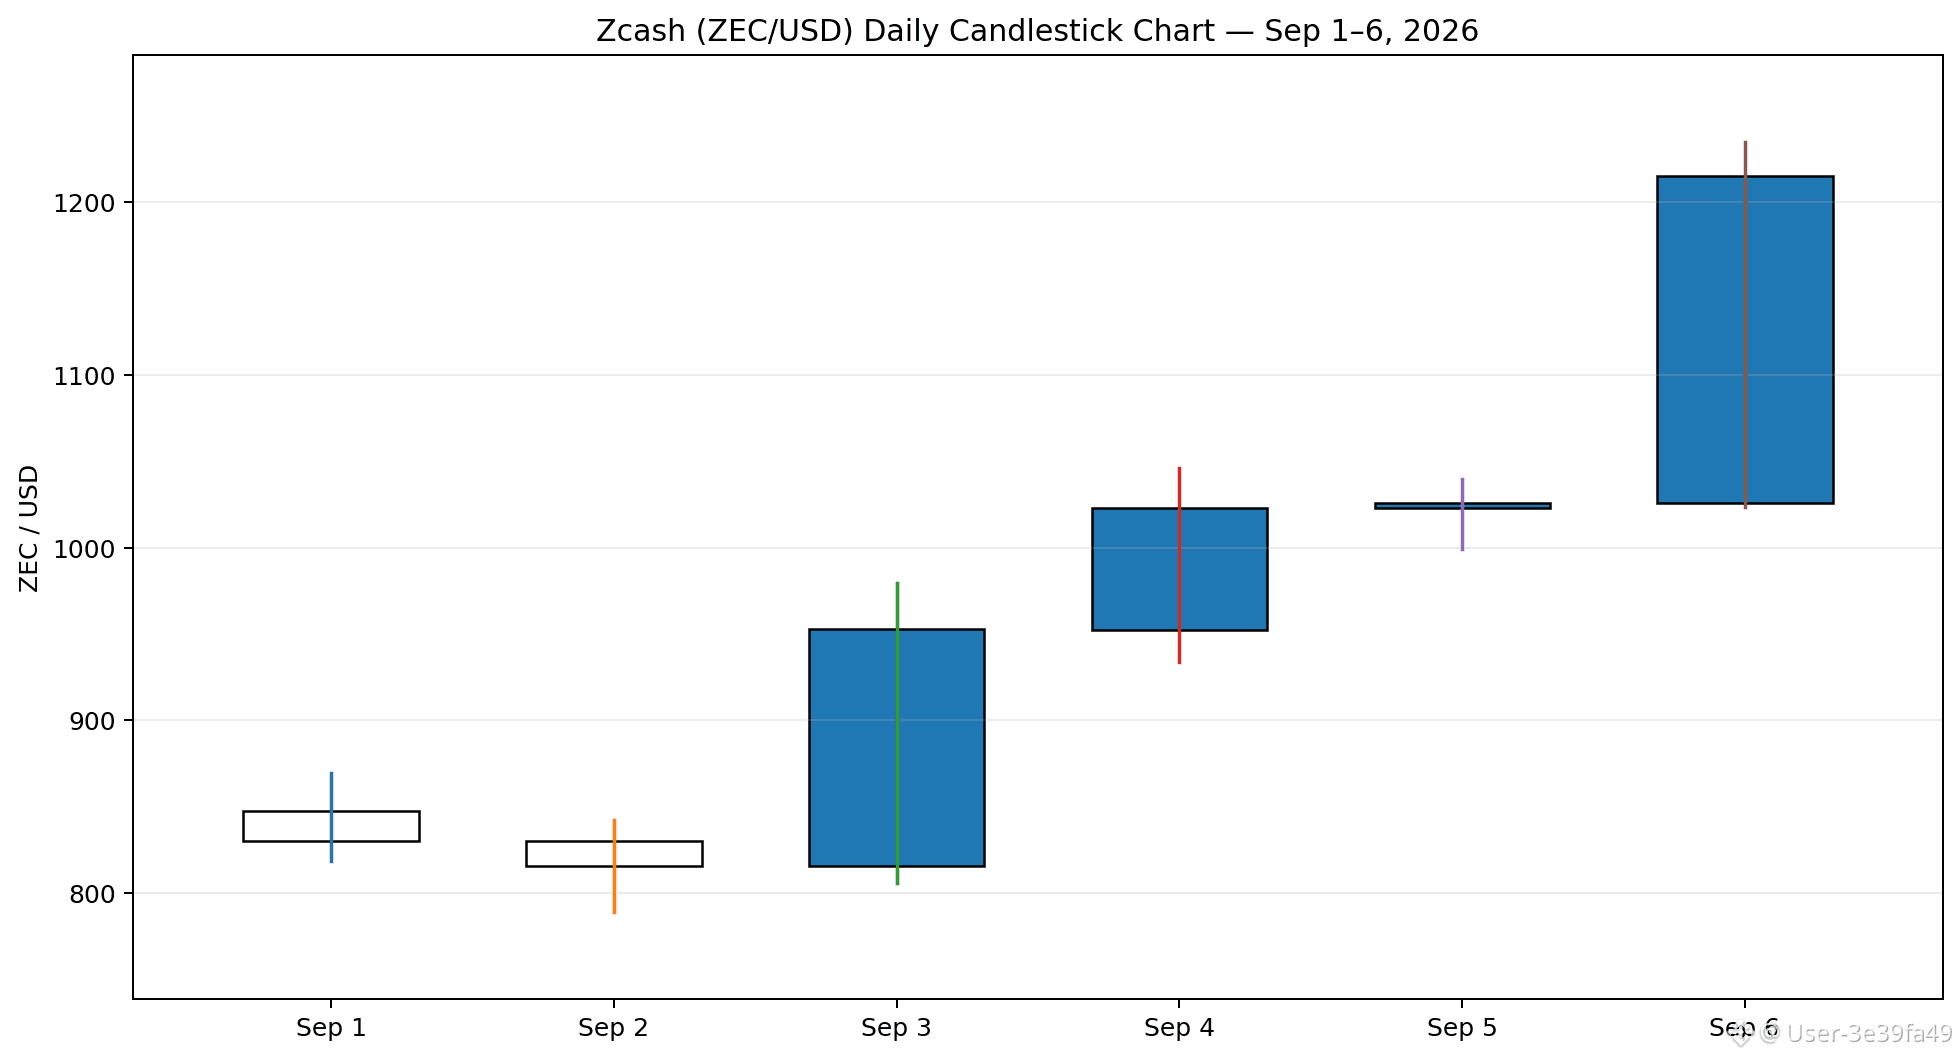
$ZEC is showing very strong bullish momentum. As of September 7, 2026, it is trading around $1,200–$1,230, after rising sharply from around $830 at the start of September. Recent 7-day performance is roughly +45%, with trading volume also elevated.
🟢 Trend: Strong bullish
🔥 Momentum: Very high; risk of short-term correction is increasing
📈 Resistance: ~$1,250, followed by ~$1,400–$1,500
🛡️ Support: ~$1,020–$1,050, then ~$950
⚠️ A break below $1,000 could lead to a deeper pullback.
Zcash's privacy technology and renewed market interest are major positives. Its maximum supply is capped at 21 million ZEC, which also gives it a scarcity narrative.
🔮 Future outlook
These are scenario estimates, not guaranteed prices:
Scenario Possible ZEC range
🐻 Bearish correction $800–$950
🟡 Normal bullish continuation $1,300–$1,600
🟢 Strong bull market $1,800–$2,500+
🚀 Extreme hype/altseason $3,000+
My short-term bias: Bullish, but after such a rapid move, I would expect volatility and possible profit-taking before another major leg higher.
#zec #IMFSaysElSalvadorBTCNoPublicFunds #SideSwapSuspendsLiquidServices #ZECUSDT
🟢 Trend: Strong bullish
🔥 Momentum: Very high; risk of short-term correction is increasing
📈 Resistance: ~$1,250, followed by ~$1,400–$1,500
🛡️ Support: ~$1,020–$1,050, then ~$950
⚠️ A break below $1,000 could lead to a deeper pullback.
Zcash's privacy technology and renewed market interest are major positives. Its maximum supply is capped at 21 million ZEC, which also gives it a scarcity narrative.
🔮 Future outlook
These are scenario estimates, not guaranteed prices:
Scenario Possible ZEC range
🐻 Bearish correction $800–$950
🟡 Normal bullish continuation $1,300–$1,600
🟢 Strong bull market $1,800–$2,500+
🚀 Extreme hype/altseason $3,000+
My short-term bias: Bullish, but after such a rapid move, I would expect volatility and possible profit-taking before another major leg higher.
#zec #IMFSaysElSalvadorBTCNoPublicFunds #SideSwapSuspendsLiquidServices #ZECUSDT
Ver traducción
$BTC
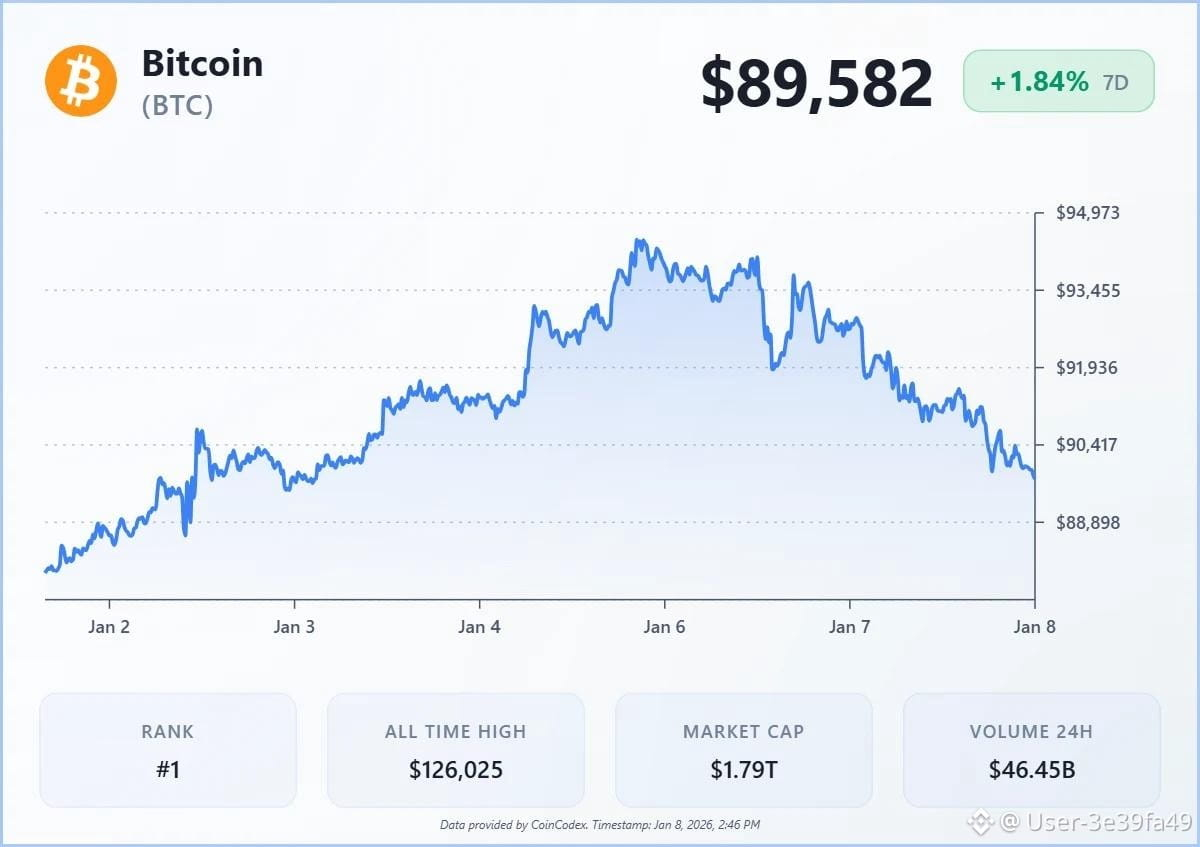
is trading around $79.6K–$80K. After a strong rally toward $82K, Bitcoin has pulled back slightly and is currently consolidating around the $80K area.
📊 Key Levels
🟢 Support: $79K → $75.7K → $71.8K
🔴 Resistance: $82K–$82.8K
🚀 Bullish breakout: A strong daily close above ~$82.8K could open the path toward $85K–$90K.
⚠️ Bearish warning: Losing $75.7K would weaken the current bullish setup.
🔥 What's Driving BTC?
Bitcoin's recent rally was supported by improving risk sentiment and expectations around U.S. monetary policy. However, stronger-than-expected U.S. jobs data has increased uncertainty about the Federal Reserve's next move.
The September 11 U.S. CPI report is now one of the biggest near-term catalysts. Lower inflation could support BTC, while hotter inflation could pressure risk assets.
#USAugustNonfarmPayrollsDueToday #USAugustAvgHourlyEarningsRise3.1% #BitcoinETFsBiggestDailyInflowSinceJanuary
is trading around $79.6K–$80K. After a strong rally toward $82K, Bitcoin has pulled back slightly and is currently consolidating around the $80K area.
📊 Key Levels
🟢 Support: $79K → $75.7K → $71.8K
🔴 Resistance: $82K–$82.8K
🚀 Bullish breakout: A strong daily close above ~$82.8K could open the path toward $85K–$90K.
⚠️ Bearish warning: Losing $75.7K would weaken the current bullish setup.
🔥 What's Driving BTC?
Bitcoin's recent rally was supported by improving risk sentiment and expectations around U.S. monetary policy. However, stronger-than-expected U.S. jobs data has increased uncertainty about the Federal Reserve's next move.
The September 11 U.S. CPI report is now one of the biggest near-term catalysts. Lower inflation could support BTC, while hotter inflation could pressure risk assets.
#USAugustNonfarmPayrollsDueToday #USAugustAvgHourlyEarningsRise3.1% #BitcoinETFsBiggestDailyInflowSinceJanuary
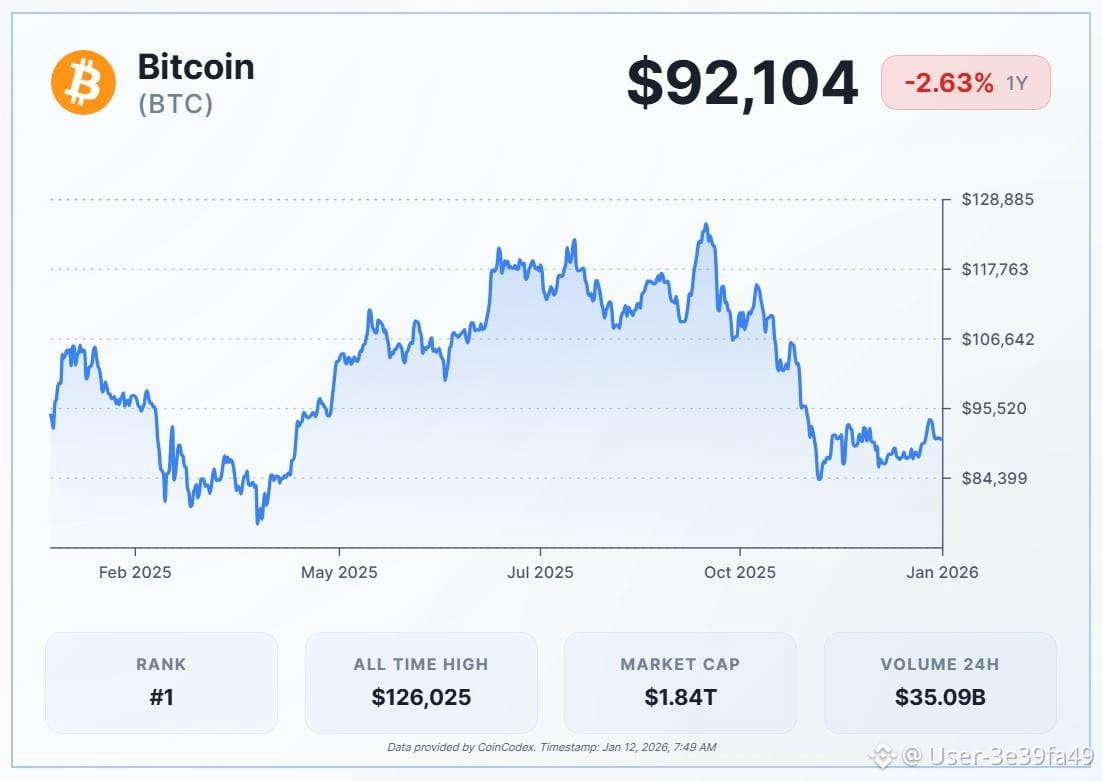
Precio actual: alrededor de $79,900 al 6 de septiembre de 2026.
Visión del mercado: 📈 Alcistamente cauteloso
$BTC ha repuntado con fuerza recientemente y se ha movido por encima de las principales medias móviles, mejorando la tendencia a corto plazo.
Soporte: alrededor de $79,000–$75,000
Resistencia: alrededor de $82,000–$83,000, seguida de $85,000–$90,000.
Una ruptura sostenida por encima de $83K–$85K podría fortalecer el movimiento alcista.
Si BTC pierde $75K, la configuración alcista se debilita y podría seguir una corrección más profunda.
El próximo informe de inflación IPC de EE. UU. el 11 de septiembre es un catalizador importante a corto plazo para Bitcoin.
#RussiaUkraine72-hourCeasefire #ZECHitsANewAllTimeHigh #LululemonTumbles20%OnWeakGuidance #BitcoinETFsBiggestDailyInflowSinceJanuary
Visión del mercado: 📈 Alcistamente cauteloso
$BTC ha repuntado con fuerza recientemente y se ha movido por encima de las principales medias móviles, mejorando la tendencia a corto plazo.
Soporte: alrededor de $79,000–$75,000
Resistencia: alrededor de $82,000–$83,000, seguida de $85,000–$90,000.
Una ruptura sostenida por encima de $83K–$85K podría fortalecer el movimiento alcista.
Si BTC pierde $75K, la configuración alcista se debilita y podría seguir una corrección más profunda.
El próximo informe de inflación IPC de EE. UU. el 11 de septiembre es un catalizador importante a corto plazo para Bitcoin.
#RussiaUkraine72-hourCeasefire #ZECHitsANewAllTimeHigh #LululemonTumbles20%OnWeakGuidance #BitcoinETFsBiggestDailyInflowSinceJanuary
Inicia sesión para explorar más contenidos