

Atta_e_Abbas110
3 Publicaciones

Atta_e_Abbas110
Denunciar
Bloquear usuario
10 Siguiendo
22 Seguidores
14 Me gusta
Publicaciones
🧠 Gestión de Riesgo vs. Volatilidad del Mercado: ¿Hacia Dónde se Mueve la Liquidez?
Con $BTC manteniendo un fuerte dominio por encima del 59% y los rendimientos macro cambiando, el mercado está mostrando una división clásica: el capital institucional priorizando la seguridad, mientras los traders dinámicos buscan volatilidad en altcoins de alto volumen.
Navegar con éxito estas condiciones del mercado no se trata de adivinar el máximo o el mínimo exacto, sino de ejecutar un marco de riesgo sistemático.
Aquí hay 3 reglas de ejecución que todo trader debería seguir ahora mismo:
1️⃣ La higiene del margen importa (aislado vs. cruzado)
En oscilaciones volátiles, sobreapalancar el margen cruzado puede poner en riesgo todo el saldo de tu cuenta. Utilizar Margen Aislado limita tu desventaja por posición y mantiene protegido tu capital principal.
2️⃣ Monitorea la liquidez del libro de órdenes y los mapas de calor
No operes a ciegas contra la resistencia. Observa los mapas de profundidad para identificar dónde se encuentran realmente las grandes paredes de venta y los clústeres de liquidez antes de colocar órdenes limitadas. Las falsas rupturas suelen ocurrir cuando la liquidez se reduce en volúmenes bajos.
3️⃣ Enfócate primero en la preservación del capital
Una estrategia ganadora se centra en el potencial alcista, pero una estrategia sostenible se centra en proteger el lado bajista. Calcula siempre el tamaño de tu posición en función del porcentaje máximo de pérdida aceptable, no del beneficio potencial.
📌 Enfoque actual y configuración de la comunidad:
¿Estás manteniendo posiciones spot durante esta fase de consolidación o haciendo scalping activo de la volatilidad a corto plazo?
¡Deja tu configuración y niveles clave de precio abajo! 👇
$BTC $ETH
#CryptoTrading. #BinanceSquareFamily #writetoearn #RiskManagementMastery #MarketAnalysis
98
Ver traducción
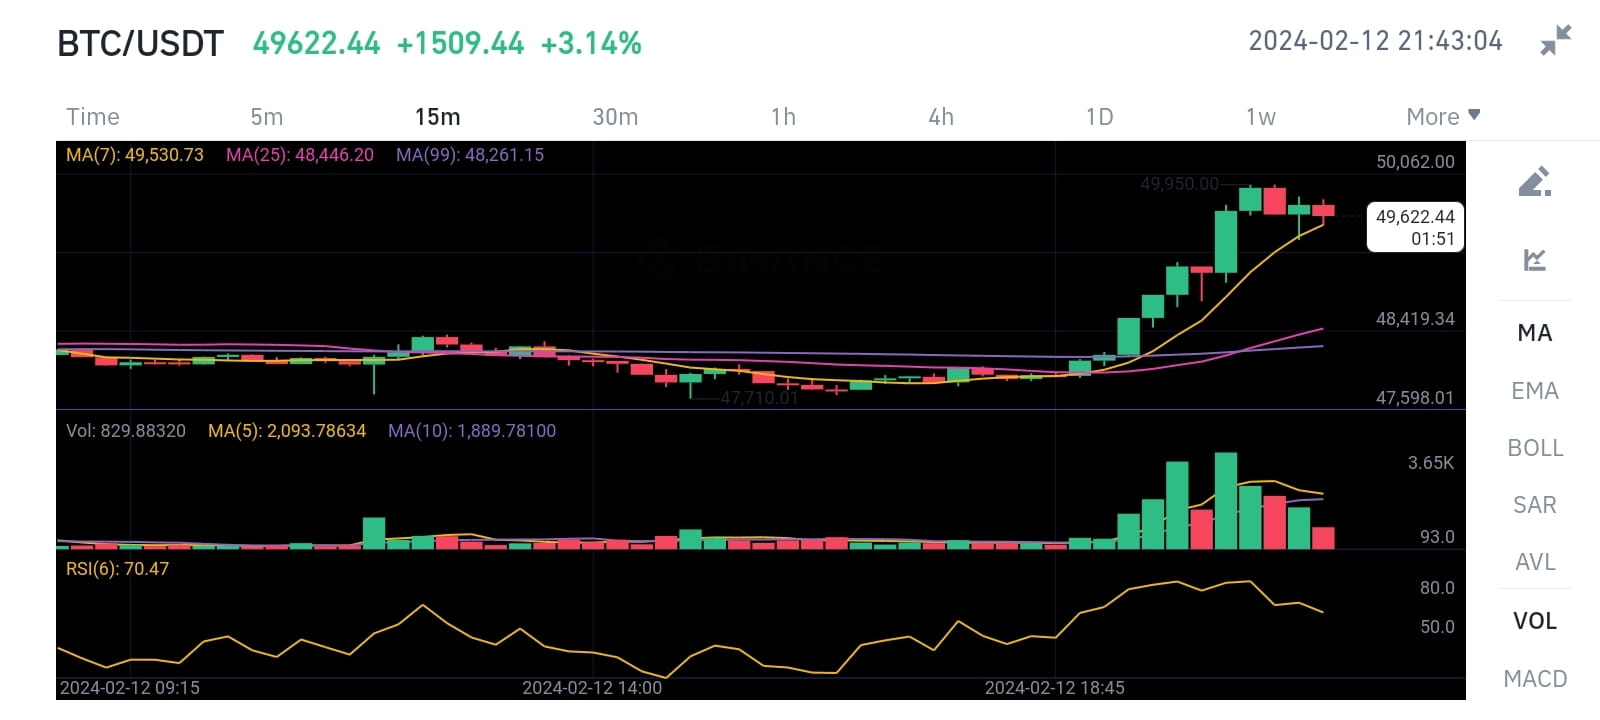
$BTC I can try to help you with that. Here is my analysis of the chart:
The chart shows the price movement of BTC/USDT (Bitcoin/Tether) trading pair on a 15-minute time frame.
The price is in an uptrend, as indicated by the higher highs and higher lows, and the moving averages (MA7, MA25, MA99) being in ascending order.
The support point is around 47,598.01, where the price had a consolidation before moving upwards. This level can act as a floor for the price, and if it breaks below it, it may signal a reversal of the trend.
The resistance point is at 50,062.00, where the highest price is marked. This level can act as a ceiling for the price, and if it breaks above it, it may signal a continuation of the trend.
The RSI (Relative Strength Index) is at 70.47, which is close to the overbought zone (above 70). This means that the price may be overvalued and due for a correction or a pullback.
The volume bars show that the buying volume is higher than the selling volume, which confirms the bullish sentiment of the market.
Based on this analysis, one possible trading strategy is to buy BTC/USDT at the support level of 47,598.01, and sell it at the resistance level of 50,062.00, or hold it until the trend changes. However, this is not a financial advice, and you should do your own research and risk management before making any trading decisions.
if you want more analysis like this you have to like comment
#Write2Earn
#TrendingTopic #BTC
7
984
Ver traducción
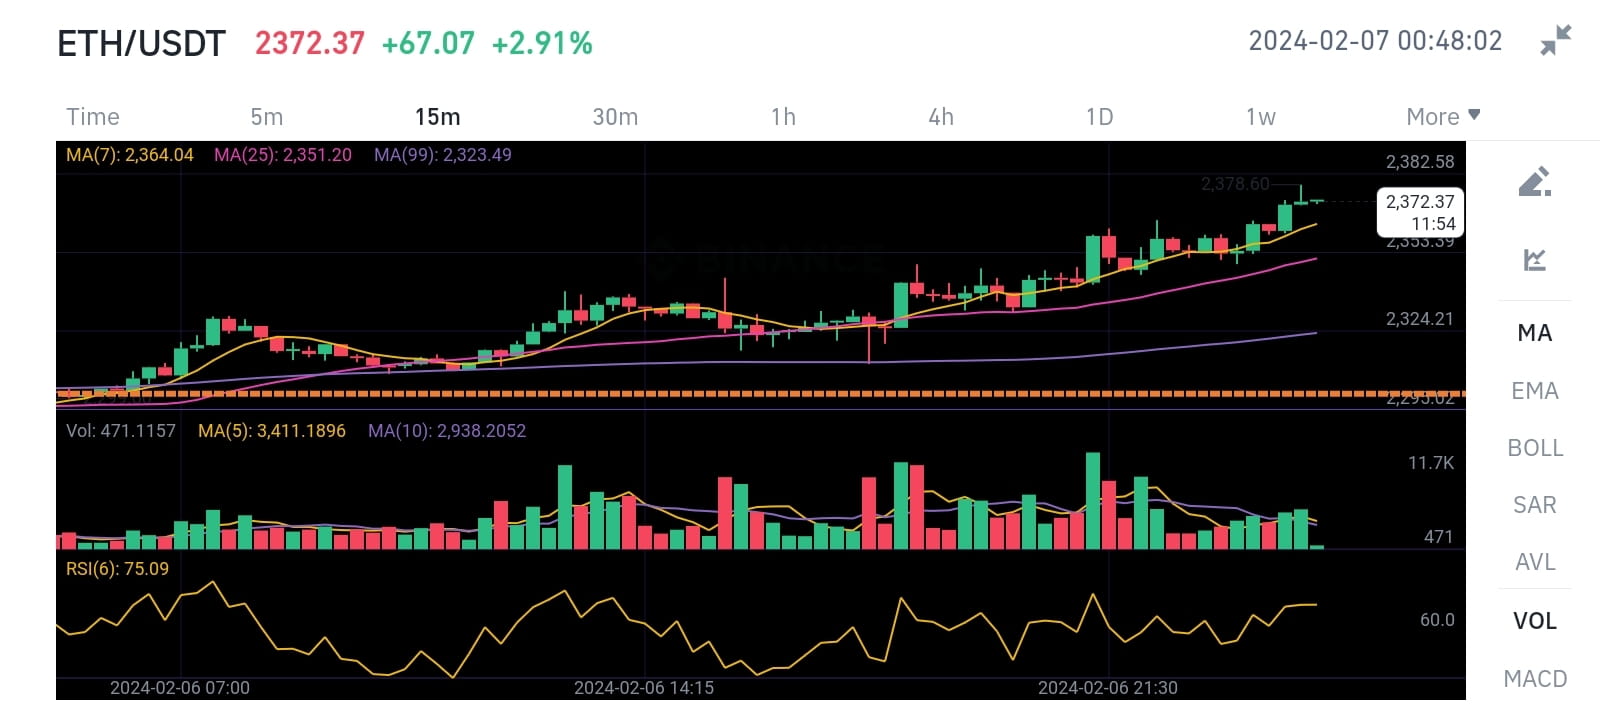
$ETH This is my technical analysis for this chart. I hope you find it helpful. 😊
The support can be identified around the price of 2324.21 USDT where the price has bounced back up previously. This level also coincides with the MA99 line, which adds to its strength as a support. If the price breaks below this level, it could indicate a bearish trend and the next support could be around 2300 USDT where the price has found support in the past.
The resistance point is likely near the current high in this image at 2372.37 USDT. This level is also close to the RSI overbought zone, which suggests that the price might face some selling pressure and pull back. If the price breaks above this level, it could indicate a bullish trend and the next resistance could be around 2400 USDT where the price has faced resistance in the past.#Write2Earn #Write2Earn #Write2Earn
7
2.1k
Inicia sesión para explorar más contenidos
Únete a usuarios globales de criptomonedas en Binance Square
⚡️ Obtén información útil y actualizada sobre criptos.
💬 Avalado por el mayor exchange de criptomonedas en el mundo.
👍 Descubre perspectivas reales de creadores verificados.
Email/número de teléfono
Temas populares
CanMicrosoftDeliverOnAI
305,586 vistas
2,427 están debatiendo
Sesión 3 de la temporada de resultados: ¿Superarán Google y Microsoft las expectativas?
Binance Square Official
·124 me gusta
·57.7k vistas
CanGoogleDefindItsCore
176,823 vistas
1,717 están debatiendo
EarningsSeason
5.8M vistas
28,464 están debatiendo