
MacroMicro
46 Publicaciones

MacroMicro
Denunciar
Bloquear usuario
Global Data and AI Decision Platform. Over 100 million data points and years of research to help you make smarter decisions: https://en.macromicro.me
0 Siguiendo
369 Seguidores
91 Me gusta
Publicaciones
PINNED
·
--
👋🏻 Conoce MacroMicro — Plataforma Global de Datos y Decisiones con IA
Fundada en 2015, comenzamos con una sola creencia: los datos económicos no deberían pertenecer a unos pocos — deberían ser intuitivos, visuales y accesibles para todos.
Lo que empezó como una plataforma de datos macro se ha convertido en un ecosistema integral de toma de decisiones financieras, ahora impulsado por IA para conectar los fundamentos económicos con las tendencias de la industria y las finanzas de las empresas.
📊 100M+ puntos de datos, 900K+ gráficos interactivos
🌍 600K+ usuarios en todo el mundo, 9.5M+ visitas mensuales
🤝 Confiado por 150+ empresas en todo el mundo, incluyendo TSMC, moomoo y Yahoo Finance.
Te ayudamos a ir más allá de los gráficos de precios, entendiendo por qué se mueven los mercados, no solo que se movieron. Desde la política de los bancos centrales hasta el ciclo de capex impulsado por IA y las cadenas globales de suministro, conectamos los puntos entre los fundamentos macro, las industrias y los datos de las empresas.
🔗 Explora MacroMicro: https://en.macromicro.me/
#MacroMicro #MacroEconomics #AI #DataDriven #GlobalMarkets
👋🏻 Conoce MacroMicro — Plataforma Global de Datos y Decisiones con IA
Fundada en 2015, comenzamos con una sola creencia: los datos económicos no deberían pertenecer a unos pocos — deberían ser intuitivos, visuales y accesibles para todos.
Lo que empezó como una plataforma de datos macro se ha convertido en un ecosistema integral de toma de decisiones financieras, ahora impulsado por IA para conectar los fundamentos económicos con las tendencias de la industria y las finanzas de las empresas.
📊 100M+ puntos de datos, 900K+ gráficos interactivos
🌍 600K+ usuarios en todo el mundo, 9.5M+ visitas mensuales
🤝 Confiado por 150+ empresas en todo el mundo, incluyendo TSMC, moomoo y Yahoo Finance.
Te ayudamos a ir más allá de los gráficos de precios, entendiendo por qué se mueven los mercados, no solo que se movieron. Desde la política de los bancos centrales hasta el ciclo de capex impulsado por IA y las cadenas globales de suministro, conectamos los puntos entre los fundamentos macro, las industrias y los datos de las empresas.
🔗 Explora MacroMicro: https://en.macromicro.me/
#MacroMicro #MacroEconomics #AI #DataDriven #GlobalMarkets
Fundada en 2015, comenzamos con una sola creencia: los datos económicos no deberían pertenecer a unos pocos — deberían ser intuitivos, visuales y accesibles para todos.
Lo que empezó como una plataforma de datos macro se ha convertido en un ecosistema integral de toma de decisiones financieras, ahora impulsado por IA para conectar los fundamentos económicos con las tendencias de la industria y las finanzas de las empresas.
📊 100M+ puntos de datos, 900K+ gráficos interactivos
🌍 600K+ usuarios en todo el mundo, 9.5M+ visitas mensuales
🤝 Confiado por 150+ empresas en todo el mundo, incluyendo TSMC, moomoo y Yahoo Finance.
Te ayudamos a ir más allá de los gráficos de precios, entendiendo por qué se mueven los mercados, no solo que se movieron. Desde la política de los bancos centrales hasta el ciclo de capex impulsado por IA y las cadenas globales de suministro, conectamos los puntos entre los fundamentos macro, las industrias y los datos de las empresas.
🔗 Explora MacroMicro: https://en.macromicro.me/
#MacroMicro #MacroEconomics #AI #DataDriven #GlobalMarkets

1
5
6.3k
·
--
Verificado
🔥 Reunión del FOMC de septiembre de 2026: puntos clave 🔎
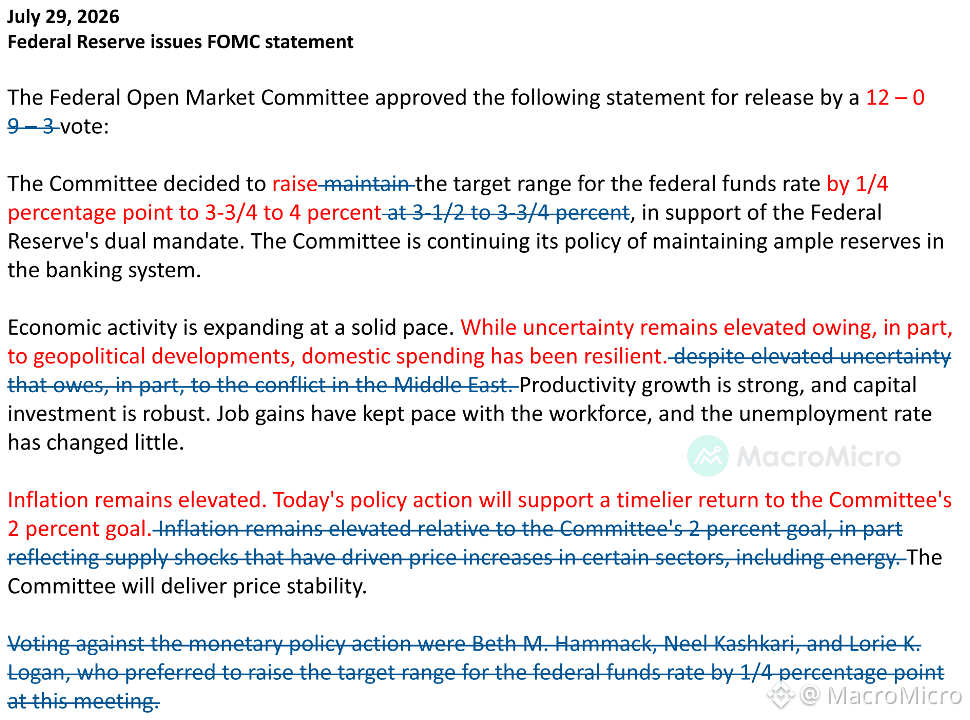
📌 La Fed subió las tasas 25 pb hasta 3.75%-4.00%, de forma unánime (12-0), citando un crecimiento económico sólido y el impulso para acelerar el avance hacia el objetivo de inflación del 2%.
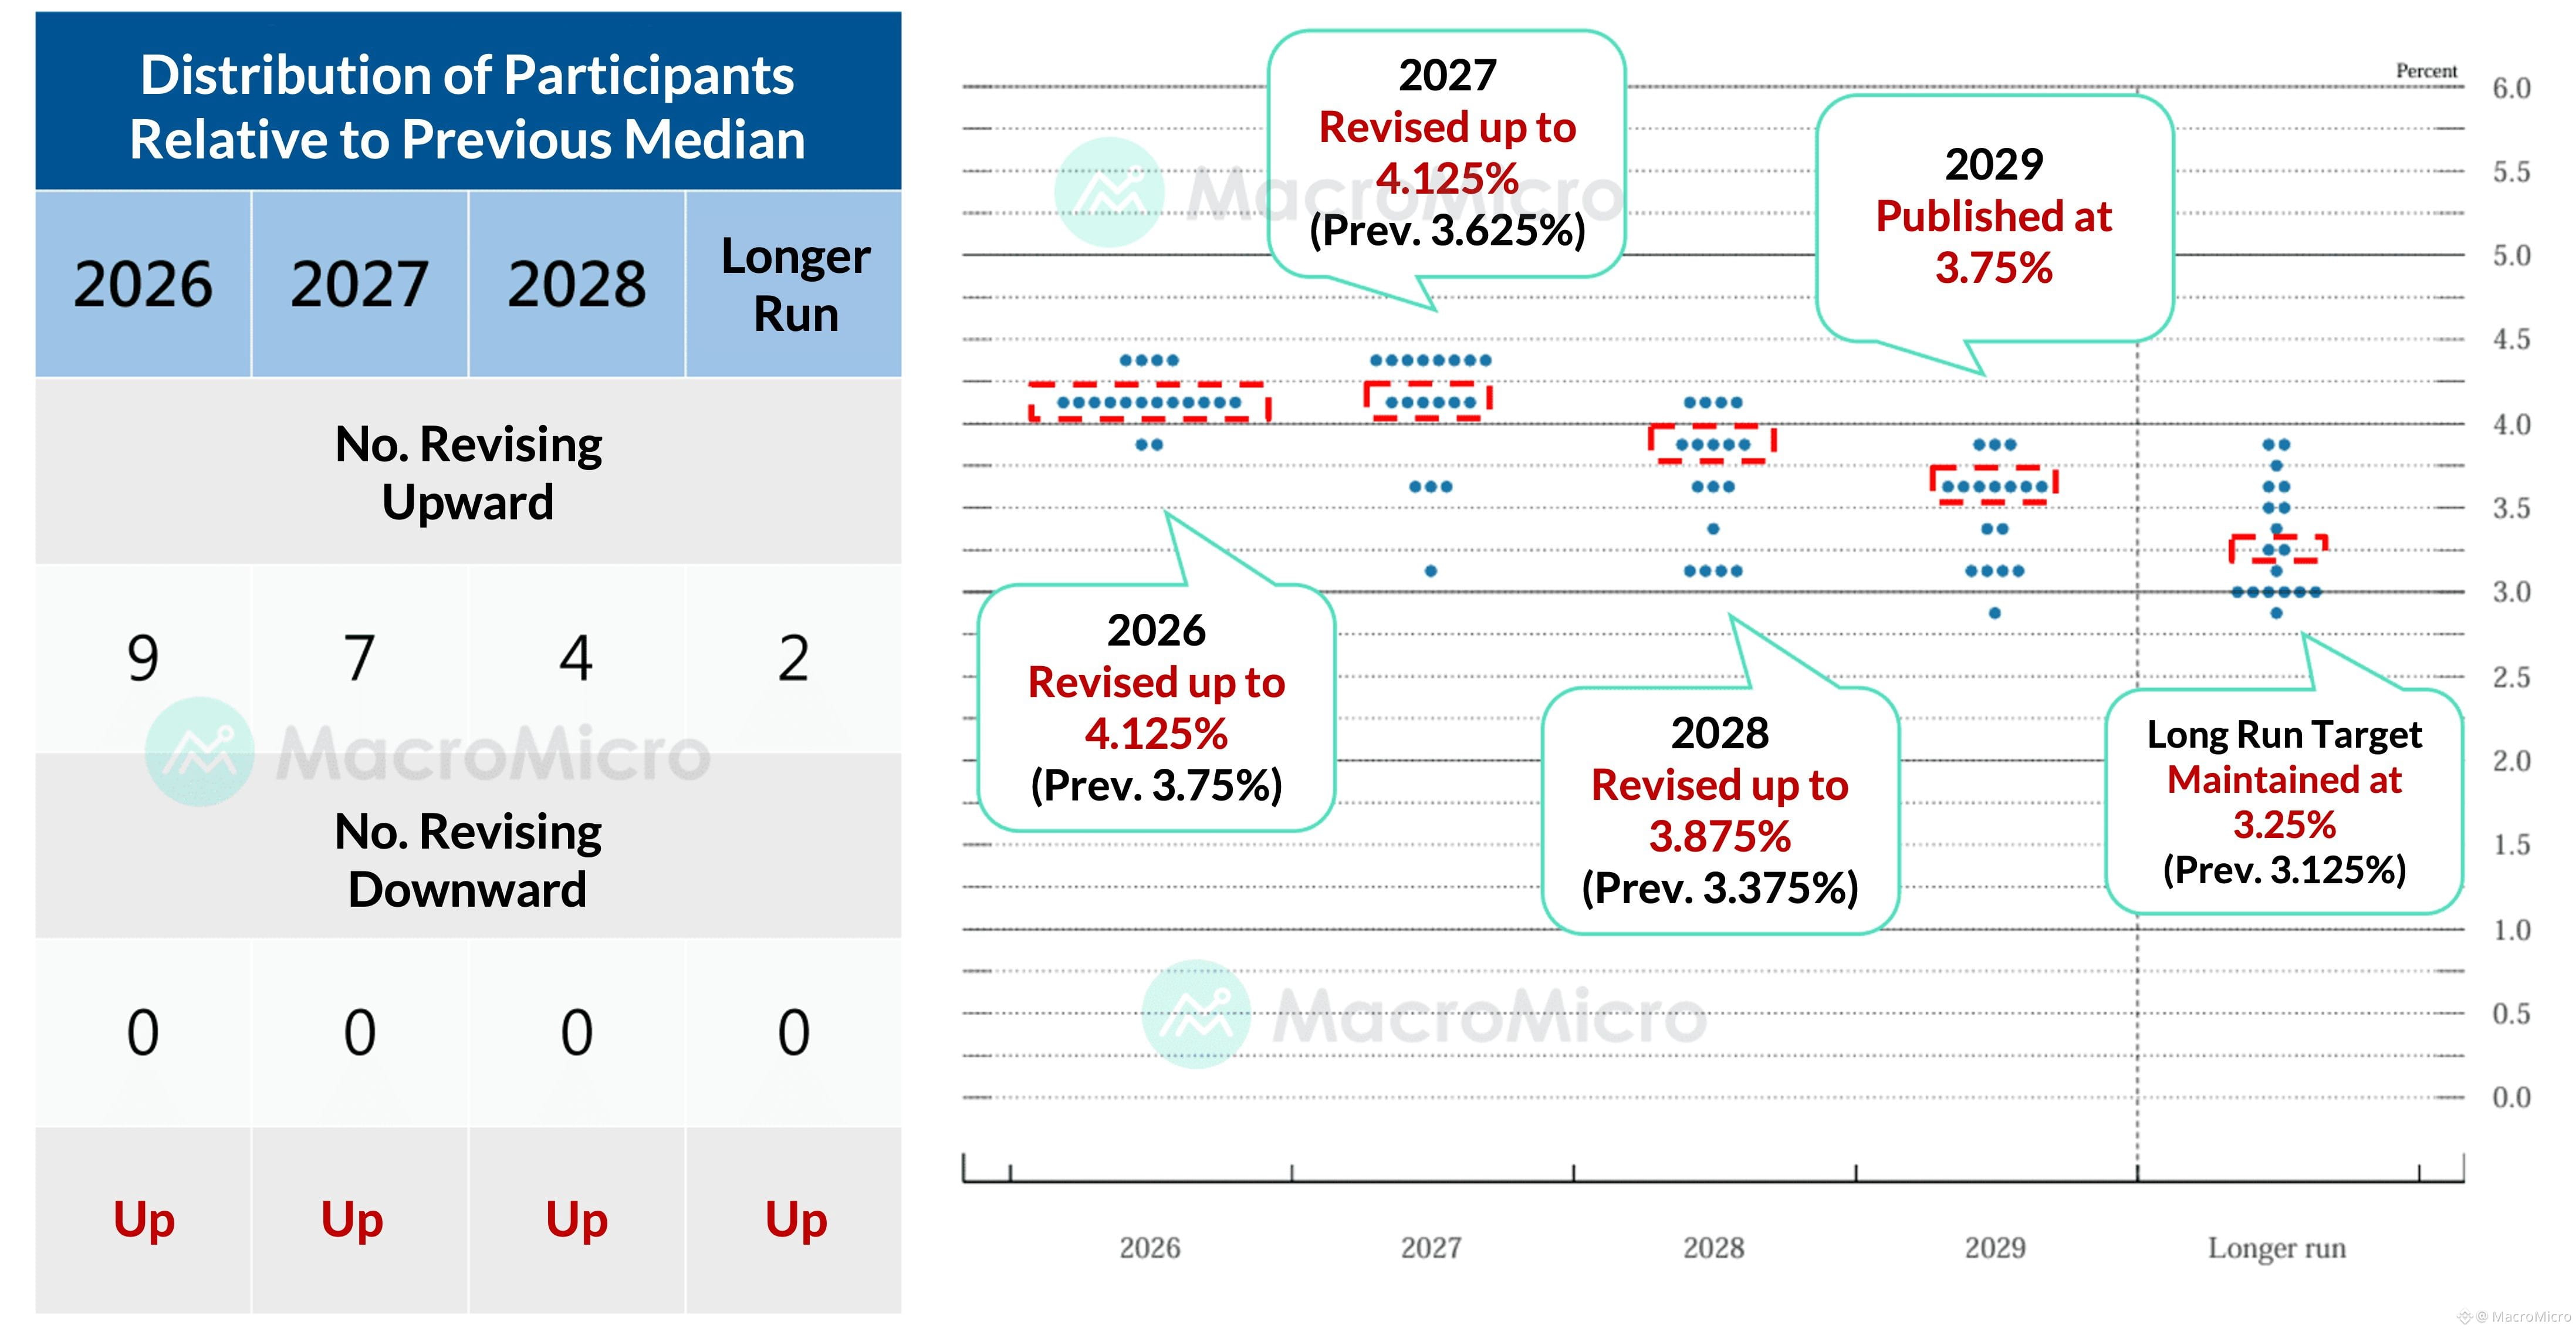
📌 El gráfico de puntos se desplazó con fuerza hacia un tono más restrictivo (hawkish): las proyecciones medianas de la tasa para 2026-2027 saltaron a 4.00%-4.25%, con 16 y 14 miembros, respectivamente, respaldando más alzas. Esto significa que podrían haber 1-2 subidas adicionales este año y el siguiente antes de que la senda de tasas vuelva a bajar, acercándose finalmente a una tasa de largo plazo más alta de 3.25%.
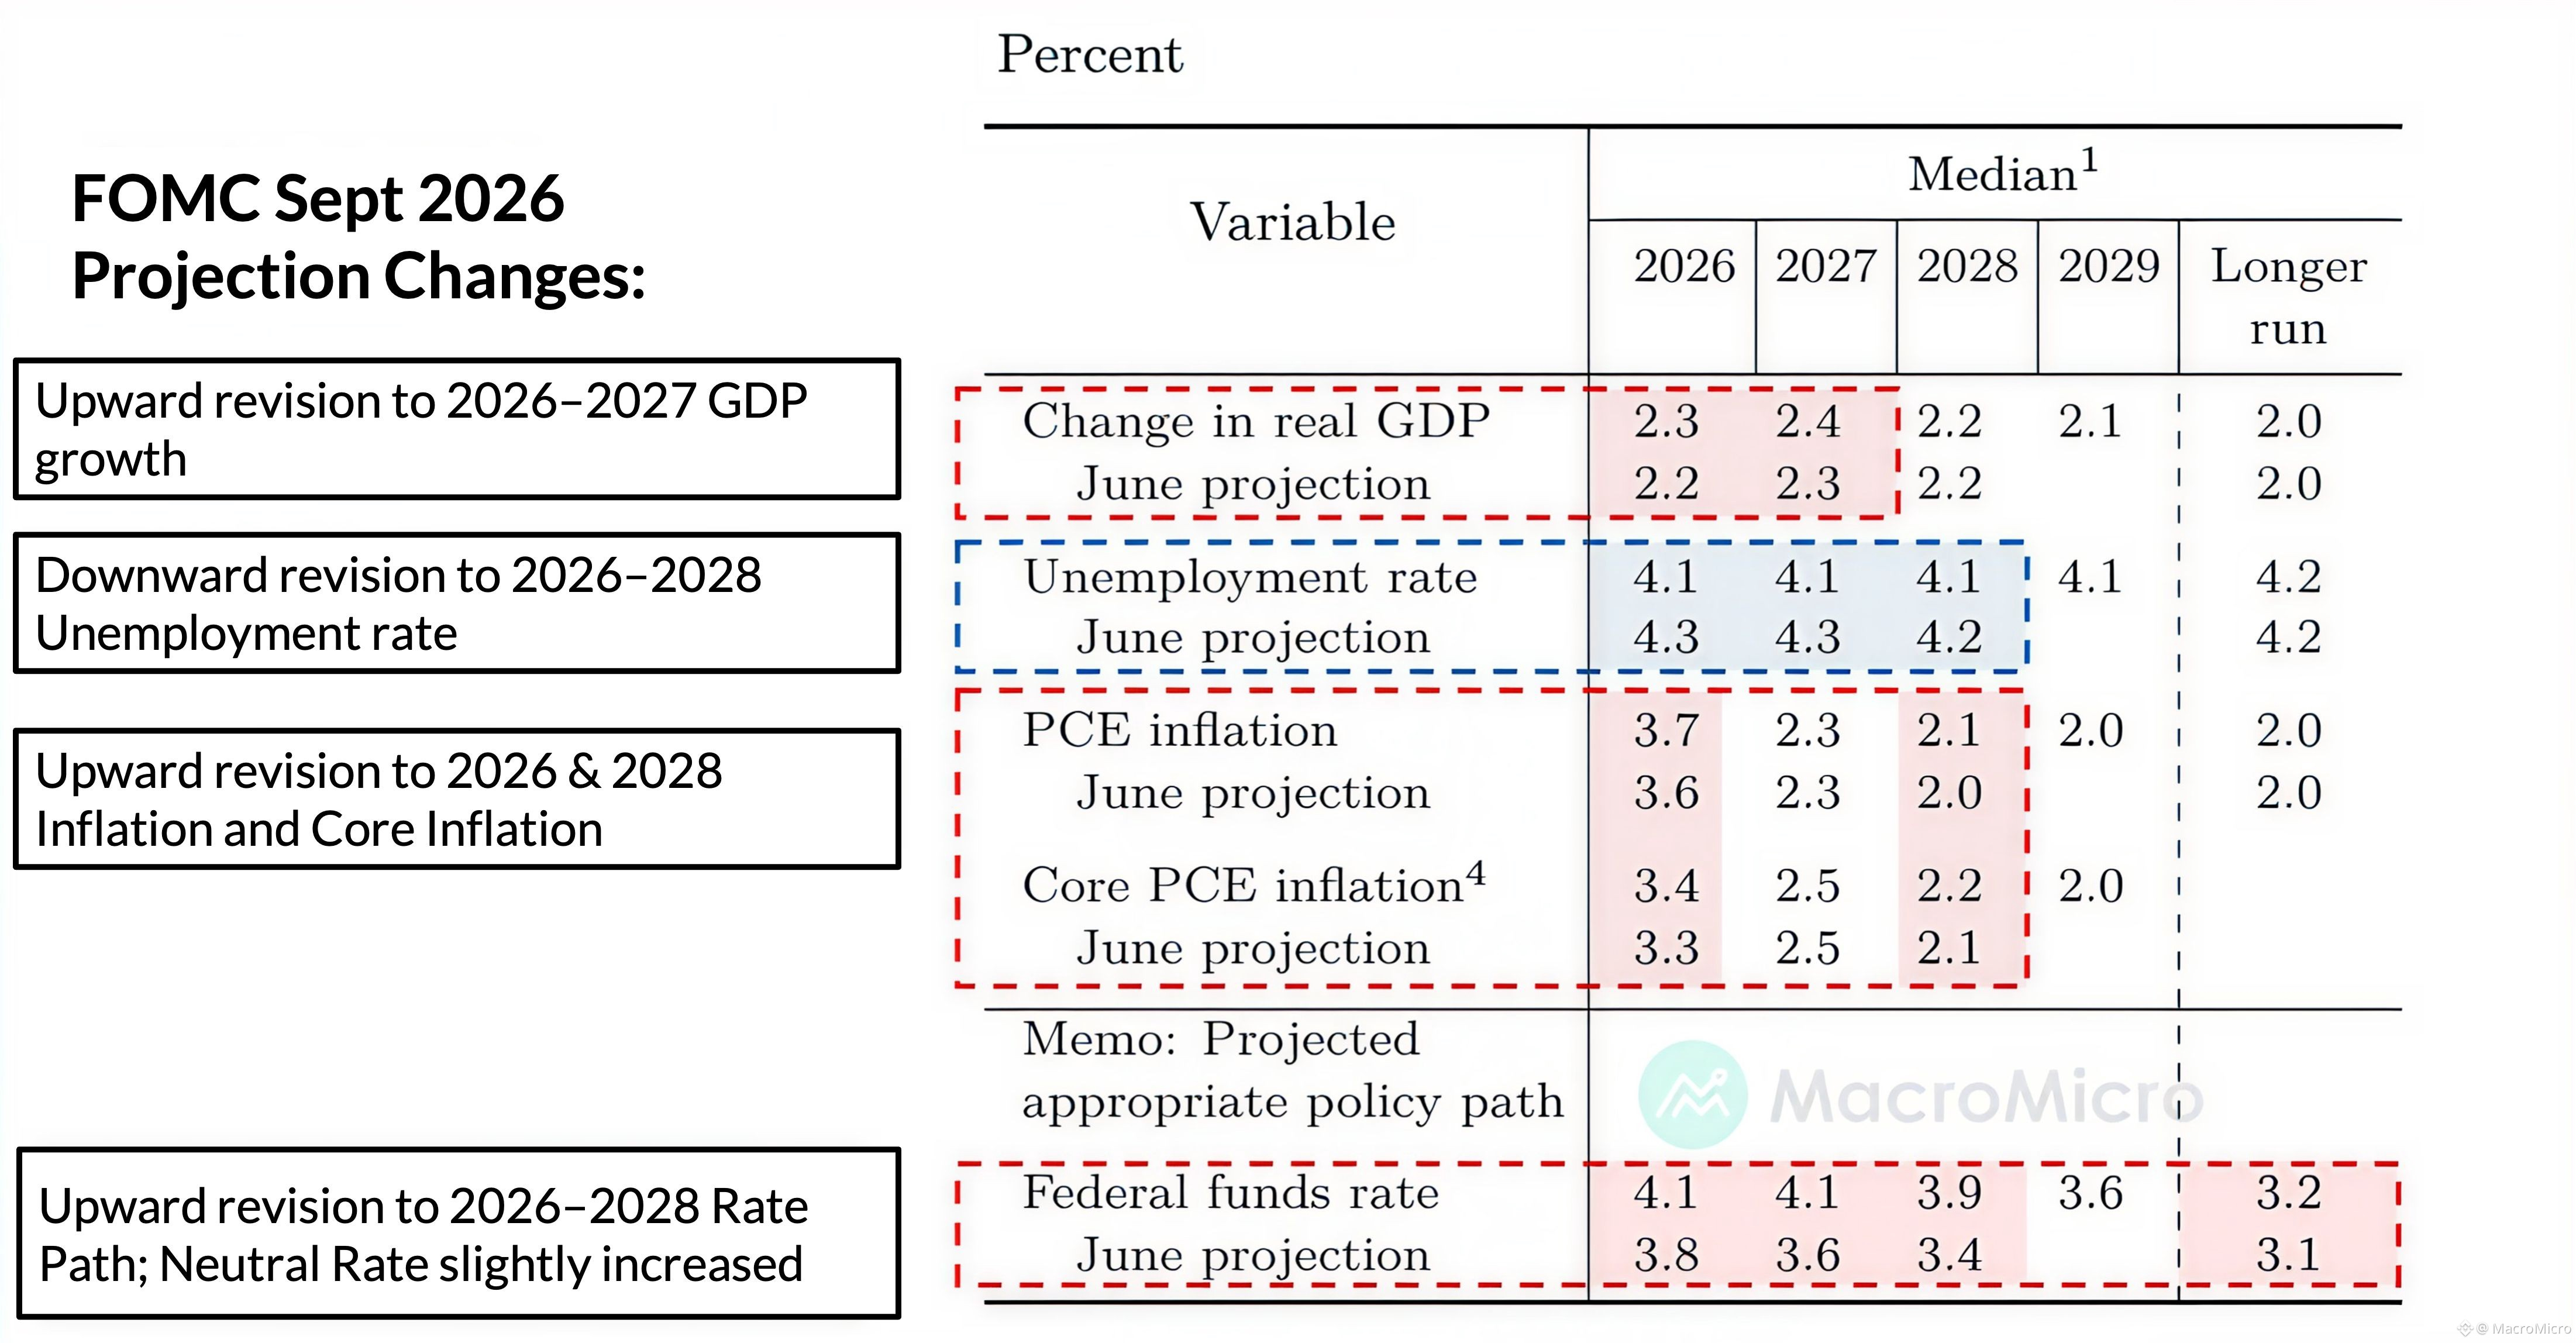
📌 Las previsiones de septiembre (SEP) muestran que la Fed se vuelve más restrictiva en todos los frentes: el PIB de 2026-2027 se elevó a 2.3% y 2.4%, el desempleo bajó a 4.1% (desde 4.3%, por debajo del promedio de largo plazo), mientras que la inflación y la inflación subyacente se revisaron al alza hasta 3.7% y 3.4% (desde 3.6% y 3.3%).
📌 Warsh dijo que la economía está en pleno empleo y que no hay conflicto entre los objetivos duales de la Fed; calificó como difícil describir las condiciones financieras actuales como restrictivas y señaló tres razones detrás de la subida: datos laborales resilientes, tendencias subyacentes de inflación aún no resueltas y el aumento del riesgo geopolítico.
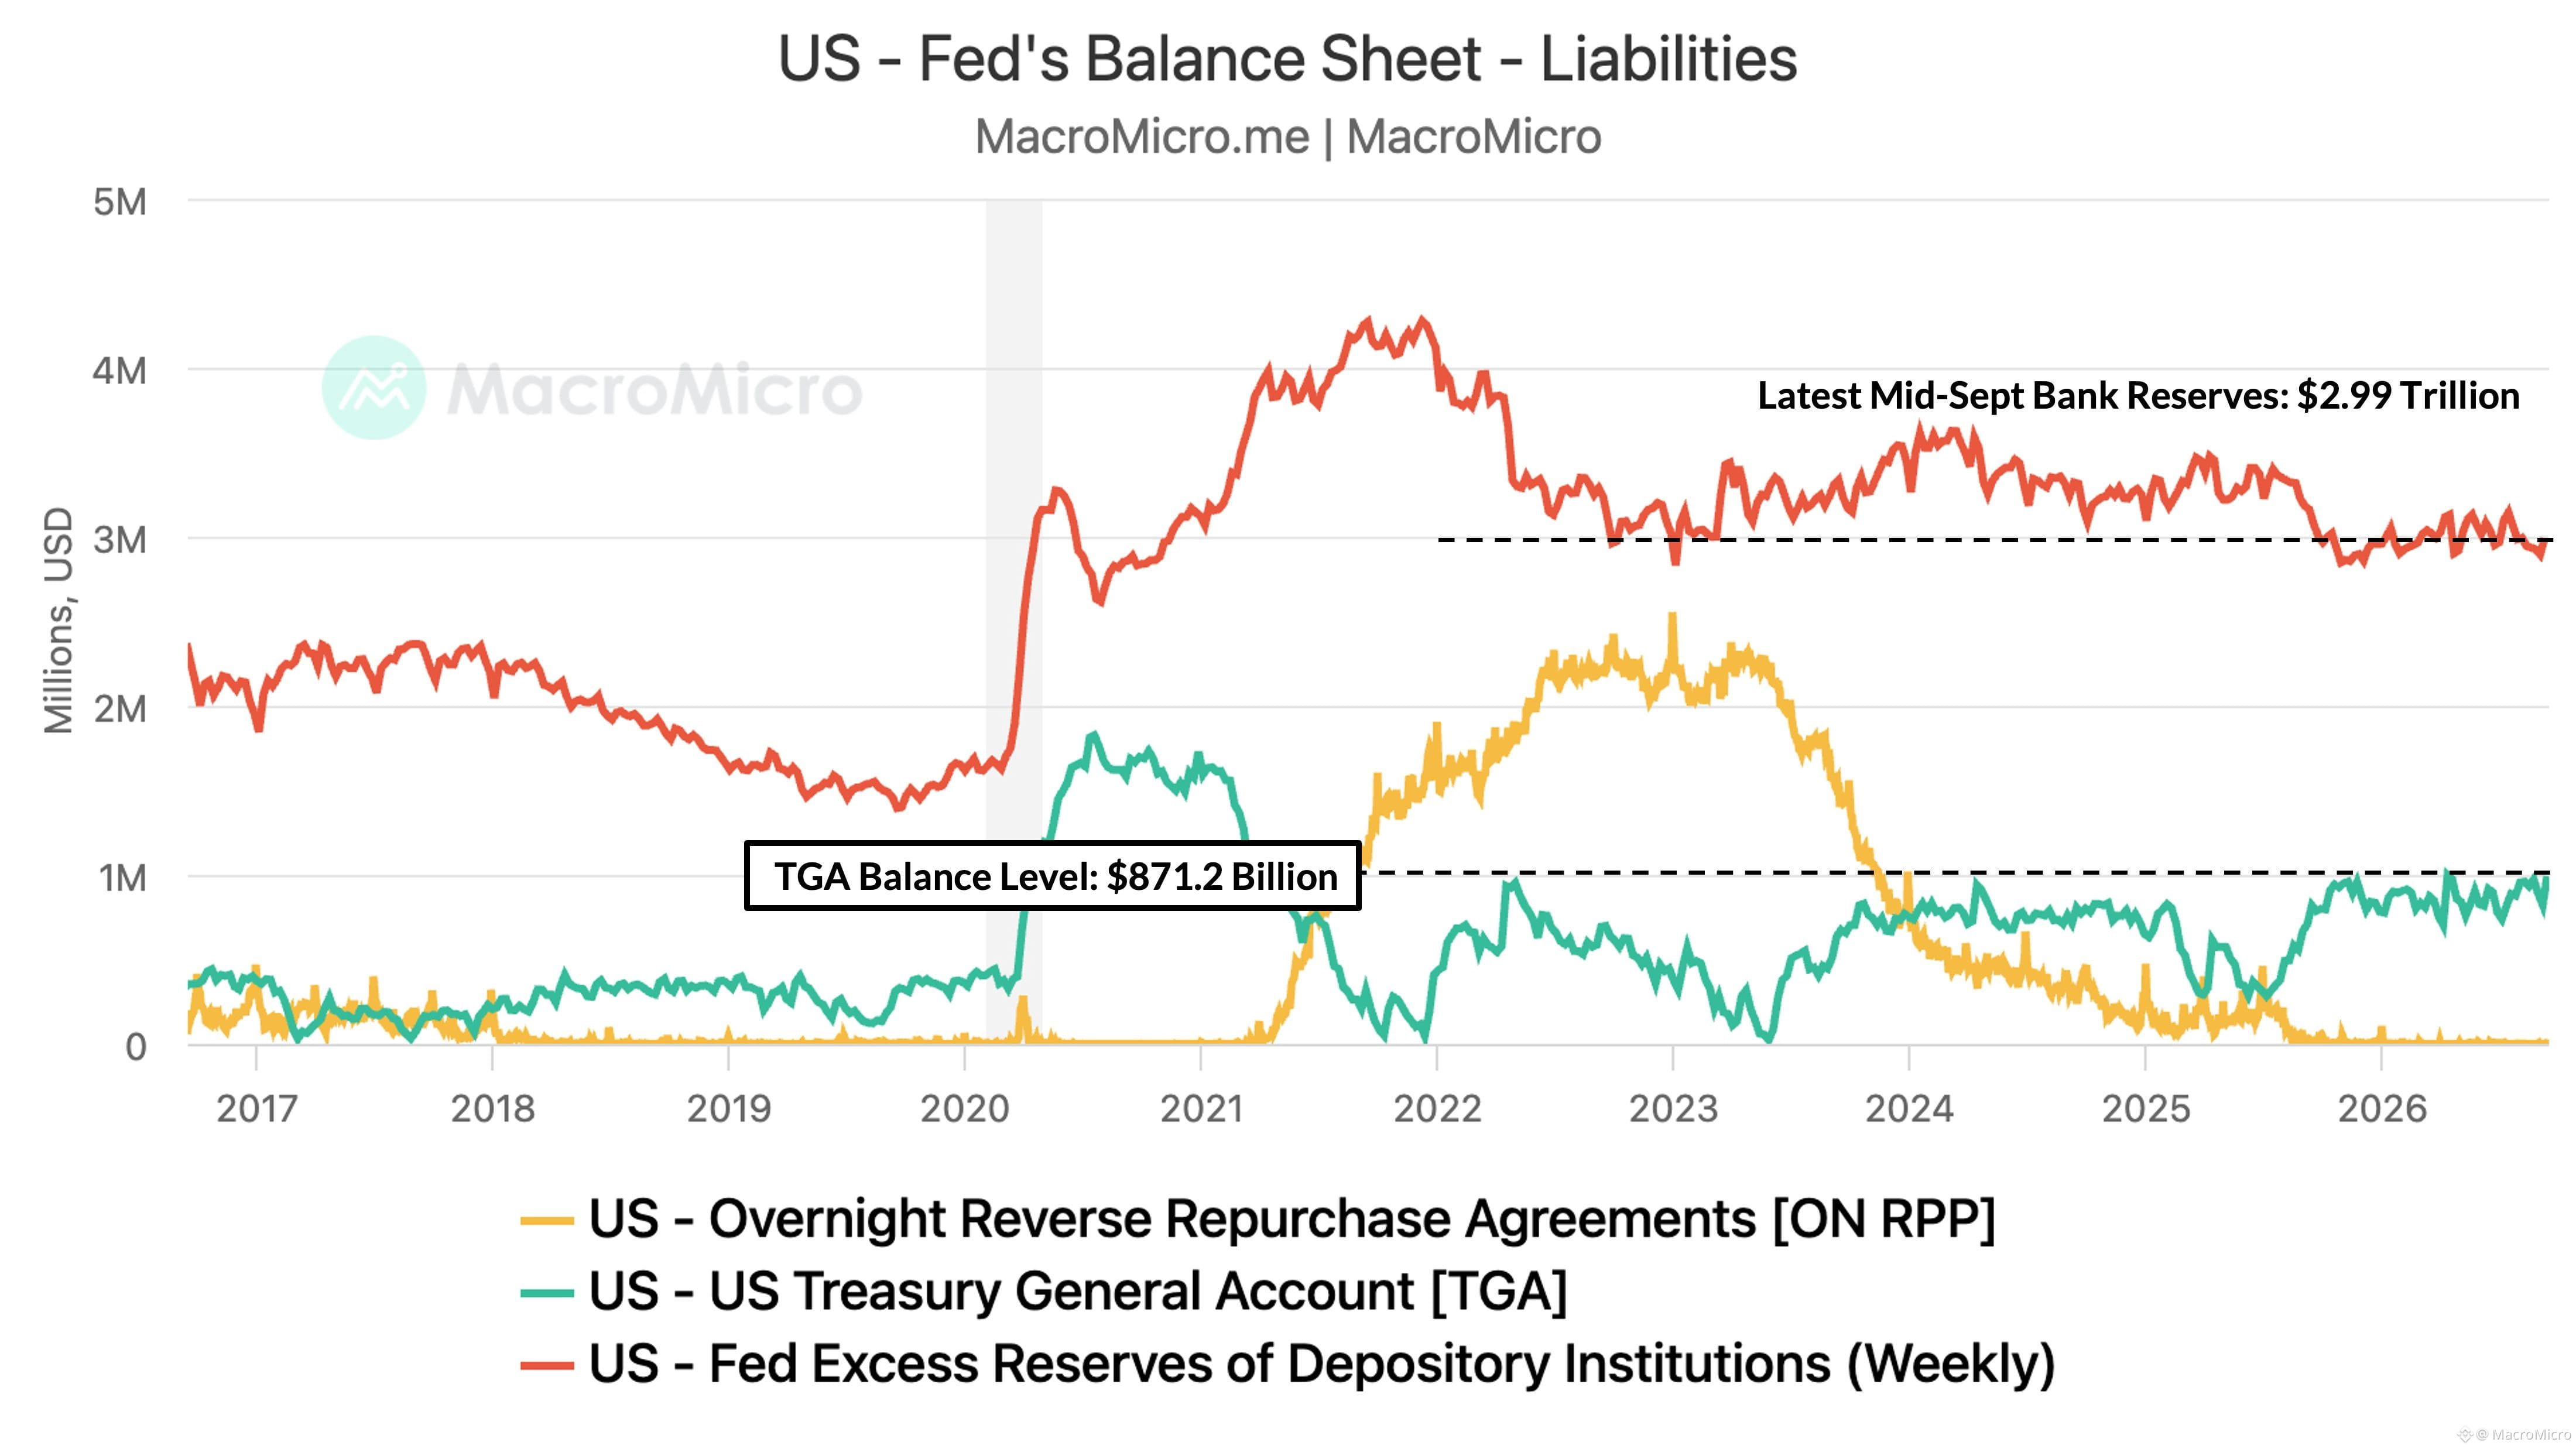
📌 La Fed reafirmó su política de abundantes reservas después de terminar en agosto las compras de letras a corto plazo. Las reservas bancarias se mantienen cerca de $2.99T; se espera que la TGA se acerque a $1T para septiembre-octubre por los ingresos del impuesto corporativo frente a un objetivo a fin de año de $850B, lo que implica una liberación de liquidez de $100-$200B para mantener respaldadas las reservas.
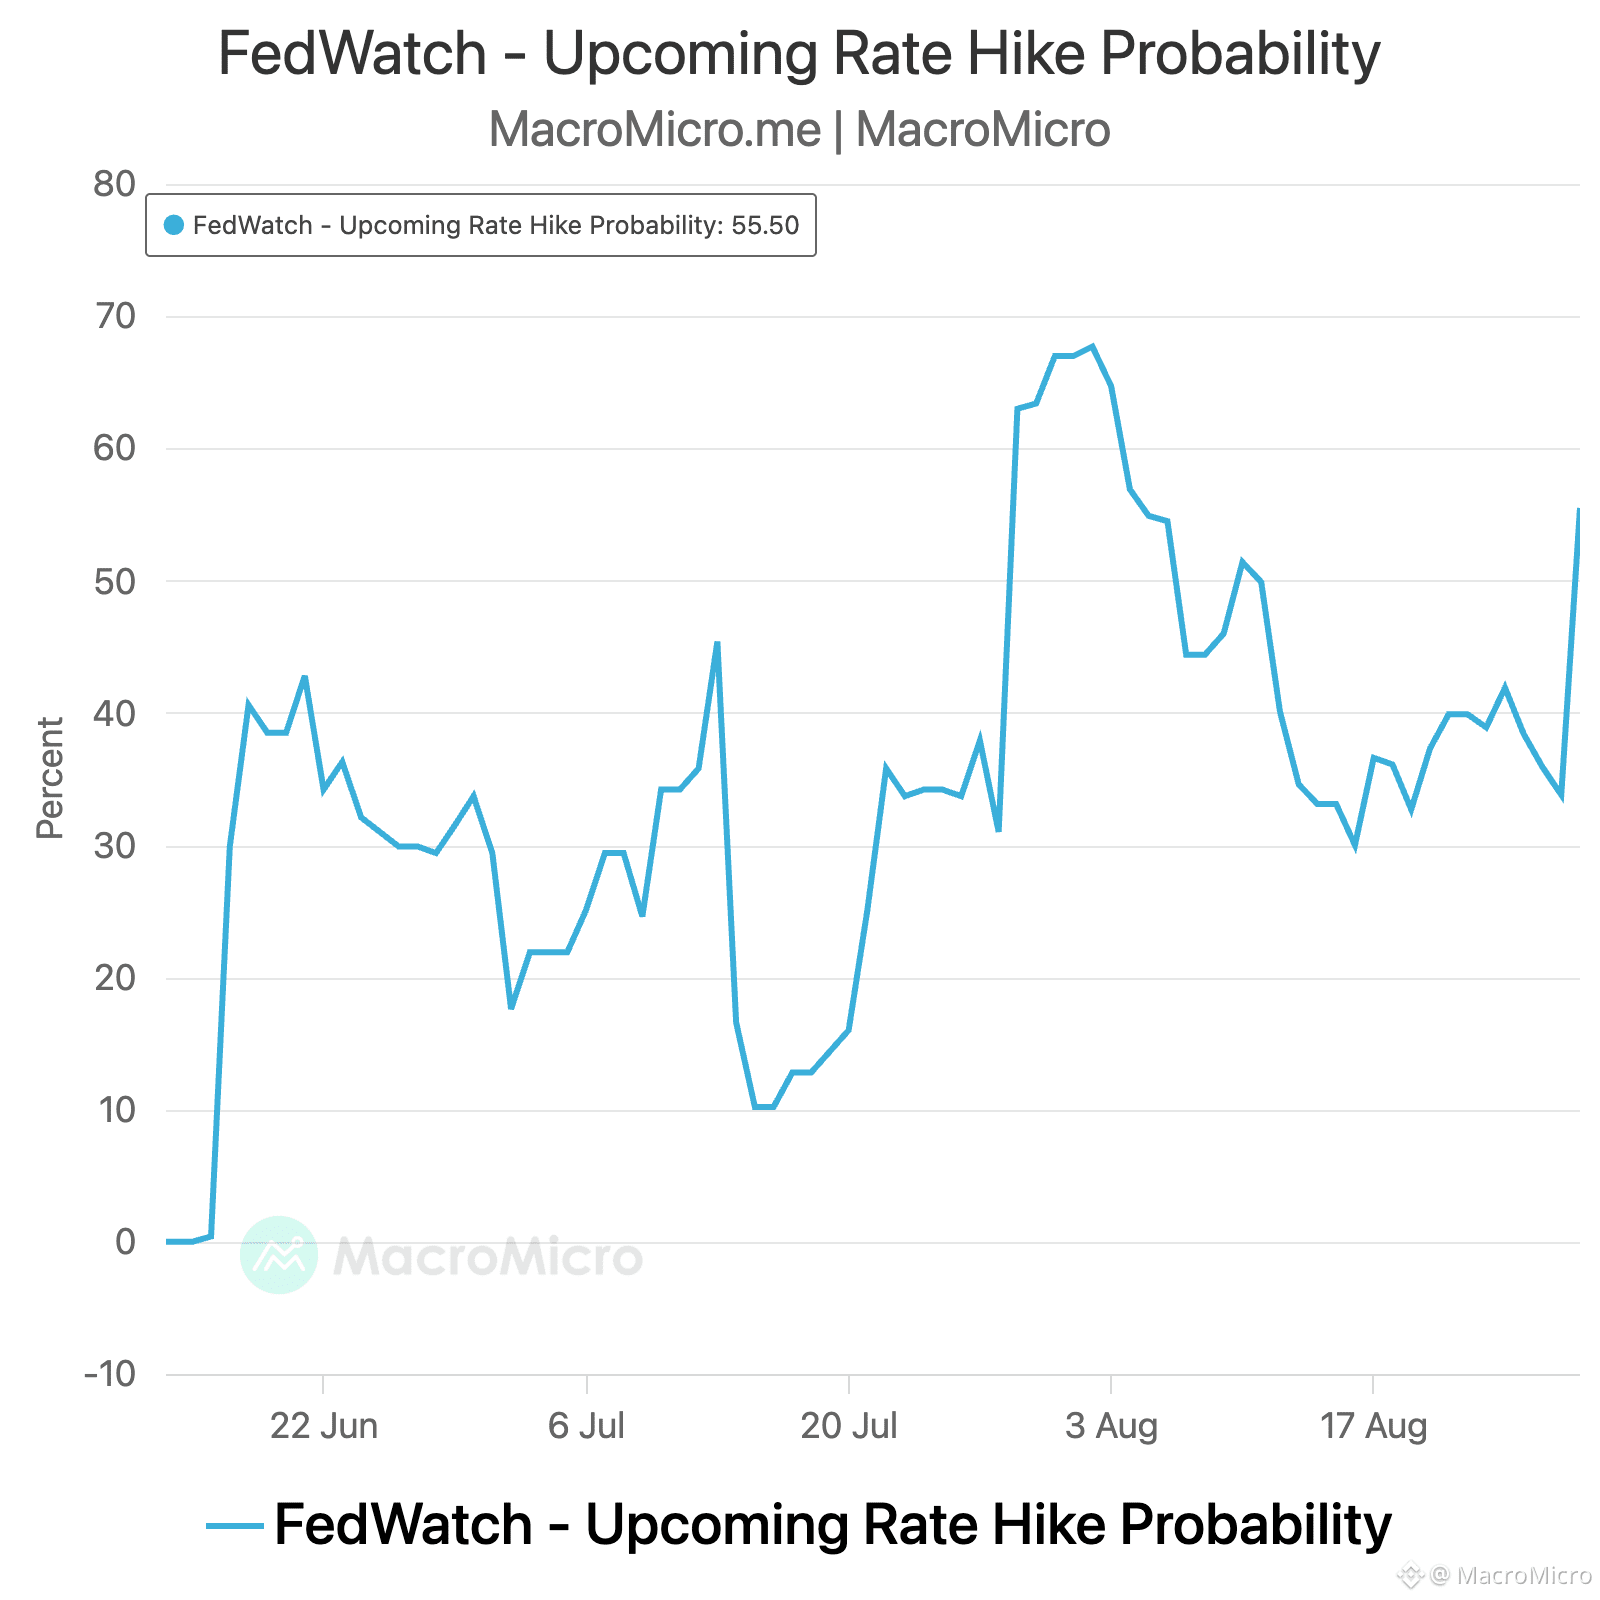
📌 Los mercados lo interpretan como más restrictivo: las probabilidades de una subida en octubre pasaron de 41% a 51% y las probabilidades de tres alzas en 2026 subieron de 28% a 39% según FedWatch. Mientras tanto, el rendimiento a 10 años superó el 4.74% y el de 30 años se mantuvo en 5.36%, el nivel más alto desde julio de 2007.
#FedRateWatch
🔥 Reunión del FOMC de septiembre de 2026: puntos clave 🔎
📌 La Fed subió las tasas 25 pb hasta 3.75%-4.00%, de forma unánime (12-0), citando un crecimiento económico sólido y el impulso para acelerar el avance hacia el objetivo de inflación del 2%.
📌 El gráfico de puntos se desplazó con fuerza hacia un tono más restrictivo (hawkish): las proyecciones medianas de la tasa para 2026-2027 saltaron a 4.00%-4.25%, con 16 y 14 miembros, respectivamente, respaldando más alzas. Esto significa que podrían haber 1-2 subidas adicionales este año y el siguiente antes de que la senda de tasas vuelva a bajar, acercándose finalmente a una tasa de largo plazo más alta de 3.25%.
📌 Las previsiones de septiembre (SEP) muestran que la Fed se vuelve más restrictiva en todos los frentes: el PIB de 2026-2027 se elevó a 2.3% y 2.4%, el desempleo bajó a 4.1% (desde 4.3%, por debajo del promedio de largo plazo), mientras que la inflación y la inflación subyacente se revisaron al alza hasta 3.7% y 3.4% (desde 3.6% y 3.3%).
📌 Warsh dijo que la economía está en pleno empleo y que no hay conflicto entre los objetivos duales de la Fed; calificó como difícil describir las condiciones financieras actuales como restrictivas y señaló tres razones detrás de la subida: datos laborales resilientes, tendencias subyacentes de inflación aún no resueltas y el aumento del riesgo geopolítico.
📌 La Fed reafirmó su política de abundantes reservas después de terminar en agosto las compras de letras a corto plazo. Las reservas bancarias se mantienen cerca de $2.99T; se espera que la TGA se acerque a $1T para septiembre-octubre por los ingresos del impuesto corporativo frente a un objetivo a fin de año de $850B, lo que implica una liberación de liquidez de $100-$200B para mantener respaldadas las reservas.
📌 Los mercados lo interpretan como más restrictivo: las probabilidades de una subida en octubre pasaron de 41% a 51% y las probabilidades de tres alzas en 2026 subieron de 28% a 39% según FedWatch. Mientras tanto, el rendimiento a 10 años superó el 4.74% y el de 30 años se mantuvo en 5.36%, el nivel más alto desde julio de 2007.
#FedRateWatch
📌 La Fed subió las tasas 25 pb hasta 3.75%-4.00%, de forma unánime (12-0), citando un crecimiento económico sólido y el impulso para acelerar el avance hacia el objetivo de inflación del 2%.
📌 El gráfico de puntos se desplazó con fuerza hacia un tono más restrictivo (hawkish): las proyecciones medianas de la tasa para 2026-2027 saltaron a 4.00%-4.25%, con 16 y 14 miembros, respectivamente, respaldando más alzas. Esto significa que podrían haber 1-2 subidas adicionales este año y el siguiente antes de que la senda de tasas vuelva a bajar, acercándose finalmente a una tasa de largo plazo más alta de 3.25%.
📌 Las previsiones de septiembre (SEP) muestran que la Fed se vuelve más restrictiva en todos los frentes: el PIB de 2026-2027 se elevó a 2.3% y 2.4%, el desempleo bajó a 4.1% (desde 4.3%, por debajo del promedio de largo plazo), mientras que la inflación y la inflación subyacente se revisaron al alza hasta 3.7% y 3.4% (desde 3.6% y 3.3%).
📌 Warsh dijo que la economía está en pleno empleo y que no hay conflicto entre los objetivos duales de la Fed; calificó como difícil describir las condiciones financieras actuales como restrictivas y señaló tres razones detrás de la subida: datos laborales resilientes, tendencias subyacentes de inflación aún no resueltas y el aumento del riesgo geopolítico.
📌 La Fed reafirmó su política de abundantes reservas después de terminar en agosto las compras de letras a corto plazo. Las reservas bancarias se mantienen cerca de $2.99T; se espera que la TGA se acerque a $1T para septiembre-octubre por los ingresos del impuesto corporativo frente a un objetivo a fin de año de $850B, lo que implica una liberación de liquidez de $100-$200B para mantener respaldadas las reservas.
📌 Los mercados lo interpretan como más restrictivo: las probabilidades de una subida en octubre pasaron de 41% a 51% y las probabilidades de tres alzas en 2026 subieron de 28% a 39% según FedWatch. Mientras tanto, el rendimiento a 10 años superó el 4.74% y el de 30 años se mantuvo en 5.36%, el nivel más alto desde julio de 2007.
#FedRateWatch
1
1
2.3k
·
--
Verificado
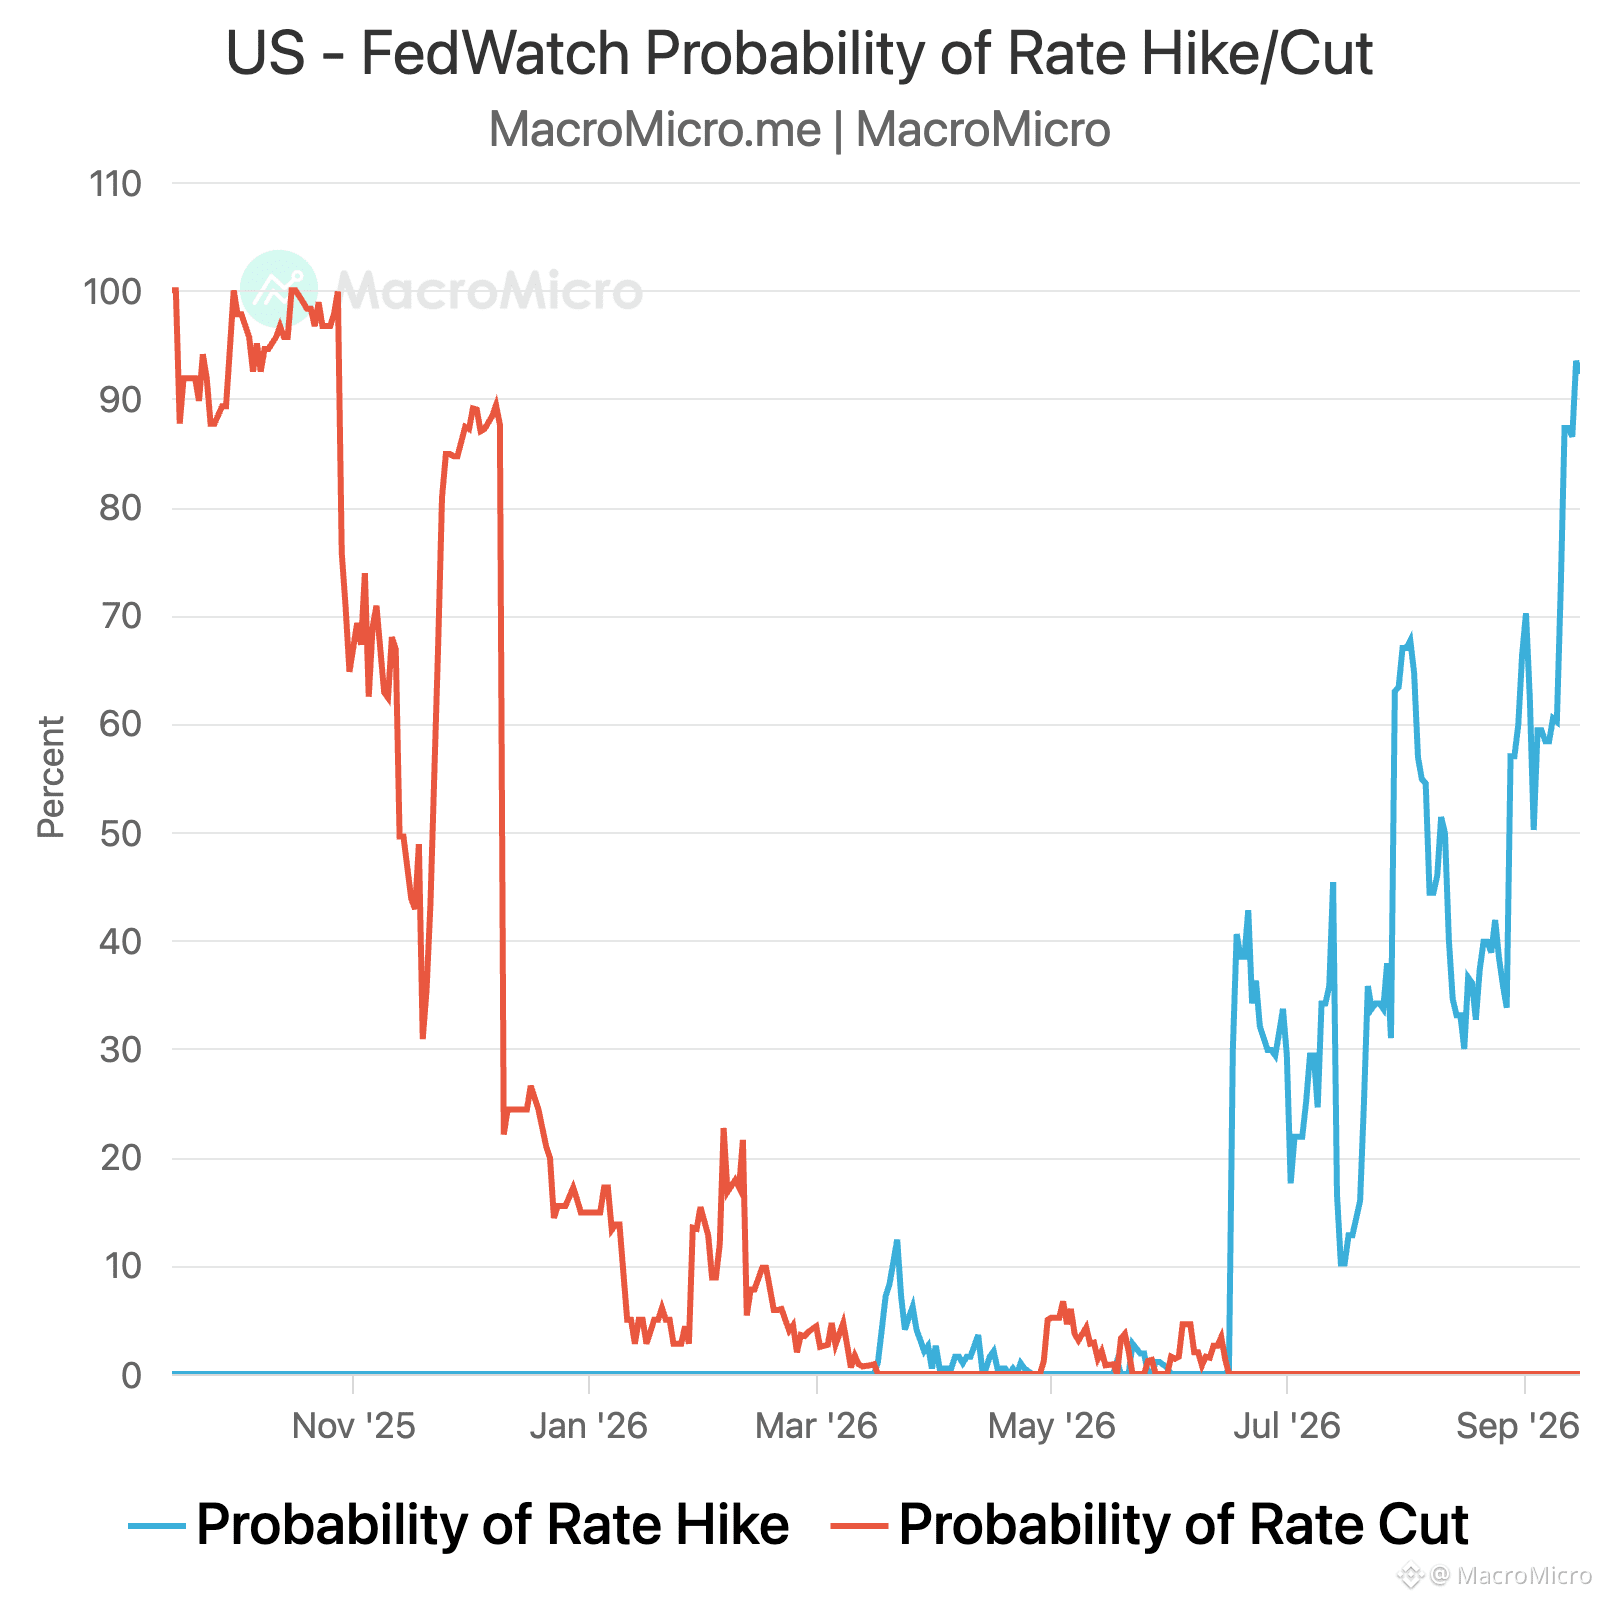
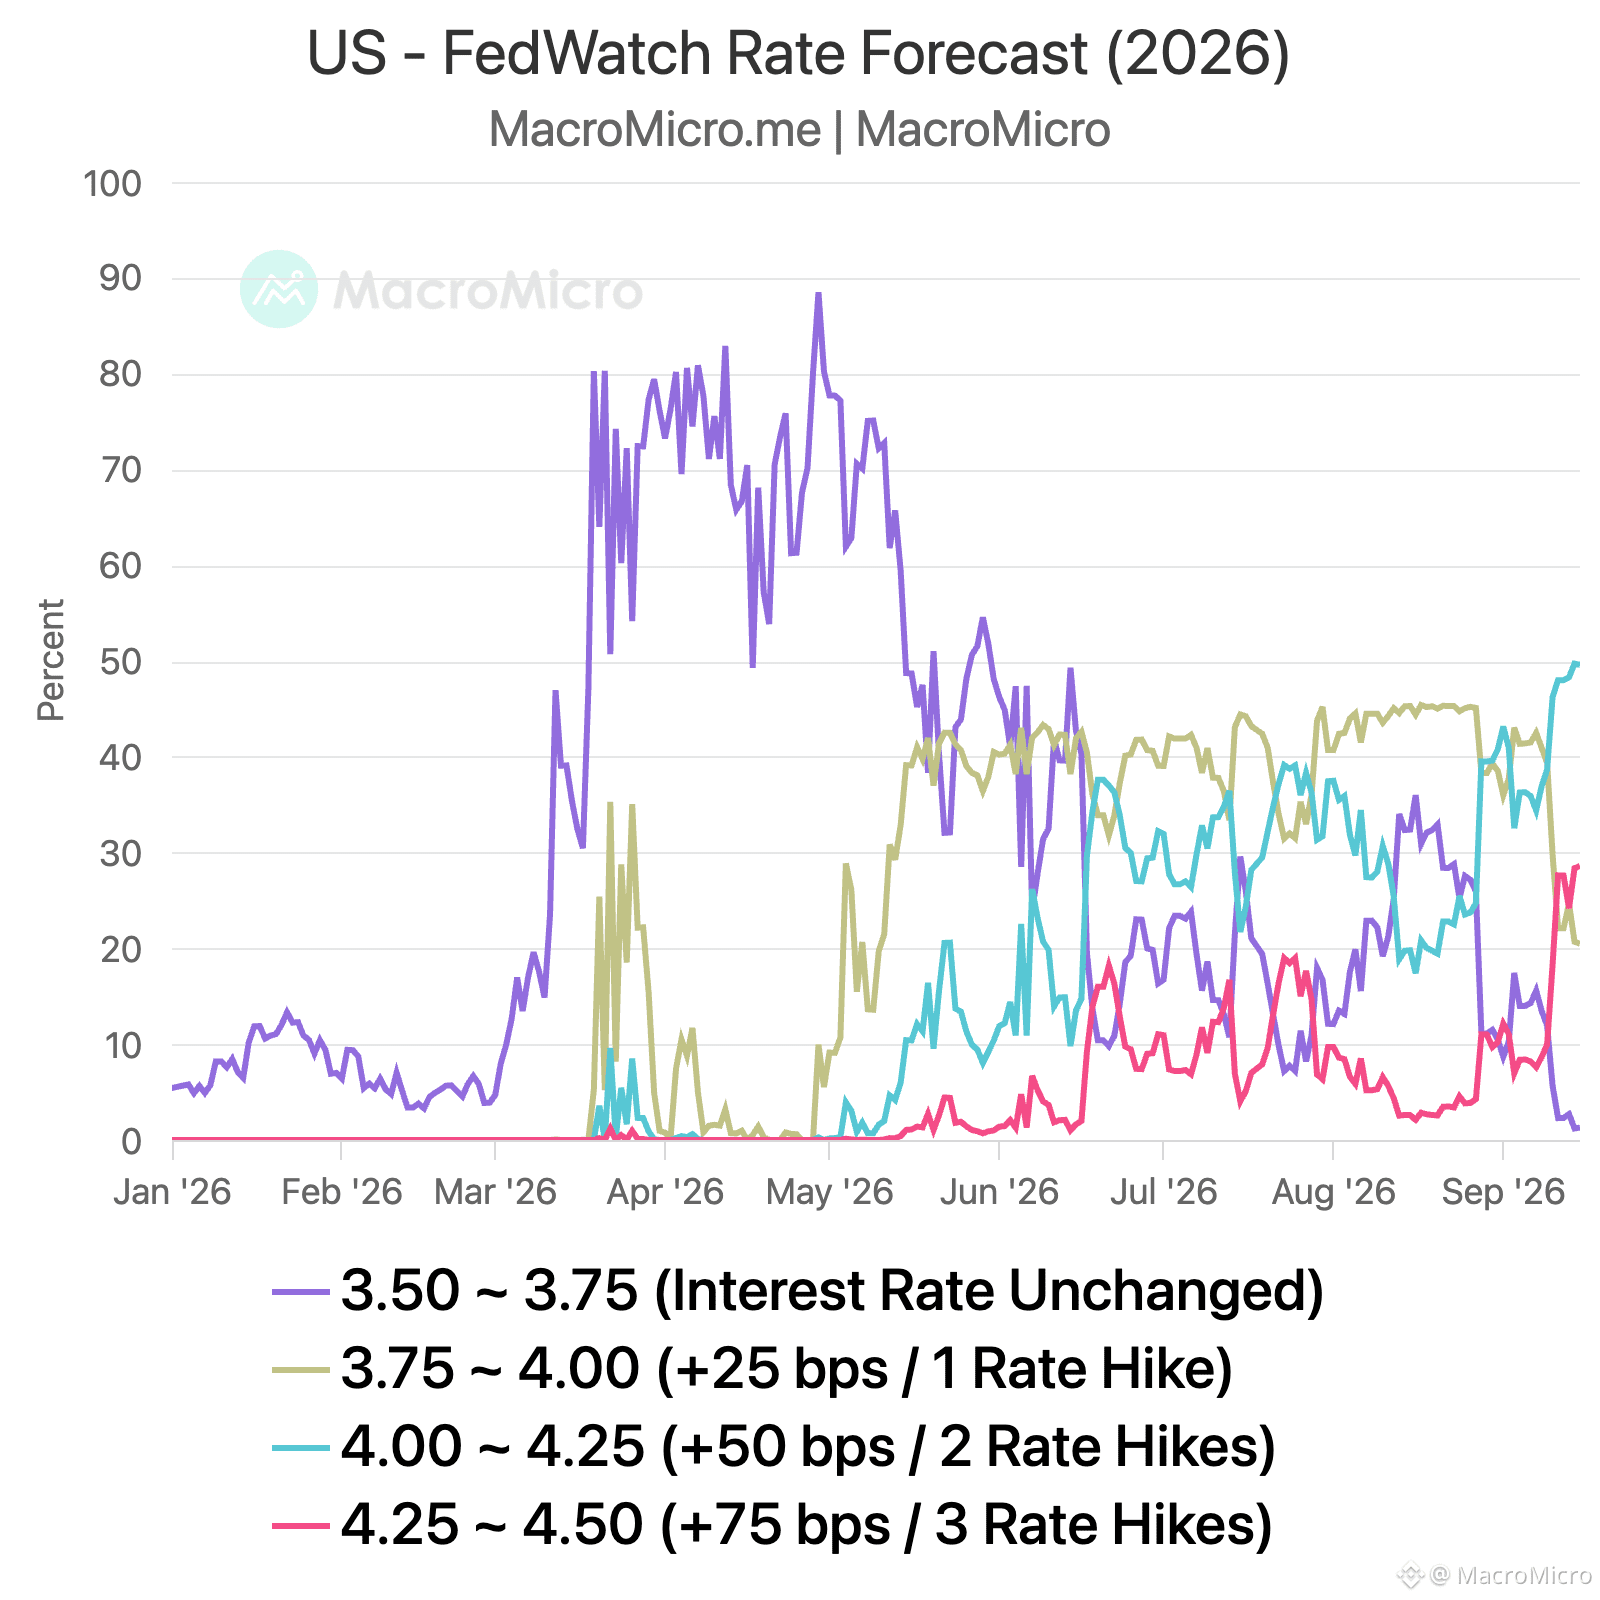
La decisión de la FOMC de septiembre se producirá en unas horas, con los mercados casi universalmente esperando una subida de tipos después de los datos de inflación de la semana pasada y con los futuros del petróleo viviendo por encima de $100.
La pregunta clave es cómo cambia el gráfico de puntos junto con la decisión.
Vemos tres escenarios posibles:
📌 Cauteloso (dovish): Los tipos se mantienen sin cambios, mientras que el punto medio sube para señalar una subida de tipos este año.
📌 Neutral: Los tipos suben 25 pb, y el punto medio también señala una subida de tipos este año, lo que implica que no habrá más subidas después de septiembre.
📌 Halcón (hawkish): Los tipos suben 25 pb, mientras que el punto medio señala dos subidas de tipos este año, dejando margen para otra subida después de septiembre.
Antes de los anuncios del IPC y del PPI de la semana pasada, veíamos el escenario cauteloso como nuestro caso base. Con la inflación entrando por encima de lo esperado y los precios del petróleo moviéndose por encima de $100, la probabilidad de una subida en septiembre ha aumentado significativamente.
Aun así, una subida no necesariamente significaría que la Fed se vuelve firmemente más “halcón”. La inflación subyacente no ha mostrado una reactivación generalizada, así que incluso si la Fed reanuda el endurecimiento, el movimiento podría representar una o dos subidas preventivas más que el inicio de un ciclo sostenido de alzas.
Esa distinción importará para los mercados. Bajo el escenario neutral, una subida en septiembre podría representar una “mala noticia que ya estaba descontada”: una vez que se entregue la subida, la incertidumbre sobre la trayectoria de tipos de este año disminuiría, lo que podría permitir que los rendimientos de los Treasuries a largo plazo alcancen su máximo y retrocedan.
La SEP proporcionará otra señal importante. Si las proyecciones económicas se mantienen o se elevan mientras que las proyecciones de inflación permanecen sin cambios, reforzaría la idea de que cualquier ajuste hacia subidas de tipos es preventivo, con una baja probabilidad de subidas consecutivas.
La decisión llega en horas. La subida importa, pero el gráfico de puntos nos dirá qué viene después.
#FedRateWatch
La decisión de la FOMC de septiembre se producirá en unas horas, con los mercados casi universalmente esperando una subida de tipos después de los datos de inflación de la semana pasada y con los futuros del petróleo viviendo por encima de $100.
La pregunta clave es cómo cambia el gráfico de puntos junto con la decisión.
Vemos tres escenarios posibles:
📌 Cauteloso (dovish): Los tipos se mantienen sin cambios, mientras que el punto medio sube para señalar una subida de tipos este año.
📌 Neutral: Los tipos suben 25 pb, y el punto medio también señala una subida de tipos este año, lo que implica que no habrá más subidas después de septiembre.
📌 Halcón (hawkish): Los tipos suben 25 pb, mientras que el punto medio señala dos subidas de tipos este año, dejando margen para otra subida después de septiembre.
Antes de los anuncios del IPC y del PPI de la semana pasada, veíamos el escenario cauteloso como nuestro caso base. Con la inflación entrando por encima de lo esperado y los precios del petróleo moviéndose por encima de $100, la probabilidad de una subida en septiembre ha aumentado significativamente.
Aun así, una subida no necesariamente significaría que la Fed se vuelve firmemente más “halcón”. La inflación subyacente no ha mostrado una reactivación generalizada, así que incluso si la Fed reanuda el endurecimiento, el movimiento podría representar una o dos subidas preventivas más que el inicio de un ciclo sostenido de alzas.
Esa distinción importará para los mercados. Bajo el escenario neutral, una subida en septiembre podría representar una “mala noticia que ya estaba descontada”: una vez que se entregue la subida, la incertidumbre sobre la trayectoria de tipos de este año disminuiría, lo que podría permitir que los rendimientos de los Treasuries a largo plazo alcancen su máximo y retrocedan.
La SEP proporcionará otra señal importante. Si las proyecciones económicas se mantienen o se elevan mientras que las proyecciones de inflación permanecen sin cambios, reforzaría la idea de que cualquier ajuste hacia subidas de tipos es preventivo, con una baja probabilidad de subidas consecutivas.
La decisión llega en horas. La subida importa, pero el gráfico de puntos nos dirá qué viene después.
#FedRateWatch
La pregunta clave es cómo cambia el gráfico de puntos junto con la decisión.
Vemos tres escenarios posibles:
📌 Cauteloso (dovish): Los tipos se mantienen sin cambios, mientras que el punto medio sube para señalar una subida de tipos este año.
📌 Neutral: Los tipos suben 25 pb, y el punto medio también señala una subida de tipos este año, lo que implica que no habrá más subidas después de septiembre.
📌 Halcón (hawkish): Los tipos suben 25 pb, mientras que el punto medio señala dos subidas de tipos este año, dejando margen para otra subida después de septiembre.
Antes de los anuncios del IPC y del PPI de la semana pasada, veíamos el escenario cauteloso como nuestro caso base. Con la inflación entrando por encima de lo esperado y los precios del petróleo moviéndose por encima de $100, la probabilidad de una subida en septiembre ha aumentado significativamente.
Aun así, una subida no necesariamente significaría que la Fed se vuelve firmemente más “halcón”. La inflación subyacente no ha mostrado una reactivación generalizada, así que incluso si la Fed reanuda el endurecimiento, el movimiento podría representar una o dos subidas preventivas más que el inicio de un ciclo sostenido de alzas.
Esa distinción importará para los mercados. Bajo el escenario neutral, una subida en septiembre podría representar una “mala noticia que ya estaba descontada”: una vez que se entregue la subida, la incertidumbre sobre la trayectoria de tipos de este año disminuiría, lo que podría permitir que los rendimientos de los Treasuries a largo plazo alcancen su máximo y retrocedan.
La SEP proporcionará otra señal importante. Si las proyecciones económicas se mantienen o se elevan mientras que las proyecciones de inflación permanecen sin cambios, reforzaría la idea de que cualquier ajuste hacia subidas de tipos es preventivo, con una baja probabilidad de subidas consecutivas.
La decisión llega en horas. La subida importa, pero el gráfico de puntos nos dirá qué viene después.
#FedRateWatch
3
1
1.8k
·
--
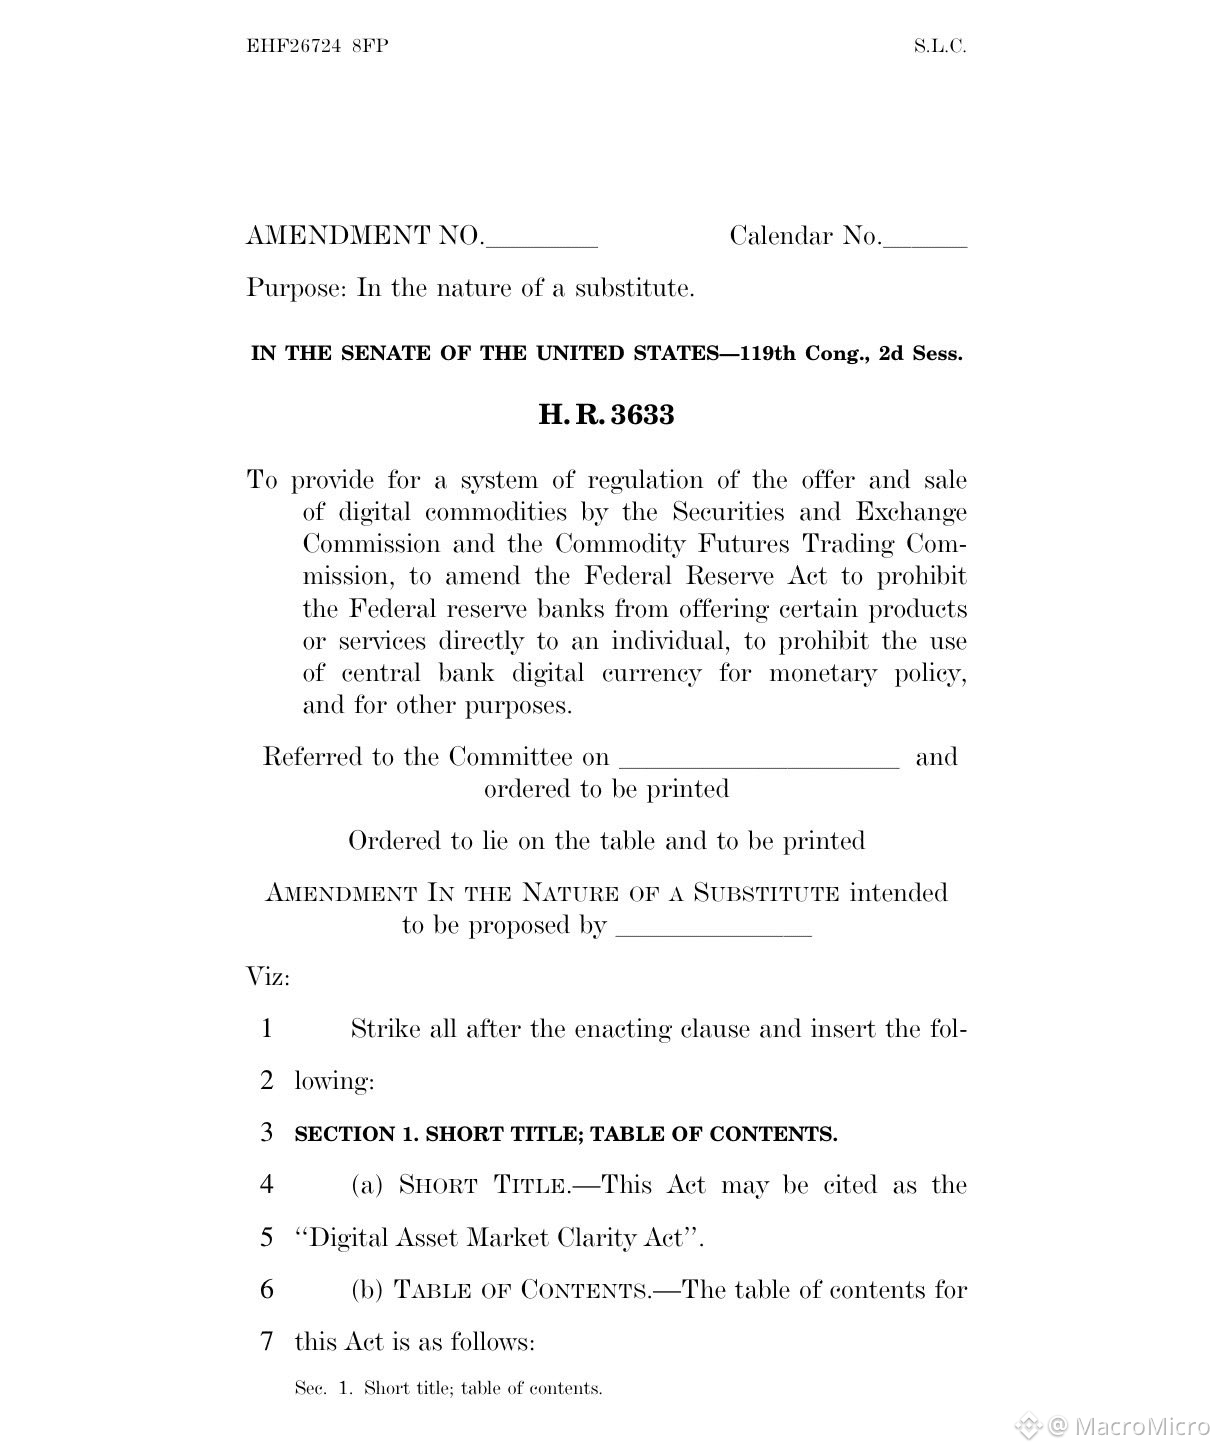
🚨 ÚLTIMA HORA: 🇺🇸 Los republicanos del Senado han publicado otra versión revisada de la Ley CLARITY de 635 páginas, calificándola como su “última, mejor y definitiva” oferta de cara a la votación crucial de cierre del martes.
El proyecto revisado incluye cambios importantes:
📌 Las normas de ética respaldadas por Trump impedirían que el presidente y otros funcionarios federales emitan o patrocinen activos digitales.
📌 Las reglas sobre stablecoins incorporan un “disyuntor”, que permitiría la intervención federal si los bancos comunitarios enfrentan una salida generalizada de depósitos hacia stablecoins.
📌 Las protecciones de BRCA se han acotado, eliminando un lenguaje que extendía explícitamente ciertas protecciones a casos penales.
📌 Nuevas normas sobre conflictos de interés apuntan a las operaciones de afiliados relacionadas con bolsas de commodities digitales, corredores y distribuidores.
La Casa Blanca ha aceptado las disposiciones de ética en un impulso de último minuto para conseguir el apoyo suficiente para el proyecto.
Ahora la legislación se dirige a la votación del Senado del martes, donde necesitará 60 votos para avanzar.
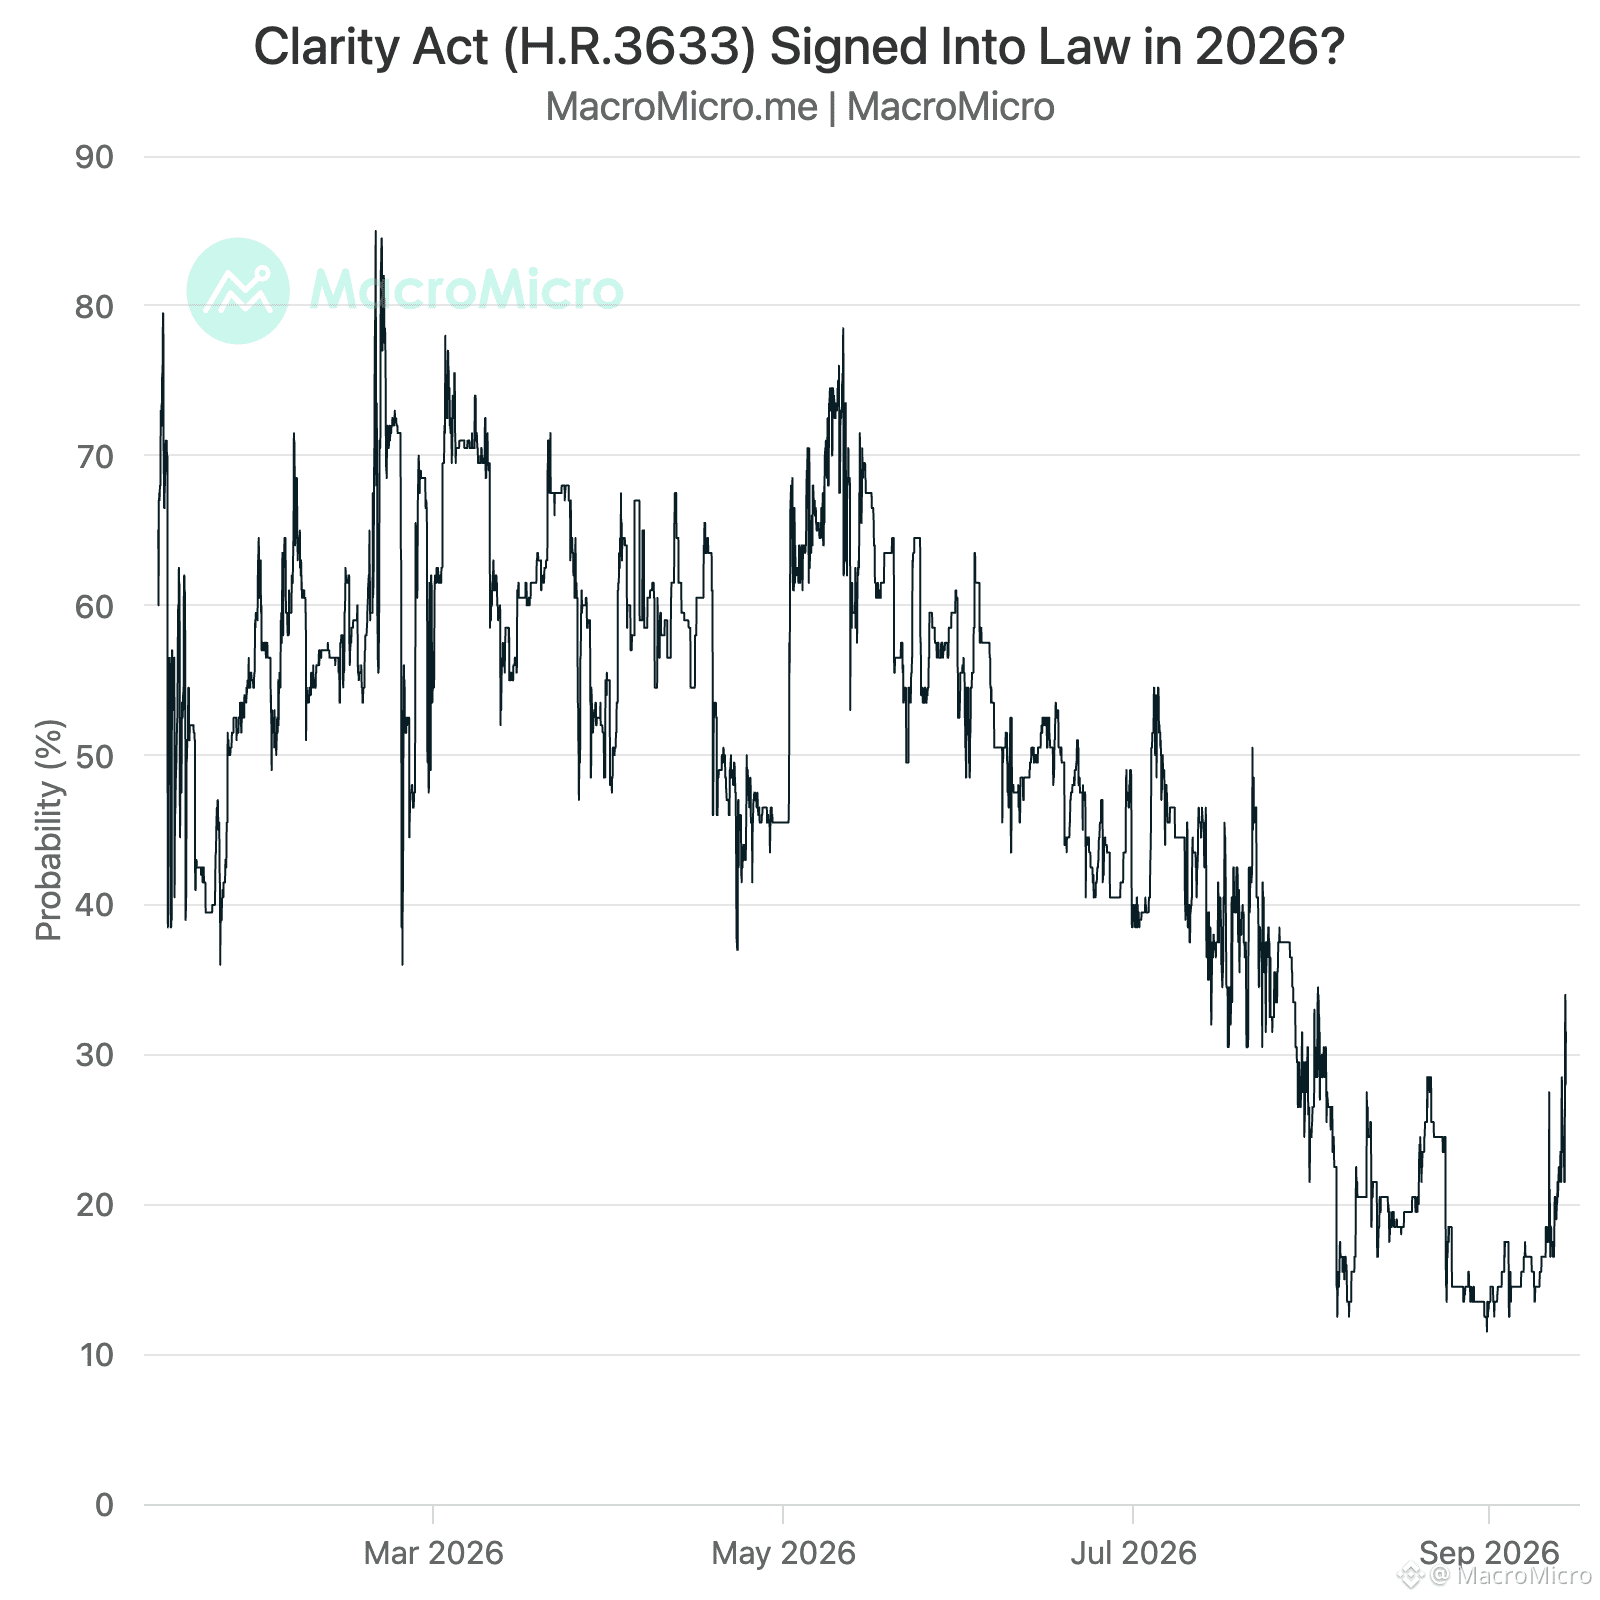
Este podría ser el último intento republicano de romper el estancamiento y avanzar el esperado proyecto de ley sobre la estructura del mercado cripto. Las probabilidades en los mercados de predicción para una aprobación en 2026 se han disparado hasta el 32% 🚀
🚨 ÚLTIMA HORA: 🇺🇸 Los republicanos del Senado han publicado otra versión revisada de la Ley CLARITY de 635 páginas, calificándola como su “última, mejor y definitiva” oferta de cara a la votación crucial de cierre del martes.
El proyecto revisado incluye cambios importantes:
📌 Las normas de ética respaldadas por Trump impedirían que el presidente y otros funcionarios federales emitan o patrocinen activos digitales.
📌 Las reglas sobre stablecoins incorporan un “disyuntor”, que permitiría la intervención federal si los bancos comunitarios enfrentan una salida generalizada de depósitos hacia stablecoins.
📌 Las protecciones de BRCA se han acotado, eliminando un lenguaje que extendía explícitamente ciertas protecciones a casos penales.
📌 Nuevas normas sobre conflictos de interés apuntan a las operaciones de afiliados relacionadas con bolsas de commodities digitales, corredores y distribuidores.
La Casa Blanca ha aceptado las disposiciones de ética en un impulso de último minuto para conseguir el apoyo suficiente para el proyecto.
Ahora la legislación se dirige a la votación del Senado del martes, donde necesitará 60 votos para avanzar.
Este podría ser el último intento republicano de romper el estancamiento y avanzar el esperado proyecto de ley sobre la estructura del mercado cripto. Las probabilidades en los mercados de predicción para una aprobación en 2026 se han disparado hasta el 32% 🚀
El proyecto revisado incluye cambios importantes:
📌 Las normas de ética respaldadas por Trump impedirían que el presidente y otros funcionarios federales emitan o patrocinen activos digitales.
📌 Las reglas sobre stablecoins incorporan un “disyuntor”, que permitiría la intervención federal si los bancos comunitarios enfrentan una salida generalizada de depósitos hacia stablecoins.
📌 Las protecciones de BRCA se han acotado, eliminando un lenguaje que extendía explícitamente ciertas protecciones a casos penales.
📌 Nuevas normas sobre conflictos de interés apuntan a las operaciones de afiliados relacionadas con bolsas de commodities digitales, corredores y distribuidores.
La Casa Blanca ha aceptado las disposiciones de ética en un impulso de último minuto para conseguir el apoyo suficiente para el proyecto.
Ahora la legislación se dirige a la votación del Senado del martes, donde necesitará 60 votos para avanzar.
Este podría ser el último intento republicano de romper el estancamiento y avanzar el esperado proyecto de ley sobre la estructura del mercado cripto. Las probabilidades en los mercados de predicción para una aprobación en 2026 se han disparado hasta el 32% 🚀
8
1
7
9.5k
·
--
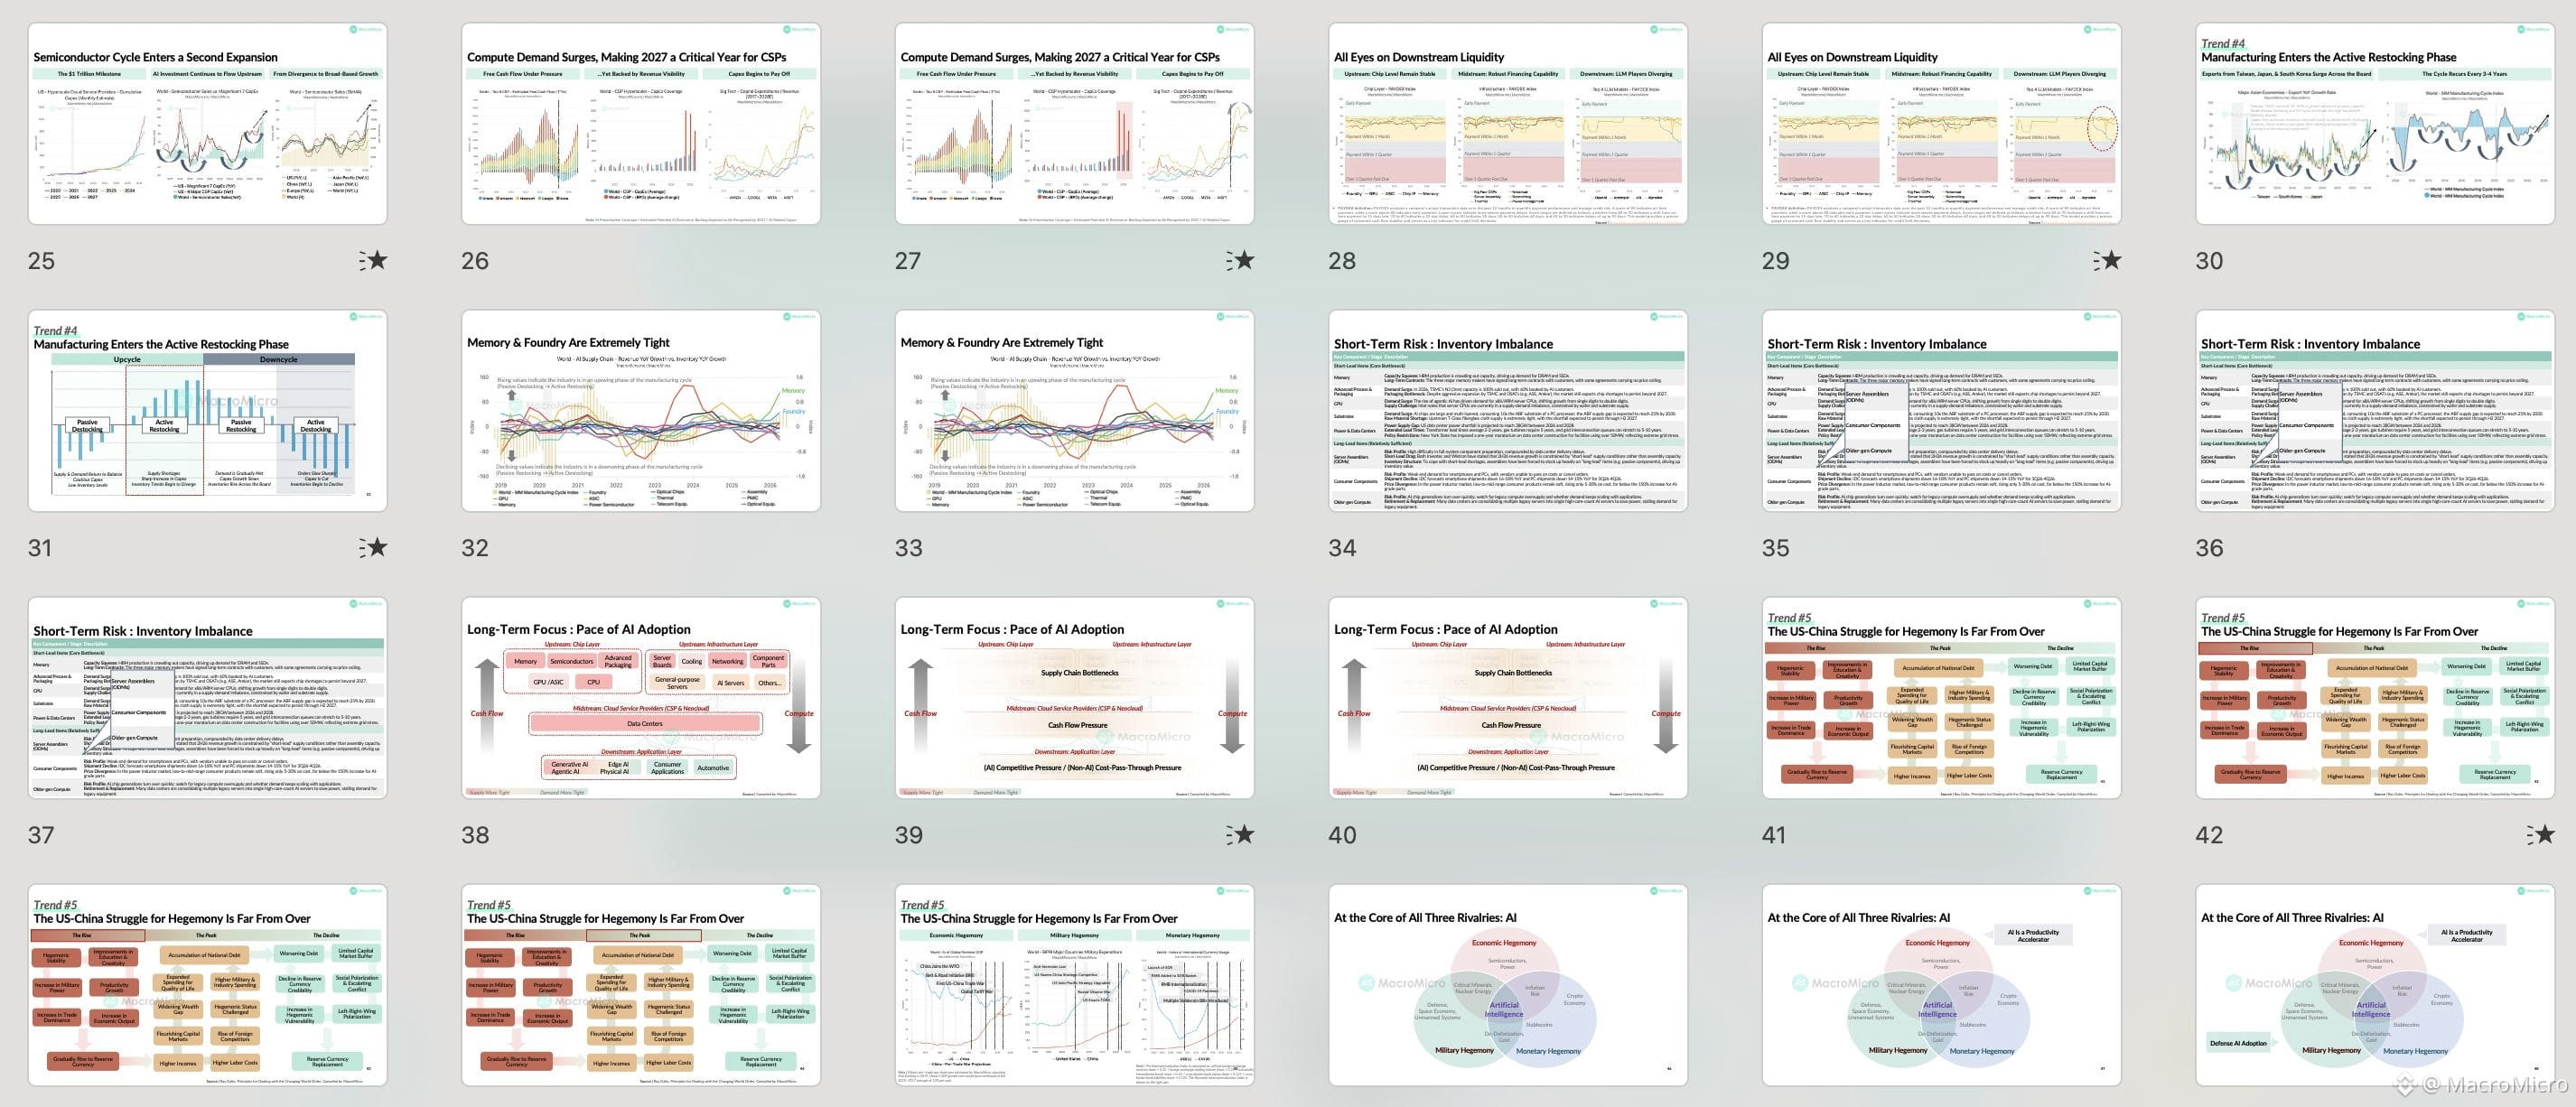
Acabamos de lanzar una vista previa de THE $1T MEGATRENDS: Money, Margin, & Macro — que cubre el hito de $1 billón en CapEx, por qué la memoria y las foundry están extremadamente ajustadas, y dónde se están acumulando los riesgos a corto plazo.
¿Quieres el desglose completo? Ya está disponible: es gratis con Max AI Annual — además de 1 año de acceso al AI Supply Chain Intelligence Hub.
Ver la vista previa: https://drive.google.com/file/d/1r-_vuihG9HmDNeKNxjPqh2IHprpxqf7K/view
Acabamos de lanzar una vista previa de THE $1T MEGATRENDS: Money, Margin, & Macro — que cubre el hito de $1 billón en CapEx, por qué la memoria y las foundry están extremadamente ajustadas, y dónde se están acumulando los riesgos a corto plazo.
¿Quieres el desglose completo? Ya está disponible: es gratis con Max AI Annual — además de 1 año de acceso al AI Supply Chain Intelligence Hub.
Ver la vista previa: https://drive.google.com/file/d/1r-_vuihG9HmDNeKNxjPqh2IHprpxqf7K/view
¿Quieres el desglose completo? Ya está disponible: es gratis con Max AI Annual — además de 1 año de acceso al AI Supply Chain Intelligence Hub.
Ver la vista previa: https://drive.google.com/file/d/1r-_vuihG9HmDNeKNxjPqh2IHprpxqf7K/view
416
·
--
🚨 Los republicanos del Senado han publicado un texto revisado de la Ley CLARITY tras negociaciones posteriores al receso de agosto. Se incorporaron 114+ solicitudes de los demócratas, pero las dos secciones sobre las que los demócratas han luchado con más fuerza (ética, rendimiento de stablecoins) permanecen inalteradas.
El texto más reciente parece ajustar aún más el perímetro regulatorio en torno a la DeFi, al tiempo que traza una vía más clara para que las instituciones financieras reguladas participen en las criptomonedas.
Cambios clave:
📌 La DeFi no descentralizada entra aún más en el perímetro regulatorio. Los protocolos con partes identificables capaces de controlar o alterar materialmente la funcionalidad, operar fuera de reglas transparentes basadas en código, o restringir a los usuarios quedarían sujetos al registro ante la CFTC y a requisitos relacionados con conducta, divulgación, mantenimiento de registros y supervisión.
📌 Las disposiciones de DeFi se acotan a transacciones de commodities digitales al contado/cash. Esto parece diseñado, en parte, para abordar las preocupaciones sobre mercados de predicción basados en blockchain, limitando hasta qué punto el marco DeFi puede abarcar actividades que no sean los mercados convencionales de commodities al contado.
📌 Se aclara explícitamente la autoridad de las cooperativas de crédito. Las cooperativas de crédito federales podrían usar activos digitales y DLT para realizar actividades que de otro modo están autorizadas a llevar a cabo, creando una mayor paridad con las disposiciones bancarias más amplias del proyecto.
No hay cambios en las disposiciones de ética, mientras que las disposiciones de BRCA y de rendimiento de stablecoins siguen intactas.
Conclusión: las revisiones parecen calibradas para atraer 60 votos mientras se conserva la estructura central del proyecto. La cuestión ahora es si los demócratas ven las 114 disposiciones como concesiones sustantivas o como un intento de hacer que cambios limitados parezcan más amplios de lo que son.
#CLARITYAct
🚨 Los republicanos del Senado han publicado un texto revisado de la Ley CLARITY tras negociaciones posteriores al receso de agosto. Se incorporaron 114+ solicitudes de los demócratas, pero las dos secciones sobre las que los demócratas han luchado con más fuerza (ética, rendimiento de stablecoins) permanecen inalteradas.
El texto más reciente parece ajustar aún más el perímetro regulatorio en torno a la DeFi, al tiempo que traza una vía más clara para que las instituciones financieras reguladas participen en las criptomonedas.
Cambios clave:
📌 La DeFi no descentralizada entra aún más en el perímetro regulatorio. Los protocolos con partes identificables capaces de controlar o alterar materialmente la funcionalidad, operar fuera de reglas transparentes basadas en código, o restringir a los usuarios quedarían sujetos al registro ante la CFTC y a requisitos relacionados con conducta, divulgación, mantenimiento de registros y supervisión.
📌 Las disposiciones de DeFi se acotan a transacciones de commodities digitales al contado/cash. Esto parece diseñado, en parte, para abordar las preocupaciones sobre mercados de predicción basados en blockchain, limitando hasta qué punto el marco DeFi puede abarcar actividades que no sean los mercados convencionales de commodities al contado.
📌 Se aclara explícitamente la autoridad de las cooperativas de crédito. Las cooperativas de crédito federales podrían usar activos digitales y DLT para realizar actividades que de otro modo están autorizadas a llevar a cabo, creando una mayor paridad con las disposiciones bancarias más amplias del proyecto.
No hay cambios en las disposiciones de ética, mientras que las disposiciones de BRCA y de rendimiento de stablecoins siguen intactas.
Conclusión: las revisiones parecen calibradas para atraer 60 votos mientras se conserva la estructura central del proyecto. La cuestión ahora es si los demócratas ven las 114 disposiciones como concesiones sustantivas o como un intento de hacer que cambios limitados parezcan más amplios de lo que son.
#CLARITYAct
El texto más reciente parece ajustar aún más el perímetro regulatorio en torno a la DeFi, al tiempo que traza una vía más clara para que las instituciones financieras reguladas participen en las criptomonedas.
Cambios clave:
📌 La DeFi no descentralizada entra aún más en el perímetro regulatorio. Los protocolos con partes identificables capaces de controlar o alterar materialmente la funcionalidad, operar fuera de reglas transparentes basadas en código, o restringir a los usuarios quedarían sujetos al registro ante la CFTC y a requisitos relacionados con conducta, divulgación, mantenimiento de registros y supervisión.
📌 Las disposiciones de DeFi se acotan a transacciones de commodities digitales al contado/cash. Esto parece diseñado, en parte, para abordar las preocupaciones sobre mercados de predicción basados en blockchain, limitando hasta qué punto el marco DeFi puede abarcar actividades que no sean los mercados convencionales de commodities al contado.
📌 Se aclara explícitamente la autoridad de las cooperativas de crédito. Las cooperativas de crédito federales podrían usar activos digitales y DLT para realizar actividades que de otro modo están autorizadas a llevar a cabo, creando una mayor paridad con las disposiciones bancarias más amplias del proyecto.
No hay cambios en las disposiciones de ética, mientras que las disposiciones de BRCA y de rendimiento de stablecoins siguen intactas.
Conclusión: las revisiones parecen calibradas para atraer 60 votos mientras se conserva la estructura central del proyecto. La cuestión ahora es si los demócratas ven las 114 disposiciones como concesiones sustantivas o como un intento de hacer que cambios limitados parezcan más amplios de lo que son.
#CLARITYAct

3
10
9.4k
·
--
Alcista
Verificado
🇺🇸 El IPC de agosto se publicará en unas horas y, al producirse una semana después de que las nóminas no agrícolas superaran las expectativas, ofrece una prueba importante de si los precios de la energía más altos están alimentando la inflación subyacente.
El presidente de la Fed, Warsh, ha dicho que la decisión depende de esta cifra: una lectura del núcleo en términos generales acorde con lo esperado respalda una pausa; una sorpresa al alza abre la puerta a una subida en septiembre. Waller ha dicho prácticamente lo mismo y añade que, al excluir el componente imputado de servicios no comerciales, la inflación subyacente ya parece mejor de lo que sugiere el núcleo, y que la energía y los aranceles aún no se están reflejando como una fuente persistente de presión.
Se espera que el núcleo esté cerca de 0,2% MoM, lo que reduce la tasa anual a 2,4% desde 2,5%. No estamos viendo que el petróleo, a pesar de las tensiones renovadas con Irán y de los precios elevados, se traslade al núcleo de bienes o servicios. Nos inclinamos por una pausa.
Nuestro mercado de predicción implícita sitúa el IPC general de agosto en 3,34% interanual y el IPC subyacente en 2,33% interanual.
#CPIWatch
📍 https://en.macromicro.me/charts/154402/us-cpi-yoy-prediction-market-implied-forecast
🇺🇸 El IPC de agosto se publicará en unas horas y, al producirse una semana después de que las nóminas no agrícolas superaran las expectativas, ofrece una prueba importante de si los precios de la energía más altos están alimentando la inflación subyacente.
El presidente de la Fed, Warsh, ha dicho que la decisión depende de esta cifra: una lectura del núcleo en términos generales acorde con lo esperado respalda una pausa; una sorpresa al alza abre la puerta a una subida en septiembre. Waller ha dicho prácticamente lo mismo y añade que, al excluir el componente imputado de servicios no comerciales, la inflación subyacente ya parece mejor de lo que sugiere el núcleo, y que la energía y los aranceles aún no se están reflejando como una fuente persistente de presión.
Se espera que el núcleo esté cerca de 0,2% MoM, lo que reduce la tasa anual a 2,4% desde 2,5%. No estamos viendo que el petróleo, a pesar de las tensiones renovadas con Irán y de los precios elevados, se traslade al núcleo de bienes o servicios. Nos inclinamos por una pausa.
Nuestro mercado de predicción implícita sitúa el IPC general de agosto en 3,34% interanual y el IPC subyacente en 2,33% interanual.
#CPIWatch
📍 https://en.macromicro.me/charts/154402/us-cpi-yoy-prediction-market-implied-forecast
El presidente de la Fed, Warsh, ha dicho que la decisión depende de esta cifra: una lectura del núcleo en términos generales acorde con lo esperado respalda una pausa; una sorpresa al alza abre la puerta a una subida en septiembre. Waller ha dicho prácticamente lo mismo y añade que, al excluir el componente imputado de servicios no comerciales, la inflación subyacente ya parece mejor de lo que sugiere el núcleo, y que la energía y los aranceles aún no se están reflejando como una fuente persistente de presión.
Se espera que el núcleo esté cerca de 0,2% MoM, lo que reduce la tasa anual a 2,4% desde 2,5%. No estamos viendo que el petróleo, a pesar de las tensiones renovadas con Irán y de los precios elevados, se traslade al núcleo de bienes o servicios. Nos inclinamos por una pausa.
Nuestro mercado de predicción implícita sitúa el IPC general de agosto en 3,34% interanual y el IPC subyacente en 2,33% interanual.
#CPIWatch
📍 https://en.macromicro.me/charts/154402/us-cpi-yoy-prediction-market-implied-forecast

1
2
1.8k
·
--
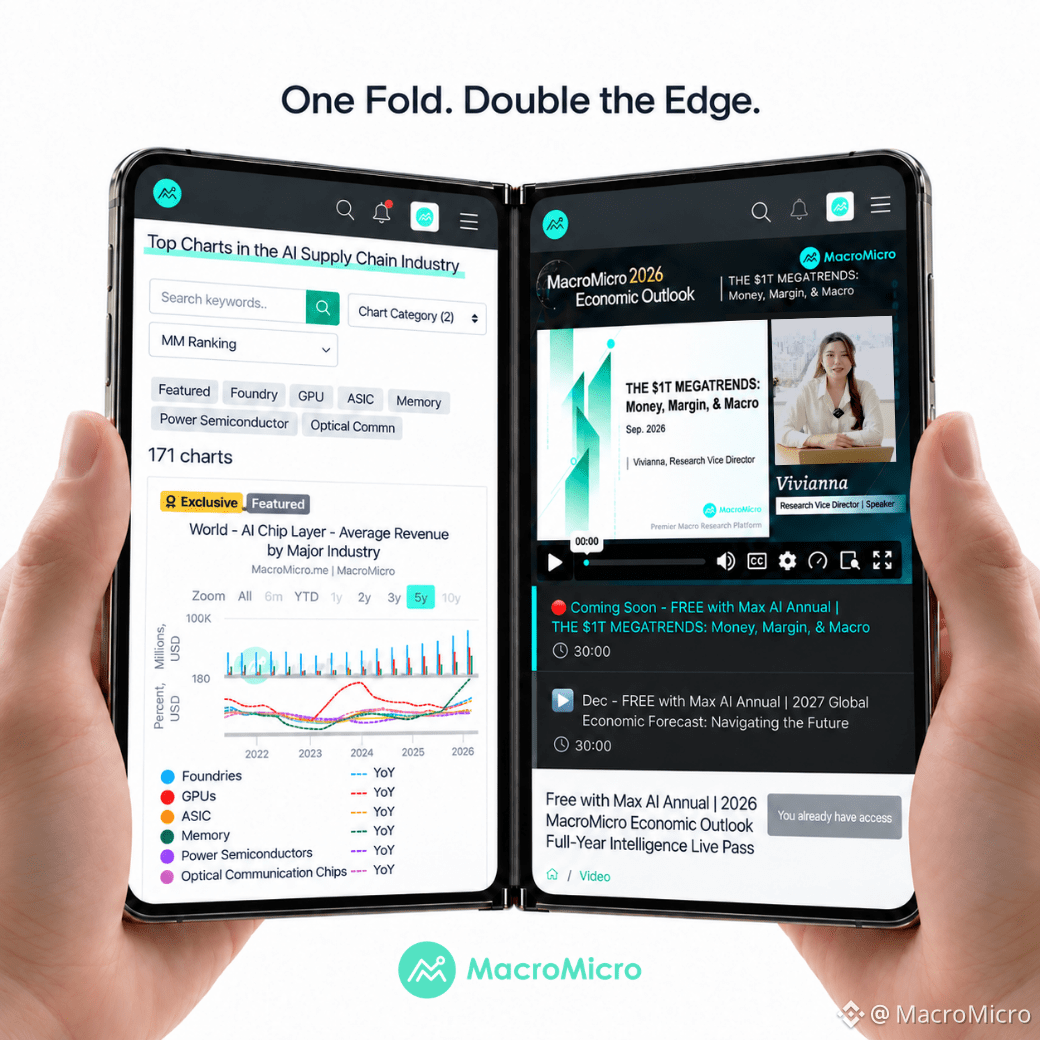
El nuevo iPhone se abre en dos para revelar dos pantallas.
Nuestro Plan Anual Max AI se abre en dos para revelar dos beneficios.
¿Coincidencia? No lo creemos...
Antes de que iPhone Duo salga a la venta, consigue este primero: nuestra oferta termina pronto y, una vez que se agote, se acabó.
Enlace en esta publicación👇🏻
El nuevo iPhone se abre en dos para revelar dos pantallas.
Nuestro Plan Anual Max AI se abre en dos para revelar dos beneficios.
¿Coincidencia? No lo creemos...
Antes de que iPhone Duo salga a la venta, consigue este primero: nuestra oferta termina pronto y, una vez que se agote, se acabó.
Enlace en esta publicación👇🏻
Nuestro Plan Anual Max AI se abre en dos para revelar dos beneficios.
¿Coincidencia? No lo creemos...
Antes de que iPhone Duo salga a la venta, consigue este primero: nuestra oferta termina pronto y, una vez que se agote, se acabó.
Enlace en esta publicación👇🏻
3
2
1.5k
·
--
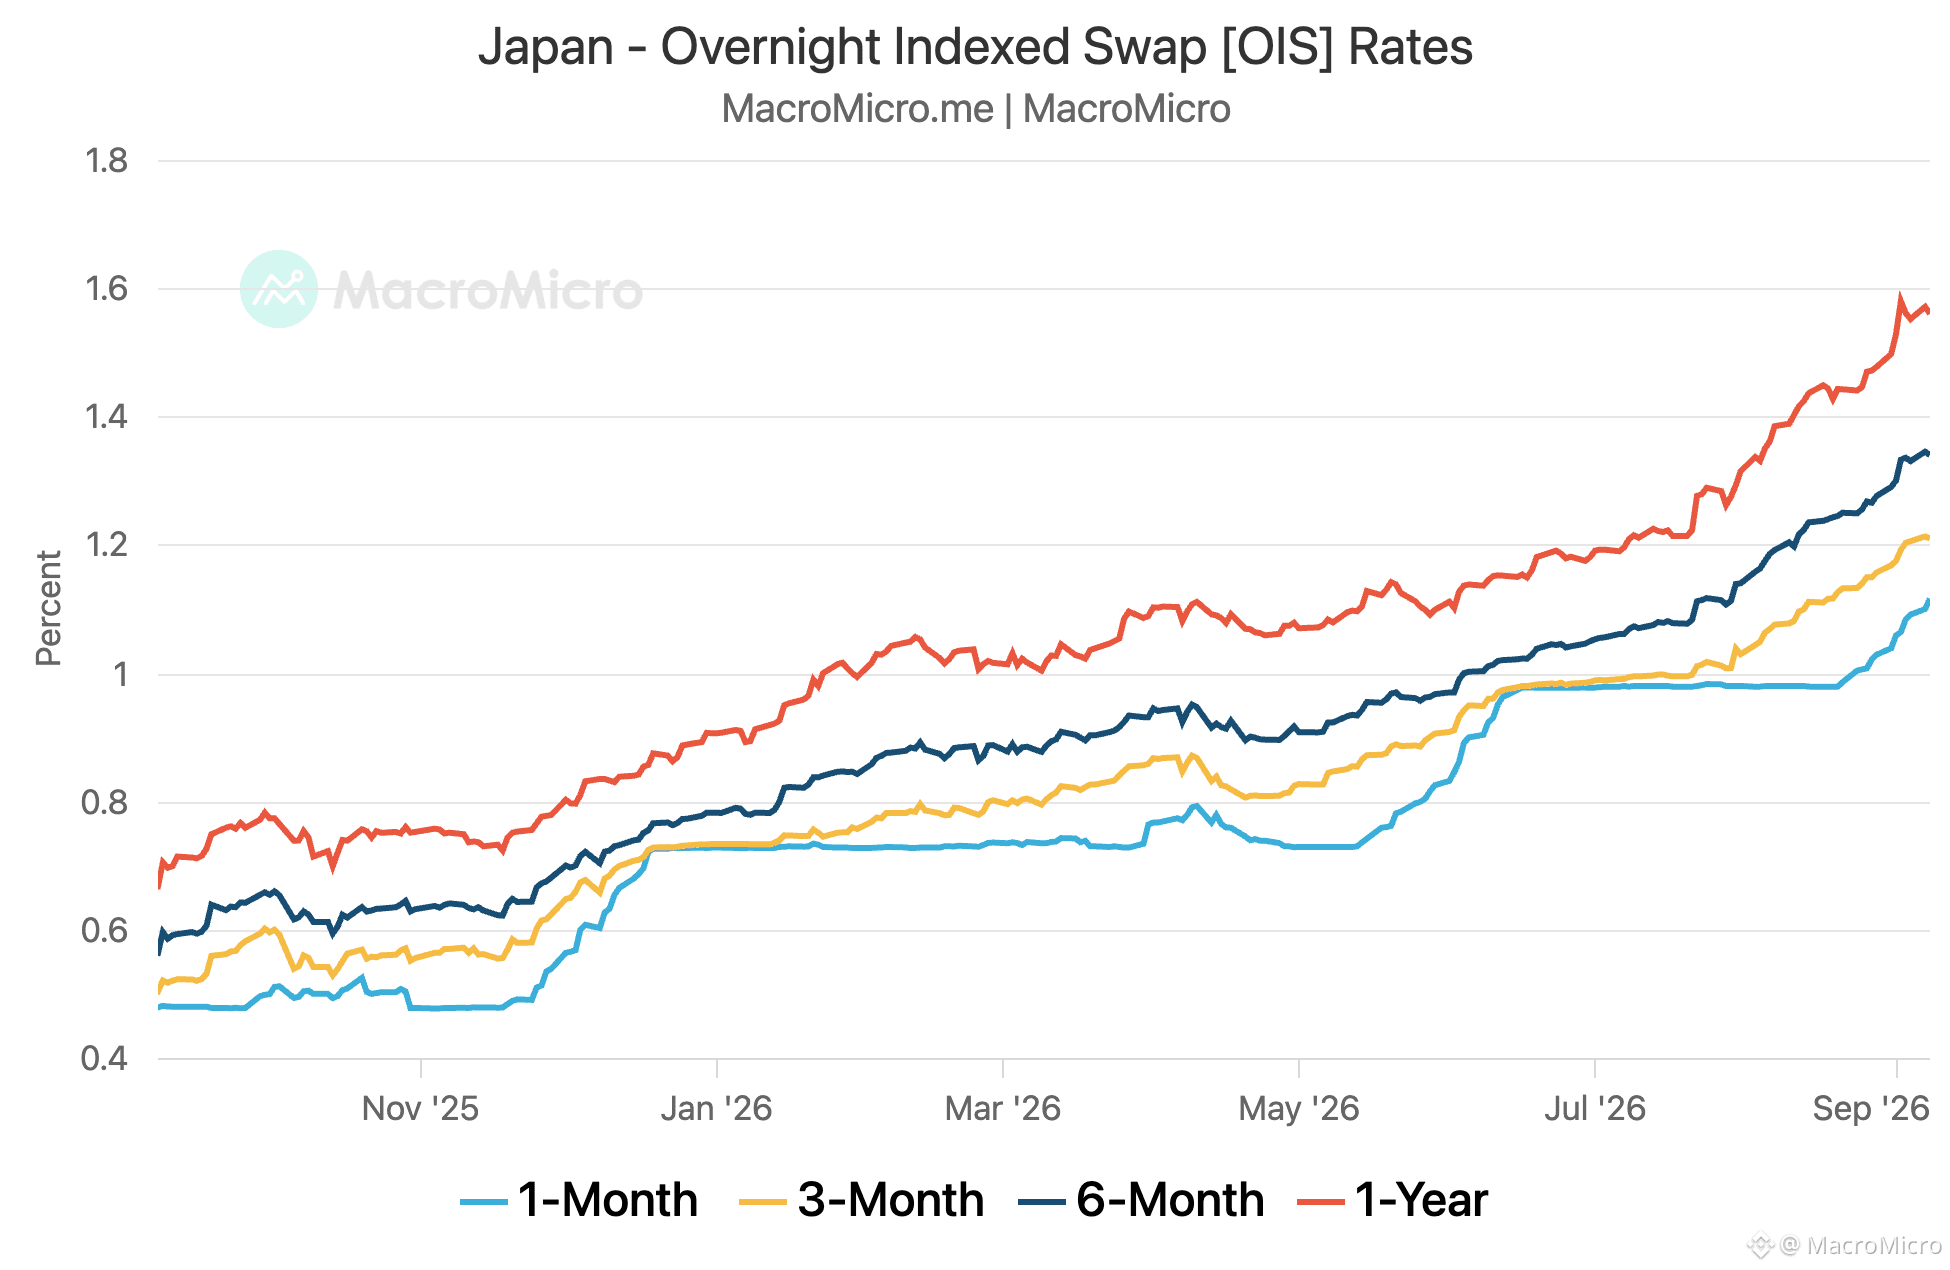
🔴 ÚLTIMA HORA: USD/JPY rompe 153, el yen más fuerte desde febrero.
Tres cosas ocurrieron a la vez:
▸ El PIB del 2T se revisa al alza a 1,4% anualizado, frente al 1,1% preliminar
▸ Las ganancias en efectivo de agosto +4,7% interanual (YoY): superan el consenso del 3,9%, las más rápidas desde 1997
▸ El OIS a 1M está en 1,12%, incorporando por completo una subida de 25 pb la próxima semana
🔴 ÚLTIMA HORA: USD/JPY rompe 153, el yen más fuerte desde febrero.
Tres cosas ocurrieron a la vez:
▸ El PIB del 2T se revisa al alza a 1,4% anualizado, frente al 1,1% preliminar
▸ Las ganancias en efectivo de agosto +4,7% interanual (YoY): superan el consenso del 3,9%, las más rápidas desde 1997
▸ El OIS a 1M está en 1,12%, incorporando por completo una subida de 25 pb la próxima semana
Tres cosas ocurrieron a la vez:
▸ El PIB del 2T se revisa al alza a 1,4% anualizado, frente al 1,1% preliminar
▸ Las ganancias en efectivo de agosto +4,7% interanual (YoY): superan el consenso del 3,9%, las más rápidas desde 1997
▸ El OIS a 1M está en 1,12%, incorporando por completo una subida de 25 pb la próxima semana
1
324
·
--
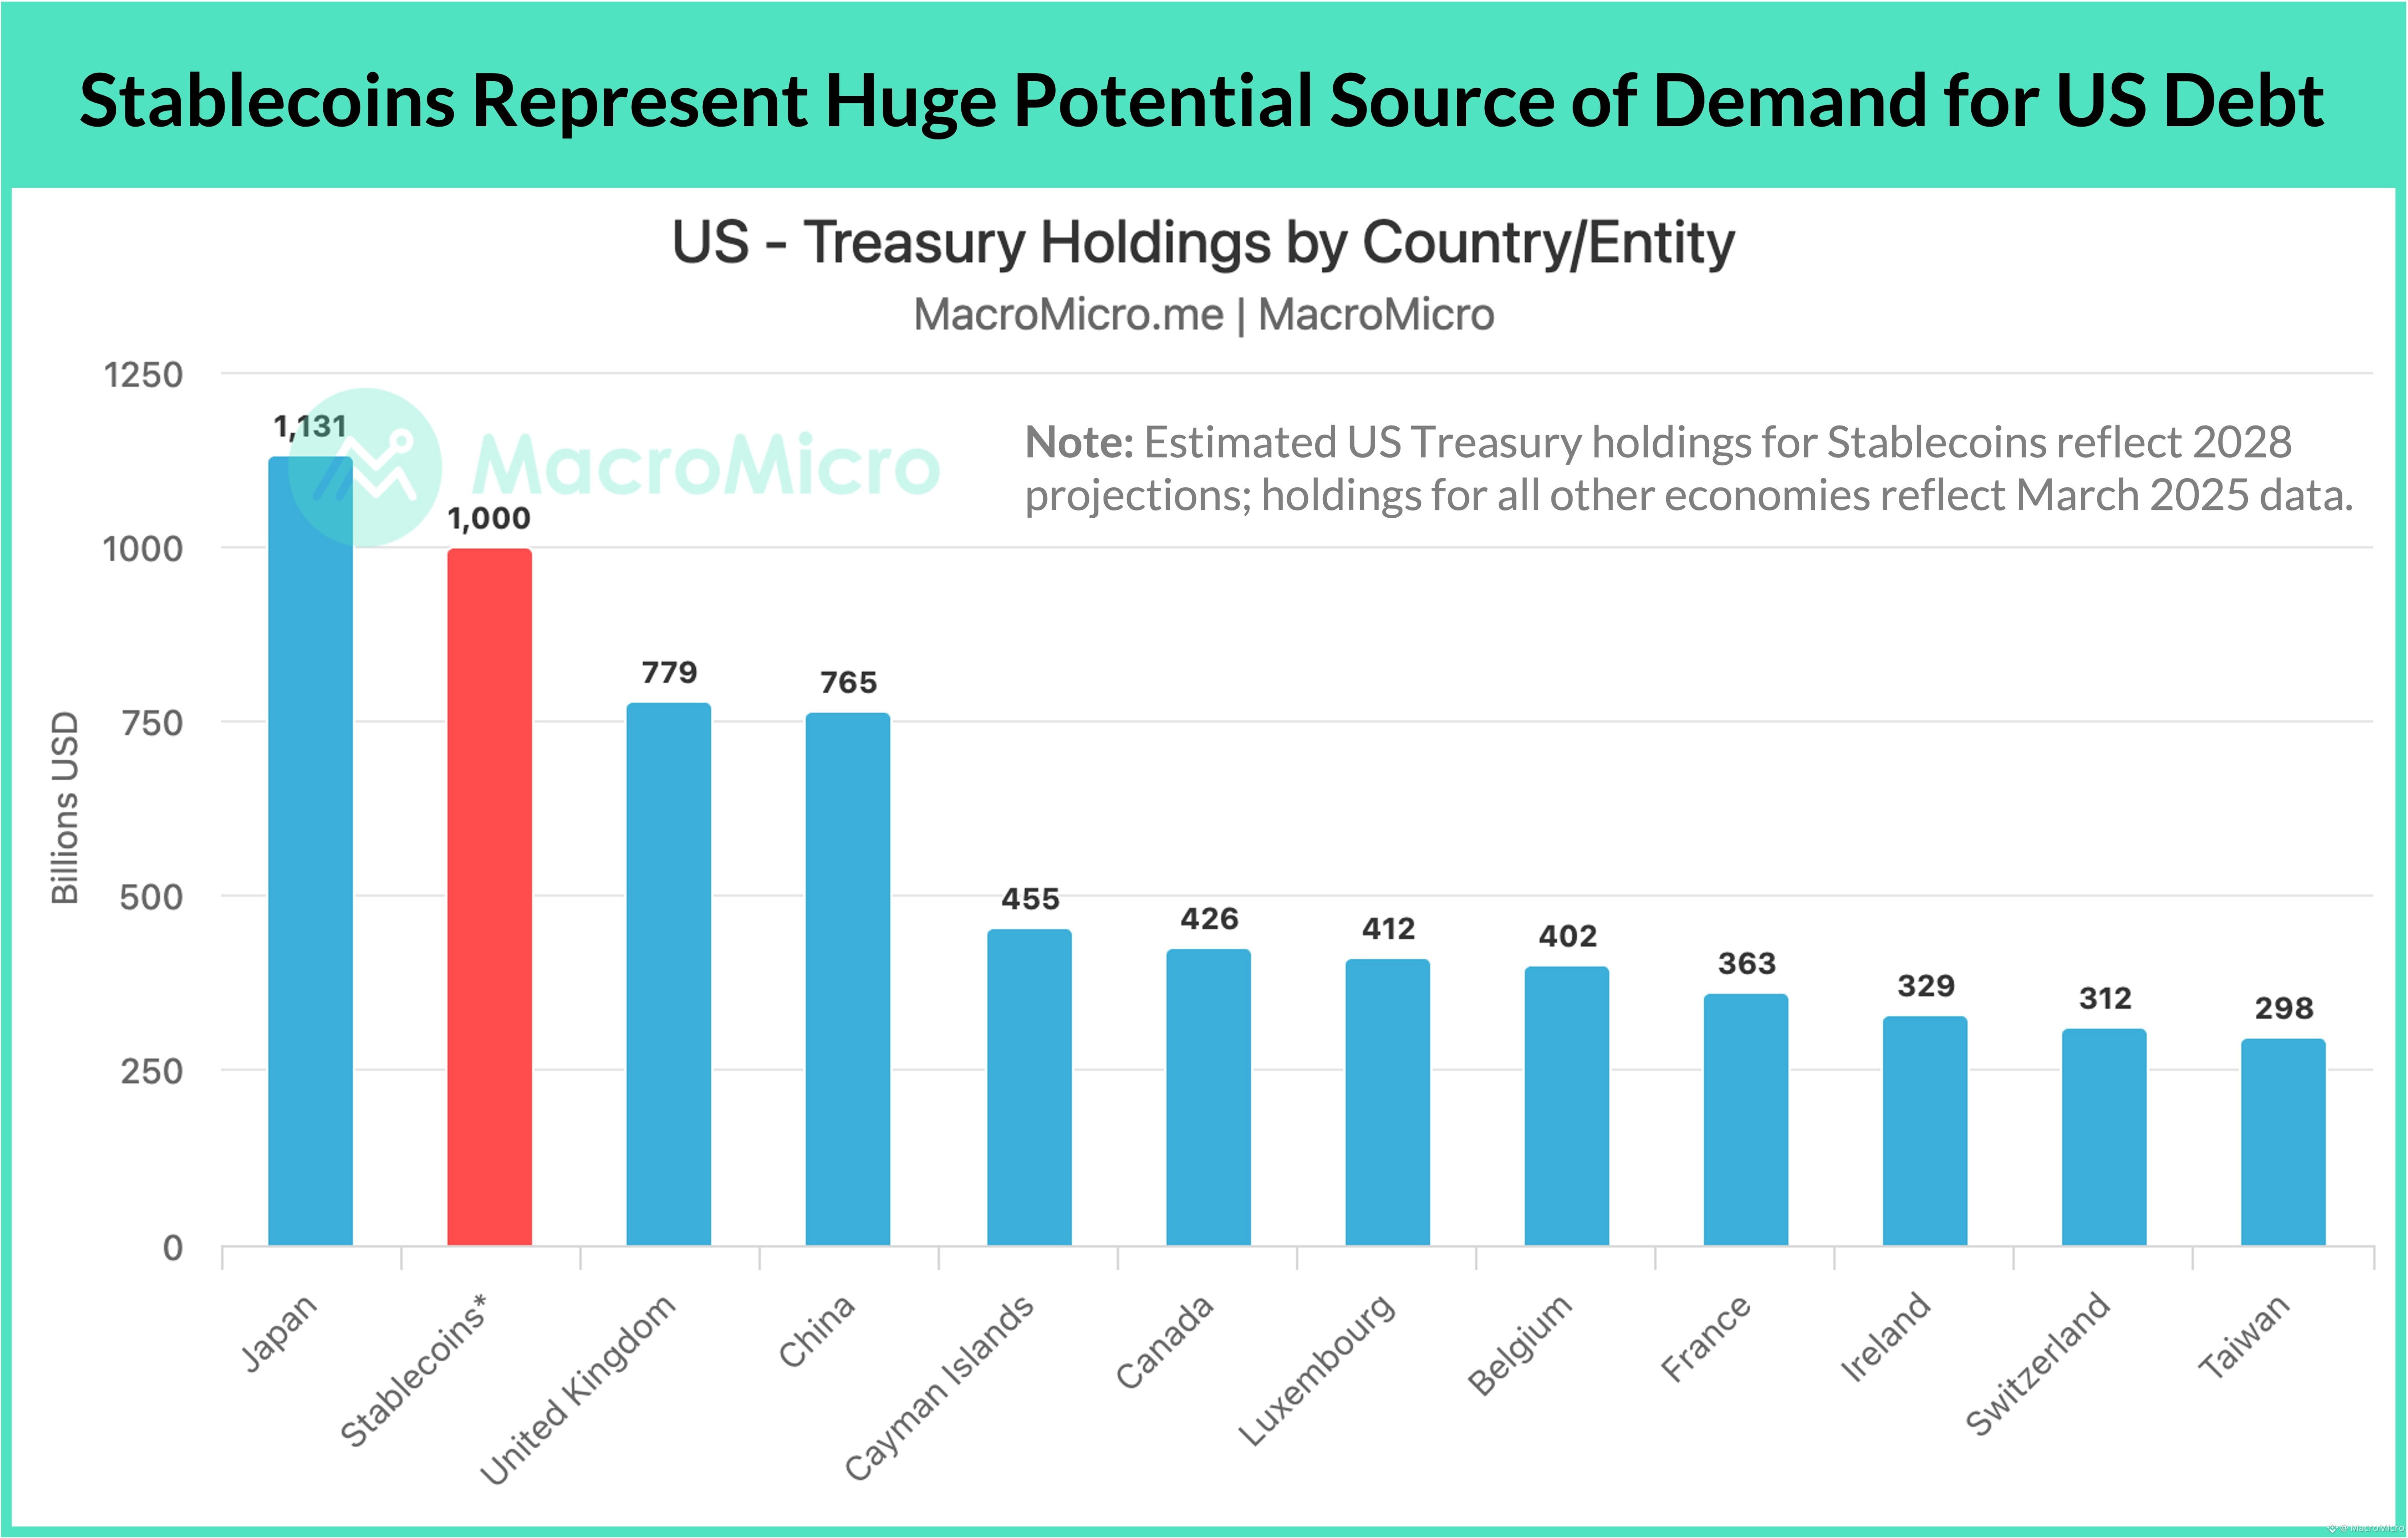
El cambio más trascendental en las stablecoins no es el volumen de pagos, sino su aparición como un gran comprador de deuda soberana de EE. UU.
Según las estimaciones del Treasury Borrowing Advisory Committee (TBAC), el mercado de stablecoins podría alcanzar los 2 billones de dólares para 2028. Respaldar esa expansión requeriría aproximadamente 1 billón de dólares en letras del Tesoro a corto plazo, frente a cerca de 120 mil millones de dólares hoy. Ese tamaño de reservas colocaría a los emisores de stablecoins, aproximadamente, al mismo nivel que Japón (1,1 billones) como el mayor tenedor de deuda de EE. UU.
Esta demanda llega justo cuando el Departamento del Tesoro modifica su estrategia de gestión de la deuda. En su declaración trimestral de refinanciación de agosto, el Tesoro cambió su orientación sobre los tamaños de las subastas de cupones, pasando de evaluar "aumentos" a evaluar "cambios". El giro apunta a una mayor emisión de letras y a menos subastas de vencimientos largos para suprimir la prima por plazo en los rendimientos de largo plazo. Las T-bills ya representan el 22% de los Treasuries comercializables en circulación, frente al 15% antes de la pandemia.
Con los fondos del mercado monetario situados cerca de los 8 billones de dólares y la Reserva Federal dirigiendo el principal de MBS que vence hacia T-bills, las stablecoins aportan una base de compradores en expansión e insensible al precio. Para Washington, los dólares digitales se han convertido silenciosamente en una herramienta para absorber la financiación del déficit a corto plazo.
🔗 Lee más: https://en.macromicro.me/blog/treasury-yields-are-surging-three-ways-out-of-the-debt-trap
El cambio más trascendental en las stablecoins no es el volumen de pagos, sino su aparición como un gran comprador de deuda soberana de EE. UU.
Según las estimaciones del Treasury Borrowing Advisory Committee (TBAC), el mercado de stablecoins podría alcanzar los 2 billones de dólares para 2028. Respaldar esa expansión requeriría aproximadamente 1 billón de dólares en letras del Tesoro a corto plazo, frente a cerca de 120 mil millones de dólares hoy. Ese tamaño de reservas colocaría a los emisores de stablecoins, aproximadamente, al mismo nivel que Japón (1,1 billones) como el mayor tenedor de deuda de EE. UU.
Esta demanda llega justo cuando el Departamento del Tesoro modifica su estrategia de gestión de la deuda. En su declaración trimestral de refinanciación de agosto, el Tesoro cambió su orientación sobre los tamaños de las subastas de cupones, pasando de evaluar "aumentos" a evaluar "cambios". El giro apunta a una mayor emisión de letras y a menos subastas de vencimientos largos para suprimir la prima por plazo en los rendimientos de largo plazo. Las T-bills ya representan el 22% de los Treasuries comercializables en circulación, frente al 15% antes de la pandemia.
Con los fondos del mercado monetario situados cerca de los 8 billones de dólares y la Reserva Federal dirigiendo el principal de MBS que vence hacia T-bills, las stablecoins aportan una base de compradores en expansión e insensible al precio. Para Washington, los dólares digitales se han convertido silenciosamente en una herramienta para absorber la financiación del déficit a corto plazo.
🔗 Lee más: https://en.macromicro.me/blog/treasury-yields-are-surging-three-ways-out-of-the-debt-trap
Según las estimaciones del Treasury Borrowing Advisory Committee (TBAC), el mercado de stablecoins podría alcanzar los 2 billones de dólares para 2028. Respaldar esa expansión requeriría aproximadamente 1 billón de dólares en letras del Tesoro a corto plazo, frente a cerca de 120 mil millones de dólares hoy. Ese tamaño de reservas colocaría a los emisores de stablecoins, aproximadamente, al mismo nivel que Japón (1,1 billones) como el mayor tenedor de deuda de EE. UU.
Esta demanda llega justo cuando el Departamento del Tesoro modifica su estrategia de gestión de la deuda. En su declaración trimestral de refinanciación de agosto, el Tesoro cambió su orientación sobre los tamaños de las subastas de cupones, pasando de evaluar "aumentos" a evaluar "cambios". El giro apunta a una mayor emisión de letras y a menos subastas de vencimientos largos para suprimir la prima por plazo en los rendimientos de largo plazo. Las T-bills ya representan el 22% de los Treasuries comercializables en circulación, frente al 15% antes de la pandemia.
Con los fondos del mercado monetario situados cerca de los 8 billones de dólares y la Reserva Federal dirigiendo el principal de MBS que vence hacia T-bills, las stablecoins aportan una base de compradores en expansión e insensible al precio. Para Washington, los dólares digitales se han convertido silenciosamente en una herramienta para absorber la financiación del déficit a corto plazo.
🔗 Lee más: https://en.macromicro.me/blog/treasury-yields-are-surging-three-ways-out-of-the-debt-trap
434
·
--
📈 El capex de IA va camino de superar los 1 billón de dólares para 2027 y la cadena de suministro ya está mostrando tensión. La capacidad de memoria y de fundición está al máximo, los precios del hardware han vuelto a superar los picos de 2021 y el poder de fijación de precios se está desplazando hacia upstream, alejándose de las aplicaciones con las que todos están operando.
Lo cubrimos todo este septiembre, con dos cosas desbloqueadas en un solo plan:
📌 Panorama en vivo (11 de sep) — nuestro VP de Investigación repasa los megatendencias de IA de 1 billón de dólares en directo
📌 Acceso completo durante 1 año a la AI Supply Chain Hub — 18 gráficos exclusivos sobre chips, infraestructura y cómputo
Que este cuello de botella se mantenga o se rompa depende de la demanda real, no solo de la oferta ajustada.
Para eso están construidas ambas cosas: ayudarte a hacer seguimiento.
Sigue la evolución antes de que el mercado lo descuente. Termina el 30 de sep.
🔗 https://mmgo.me/xxv4q3
📈 El capex de IA va camino de superar los 1 billón de dólares para 2027 y la cadena de suministro ya está mostrando tensión. La capacidad de memoria y de fundición está al máximo, los precios del hardware han vuelto a superar los picos de 2021 y el poder de fijación de precios se está desplazando hacia upstream, alejándose de las aplicaciones con las que todos están operando.
Lo cubrimos todo este septiembre, con dos cosas desbloqueadas en un solo plan:
📌 Panorama en vivo (11 de sep) — nuestro VP de Investigación repasa los megatendencias de IA de 1 billón de dólares en directo
📌 Acceso completo durante 1 año a la AI Supply Chain Hub — 18 gráficos exclusivos sobre chips, infraestructura y cómputo
Que este cuello de botella se mantenga o se rompa depende de la demanda real, no solo de la oferta ajustada.
Para eso están construidas ambas cosas: ayudarte a hacer seguimiento.
Sigue la evolución antes de que el mercado lo descuente. Termina el 30 de sep.
🔗 https://mmgo.me/xxv4q3
Lo cubrimos todo este septiembre, con dos cosas desbloqueadas en un solo plan:
📌 Panorama en vivo (11 de sep) — nuestro VP de Investigación repasa los megatendencias de IA de 1 billón de dólares en directo
📌 Acceso completo durante 1 año a la AI Supply Chain Hub — 18 gráficos exclusivos sobre chips, infraestructura y cómputo
Que este cuello de botella se mantenga o se rompa depende de la demanda real, no solo de la oferta ajustada.
Para eso están construidas ambas cosas: ayudarte a hacer seguimiento.
Sigue la evolución antes de que el mercado lo descuente. Termina el 30 de sep.
🔗 https://mmgo.me/xxv4q3

421
·
--
Verificado
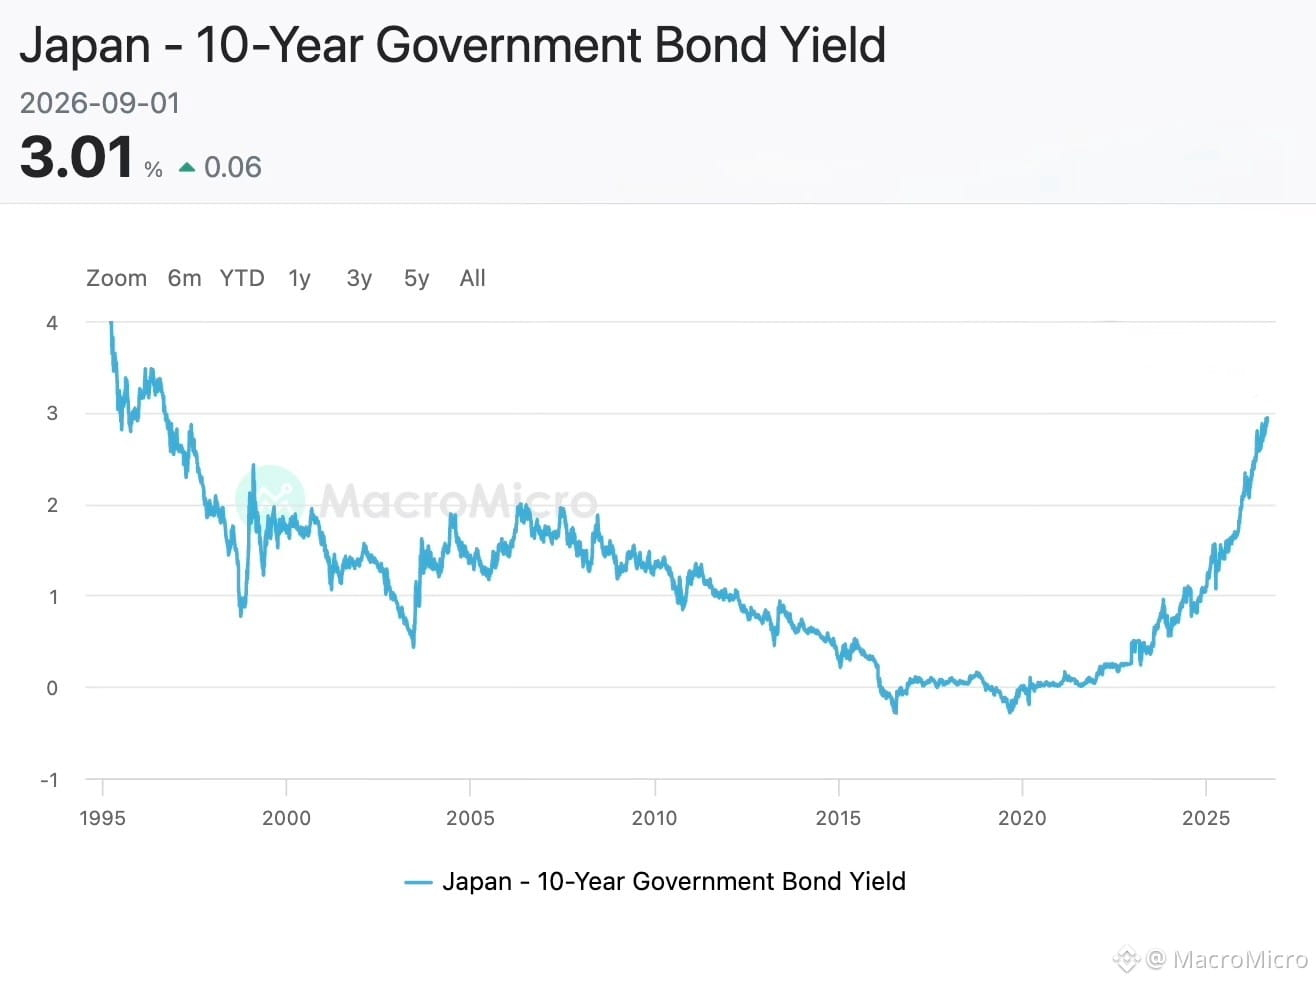
🔴 ÚLTIMA HORA: El rendimiento del bono gubernamental japonés a 10 años subió al 3,00%, el nivel más alto desde septiembre de 1996.
$EWJ
🔴 ÚLTIMA HORA: El rendimiento del bono gubernamental japonés a 10 años subió al 3,00%, el nivel más alto desde septiembre de 1996.
$EWJ
$EWJ
1
717
·
--
🔴 65 meses por encima del objetivo: la inflación domina el discurso de Jackson Hole de Warsh
"La medida preferida de la Fed para la inflación, el cambio interanual del índice de precios PCE, se sitúa en el 3,7 por ciento, mientras que el cambio a seis meses es del 4,1 por ciento".
"En el lado de la estabilidad de precios de nuestro mandato, los números son más preocupantes".
"Así que el foco predominante de la Fed ahora mismo debería estar en los precios".
"Y aunque las lecturas de PCE y CPI de este verano fueron mejores de lo esperado, no me dicen que las tendencias subyacentes hayan mejorado de forma sustancial".
"En los últimos 12 meses, el 54 por ciento de los bienes y servicios de la cesta de PCE mostró subidas de precios por encima del 3 por ciento. Esto está muy por debajo de los máximos posteriores a la pandemia de alrededor del 77 por ciento, pero sigue estando muy por encima del nivel del 32 por ciento de las dos décadas anteriores a la pandemia".
"La responsabilidad de 65 meses de inflación sostenida y elevada recae plenamente en el banco central. Y ahí es donde debe estar".
"La estabilidad de precios no se ejecuta por sí sola, ni la inflación necesariamente tiende a revertirse a la media".
"Debemos estar seguros de que la inflación subyacente se está moviendo hacia nuestro objetivo, de manera clara y a una velocidad suficiente. De lo contrario, tendremos que hacer trabajo".
"Pero la inflación siguió siendo demasiado alta".
"Las medidas comparables del índice de precios al consumidor (CPI) también están elevadas, al igual que las medidas subyacentes de la inflación tanto de PCE como de CPI".
"Ninguna de estas medidas es perfecta, pero todas cuentan una historia similar: la inflación se sitúa por encima de nuestro objetivo del 2 por ciento".
"También conviene vigilar el reciente aumento de los precios de los productos básicos en general".
"Ciertos sectores —como la vivienda y la agricultura— están mostrando tensiones. Pero, en conjunto, me costaría describir que las condiciones financieras generales sean restrictivas".
"Es trabajo de la Fed asegurarse de que las expectativas de inflación no se desanclen".
"También importa si las lecturas de inflación de los últimos cinco-plus años se han filtrado a las expectativas".
$SHY.ETF
🔴 65 meses por encima del objetivo: la inflación domina el discurso de Jackson Hole de Warsh
"La medida preferida de la Fed para la inflación, el cambio interanual del índice de precios PCE, se sitúa en el 3,7 por ciento, mientras que el cambio a seis meses es del 4,1 por ciento".
"En el lado de la estabilidad de precios de nuestro mandato, los números son más preocupantes".
"Así que el foco predominante de la Fed ahora mismo debería estar en los precios".
"Y aunque las lecturas de PCE y CPI de este verano fueron mejores de lo esperado, no me dicen que las tendencias subyacentes hayan mejorado de forma sustancial".
"En los últimos 12 meses, el 54 por ciento de los bienes y servicios de la cesta de PCE mostró subidas de precios por encima del 3 por ciento. Esto está muy por debajo de los máximos posteriores a la pandemia de alrededor del 77 por ciento, pero sigue estando muy por encima del nivel del 32 por ciento de las dos décadas anteriores a la pandemia".
"La responsabilidad de 65 meses de inflación sostenida y elevada recae plenamente en el banco central. Y ahí es donde debe estar".
"La estabilidad de precios no se ejecuta por sí sola, ni la inflación necesariamente tiende a revertirse a la media".
"Debemos estar seguros de que la inflación subyacente se está moviendo hacia nuestro objetivo, de manera clara y a una velocidad suficiente. De lo contrario, tendremos que hacer trabajo".
"Pero la inflación siguió siendo demasiado alta".
"Las medidas comparables del índice de precios al consumidor (CPI) también están elevadas, al igual que las medidas subyacentes de la inflación tanto de PCE como de CPI".
"Ninguna de estas medidas es perfecta, pero todas cuentan una historia similar: la inflación se sitúa por encima de nuestro objetivo del 2 por ciento".
"También conviene vigilar el reciente aumento de los precios de los productos básicos en general".
"Ciertos sectores —como la vivienda y la agricultura— están mostrando tensiones. Pero, en conjunto, me costaría describir que las condiciones financieras generales sean restrictivas".
"Es trabajo de la Fed asegurarse de que las expectativas de inflación no se desanclen".
"También importa si las lecturas de inflación de los últimos cinco-plus años se han filtrado a las expectativas".
$SHY.ETF
"La medida preferida de la Fed para la inflación, el cambio interanual del índice de precios PCE, se sitúa en el 3,7 por ciento, mientras que el cambio a seis meses es del 4,1 por ciento".
"En el lado de la estabilidad de precios de nuestro mandato, los números son más preocupantes".
"Así que el foco predominante de la Fed ahora mismo debería estar en los precios".
"Y aunque las lecturas de PCE y CPI de este verano fueron mejores de lo esperado, no me dicen que las tendencias subyacentes hayan mejorado de forma sustancial".
"En los últimos 12 meses, el 54 por ciento de los bienes y servicios de la cesta de PCE mostró subidas de precios por encima del 3 por ciento. Esto está muy por debajo de los máximos posteriores a la pandemia de alrededor del 77 por ciento, pero sigue estando muy por encima del nivel del 32 por ciento de las dos décadas anteriores a la pandemia".
"La responsabilidad de 65 meses de inflación sostenida y elevada recae plenamente en el banco central. Y ahí es donde debe estar".
"La estabilidad de precios no se ejecuta por sí sola, ni la inflación necesariamente tiende a revertirse a la media".
"Debemos estar seguros de que la inflación subyacente se está moviendo hacia nuestro objetivo, de manera clara y a una velocidad suficiente. De lo contrario, tendremos que hacer trabajo".
"Pero la inflación siguió siendo demasiado alta".
"Las medidas comparables del índice de precios al consumidor (CPI) también están elevadas, al igual que las medidas subyacentes de la inflación tanto de PCE como de CPI".
"Ninguna de estas medidas es perfecta, pero todas cuentan una historia similar: la inflación se sitúa por encima de nuestro objetivo del 2 por ciento".
"También conviene vigilar el reciente aumento de los precios de los productos básicos en general".
"Ciertos sectores —como la vivienda y la agricultura— están mostrando tensiones. Pero, en conjunto, me costaría describir que las condiciones financieras generales sean restrictivas".
"Es trabajo de la Fed asegurarse de que las expectativas de inflación no se desanclen".
"También importa si las lecturas de inflación de los últimos cinco-plus años se han filtrado a las expectativas".
$SHY.ETF
1
494
·
--
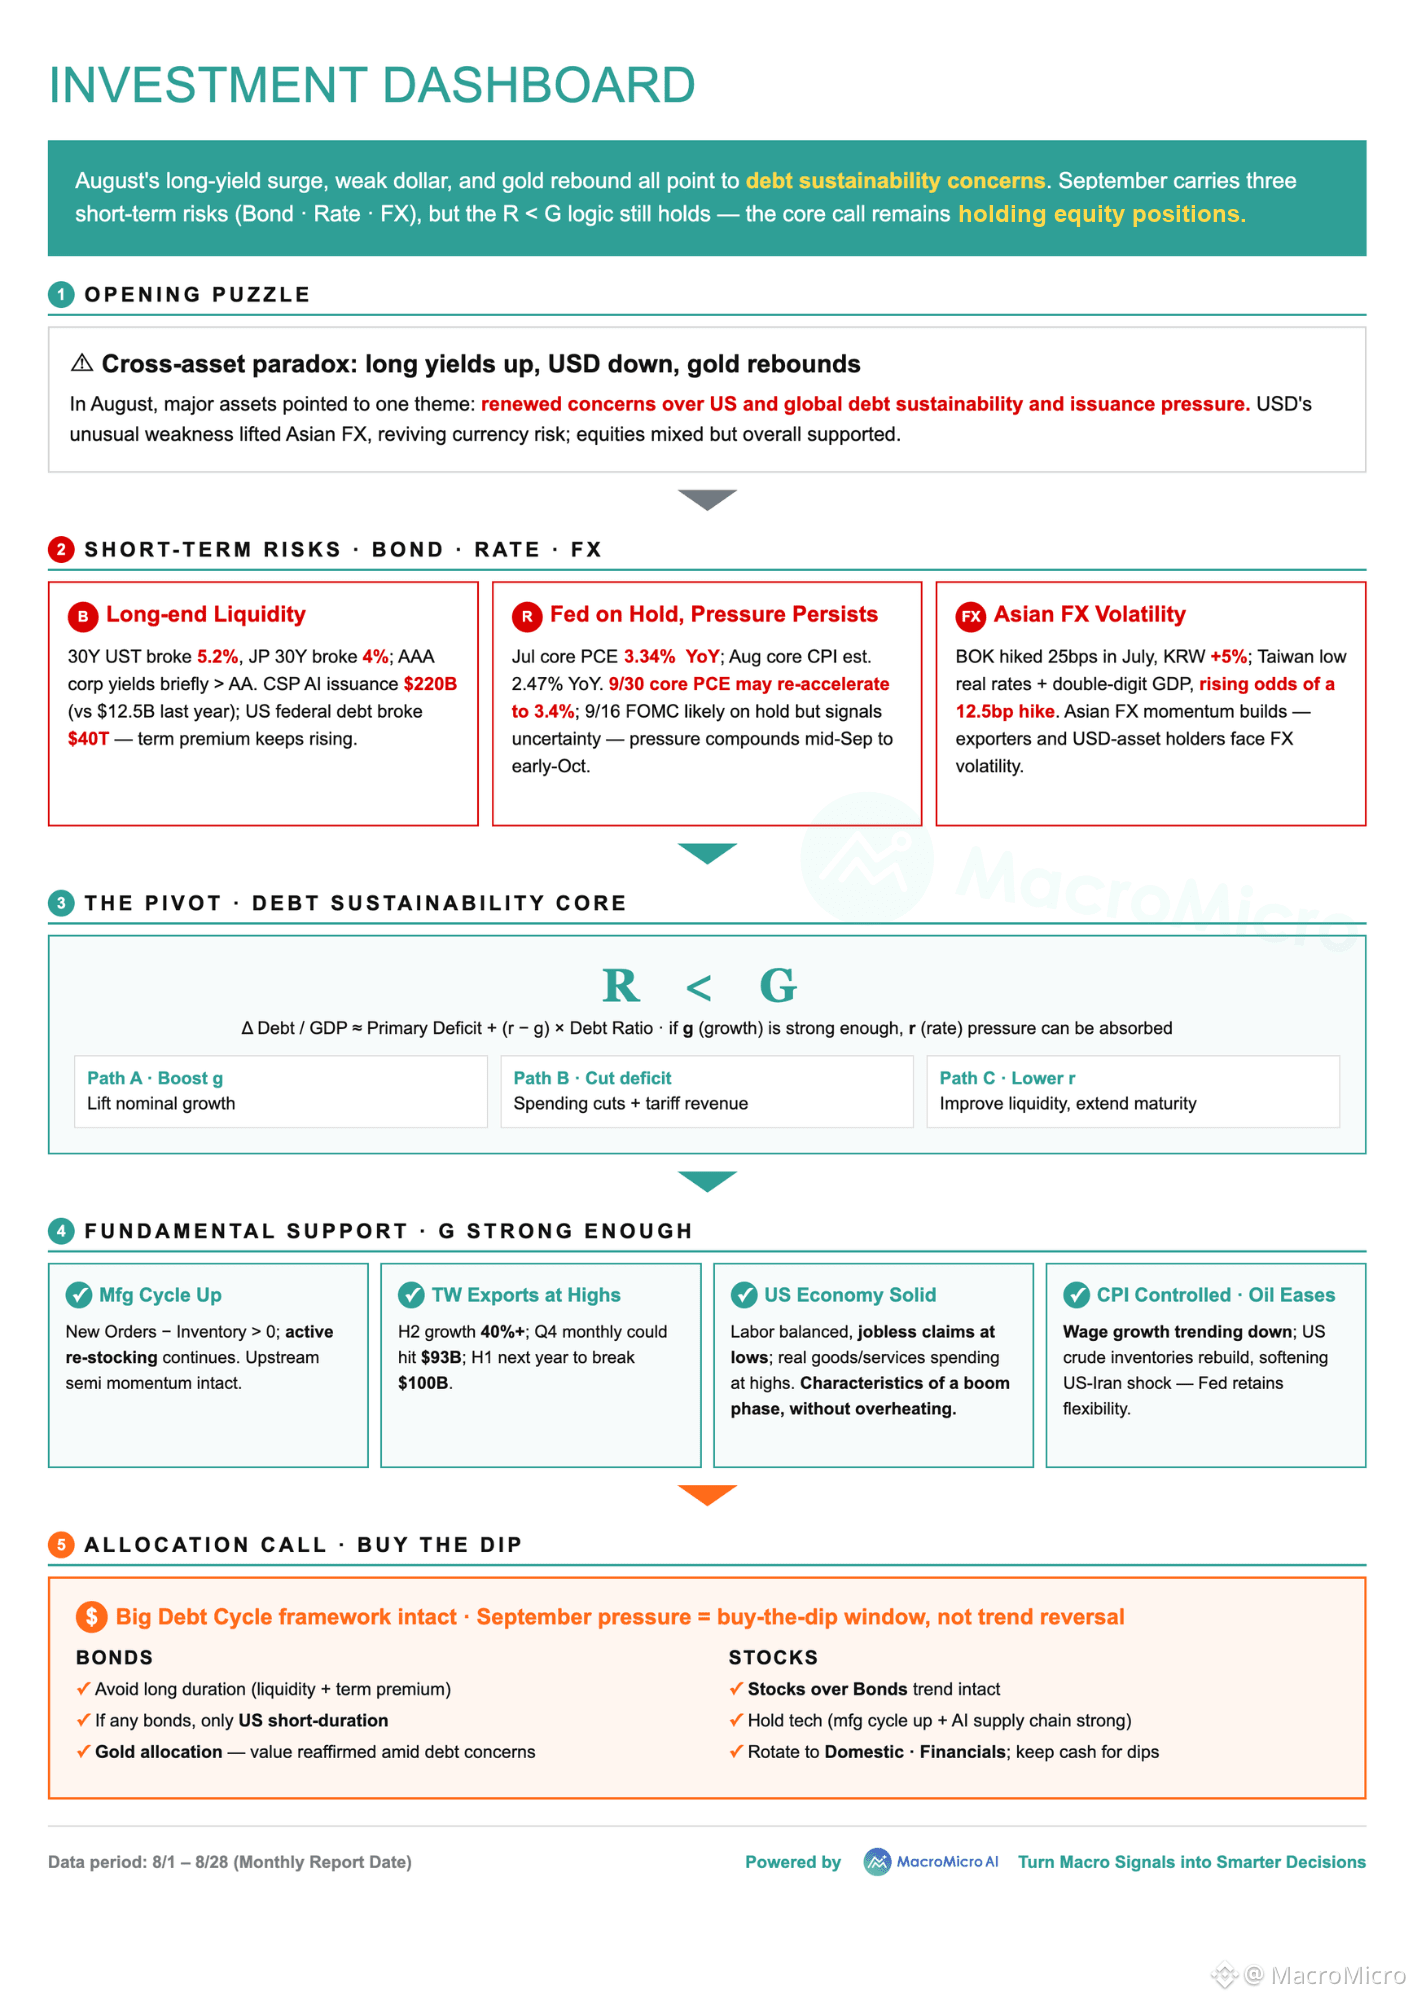
📊 ¡El nuevo Investment Dashboard ya está disponible!
Siéntete libre de guardarlo, compartirlo — querrás tener este a mano.
Los movimientos de activos de agosto apuntaron todos en la misma dirección: los rendimientos a largo plazo se dispararon, el dólar cayó y el oro se recuperó — tres señales separadas, un tema compartido: vuelven las preocupaciones sobre la sostenibilidad de la deuda.
De cara a septiembre, la pregunta real no es si esta presión se disipa. Es si el crecimiento (G) sigue siendo lo bastante fuerte como para superarla.
Lo desglosamos en 3 temas — vista completa en el dashboard a continuación.
👋🏻Siéntete libre de compartirlo o volver a publicarlo. Sigue a MacroMicro para mantenerte por delante del riesgo de mercado antes del próximo movimiento: https://mmgo.me/y6cugk
📊 ¡El nuevo Investment Dashboard ya está disponible!
Siéntete libre de guardarlo, compartirlo — querrás tener este a mano.
Los movimientos de activos de agosto apuntaron todos en la misma dirección: los rendimientos a largo plazo se dispararon, el dólar cayó y el oro se recuperó — tres señales separadas, un tema compartido: vuelven las preocupaciones sobre la sostenibilidad de la deuda.
De cara a septiembre, la pregunta real no es si esta presión se disipa. Es si el crecimiento (G) sigue siendo lo bastante fuerte como para superarla.
Lo desglosamos en 3 temas — vista completa en el dashboard a continuación.
👋🏻Siéntete libre de compartirlo o volver a publicarlo. Sigue a MacroMicro para mantenerte por delante del riesgo de mercado antes del próximo movimiento: https://mmgo.me/y6cugk
Siéntete libre de guardarlo, compartirlo — querrás tener este a mano.
Los movimientos de activos de agosto apuntaron todos en la misma dirección: los rendimientos a largo plazo se dispararon, el dólar cayó y el oro se recuperó — tres señales separadas, un tema compartido: vuelven las preocupaciones sobre la sostenibilidad de la deuda.
De cara a septiembre, la pregunta real no es si esta presión se disipa. Es si el crecimiento (G) sigue siendo lo bastante fuerte como para superarla.
Lo desglosamos en 3 temas — vista completa en el dashboard a continuación.
👋🏻Siéntete libre de compartirlo o volver a publicarlo. Sigue a MacroMicro para mantenerte por delante del riesgo de mercado antes del próximo movimiento: https://mmgo.me/y6cugk
623
·
--
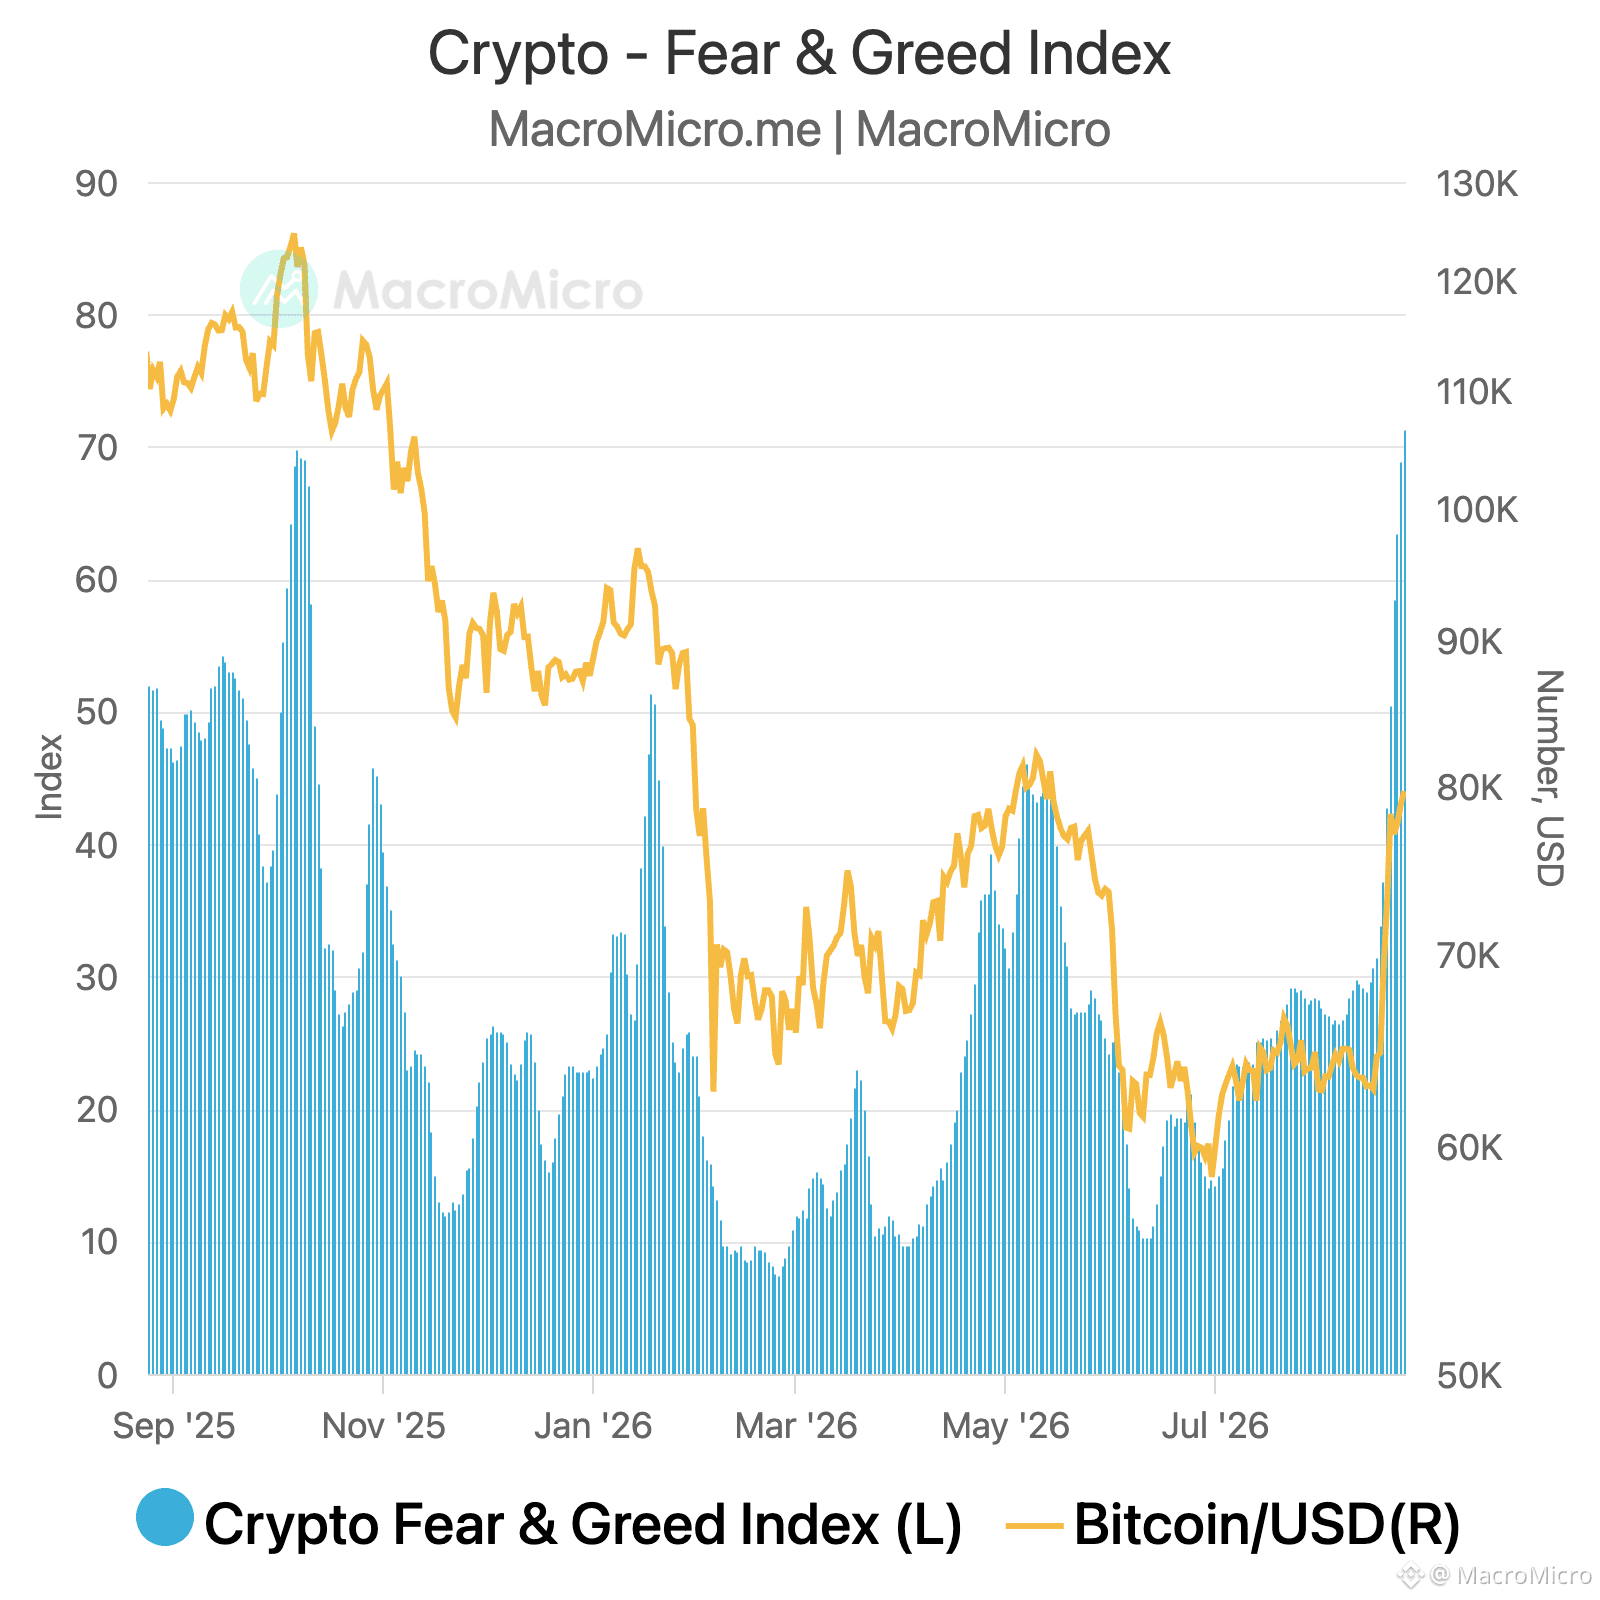
📈 Bitcoin alcanzó $80.000 por primera vez desde mayo de 2026. El oro está haciendo el mismo movimiento.
La Fed ha dejado de añadir compras de letras del Tesoro y el Tesoro está ampliando su capacidad de recompra en el tramo largo. Juntas, esas medidas alivian la presión sobre los mercados de financiación del corto plazo, los mismos canales de repo detrás de TGCR, BGCR y SOFR.
Nonfarm y el IPC ya han descartado cualquier alza a corto plazo. El mercado está descontando ahora esa mejora, antes de la claridad que se espera que traigan las conversaciones de la Fed en septiembre y las de Jackson Hole.
$BTC
{spot}(BTCUSDT)
📈 Bitcoin alcanzó $80.000 por primera vez desde mayo de 2026. El oro está haciendo el mismo movimiento.
La Fed ha dejado de añadir compras de letras del Tesoro y el Tesoro está ampliando su capacidad de recompra en el tramo largo. Juntas, esas medidas alivian la presión sobre los mercados de financiación del corto plazo, los mismos canales de repo detrás de TGCR, BGCR y SOFR.
Nonfarm y el IPC ya han descartado cualquier alza a corto plazo. El mercado está descontando ahora esa mejora, antes de la claridad que se espera que traigan las conversaciones de la Fed en septiembre y las de Jackson Hole.
$BTC
La Fed ha dejado de añadir compras de letras del Tesoro y el Tesoro está ampliando su capacidad de recompra en el tramo largo. Juntas, esas medidas alivian la presión sobre los mercados de financiación del corto plazo, los mismos canales de repo detrás de TGCR, BGCR y SOFR.
Nonfarm y el IPC ya han descartado cualquier alza a corto plazo. El mercado está descontando ahora esa mejora, antes de la claridad que se espera que traigan las conversaciones de la Fed en septiembre y las de Jackson Hole.
$BTC
2
16
19.5k
·
--
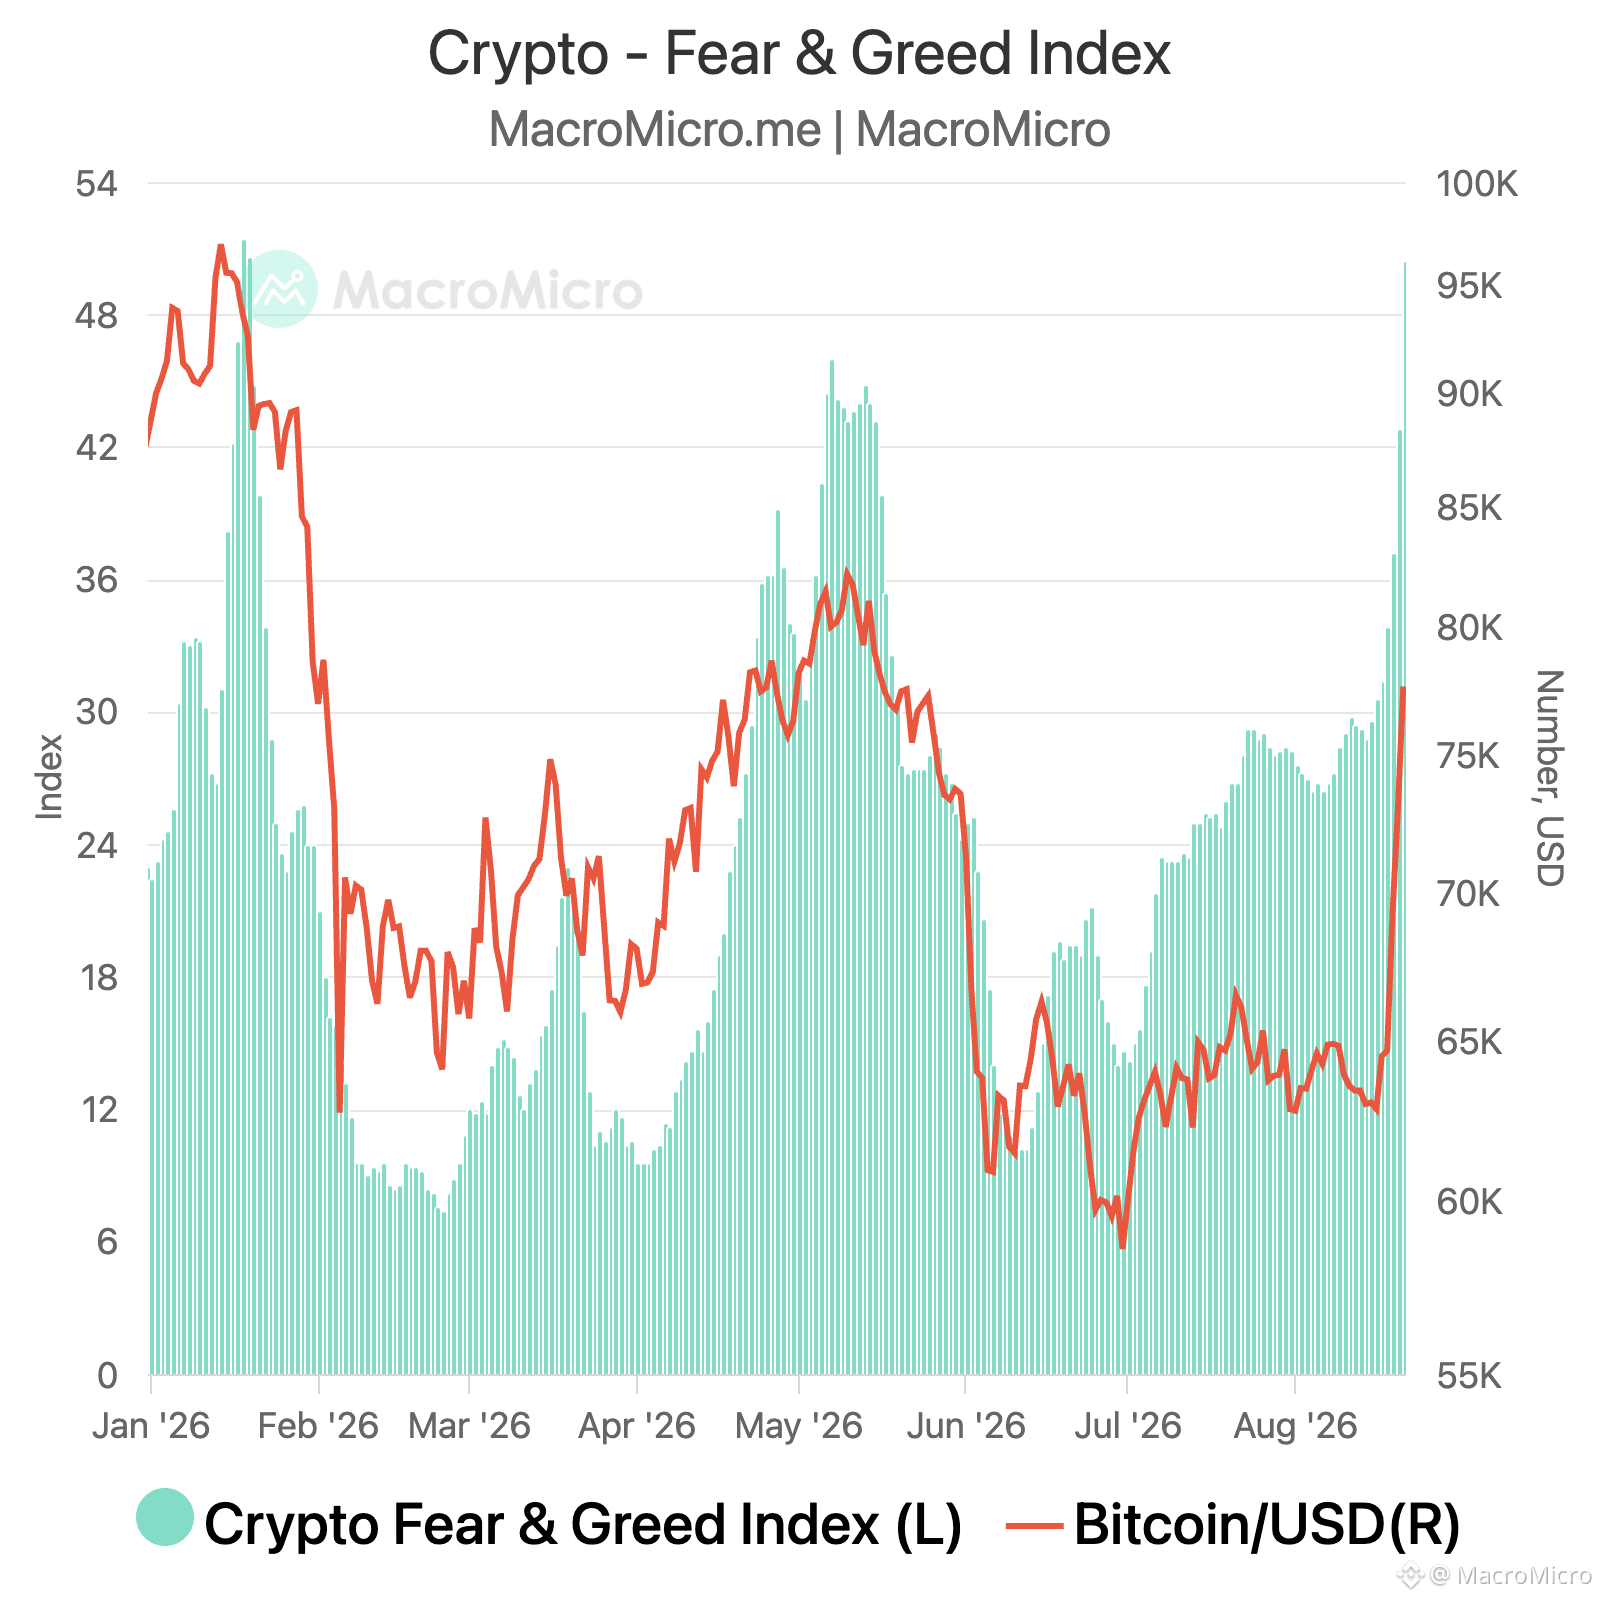
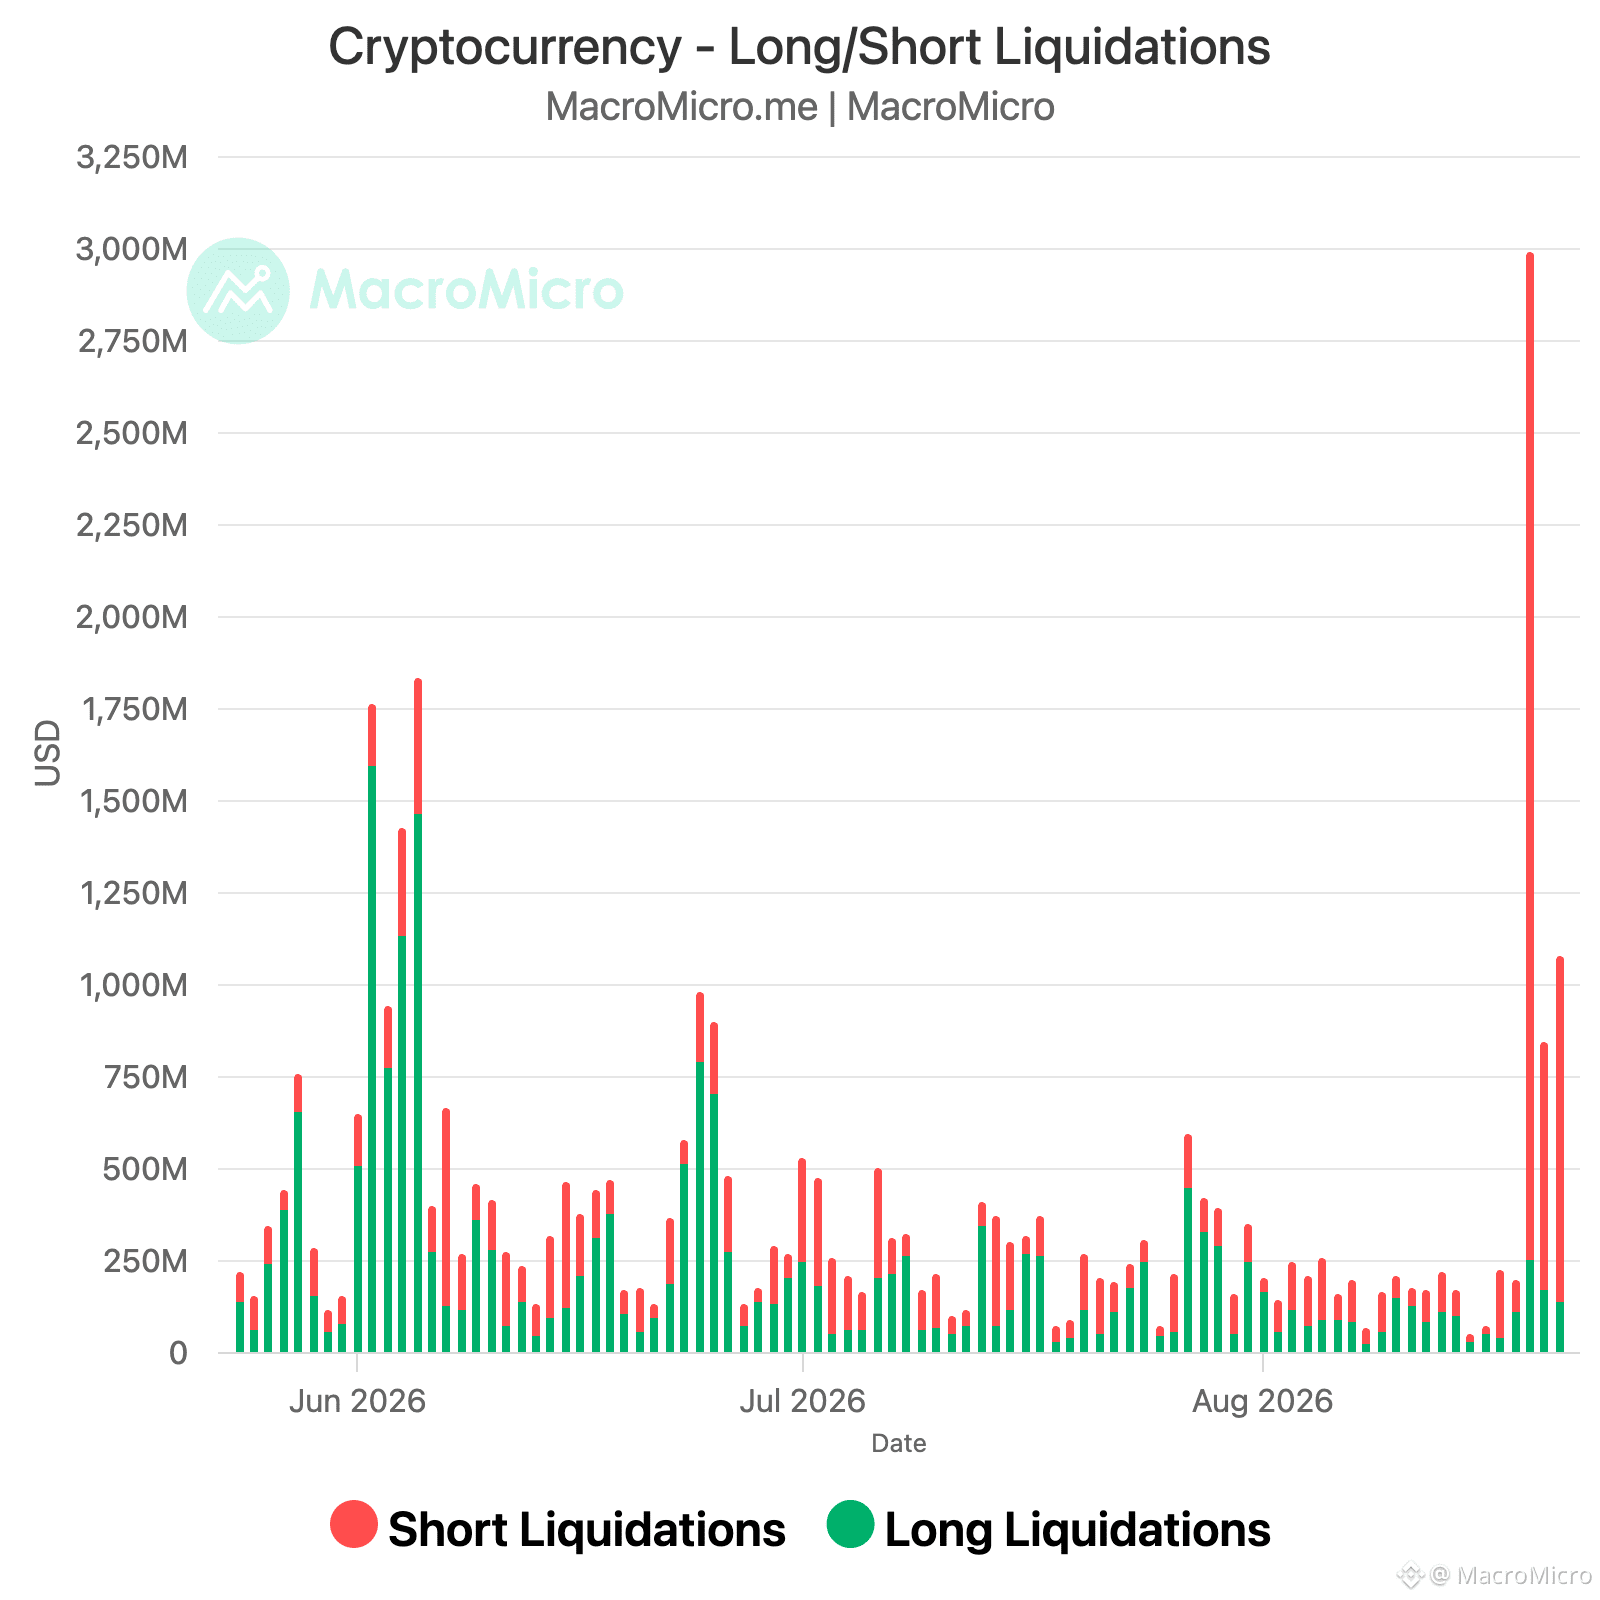
🚨 Bitcoin por encima de $78,000, ¡sube más de 30% en cuatro días! La capitalización del mercado cripto ha añadido $450 mil millones desde el lunes.
¡Se liquidaron $1.24 mil millones en posiciones cortas del mercado cripto en las últimas 24 horas solamente!
$BTC
{spot}(BTCUSDT)
🚨 Bitcoin por encima de $78,000, ¡sube más de 30% en cuatro días! La capitalización del mercado cripto ha añadido $450 mil millones desde el lunes.
¡Se liquidaron $1.24 mil millones en posiciones cortas del mercado cripto en las últimas 24 horas solamente!
$BTC
¡Se liquidaron $1.24 mil millones en posiciones cortas del mercado cripto en las últimas 24 horas solamente!
$BTC
3
5.5k
·
--
Verificado
🇰🇷¡En vivo ahora! Monitor macro de Corea — ¿el mercado alcista está respaldado por fundamentos?
La prueba de hoy: el KOSPI rebotó +5,9% hasta 6.852,58, activando un sidecar de compra — el 49.º del año. Samsung +9%, SK Hynix +12%, gracias a un anuncio de recompra por $29B de SK Hynix y al descenso de los rendimientos de los bonos del Tesoro de EE. UU., que impulsaron la recuperación.
Corea acaba de dar la vuelta; los fundamentos aún no se han puesto al día:
Rally impulsado por el apalancamiento → Corrección brusca → De vuelta al territorio alcista.
Por qué importa: Samsung + SK Hynix representan la mayor parte del HBM/DRAM del mundo — los chips de memoria detrás del impulso de la IA. Los datos de exportación de Corea marcan la pauta frente a nombres como Micron y el ciclo de la memoria en general.
Cinco gráficos sobre los fundamentos de Corea + el ciclo de la memoria:
1. ¿La recuperación es real? Indicadores del ciclo empresarial
2. ¿El impulso de las exportaciones se mantiene? Exportaciones totales en los primeros 20 días
3. ¿Campana del ciclo de la memoria? Índice de precios de exportación - Memoria (YoY)
4. ¿Demanda real o solo subidas de precios? Inventarios de Semiconductores & Partes / Ratio de envíos
5. ¿El rally tiene liquidez detrás? — Depósitos de inversores
👇Enlaces de los gráficos en los comentarios
🇰🇷¡En vivo ahora! Monitor macro de Corea — ¿el mercado alcista está respaldado por fundamentos?
La prueba de hoy: el KOSPI rebotó +5,9% hasta 6.852,58, activando un sidecar de compra — el 49.º del año. Samsung +9%, SK Hynix +12%, gracias a un anuncio de recompra por $29B de SK Hynix y al descenso de los rendimientos de los bonos del Tesoro de EE. UU., que impulsaron la recuperación.
Corea acaba de dar la vuelta; los fundamentos aún no se han puesto al día:
Rally impulsado por el apalancamiento → Corrección brusca → De vuelta al territorio alcista.
Por qué importa: Samsung + SK Hynix representan la mayor parte del HBM/DRAM del mundo — los chips de memoria detrás del impulso de la IA. Los datos de exportación de Corea marcan la pauta frente a nombres como Micron y el ciclo de la memoria en general.
Cinco gráficos sobre los fundamentos de Corea + el ciclo de la memoria:
1. ¿La recuperación es real? Indicadores del ciclo empresarial
2. ¿El impulso de las exportaciones se mantiene? Exportaciones totales en los primeros 20 días
3. ¿Campana del ciclo de la memoria? Índice de precios de exportación - Memoria (YoY)
4. ¿Demanda real o solo subidas de precios? Inventarios de Semiconductores & Partes / Ratio de envíos
5. ¿El rally tiene liquidez detrás? — Depósitos de inversores
👇Enlaces de los gráficos en los comentarios
La prueba de hoy: el KOSPI rebotó +5,9% hasta 6.852,58, activando un sidecar de compra — el 49.º del año. Samsung +9%, SK Hynix +12%, gracias a un anuncio de recompra por $29B de SK Hynix y al descenso de los rendimientos de los bonos del Tesoro de EE. UU., que impulsaron la recuperación.
Corea acaba de dar la vuelta; los fundamentos aún no se han puesto al día:
Rally impulsado por el apalancamiento → Corrección brusca → De vuelta al territorio alcista.
Por qué importa: Samsung + SK Hynix representan la mayor parte del HBM/DRAM del mundo — los chips de memoria detrás del impulso de la IA. Los datos de exportación de Corea marcan la pauta frente a nombres como Micron y el ciclo de la memoria en general.
Cinco gráficos sobre los fundamentos de Corea + el ciclo de la memoria:
1. ¿La recuperación es real? Indicadores del ciclo empresarial
2. ¿El impulso de las exportaciones se mantiene? Exportaciones totales en los primeros 20 días
3. ¿Campana del ciclo de la memoria? Índice de precios de exportación - Memoria (YoY)
4. ¿Demanda real o solo subidas de precios? Inventarios de Semiconductores & Partes / Ratio de envíos
5. ¿El rally tiene liquidez detrás? — Depósitos de inversores
👇Enlaces de los gráficos en los comentarios

1
1.2k
·
--
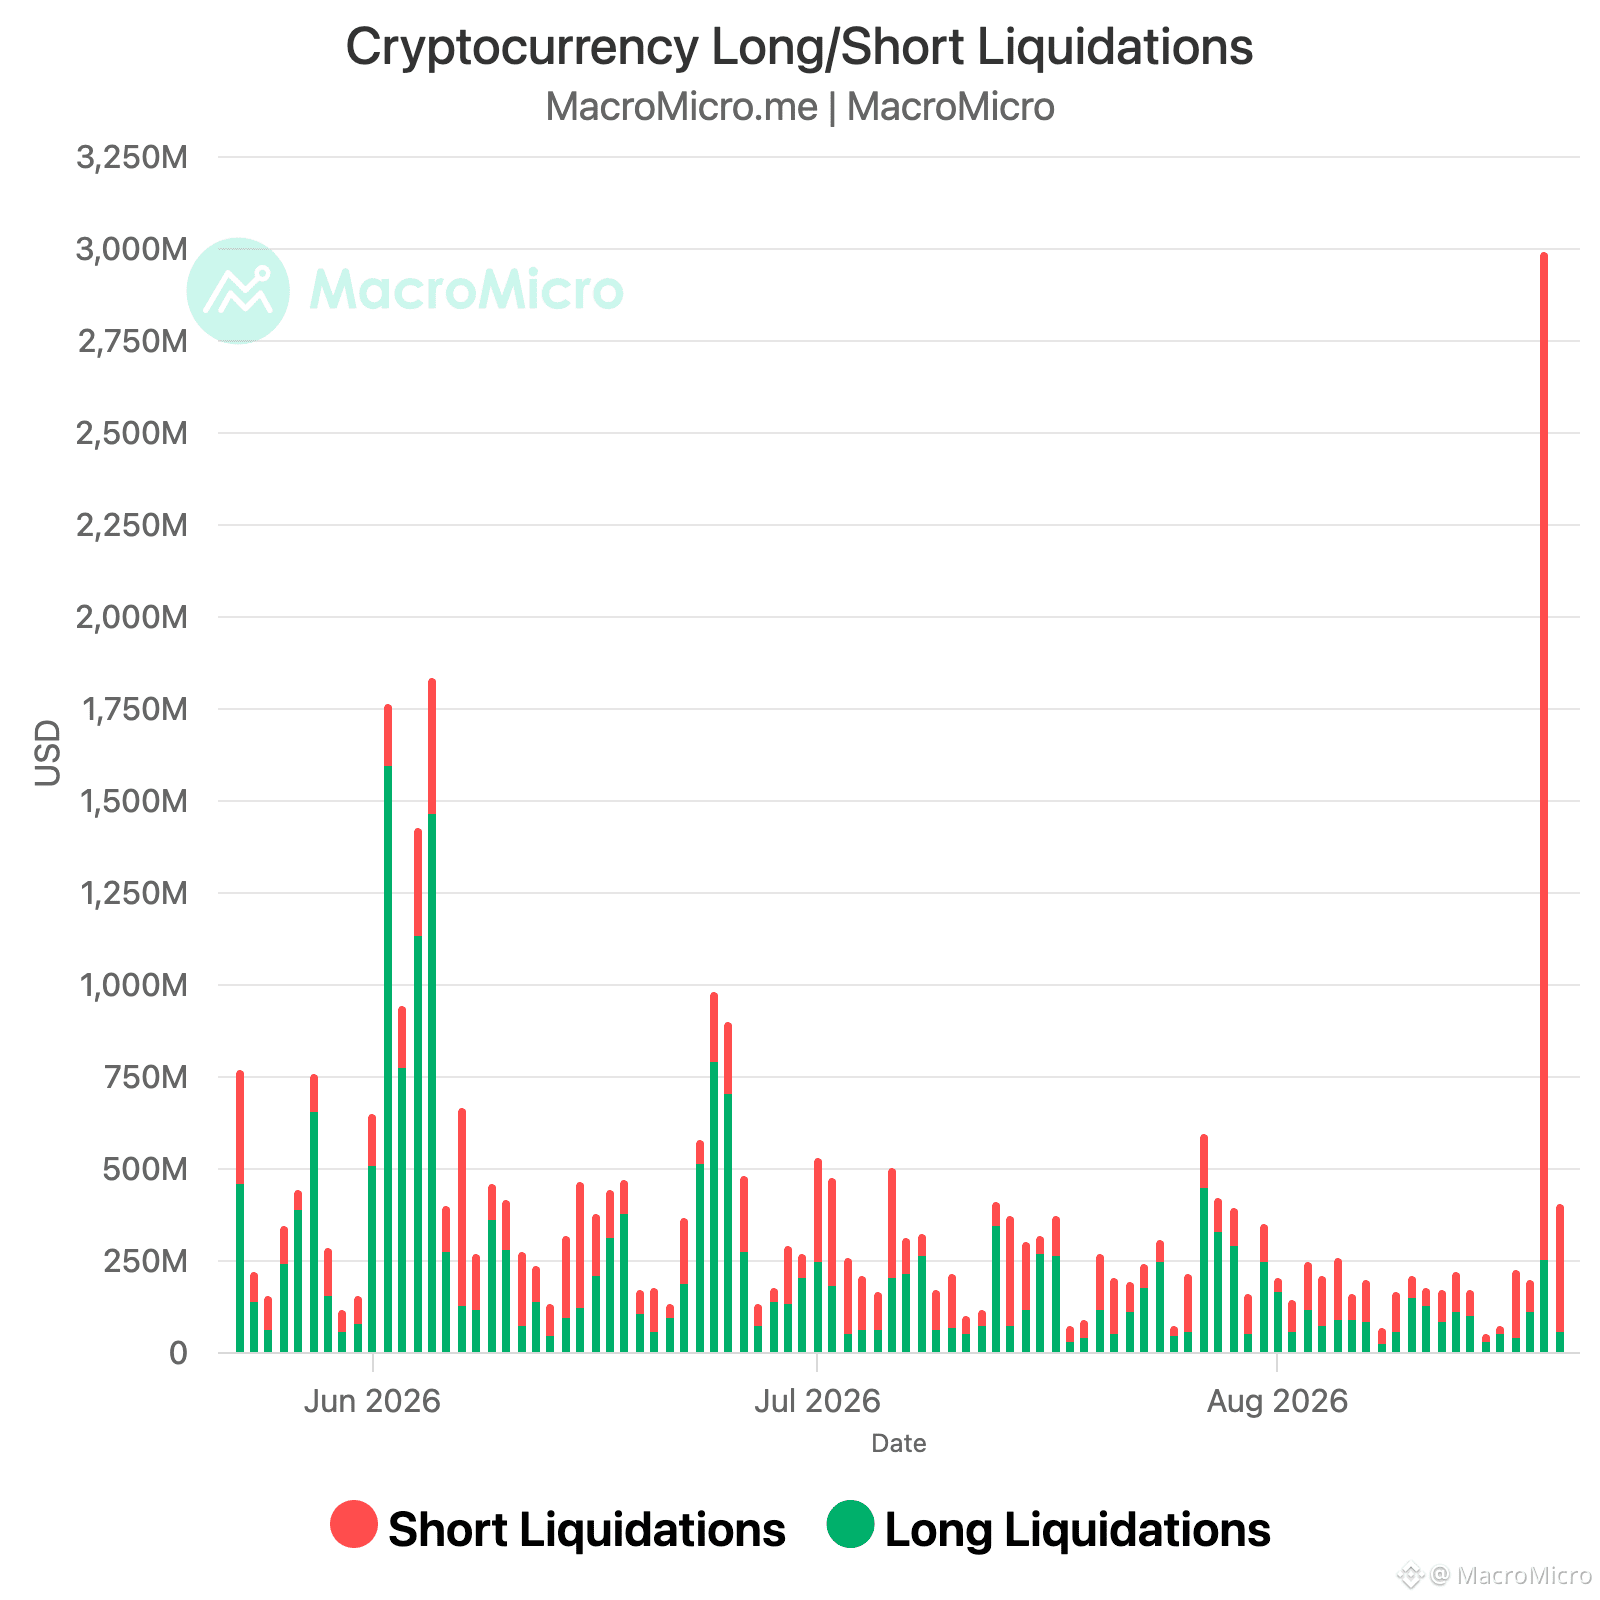
📈 Bitcoin pasó de 65.400 a 69.700 dólares en menos de una hora. En una sola vela de un minuto se borraron 746 millones en posiciones cortas, ya que el movimiento dejó atrapados a los vendedores apalancados. Las liquidaciones totales de cripto alcanzaron 3.000 millones de dólares en 24 horas.
El movimiento se remonta al mercado de bonos. El Tesoro duplicó su tope de recompra de largo plazo de 2.000 millones a 4.000 millones de dólares por operación, apuntando a deuda de 10 a 30 años del 9 de septiembre al 4 de noviembre. El anuncio llegó un día después de que el rendimiento del 30 años tocara 5,337%, su nivel más alto desde 2007. El rendimiento del 10 años cayó 6 puntos básicos hasta 4,647%; el del 30 años cayó 9 puntos básicos hasta 5,196%.
Esto no es QE. La Fed no expandió su balance. El Tesoro recompró su propia deuda existente para suavizar la liquidez en el tramo largo, a una escala aún pequeña frente a un mercado de 32 billones de dólares. Pero el descenso de los rendimientos a largo plazo redujo la tasa de descuento sobre los activos de riesgo justo en el momento en que los cortos apalancados estaban posicionados contra Bitcoin, y la contracción hizo el resto.
$BTC
{spot}(BTCUSDT)
📈 Bitcoin pasó de 65.400 a 69.700 dólares en menos de una hora. En una sola vela de un minuto se borraron 746 millones en posiciones cortas, ya que el movimiento dejó atrapados a los vendedores apalancados. Las liquidaciones totales de cripto alcanzaron 3.000 millones de dólares en 24 horas.
El movimiento se remonta al mercado de bonos. El Tesoro duplicó su tope de recompra de largo plazo de 2.000 millones a 4.000 millones de dólares por operación, apuntando a deuda de 10 a 30 años del 9 de septiembre al 4 de noviembre. El anuncio llegó un día después de que el rendimiento del 30 años tocara 5,337%, su nivel más alto desde 2007. El rendimiento del 10 años cayó 6 puntos básicos hasta 4,647%; el del 30 años cayó 9 puntos básicos hasta 5,196%.
Esto no es QE. La Fed no expandió su balance. El Tesoro recompró su propia deuda existente para suavizar la liquidez en el tramo largo, a una escala aún pequeña frente a un mercado de 32 billones de dólares. Pero el descenso de los rendimientos a largo plazo redujo la tasa de descuento sobre los activos de riesgo justo en el momento en que los cortos apalancados estaban posicionados contra Bitcoin, y la contracción hizo el resto.
$BTC
El movimiento se remonta al mercado de bonos. El Tesoro duplicó su tope de recompra de largo plazo de 2.000 millones a 4.000 millones de dólares por operación, apuntando a deuda de 10 a 30 años del 9 de septiembre al 4 de noviembre. El anuncio llegó un día después de que el rendimiento del 30 años tocara 5,337%, su nivel más alto desde 2007. El rendimiento del 10 años cayó 6 puntos básicos hasta 4,647%; el del 30 años cayó 9 puntos básicos hasta 5,196%.
Esto no es QE. La Fed no expandió su balance. El Tesoro recompró su propia deuda existente para suavizar la liquidez en el tramo largo, a una escala aún pequeña frente a un mercado de 32 billones de dólares. Pero el descenso de los rendimientos a largo plazo redujo la tasa de descuento sobre los activos de riesgo justo en el momento en que los cortos apalancados estaban posicionados contra Bitcoin, y la contracción hizo el resto.
$BTC
8
11
26.7k
·
--
Verificado
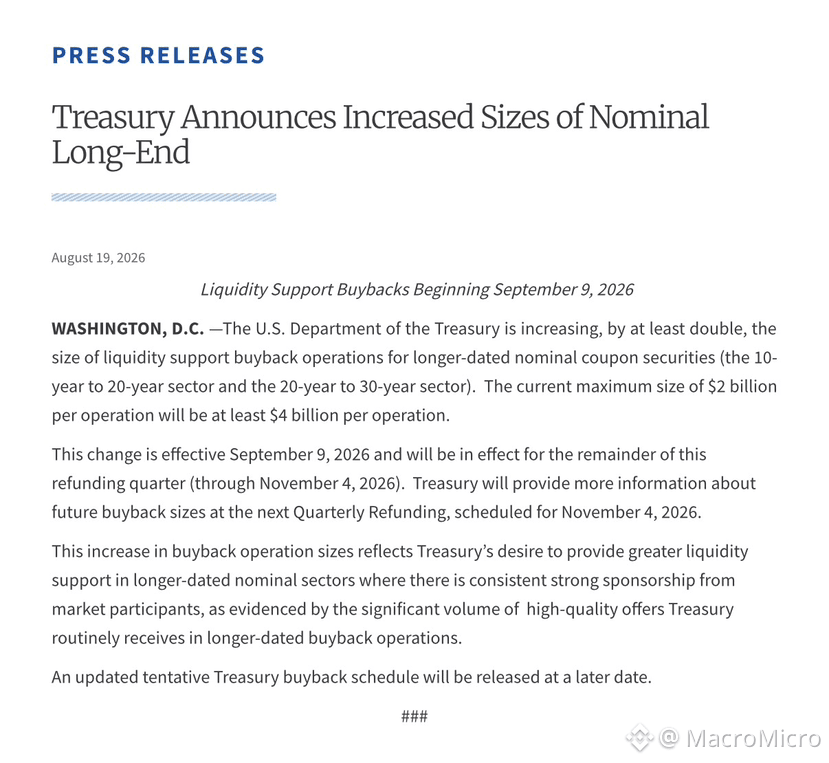
🔴ÚLTIMA HORA: El Tesoro de EE. UU. incrementa el tamaño del apoyo de liquidez para operaciones de recompra de valores nominales con cupón de vencimiento más largo.
El Tesoro está duplicando las recompras para valores de 10 a 30 años, hasta al menos 4.000 millones de dólares por operación.
Plazo: Los nuevos límites entran en vigor del 9 de septiembre al 4 de noviembre de 2026.
Objetivo: El cambio busca impulsar la liquidez del mercado en estos sectores de mayor duración.
🔴ÚLTIMA HORA: El Tesoro de EE. UU. incrementa el tamaño del apoyo de liquidez para operaciones de recompra de valores nominales con cupón de vencimiento más largo.
El Tesoro está duplicando las recompras para valores de 10 a 30 años, hasta al menos 4.000 millones de dólares por operación.
Plazo: Los nuevos límites entran en vigor del 9 de septiembre al 4 de noviembre de 2026.
Objetivo: El cambio busca impulsar la liquidez del mercado en estos sectores de mayor duración.
El Tesoro está duplicando las recompras para valores de 10 a 30 años, hasta al menos 4.000 millones de dólares por operación.
Plazo: Los nuevos límites entran en vigor del 9 de septiembre al 4 de noviembre de 2026.
Objetivo: El cambio busca impulsar la liquidez del mercado en estos sectores de mayor duración.
901
·
--
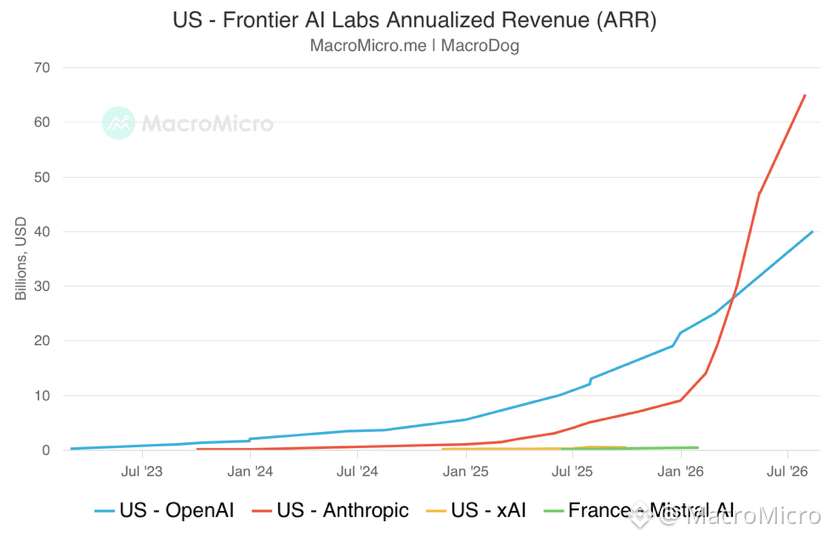
La tasa anualizada de ingresos de Anthropic superó los 65.000 millones de dólares para finales de julio, desde apenas ~9.000 millones al cierre del año.
Pero el impulso se ha desacelerado: subió ~18.000 millones desde principios de mayo hasta julio, frente a ~17.000 millones en solo un mes de abril a mayo.
Las expectativas del mercado eran mucho más altas, y algunas estimaciones de terceros se situaban previamente cerca de los 80.000 millones.
La tasa anualizada de ingresos de Anthropic superó los 65.000 millones de dólares para finales de julio, desde apenas ~9.000 millones al cierre del año.
Pero el impulso se ha desacelerado: subió ~18.000 millones desde principios de mayo hasta julio, frente a ~17.000 millones en solo un mes de abril a mayo.
Las expectativas del mercado eran mucho más altas, y algunas estimaciones de terceros se situaban previamente cerca de los 80.000 millones.
Pero el impulso se ha desacelerado: subió ~18.000 millones desde principios de mayo hasta julio, frente a ~17.000 millones en solo un mes de abril a mayo.
Las expectativas del mercado eran mucho más altas, y algunas estimaciones de terceros se situaban previamente cerca de los 80.000 millones.
2.5k
Inicia sesión para explorar más contenidos
Únete a usuarios globales de criptomonedas en Binance Square
⚡️ Obtén información útil y actualizada sobre criptos.
💬 Avalado por el mayor exchange de criptomonedas en el mundo.
👍 Descubre perspectivas reales de creadores verificados.
Email/número de teléfono
Temas populares
AIStocksWhatNext
121,024 vistas
1,525 están debatiendo
Comparte y gana recompensas de tráfico en nuestra campaña de hashtag en tendencia
✨Tema: ¿Qué otras oportunidades de inversión siguen vigentes mientras las acciones de IA continúan subiendo?
👉Cómo unirte:
Publica una publicación breve o un artículo con el hashtag #AIStocksWhatNext
Comparte si eres alcista o bajista, y publica tus participaciones en acciones de IA o tu operación — usar el widget de operaciones puede mejorar tu elegibilidad.
También puedes fortalecer tu publicación compartiendo datos o gráficos, y evitando imágenes generadas por IA.
✍️Crea contenido basado en los ángulos siguientes:
- Nvidia dice que las ventas de chips se duplicarán el próximo año, y las principales empresas de IA siguen registrando ingresos récord; el gasto en cómputo que hay detrás es igualmente asombroso. ¿La demanda de IA realmente está despegando? ¿Y cuánto tiempo puede durar? Las acciones de IA suben en general. ¿Se trata de una ruptura real o solo de un rebote a corto plazo?
- Líderes de la industria piden frenar el desarrollo de la IA, mientras Trump planea construir una “AI Force”, afirmando que la IA podría representar el 25% del PIB de EE. UU. en el futuro. ¿De qué lado estás? ¿El respaldo a nivel estatal será una victoria a largo plazo para las acciones de IA?
- ¿Estás comprando acciones de IA? Comparte tu operación/tenencias relacionadas con IA con nuestro widget de compartición de operaciones.
⏰Periodo de la campaña:
- 2026-09-22 7:00 - 2026-09-24 4:00 UTC
🎁Recompensa:
- Las publicaciones que cumplan con las pautas anteriores y contengan más de 100 palabras serán revisadas y podrían recibir un impulso aleatorio de tráfico de 500 a 3,000 vistas. Recibirás una notificación de tu secretario/a de feed si tu publicación es seleccionada.
- Obtén la oportunidad de que tu artículo se destaque en Binance Square Official
¿Necesitas ideas para tu publicación? Visita la página del tema #AIStocksWhatNext o la Square Guide on How to Post for Better Reach.
Binance Square Official
·231 me gusta
·412.9k vistas
BitcoinBreaksAboveMayHighNears$86K
2,787 vistas
54 están debatiendo
DogecoinRises15%
6,911 vistas
331 están debatiendo