
#orderbook
orderbook
56,791 vistas
356 están debatiendo
Hot
Lo último

·
--
Ver traducción
Why is nobody talking about the liquidity trap currently forming above $80K?
Most traders keep FOMO buying every single bounce, only to get trapped when order books reveal where the real capital is actually positioned.
Look at the current order book depth for $BTC. Everyone is fixated on the thin layer of liquidity sitting around the $80,000 level, treating it as a guaranteed springboard. But if you analyze the depth charts, those bids are surprisingly fragile and look more like spoof orders than high-conviction accumulation.
The real institutional buy walls are actually stacked much deeper down the ladder. When major liquidity pulls back, market makers tend to let price slide directly into these heavier demand zones before any meaningful trend reversal can take place. We saw the exact same distribution behavior happen across large caps like $ETH and $SOL during previous local corrections.
Are you placing bids at current levels or waiting for the real liquidity pool to get tapped?
#Bitcoin #CryptoTrading #OrderBook
Why is nobody talking about the liquidity trap currently forming above $80K?
Most traders keep FOMO buying every single bounce, only to get trapped when order books reveal where the real capital is actually positioned.
Look at the current order book depth for $BTC . Everyone is fixated on the thin layer of liquidity sitting around the $80,000 level, treating it as a guaranteed springboard. But if you analyze the depth charts, those bids are surprisingly fragile and look more like spoof orders than high-conviction accumulation.
The real institutional buy walls are actually stacked much deeper down the ladder. When major liquidity pulls back, market makers tend to let price slide directly into these heavier demand zones before any meaningful trend reversal can take place. We saw the exact same distribution behavior happen across large caps like $ETH and $SOL during previous local corrections.
Are you placing bids at current levels or waiting for the real liquidity pool to get tapped?
#Bitcoin #CryptoTrading #OrderBook
Most traders keep FOMO buying every single bounce, only to get trapped when order books reveal where the real capital is actually positioned.
Look at the current order book depth for $BTC . Everyone is fixated on the thin layer of liquidity sitting around the $80,000 level, treating it as a guaranteed springboard. But if you analyze the depth charts, those bids are surprisingly fragile and look more like spoof orders than high-conviction accumulation.
The real institutional buy walls are actually stacked much deeper down the ladder. When major liquidity pulls back, market makers tend to let price slide directly into these heavier demand zones before any meaningful trend reversal can take place. We saw the exact same distribution behavior happen across large caps like $ETH and $SOL during previous local corrections.
Are you placing bids at current levels or waiting for the real liquidity pool to get tapped?
#Bitcoin #CryptoTrading #OrderBook
11

·
--
La mayoría de los traders minoristas mira el libro de órdenes y asume que las ofertas visibles protegerán su desventaja, pero más del setenta por ciento de la liquidez superficial se retira antes de que el precio ni siquiera la toque.
Todos hemos sentido la punzada de comprar lo que parece un soporte sólido, solo para ver cómo el libro de órdenes se evapora y desencadena dolorosas cascadas de stop-outs. Es un ciclo agotador de atrapar cuchillos que caen simplemente porque la profundidad del mercado parecía más segura en la superficie de lo que realmente era.
Al observar el flujo de órdenes actual, $BTC muestra liquidez dispersa alrededor de $80K, pero esto es, en gran medida, aire fino frente a donde está posicionada la liquidez paciente. Los grandes cúmulos de ofertas y los muros reales de compra estructural están apilados mucho más abajo en la escalera, esperando a que el apalancamiento tardío se lave hasta agotarse.
Vi que esta dinámica exacta se desarrollaba en los ciclos de mercado pasados con Bitcoin y activos importantes como $ETH antes de que se produjeran cambios de tendencia sostenidos. El dinero inteligente rara vez defiende niveles intermedios cuando puede permitir que los vendedores impacientes se agoten directamente contra órdenes límite profundas en reposo.
¿Estás colocando tus ofertas en un soporte visible o esperando a que se llenen los pozos de liquidez más profundos?
#Bitcoin #CryptoTrading #OrderBook
La mayoría de los traders minoristas mira el libro de órdenes y asume que las ofertas visibles protegerán su desventaja, pero más del setenta por ciento de la liquidez superficial se retira antes de que el precio ni siquiera la toque.
Todos hemos sentido la punzada de comprar lo que parece un soporte sólido, solo para ver cómo el libro de órdenes se evapora y desencadena dolorosas cascadas de stop-outs. Es un ciclo agotador de atrapar cuchillos que caen simplemente porque la profundidad del mercado parecía más segura en la superficie de lo que realmente era.
Al observar el flujo de órdenes actual, $BTC muestra liquidez dispersa alrededor de $80K, pero esto es, en gran medida, aire fino frente a donde está posicionada la liquidez paciente. Los grandes cúmulos de ofertas y los muros reales de compra estructural están apilados mucho más abajo en la escalera, esperando a que el apalancamiento tardío se lave hasta agotarse.
Vi que esta dinámica exacta se desarrollaba en los ciclos de mercado pasados con Bitcoin y activos importantes como $ETH antes de que se produjeran cambios de tendencia sostenidos. El dinero inteligente rara vez defiende niveles intermedios cuando puede permitir que los vendedores impacientes se agoten directamente contra órdenes límite profundas en reposo.
¿Estás colocando tus ofertas en un soporte visible o esperando a que se llenen los pozos de liquidez más profundos?
#Bitcoin #CryptoTrading #OrderBook
Todos hemos sentido la punzada de comprar lo que parece un soporte sólido, solo para ver cómo el libro de órdenes se evapora y desencadena dolorosas cascadas de stop-outs. Es un ciclo agotador de atrapar cuchillos que caen simplemente porque la profundidad del mercado parecía más segura en la superficie de lo que realmente era.
Al observar el flujo de órdenes actual, $BTC muestra liquidez dispersa alrededor de $80K, pero esto es, en gran medida, aire fino frente a donde está posicionada la liquidez paciente. Los grandes cúmulos de ofertas y los muros reales de compra estructural están apilados mucho más abajo en la escalera, esperando a que el apalancamiento tardío se lave hasta agotarse.
Vi que esta dinámica exacta se desarrollaba en los ciclos de mercado pasados con Bitcoin y activos importantes como $ETH antes de que se produjeran cambios de tendencia sostenidos. El dinero inteligente rara vez defiende niveles intermedios cuando puede permitir que los vendedores impacientes se agoten directamente contra órdenes límite profundas en reposo.
¿Estás colocando tus ofertas en un soporte visible o esperando a que se llenen los pozos de liquidez más profundos?
#Bitcoin #CryptoTrading #OrderBook
11
·
--
Artículo
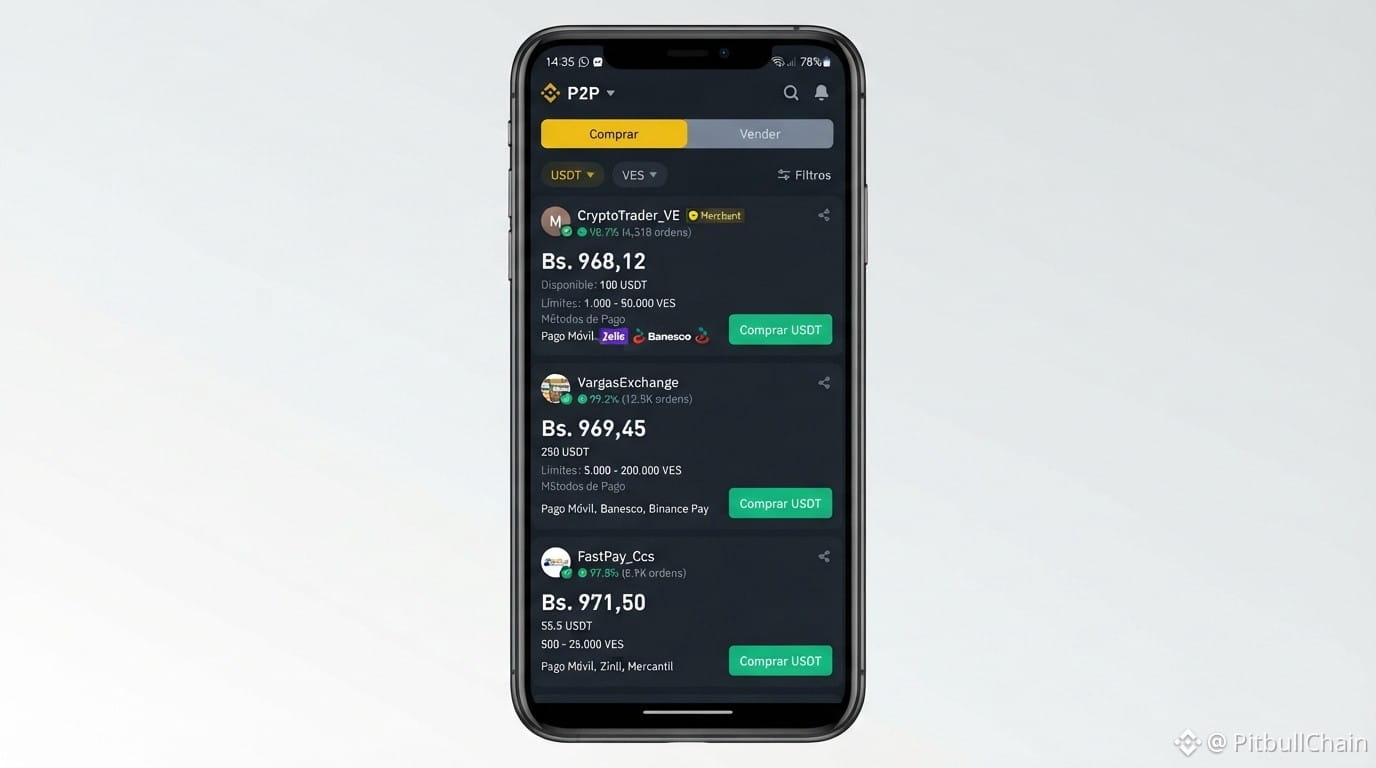
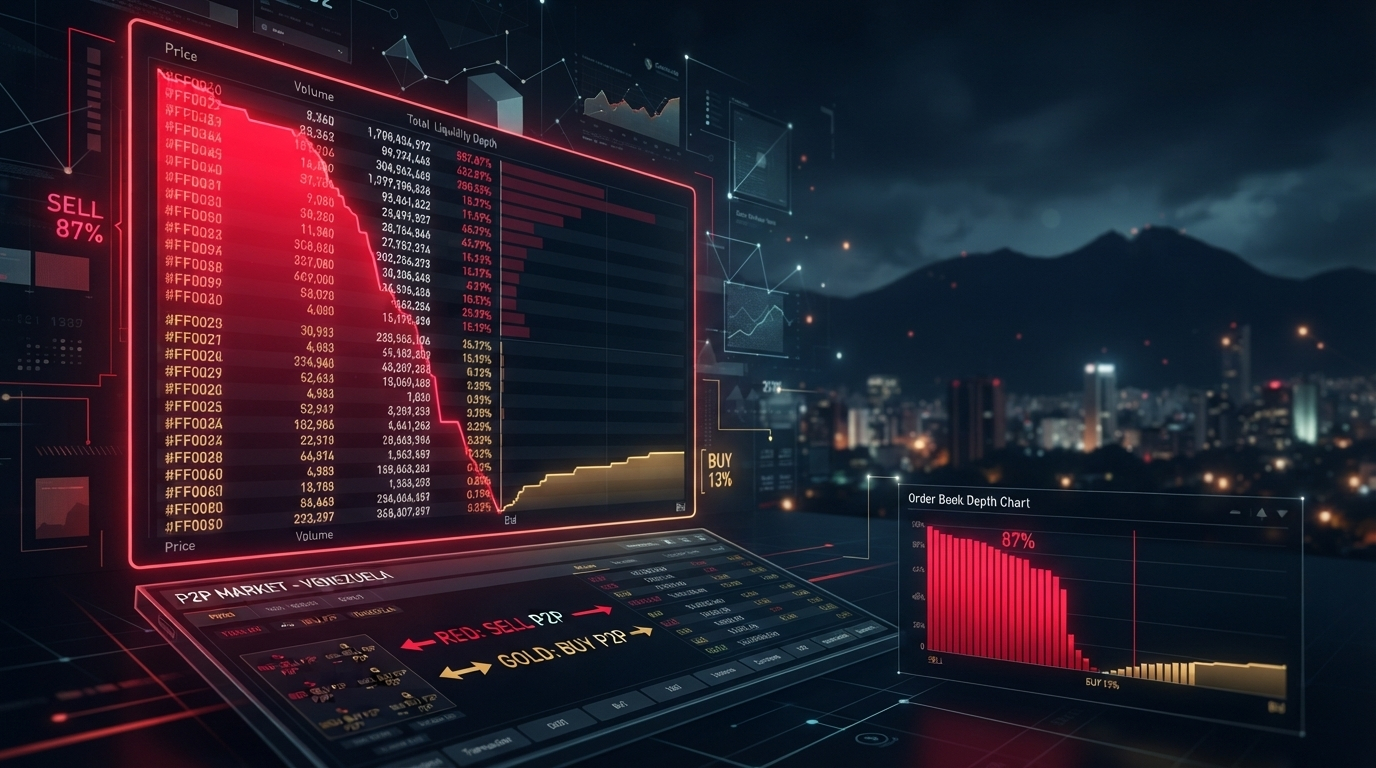
Desequilibrio del 87% en P2P: Radiografía del order book y liquidez en bancosA simple vista, el mercado entre pares (P2P) de USDT/VES en Venezuela refleja un volumen constante y suficiente presencia de anuncios activos en las principales plataformas como Binance, otras plataformas y otras plataformas. Sin embargo, al inspeccionar las capas internas del libro de órdenes ( order book ), los datos en tiempo real revelan una asimetría estructural: existe una desproporción marcada entre la liquidez acumulada en la compra y la profundidad disponible en la venta. De acuerdo con el monitoreo de Radar P2P capturado este 7 de septiembre de 2026, el desequilibrio de profundidad ( imbalance ) se ubica en 87,03% . Mientras el volumen de compra acumulado en los libros de posturas suma 862.774,20 USDT en 42 órdenes abiertas, el volumen de venta apenas alcanza 59.823,29 USDT distribuidos en 40 ofertas. Esta diferencia condiciona la velocidad de ejecución y la fricción de precios que enfrentan los usuarios según el lado del mercado en el que operen. La ilusión de liquidez: Radiografía del libro de órdenes USDT/VES Un error frecuente al evaluar el P2P venezolano es asumir que un recuento alto de comerciantes activos equivale a una liquidez balanceada en ambos sentidos. El análisis granular de los niveles de postura desmiente esta premisa: Volumen comprador dominante: La demanda por convertir bolívares en activos digitales concentra el 93,5% del capital total visible en las puntas analizadas (862.774,20 USDT), con muros significativos como el nivel de 965,00 VES (374.997,34 USDT en 5 órdenes) y 967,00 VES (78.080,98 USDT). Venta atomizada y superficial: Las posturas para vender USDT y obtener bolívares suman menos de 60.000 USDT en total. Las órdenes individuales en los primeros niveles oscilan entre 50 y 1.500 USDT, lo que significa que colocaciones medianas o grandes pueden consumir rápidamente las cotizaciones más competitivas y generar deslizamiento ( slippage ). Señales del semáforo de mercado: El indicador de PitbullChain marca un puntaje de 69/100 (estado amarillo / precaución moderada) . Aunque el puntaje de disponibilidad bancaria (95) y liquidez general (95) es sólido, la métrica de profundidad cae a 45/100 y el spread score a 20/100 , confirmando la estrechez del libro de venta. Spread real y prima cambiaria frente a la tasa oficial El precio promedio de compra P2P se sitúa en 968,54 VES por dólar digital, mientras que la tasa de venta promedio desciende a 941,17 VES . Esta brecha genera un spread bruto de 27,37 VES (2,91%) en el consolidado general de Radar P2P, aunque dentro de los libros competitivos entre el mejor bid (972,90 VES) y mejor ask (949,44 VES) el spread directo ronda los 23,46 VES (2,41%). Al contrastar estos valores con el tipo de cambio del Banco Central de Venezuela (BCV), fijado en 813,74 VES , el sobreprecio o premium del mercado P2P se establece en 19,02% . Por su parte, la referencia del dólar paralelo reporta 965,97 VES con un spread más comprimido de 0,45% (compra en 968,14 VES vs. venta en 963,80 VES). La distancia de casi 155 bolívares por dólar entre el BCV y el ecosistema P2P mantiene una presión constante sobre la demanda de divisas sintéticas en bolívares. Desempeño por entidad financiera: ¿Dónde se ejecuta con menor fricción? El canal bancario utilizado determina tanto la disponibilidad de contrapartes como el diferencial de precio. Los datos registrados muestran una fragmentación clara en las condiciones de cada pasarela: Pago Móvil (Líder en volumen): Agrupa el 22,1% de la liquidez total con 27 anuncios activos. Presenta un precio promedio de compra de 966,74 VES y venta en 962,79 VES, con un spread estrecho de 3,95 VES (0,41%) y un puntaje de ejecución de 89/100. Banesco (Mayor puntaje global): Capta el 19,7% de la liquidez con 24 anuncios. Su precio de compra promedio marca 967,91 VES frente a 962,70 VES de venta, arrojando un spread de 5,21 VES (0,54%) y el mejor balance general (score 93/100). Banco de Venezuela: Concentra el 13,9% de la liquidez con 17 anuncios. Registra compra promedio en 968,04 VES y venta en 964,64 VES, logrando uno de los spreads más reducidos del sistema: 3,39 VES (0,35%) . Bancamiga: Aunque aporta una cuota menor de liquidez (4,9% y 6 anuncios), ofrece el diferencial más bajo entre compra (967,39 VES) y venta (965,61 VES), con apenas 1,78 VES (0,18%) de spread. Mercantil y PagoMovil directo: Exhiben cotizaciones de compra activas (967,56 VES y 967,25 VES respectivamente), pero con ausencia de posturas de venta directas en el muestreo principal, reflejando liquidez unilateral. Cálculos prácticos de conversión inmediata Para dimensionar el impacto de estos niveles en las operaciones cotidianas: Liquidación de 100 USDT a bolívares: A la tasa de venta efectiva de 941,1685 VES, el usuario recibe 94.116,85 VES . En caso de acceder a libros competitivos en Banesco o Banco de Venezuela en torno a 964,50 VES, el retorno efectivo asciende a aproximadamente 96.450,00 VES. Adquisición de USDT con 1.000.000 VES: Tomando la tasa de compra referencial de 941,17 VES, un millón de bolívares rinde 1.062,51 USDT en el extremo vendedor, mientras que a la tasa tomadora de 968,54 VES el monto disminuye a 1.032,48 USDT. Consideraciones operativas para usuarios P2P Ante un escenario de asimetría del 87% y spread elevado en el mercado general, los participantes deben priorizar la gestión de ejecución antes de abrir órdenes: Filtrar por canal bancario específico: Operar a través de métodos con spreads inferiores al 0,50% (como Bancamiga, Banco de Venezuela o Pago Móvil) reduce significativamente la pérdida por fricción frente al promedio general del 2,91%. Revisar los límites mínimos y máximos: La profundidad vendedora está fragmentada. Al vender montos superiores a 500 USDT, es indispensable verificar si el comerciante cubre el monto total o si dividirá la orden entre varios tramos. Monitorear la prima cambiaria: Con una brecha de 19,02% sobre el dólar oficial, las variaciones en la intervención cambiaria del BCV o ajustes de liquidez bancaria pueden alterar con rapidez las tasas en Binance y otras plataformas.
📊 Tasas y análisis en vivo en pitbullchain.com
$USDT #orderbook #profundidad #liquidez #USDT #VES
Desequilibrio del 87% en P2P: Radiografía del order book y liquidez en bancos
A simple vista, el mercado entre pares (P2P) de USDT/VES en Venezuela refleja un volumen constante y suficiente presencia de anuncios activos en las principales plataformas como Binance, otras plataformas y otras plataformas. Sin embargo, al inspeccionar las capas internas del libro de órdenes ( order book ), los datos en tiempo real revelan una asimetría estructural: existe una desproporción marcada entre la liquidez acumulada en la compra y la profundidad disponible en la venta. De acuerdo con el monitoreo de Radar P2P capturado este 7 de septiembre de 2026, el desequilibrio de profundidad ( imbalance ) se ubica en 87,03% . Mientras el volumen de compra acumulado en los libros de posturas suma 862.774,20 USDT en 42 órdenes abiertas, el volumen de venta apenas alcanza 59.823,29 USDT distribuidos en 40 ofertas. Esta diferencia condiciona la velocidad de ejecución y la fricción de precios que enfrentan los usuarios según el lado del mercado en el que operen. La ilusión de liquidez: Radiografía del libro de órdenes USDT/VES Un error frecuente al evaluar el P2P venezolano es asumir que un recuento alto de comerciantes activos equivale a una liquidez balanceada en ambos sentidos. El análisis granular de los niveles de postura desmiente esta premisa: Volumen comprador dominante: La demanda por convertir bolívares en activos digitales concentra el 93,5% del capital total visible en las puntas analizadas (862.774,20 USDT), con muros significativos como el nivel de 965,00 VES (374.997,34 USDT en 5 órdenes) y 967,00 VES (78.080,98 USDT). Venta atomizada y superficial: Las posturas para vender USDT y obtener bolívares suman menos de 60.000 USDT en total. Las órdenes individuales en los primeros niveles oscilan entre 50 y 1.500 USDT, lo que significa que colocaciones medianas o grandes pueden consumir rápidamente las cotizaciones más competitivas y generar deslizamiento ( slippage ). Señales del semáforo de mercado: El indicador de PitbullChain marca un puntaje de 69/100 (estado amarillo / precaución moderada) . Aunque el puntaje de disponibilidad bancaria (95) y liquidez general (95) es sólido, la métrica de profundidad cae a 45/100 y el spread score a 20/100 , confirmando la estrechez del libro de venta. Spread real y prima cambiaria frente a la tasa oficial El precio promedio de compra P2P se sitúa en 968,54 VES por dólar digital, mientras que la tasa de venta promedio desciende a 941,17 VES . Esta brecha genera un spread bruto de 27,37 VES (2,91%) en el consolidado general de Radar P2P, aunque dentro de los libros competitivos entre el mejor bid (972,90 VES) y mejor ask (949,44 VES) el spread directo ronda los 23,46 VES (2,41%). Al contrastar estos valores con el tipo de cambio del Banco Central de Venezuela (BCV), fijado en 813,74 VES , el sobreprecio o premium del mercado P2P se establece en 19,02% . Por su parte, la referencia del dólar paralelo reporta 965,97 VES con un spread más comprimido de 0,45% (compra en 968,14 VES vs. venta en 963,80 VES). La distancia de casi 155 bolívares por dólar entre el BCV y el ecosistema P2P mantiene una presión constante sobre la demanda de divisas sintéticas en bolívares. Desempeño por entidad financiera: ¿Dónde se ejecuta con menor fricción? El canal bancario utilizado determina tanto la disponibilidad de contrapartes como el diferencial de precio. Los datos registrados muestran una fragmentación clara en las condiciones de cada pasarela: Pago Móvil (Líder en volumen): Agrupa el 22,1% de la liquidez total con 27 anuncios activos. Presenta un precio promedio de compra de 966,74 VES y venta en 962,79 VES, con un spread estrecho de 3,95 VES (0,41%) y un puntaje de ejecución de 89/100. Banesco (Mayor puntaje global): Capta el 19,7% de la liquidez con 24 anuncios. Su precio de compra promedio marca 967,91 VES frente a 962,70 VES de venta, arrojando un spread de 5,21 VES (0,54%) y el mejor balance general (score 93/100). Banco de Venezuela: Concentra el 13,9% de la liquidez con 17 anuncios. Registra compra promedio en 968,04 VES y venta en 964,64 VES, logrando uno de los spreads más reducidos del sistema: 3,39 VES (0,35%) . Bancamiga: Aunque aporta una cuota menor de liquidez (4,9% y 6 anuncios), ofrece el diferencial más bajo entre compra (967,39 VES) y venta (965,61 VES), con apenas 1,78 VES (0,18%) de spread. Mercantil y PagoMovil directo: Exhiben cotizaciones de compra activas (967,56 VES y 967,25 VES respectivamente), pero con ausencia de posturas de venta directas en el muestreo principal, reflejando liquidez unilateral. Cálculos prácticos de conversión inmediata Para dimensionar el impacto de estos niveles en las operaciones cotidianas: Liquidación de 100 USDT a bolívares: A la tasa de venta efectiva de 941,1685 VES, el usuario recibe 94.116,85 VES . En caso de acceder a libros competitivos en Banesco o Banco de Venezuela en torno a 964,50 VES, el retorno efectivo asciende a aproximadamente 96.450,00 VES. Adquisición de USDT con 1.000.000 VES: Tomando la tasa de compra referencial de 941,17 VES, un millón de bolívares rinde 1.062,51 USDT en el extremo vendedor, mientras que a la tasa tomadora de 968,54 VES el monto disminuye a 1.032,48 USDT. Consideraciones operativas para usuarios P2P Ante un escenario de asimetría del 87% y spread elevado en el mercado general, los participantes deben priorizar la gestión de ejecución antes de abrir órdenes: Filtrar por canal bancario específico: Operar a través de métodos con spreads inferiores al 0,50% (como Bancamiga, Banco de Venezuela o Pago Móvil) reduce significativamente la pérdida por fricción frente al promedio general del 2,91%. Revisar los límites mínimos y máximos: La profundidad vendedora está fragmentada. Al vender montos superiores a 500 USDT, es indispensable verificar si el comerciante cubre el monto total o si dividirá la orden entre varios tramos. Monitorear la prima cambiaria: Con una brecha de 19,02% sobre el dólar oficial, las variaciones en la intervención cambiaria del BCV o ajustes de liquidez bancaria pueden alterar con rapidez las tasas en Binance y otras plataformas.

📊 Tasas y análisis en vivo en pitbullchain.com
$USDT #orderbook #profundidad #liquidez #USDT #VES

📊 Tasas y análisis en vivo en pitbullchain.com
$USDT #orderbook #profundidad #liquidez #USDT #VES
10

·
--
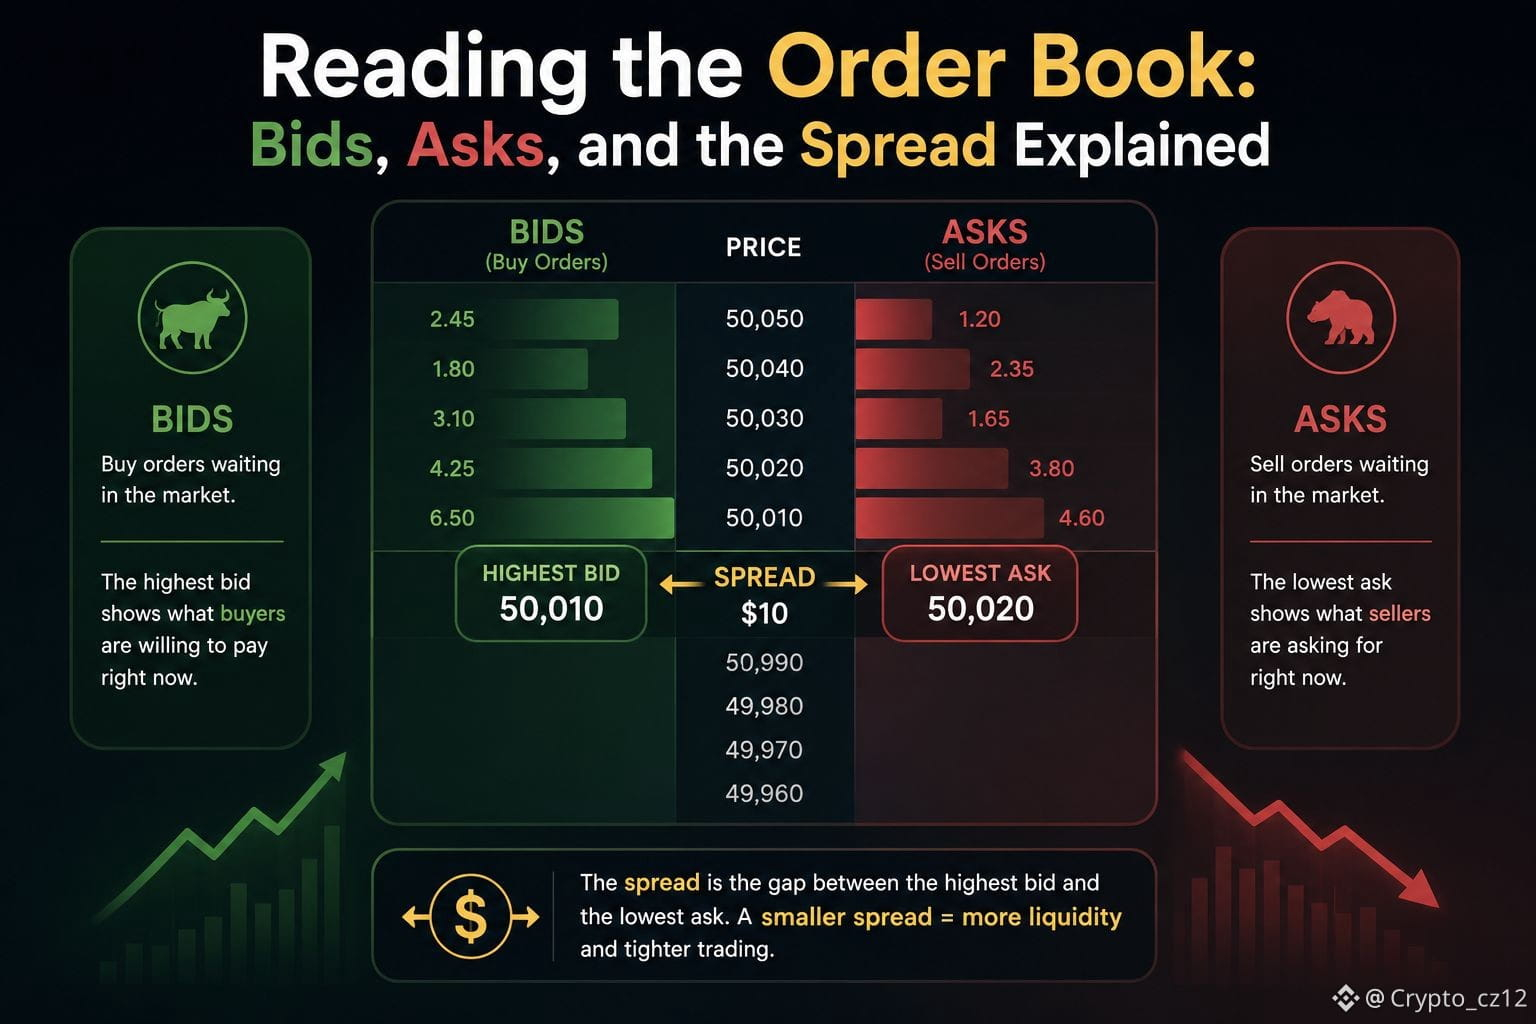
Leyendo el libro de órdenes: ofertas, demandas y el spread explicado
Bids = órdenes de compra por debajo del precio, asks = órdenes de venta por encima; el spread/la profundidad muestran liquidez real antes de que hagas clic en comprar
#OrderBook #TradingBasics
$SOL $ETH
{future}(ETHUSDT)
{future}(SOLUSDT)
Leyendo el libro de órdenes: ofertas, demandas y el spread explicado
Bids = órdenes de compra por debajo del precio, asks = órdenes de venta por encima; el spread/la profundidad muestran liquidez real antes de que hagas clic en comprar
#OrderBook #TradingBasics
$SOL $ETH
Bids = órdenes de compra por debajo del precio, asks = órdenes de venta por encima; el spread/la profundidad muestran liquidez real antes de que hagas clic en comprar
#OrderBook #TradingBasics
$SOL $ETH
62

Comprender la liquidez y el libro de órdenes
📊 Comprender el libro de órdenes (Order Book) para ejecutar mejores transacciones
El libro de órdenes es el mapa en tiempo real de la liquidez en un mercado. Reúne todas las órdenes de compra (Bids) y de venta (Asks).
💡 Lo que hay que observar:
Los muros de órdenes (Buy/Sell Walls): Bloques importantes de órdenes concentradas a un nivel de precio específico. Pueden servir como soportes o resistencias psicológicas temporales.
El Spread: La diferencia entre el precio más alto de compra y el más bajo de venta. Un spread estrecho indica una excelente liquidez.
Orden Limit vs Orden Market: Prefiera las órdenes Limit para controlar con precisión su precio de ejecución y reducir el slippage.
Observar la profundidad del libro de órdenes permite anticipar las zonas de fricción del mercado.
#OrderBook #Liquidity #TradingEducation #BinanceSquare #SpotTrading @Square-Creator-e2b3a3399b3d
Comprender la liquidez y el libro de órdenes
📊 Comprender el libro de órdenes (Order Book) para ejecutar mejores transacciones
El libro de órdenes es el mapa en tiempo real de la liquidez en un mercado. Reúne todas las órdenes de compra (Bids) y de venta (Asks).
💡 Lo que hay que observar:
Los muros de órdenes (Buy/Sell Walls): Bloques importantes de órdenes concentradas a un nivel de precio específico. Pueden servir como soportes o resistencias psicológicas temporales.
El Spread: La diferencia entre el precio más alto de compra y el más bajo de venta. Un spread estrecho indica una excelente liquidez.
Orden Limit vs Orden Market: Prefiera las órdenes Limit para controlar con precisión su precio de ejecución y reducir el slippage.
Observar la profundidad del libro de órdenes permite anticipar las zonas de fricción del mercado.
#OrderBook #Liquidity #TradingEducation #BinanceSquare #SpotTrading @ ACE
📊 Comprender el libro de órdenes (Order Book) para ejecutar mejores transacciones
El libro de órdenes es el mapa en tiempo real de la liquidez en un mercado. Reúne todas las órdenes de compra (Bids) y de venta (Asks).
💡 Lo que hay que observar:
Los muros de órdenes (Buy/Sell Walls): Bloques importantes de órdenes concentradas a un nivel de precio específico. Pueden servir como soportes o resistencias psicológicas temporales.
El Spread: La diferencia entre el precio más alto de compra y el más bajo de venta. Un spread estrecho indica una excelente liquidez.
Orden Limit vs Orden Market: Prefiera las órdenes Limit para controlar con precisión su precio de ejecución y reducir el slippage.
Observar la profundidad del libro de órdenes permite anticipar las zonas de fricción del mercado.
#OrderBook #Liquidity #TradingEducation #BinanceSquare #SpotTrading @ ACE
49

·
--
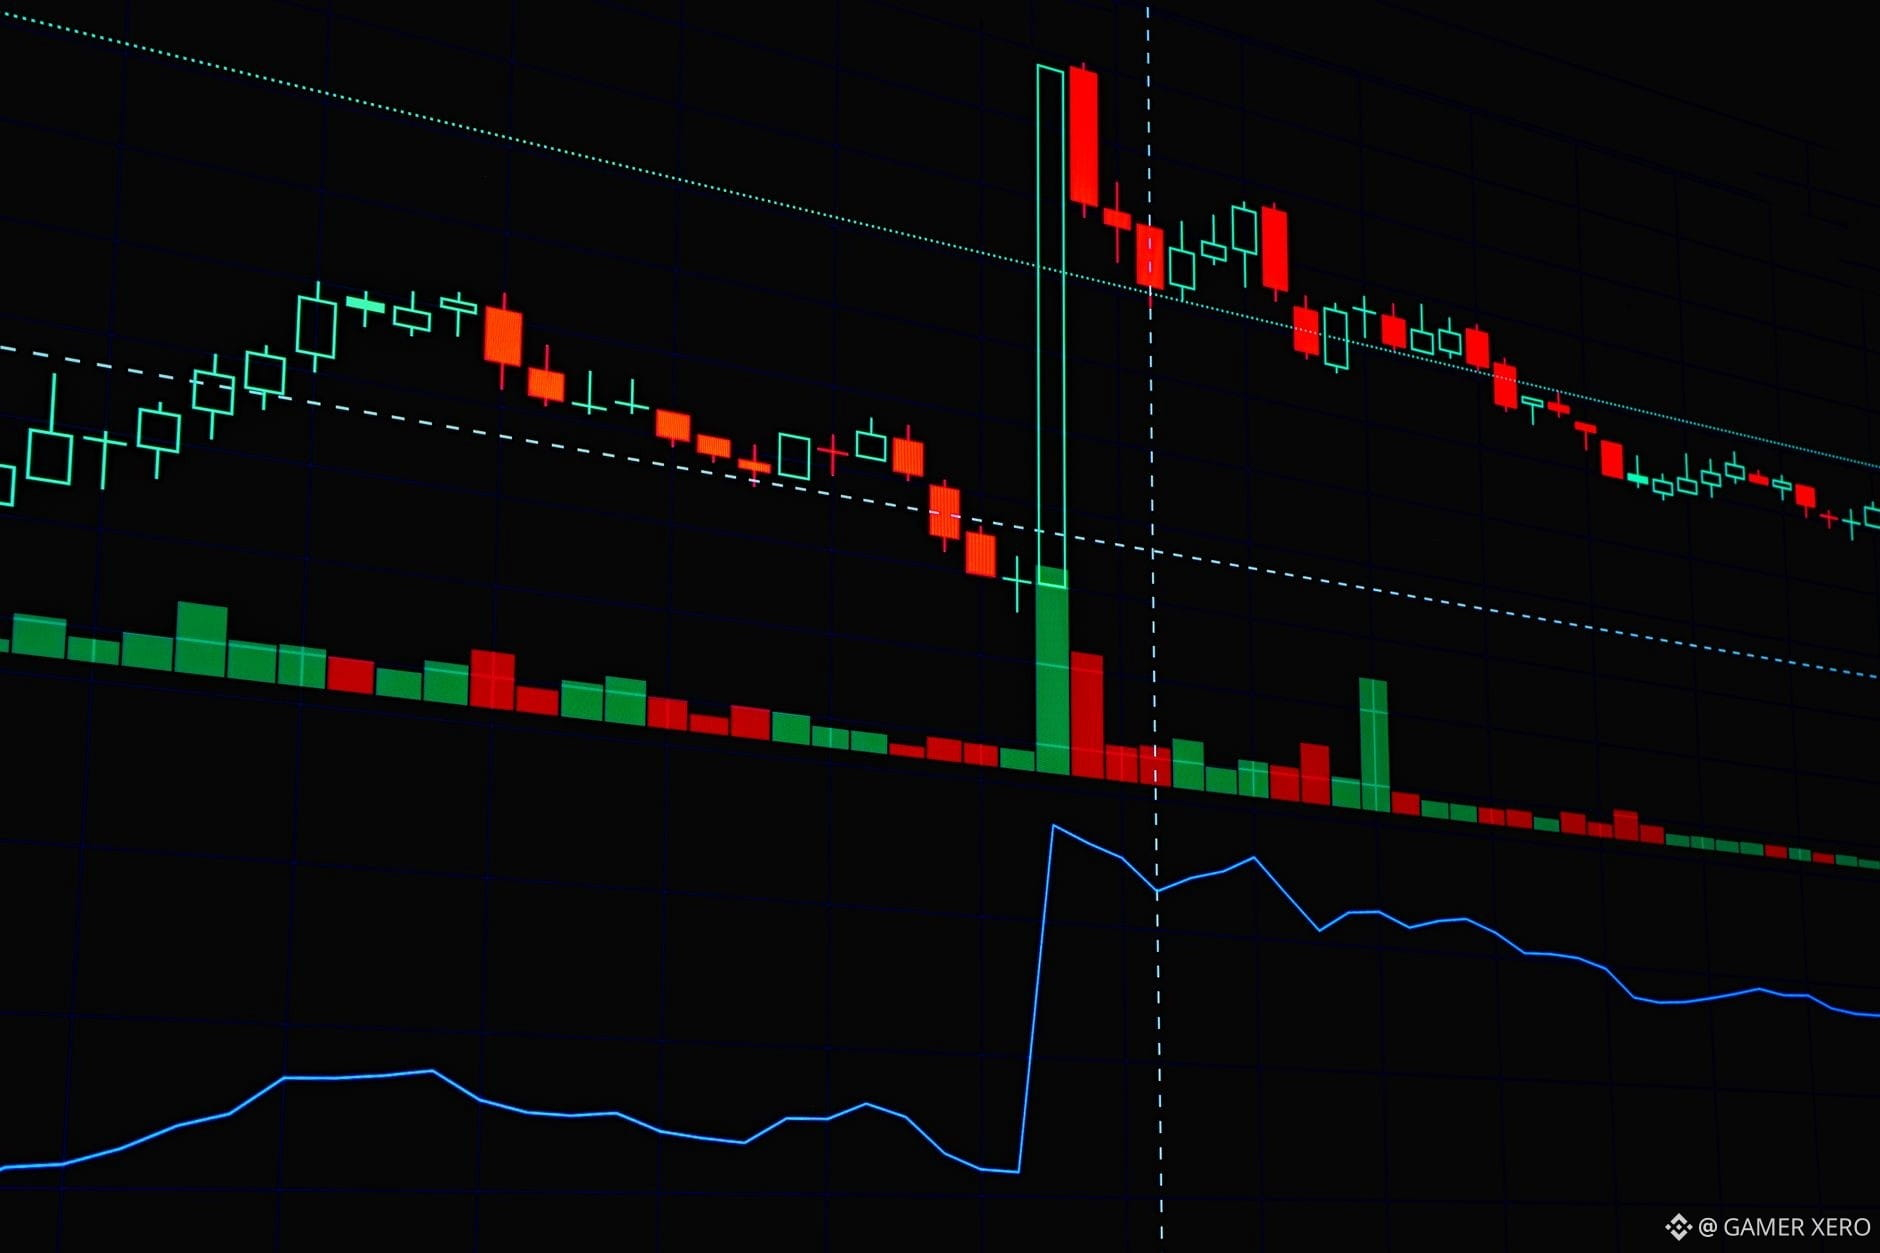
Ver $BTC sit en $79,437 mientras la banda de 24 horas se estrecha entre $79,001 y $80,560 me indica que la paciencia del mercado está siendo puesta a prueba. Una forma de interpretar esa paciencia es la métrica de desequilibrio del libro de órdenes. Binance Spot muestra el volumen total de compra frente al volumen de venta en cada nivel de precio; un desequilibrio simple = (Compra – Venta) / (Compra + Venta). Cuando el valor es positivo, domina la presión compradora; una lectura negativa señala que los vendedores tienen el control.
Ahora mismo, el 5 % superior del libro para $BTC tiene aproximadamente $12 M en el lado de compra y $10 M en el lado de venta, lo que da un desequilibrio de +0.09. Esa leve inclinación alcista coincide con el precio flotando justo por encima de la mitad inferior de su rango. Si el desequilibrio cambia a –0.1, esperarías que el precio derivara hacia el límite inferior, lo que llevaría a controles de riesgo más estrictos.
Aplicando la misma lente a $ETH, el desequilibrio se sitúa cerca de cero, reflejando su movimiento plano de 24 horas. Supervisar estos cambios en tiempo real puede ayudarte a decidir cuándo ajustar los stops o añadir a una posición sin perseguir el precio.
¿Cómo incorporas el desequilibrio del libro de órdenes en tu propia rutina? #CryptoEducation #BinanceTips #OrderBook #GAMERXERO
Ver $BTC sit en $79,437 mientras la banda de 24 horas se estrecha entre $79,001 y $80,560 me indica que la paciencia del mercado está siendo puesta a prueba. Una forma de interpretar esa paciencia es la métrica de desequilibrio del libro de órdenes. Binance Spot muestra el volumen total de compra frente al volumen de venta en cada nivel de precio; un desequilibrio simple = (Compra – Venta) / (Compra + Venta). Cuando el valor es positivo, domina la presión compradora; una lectura negativa señala que los vendedores tienen el control.
Ahora mismo, el 5 % superior del libro para $BTC tiene aproximadamente $12 M en el lado de compra y $10 M en el lado de venta, lo que da un desequilibrio de +0.09. Esa leve inclinación alcista coincide con el precio flotando justo por encima de la mitad inferior de su rango. Si el desequilibrio cambia a –0.1, esperarías que el precio derivara hacia el límite inferior, lo que llevaría a controles de riesgo más estrictos.
Aplicando la misma lente a $ETH , el desequilibrio se sitúa cerca de cero, reflejando su movimiento plano de 24 horas. Supervisar estos cambios en tiempo real puede ayudarte a decidir cuándo ajustar los stops o añadir a una posición sin perseguir el precio.
¿Cómo incorporas el desequilibrio del libro de órdenes en tu propia rutina? #CryptoEducation #BinanceTips #OrderBook #GAMERXERO
Ahora mismo, el 5 % superior del libro para $BTC tiene aproximadamente $12 M en el lado de compra y $10 M en el lado de venta, lo que da un desequilibrio de +0.09. Esa leve inclinación alcista coincide con el precio flotando justo por encima de la mitad inferior de su rango. Si el desequilibrio cambia a –0.1, esperarías que el precio derivara hacia el límite inferior, lo que llevaría a controles de riesgo más estrictos.
Aplicando la misma lente a $ETH , el desequilibrio se sitúa cerca de cero, reflejando su movimiento plano de 24 horas. Supervisar estos cambios en tiempo real puede ayudarte a decidir cuándo ajustar los stops o añadir a una posición sin perseguir el precio.
¿Cómo incorporas el desequilibrio del libro de órdenes en tu propia rutina? #CryptoEducation #BinanceTips #OrderBook #GAMERXERO
25
·
--
Artículo
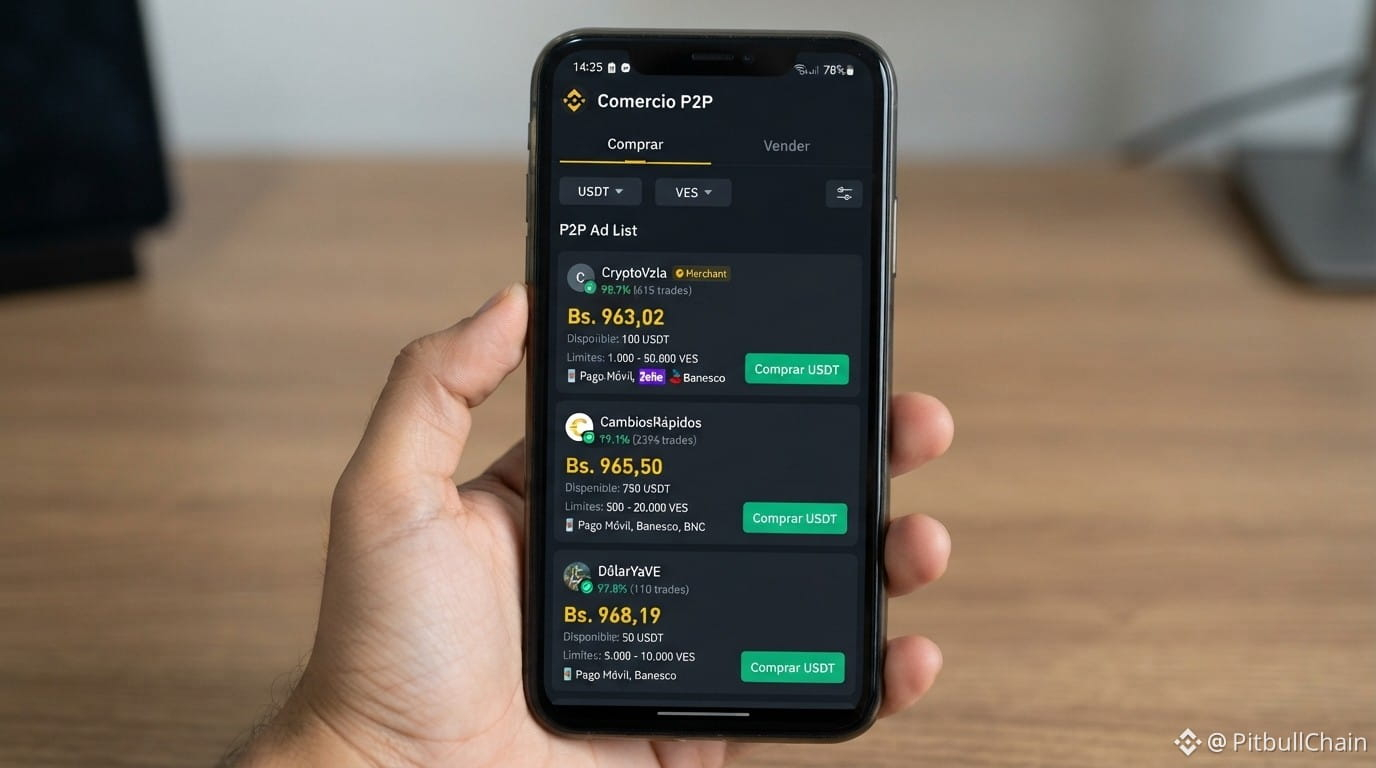
Cómo Usar el Order Book P2P para Evitar Sobreprecios al Comprar USDTAdquirir stablecoins en el mercado peer-to-peer (P2P) venezolano exige ir más allá de tomar la primera oferta visible en la aplicación. La dispersión de cotizaciones, la prima frente a la tasa oficial del Banco Central de Venezuela (BCV) y las variaciones de liquidez entre métodos de pago pueden encarecer significativamente cada transacción. Para el 6 de septiembre de 2026, con una tasa oficial BCV de 813,74 VES y un mercado P2P cuyo rango de compra alcanza picos de 982,30 VES (una prima de 20,72%), examinar el Order Book o libro de órdenes consolidado es la herramienta fundamental para no pagar bolívares de más. 1. Anatomía del Order Book P2P: Asks, Bids y Spread Real El libro de órdenes consolida en tiempo real todas las intenciones de compra ( Bids ) y de venta ( Asks ) disponibles en las distintas plataformas de intercambio: Asks (Venta de USDT / Lo que pagas al comprar): Representan las ofertas de comerciantes dispuestos a entregarte USDT a cambio de tus bolívares. Según el registro en vivo, la mejor postura de venta se sitúa en 960,00 VES en otras plataformas (390,82 USDT disponibles) y en 960,88 VES en Binance (5.833,58 USDT acumulados entre Mercantil y Banesco). Bids (Compra de USDT / Lo que recibes al vender): Representan la demanda de usuarios que compran USDT entregando bolívares, encabezada por una postura de 955,31 VES para Mercantil en Binance con 16.950,60 USDT. Spread directo del libro: La brecha inmediata entre el mejor ask (960,00 VES) y el mejor bid (955,31 VES) es de apenas 4,69 VES (0,49%). Sin embargo, si un usuario compra sin revisar la profundidad y cae en anuncios dispersos o tasas indicativas de 982,30 VES, termina asumiendo un diferencial de hasta 5,90%, pagando un sobreprecio evitable. 2. Comparativa Multiexchange: Binance vs. otras plataformas vs. otras plataformas La distribución de la liquidez no es homogénea entre exchanges. Analizar la profundidad por plataforma permite seleccionar dónde colocar o tomar una orden según el volumen requerido: Binance P2P: Concentra el mayor volumen institucional y comercial. En los niveles entre 960,88 y 963,90 VES, acumula bloques masivos superiores a 13.000 y 20.000 USDT por nivel, especialmente para Banesco, Banco de Venezuela y Mercantil. otras plataformas: Ofrece puntos de entrada competitivos en la punta compradora (desde 960,00 VES), pero con tamaños de orden más reducidos en los primeros peldaños (órdenes de 390,82 USDT o 127,85 USDT), extendiéndose hacia niveles superiores como 969,90 VES para montos medianos (6.700,80 USDT). otras plataformas: Registra posturas más elevadas y menor profundidad en bolívares, con ofertas que inician en 964,11 VES por volúmenes limitados (60,33 USDT) y 967,34 VES (50,00 USDT), haciéndolo menos eficiente para compras directas de volumen. 3. Liquidez Bancaria: Cómo Seleccionar el Método de Pago Más Eficiente El precio que pagas por USDT en Venezuela depende directamente de la entidad financiera utilizada. Los datos del comparador reflejan diferencias marcadas en precio promedio y fricción operativa: Banco de Venezuela: Presenta una de las estructuras más ajustadas, con un precio promedio de compra de 962,84 VES y venta de 953,60 VES, generando un spread de solo 0,97% y concentrando el 12,4% de la liquidez total. Mercantil: Ofrece el spread más estrecho entre la banca privada principal (0,82%), con precio promedio de compra en 963,17 VES y venta en 955,31 VES, aunque con una cuota de liquidez menor (4,4%). Banesco: Lidera la banca privada en volumen (17,5% de liquidez y 24 anuncios activos), con un precio promedio de compra de 965,42 VES y un spread de 2,47%. Pago Móvil: Pese a tener la mayor cantidad de ofertas (19% de liquidez), suele castigar el precio con un promedio de compra más alto de 970,30 VES y un spread del 2,94%, debido a la inmediatez y alta rotación de microtransacciones. 4. Interpretación del Semáforo en Amarillo: Estrategia Paso a Paso El Radar P2P califica las condiciones del mercado con una puntuación de 69/100 (Estado Amarillo: Precaución moderada) . Este diagnóstico se debe a que la liquidez global es sólida (puntuación de liquidez de 95/100 con 576.444,81 USDT en volumen comprador y 155.668,14 USDT en vendedor), pero el spread general del mercado presenta distorsiones (puntuación de spread de 20/100) causadas por anuncios atípicos. Para ejecutar compras seguras y eficientes bajo estas condiciones, sigue este procedimiento: Consulta el Order Book consolidado: Identifica el nivel del Best Ask (actualmente en torno a 960,00 - 961,50 VES) y descarta cualquier oferta por encima del percentil medio (963,00 VES). Filtra por tu banco de preferencia: Si dispones de cuentas en Banco de Venezuela o Mercantil, prioriza transferencias directas sobre Pago Móvil para ahorrar entre 4 y 8 bolívares por cada USDT adquirido. Verifica límites mínimos y máximos: Comprueba que el volumen de la orden coincida con el rango del comerciante. En los primeros niveles de Binance, los límites mínimos van desde 100 hasta 1.800 USDT equivalentes en VES. Evalúa la reputación del comerciante: Asegúrate de que la contraparte cuente con una tasa de finalización superior al 98% y un historial verificado de operaciones recientes. Consideraciones Operativas y Gestión de Riesgo El mercado P2P venezolano refleja una presión compradora estructural frente a la divisa oficial, con un desequilibrio de profundidad del 57,47% a favor de la demanda. Utilizar el libro de órdenes permite aislar el ruido de precios artificiales, proteger el poder adquisitivo y ejecutar operaciones respaldadas por liquidez real y verificable.
📊 Tasas y análisis en vivo en pitbullchain.com
$USDT #OrderBook #spread #USDT #Venezuela #BinanceP2P
Cómo Usar el Order Book P2P para Evitar Sobreprecios al Comprar USDT
Adquirir stablecoins en el mercado peer-to-peer (P2P) venezolano exige ir más allá de tomar la primera oferta visible en la aplicación. La dispersión de cotizaciones, la prima frente a la tasa oficial del Banco Central de Venezuela (BCV) y las variaciones de liquidez entre métodos de pago pueden encarecer significativamente cada transacción. Para el 6 de septiembre de 2026, con una tasa oficial BCV de 813,74 VES y un mercado P2P cuyo rango de compra alcanza picos de 982,30 VES (una prima de 20,72%), examinar el Order Book o libro de órdenes consolidado es la herramienta fundamental para no pagar bolívares de más. 1. Anatomía del Order Book P2P: Asks, Bids y Spread Real El libro de órdenes consolida en tiempo real todas las intenciones de compra ( Bids ) y de venta ( Asks ) disponibles en las distintas plataformas de intercambio: Asks (Venta de USDT / Lo que pagas al comprar): Representan las ofertas de comerciantes dispuestos a entregarte USDT a cambio de tus bolívares. Según el registro en vivo, la mejor postura de venta se sitúa en 960,00 VES en otras plataformas (390,82 USDT disponibles) y en 960,88 VES en Binance (5.833,58 USDT acumulados entre Mercantil y Banesco). Bids (Compra de USDT / Lo que recibes al vender): Representan la demanda de usuarios que compran USDT entregando bolívares, encabezada por una postura de 955,31 VES para Mercantil en Binance con 16.950,60 USDT. Spread directo del libro: La brecha inmediata entre el mejor ask (960,00 VES) y el mejor bid (955,31 VES) es de apenas 4,69 VES (0,49%). Sin embargo, si un usuario compra sin revisar la profundidad y cae en anuncios dispersos o tasas indicativas de 982,30 VES, termina asumiendo un diferencial de hasta 5,90%, pagando un sobreprecio evitable. 2. Comparativa Multiexchange: Binance vs. otras plataformas vs. otras plataformas La distribución de la liquidez no es homogénea entre exchanges. Analizar la profundidad por plataforma permite seleccionar dónde colocar o tomar una orden según el volumen requerido: Binance P2P: Concentra el mayor volumen institucional y comercial. En los niveles entre 960,88 y 963,90 VES, acumula bloques masivos superiores a 13.000 y 20.000 USDT por nivel, especialmente para Banesco, Banco de Venezuela y Mercantil. otras plataformas: Ofrece puntos de entrada competitivos en la punta compradora (desde 960,00 VES), pero con tamaños de orden más reducidos en los primeros peldaños (órdenes de 390,82 USDT o 127,85 USDT), extendiéndose hacia niveles superiores como 969,90 VES para montos medianos (6.700,80 USDT). otras plataformas: Registra posturas más elevadas y menor profundidad en bolívares, con ofertas que inician en 964,11 VES por volúmenes limitados (60,33 USDT) y 967,34 VES (50,00 USDT), haciéndolo menos eficiente para compras directas de volumen. 3. Liquidez Bancaria: Cómo Seleccionar el Método de Pago Más Eficiente El precio que pagas por USDT en Venezuela depende directamente de la entidad financiera utilizada. Los datos del comparador reflejan diferencias marcadas en precio promedio y fricción operativa: Banco de Venezuela: Presenta una de las estructuras más ajustadas, con un precio promedio de compra de 962,84 VES y venta de 953,60 VES, generando un spread de solo 0,97% y concentrando el 12,4% de la liquidez total. Mercantil: Ofrece el spread más estrecho entre la banca privada principal (0,82%), con precio promedio de compra en 963,17 VES y venta en 955,31 VES, aunque con una cuota de liquidez menor (4,4%). Banesco: Lidera la banca privada en volumen (17,5% de liquidez y 24 anuncios activos), con un precio promedio de compra de 965,42 VES y un spread de 2,47%. Pago Móvil: Pese a tener la mayor cantidad de ofertas (19% de liquidez), suele castigar el precio con un promedio de compra más alto de 970,30 VES y un spread del 2,94%, debido a la inmediatez y alta rotación de microtransacciones. 4. Interpretación del Semáforo en Amarillo: Estrategia Paso a Paso El Radar P2P califica las condiciones del mercado con una puntuación de 69/100 (Estado Amarillo: Precaución moderada) . Este diagnóstico se debe a que la liquidez global es sólida (puntuación de liquidez de 95/100 con 576.444,81 USDT en volumen comprador y 155.668,14 USDT en vendedor), pero el spread general del mercado presenta distorsiones (puntuación de spread de 20/100) causadas por anuncios atípicos. Para ejecutar compras seguras y eficientes bajo estas condiciones, sigue este procedimiento: Consulta el Order Book consolidado: Identifica el nivel del Best Ask (actualmente en torno a 960,00 - 961,50 VES) y descarta cualquier oferta por encima del percentil medio (963,00 VES). Filtra por tu banco de preferencia: Si dispones de cuentas en Banco de Venezuela o Mercantil, prioriza transferencias directas sobre Pago Móvil para ahorrar entre 4 y 8 bolívares por cada USDT adquirido. Verifica límites mínimos y máximos: Comprueba que el volumen de la orden coincida con el rango del comerciante. En los primeros niveles de Binance, los límites mínimos van desde 100 hasta 1.800 USDT equivalentes en VES. Evalúa la reputación del comerciante: Asegúrate de que la contraparte cuente con una tasa de finalización superior al 98% y un historial verificado de operaciones recientes. Consideraciones Operativas y Gestión de Riesgo El mercado P2P venezolano refleja una presión compradora estructural frente a la divisa oficial, con un desequilibrio de profundidad del 57,47% a favor de la demanda. Utilizar el libro de órdenes permite aislar el ruido de precios artificiales, proteger el poder adquisitivo y ejecutar operaciones respaldadas por liquidez real y verificable.

📊 Tasas y análisis en vivo en pitbullchain.com
$USDT #OrderBook #spread #USDT #Venezuela #BinanceP2P

📊 Tasas y análisis en vivo en pitbullchain.com
$USDT #OrderBook #spread #USDT #Venezuela #BinanceP2P
38

·
--
PUBLICACIÓN — ANÁLISIS DEL LIBRO DE ORDENES DE BTC
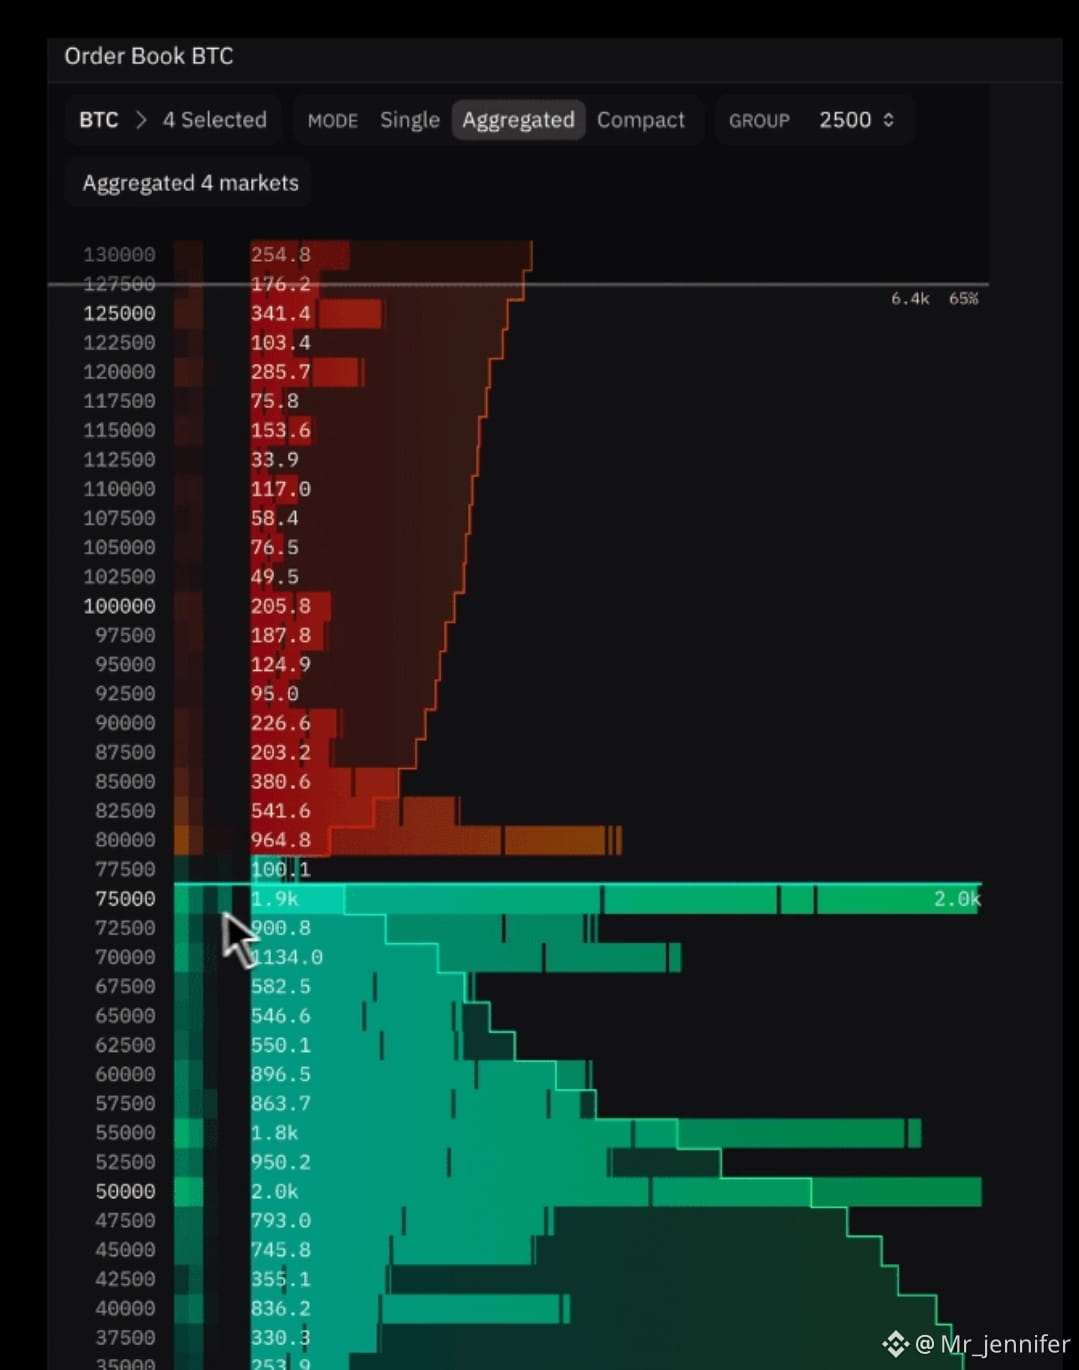
🚨 ALERTA DEL LIBRO DE ORDENES DE BTC 🚨
El libro de órdenes de Bitcoin está mostrando una fuerte liquidez alrededor de niveles clave de precio. 👀
🟢 Principal soporte de compra:
$80,000 — 541.6 BTC
$77,500 — 964.8 BTC
$75,000 — 1.9K BTC
🔴 Principal liquidez de venta:
$82,500 — 380.6 BTC
$85,000 — 203.2 BTC
$87,500 — 226.6 BTC
Las grandes órdenes de compra alrededor de $75K–$80K podrían proporcionar una zona de soporte importante, mientras que $82.5K–$87.5K sigue siendo un área a vigilar por presión de venta.
📈 Una fuerte ruptura por encima de la liquidez del lado vendedor podría fortalecer el impulso alcista.
¿Qué ves a continuación para BTC — $85K 🚀 o un retroceso 📉?
$BTC #Bitcoin #BTC #Crypto #Binance #Trading #orderbook #USWeeklyInitialJoblessClaimsRiseTo206000 #CLARITYActFacesDelaySenateLoses8VotingDays
PUBLICACIÓN — ANÁLISIS DEL LIBRO DE ORDENES DE BTC
🚨 ALERTA DEL LIBRO DE ORDENES DE BTC 🚨
El libro de órdenes de Bitcoin está mostrando una fuerte liquidez alrededor de niveles clave de precio. 👀
🟢 Principal soporte de compra:
$80,000 — 541.6 BTC
$77,500 — 964.8 BTC
$75,000 — 1.9K BTC
🔴 Principal liquidez de venta:
$82,500 — 380.6 BTC
$85,000 — 203.2 BTC
$87,500 — 226.6 BTC
Las grandes órdenes de compra alrededor de $75K–$80K podrían proporcionar una zona de soporte importante, mientras que $82.5K–$87.5K sigue siendo un área a vigilar por presión de venta.
📈 Una fuerte ruptura por encima de la liquidez del lado vendedor podría fortalecer el impulso alcista.
¿Qué ves a continuación para BTC — $85K 🚀 o un retroceso 📉?
$BTC #Bitcoin #BTC #Crypto #Binance #Trading #orderbook #USWeeklyInitialJoblessClaimsRiseTo206000 #CLARITYActFacesDelaySenateLoses8VotingDays
🚨 ALERTA DEL LIBRO DE ORDENES DE BTC 🚨
El libro de órdenes de Bitcoin está mostrando una fuerte liquidez alrededor de niveles clave de precio. 👀
🟢 Principal soporte de compra:
$80,000 — 541.6 BTC
$77,500 — 964.8 BTC
$75,000 — 1.9K BTC
🔴 Principal liquidez de venta:
$82,500 — 380.6 BTC
$85,000 — 203.2 BTC
$87,500 — 226.6 BTC
Las grandes órdenes de compra alrededor de $75K–$80K podrían proporcionar una zona de soporte importante, mientras que $82.5K–$87.5K sigue siendo un área a vigilar por presión de venta.
📈 Una fuerte ruptura por encima de la liquidez del lado vendedor podría fortalecer el impulso alcista.
¿Qué ves a continuación para BTC — $85K 🚀 o un retroceso 📉?
$BTC #Bitcoin #BTC #Crypto #Binance #Trading #orderbook #USWeeklyInitialJoblessClaimsRiseTo206000 #CLARITYActFacesDelaySenateLoses8VotingDays
28
·
--
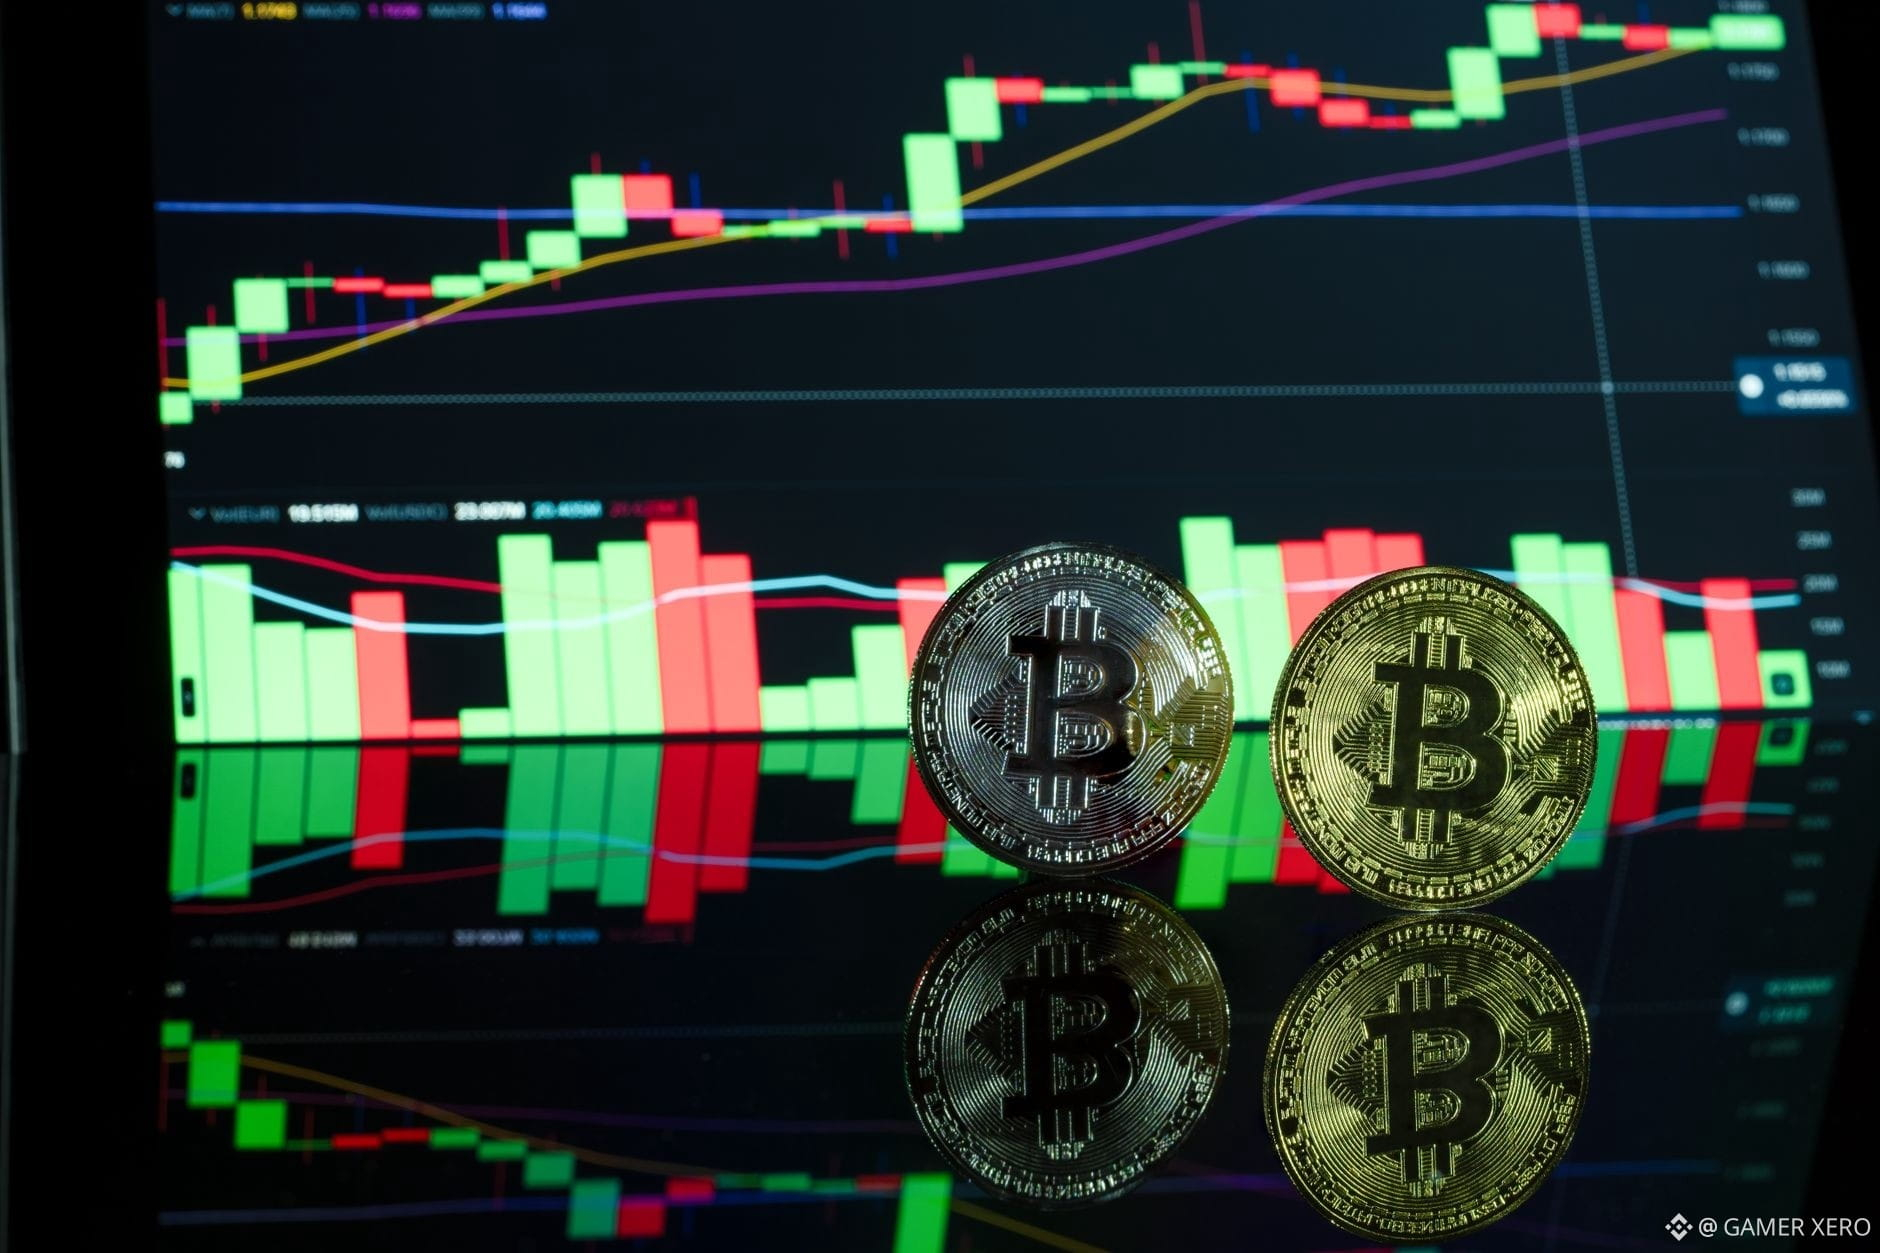
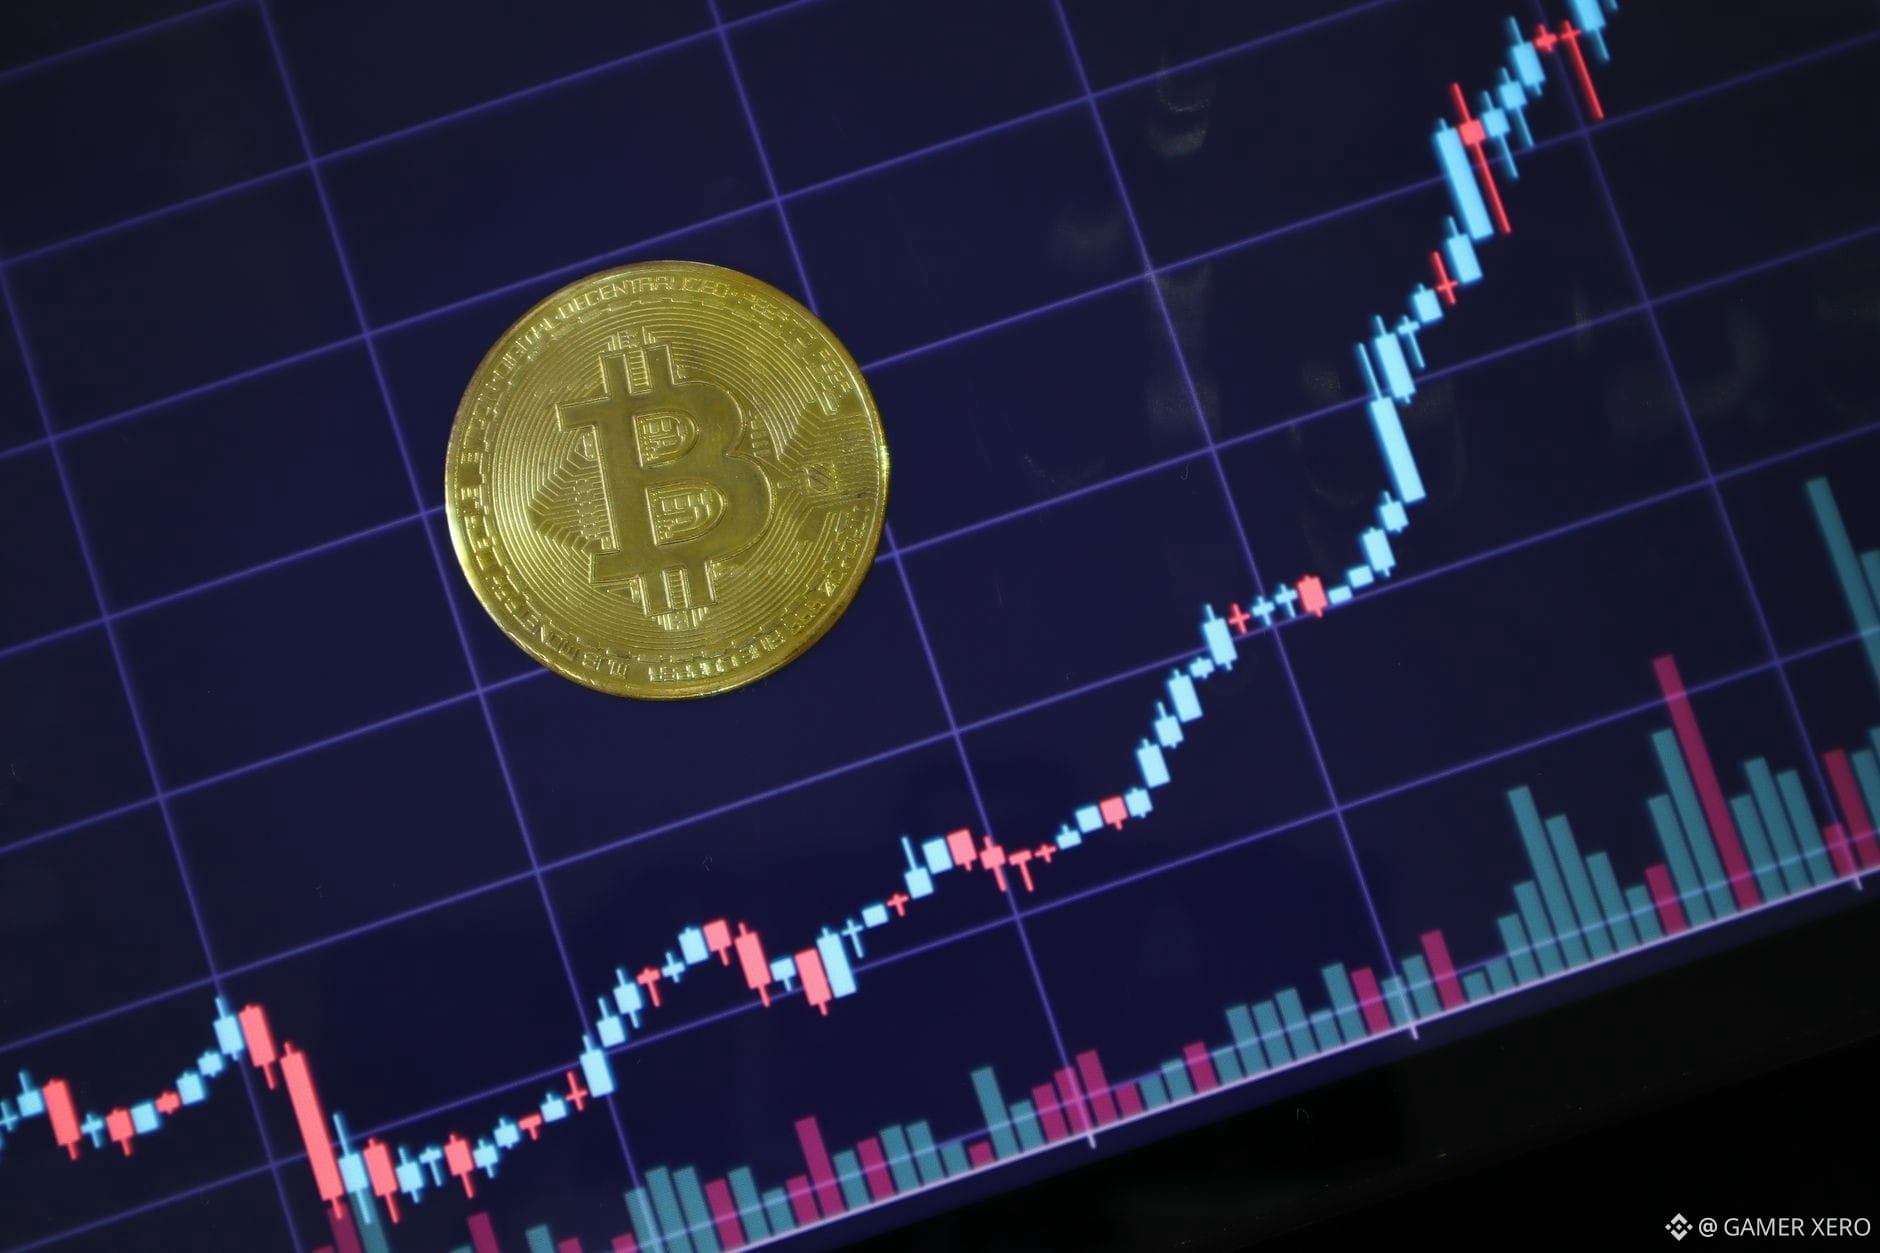
Detectar un desequilibrio en el libro de órdenes puede revelar presión a corto plazo antes de la siguiente vela. En Binance, la vista de profundidad muestra la mejor oferta (bid) y demanda (ask) para $BTC at $81,155.34 y $81,263, respectivamente. Si el volumen total en el lado de la demanda dentro de los primeros cinco niveles de precio es un 30% más alto que en el lado de la oferta, los vendedores están acumulando, lo que sugiere una posible resistencia a la baja. Por el contrario, un volumen de demanda mayor sugiere interés comprador y posible soporte. Para cuantificarlo, suma la columna de cantidad en cada nivel y calcula la razón: Volumen Ask ÷ Volumen Bid. Una razón por encima de 1.2 a menudo marca una inclinación bajista, mientras que por debajo de 0.8 se inclina hacia el alza. Observar cómo cambia esta razón entre sesiones te ayuda a decidir si ajustar stops o buscar una ruptura. El mismo principio se aplica a $ETH, donde el spread actual se sitúa alrededor de $2,527.02-$2,531, y un libro de órdenes ajustado puede significar que el mercado está esperando un catalizador. ¿Alguna vez has usado el desequilibrio del libro de órdenes para cronometrar tu entrada o salida? #CryptoEducation #OrderBook #TradingTools #GAMERXERO
Detectar un desequilibrio en el libro de órdenes puede revelar presión a corto plazo antes de la siguiente vela. En Binance, la vista de profundidad muestra la mejor oferta (bid) y demanda (ask) para $BTC at $81,155.34 y $81,263, respectivamente. Si el volumen total en el lado de la demanda dentro de los primeros cinco niveles de precio es un 30% más alto que en el lado de la oferta, los vendedores están acumulando, lo que sugiere una posible resistencia a la baja. Por el contrario, un volumen de demanda mayor sugiere interés comprador y posible soporte. Para cuantificarlo, suma la columna de cantidad en cada nivel y calcula la razón: Volumen Ask ÷ Volumen Bid. Una razón por encima de 1.2 a menudo marca una inclinación bajista, mientras que por debajo de 0.8 se inclina hacia el alza. Observar cómo cambia esta razón entre sesiones te ayuda a decidir si ajustar stops o buscar una ruptura. El mismo principio se aplica a $ETH , donde el spread actual se sitúa alrededor de $2,527.02-$2,531, y un libro de órdenes ajustado puede significar que el mercado está esperando un catalizador. ¿Alguna vez has usado el desequilibrio del libro de órdenes para cronometrar tu entrada o salida? #CryptoEducation #OrderBook #TradingTools #GAMERXERO
11

·
--
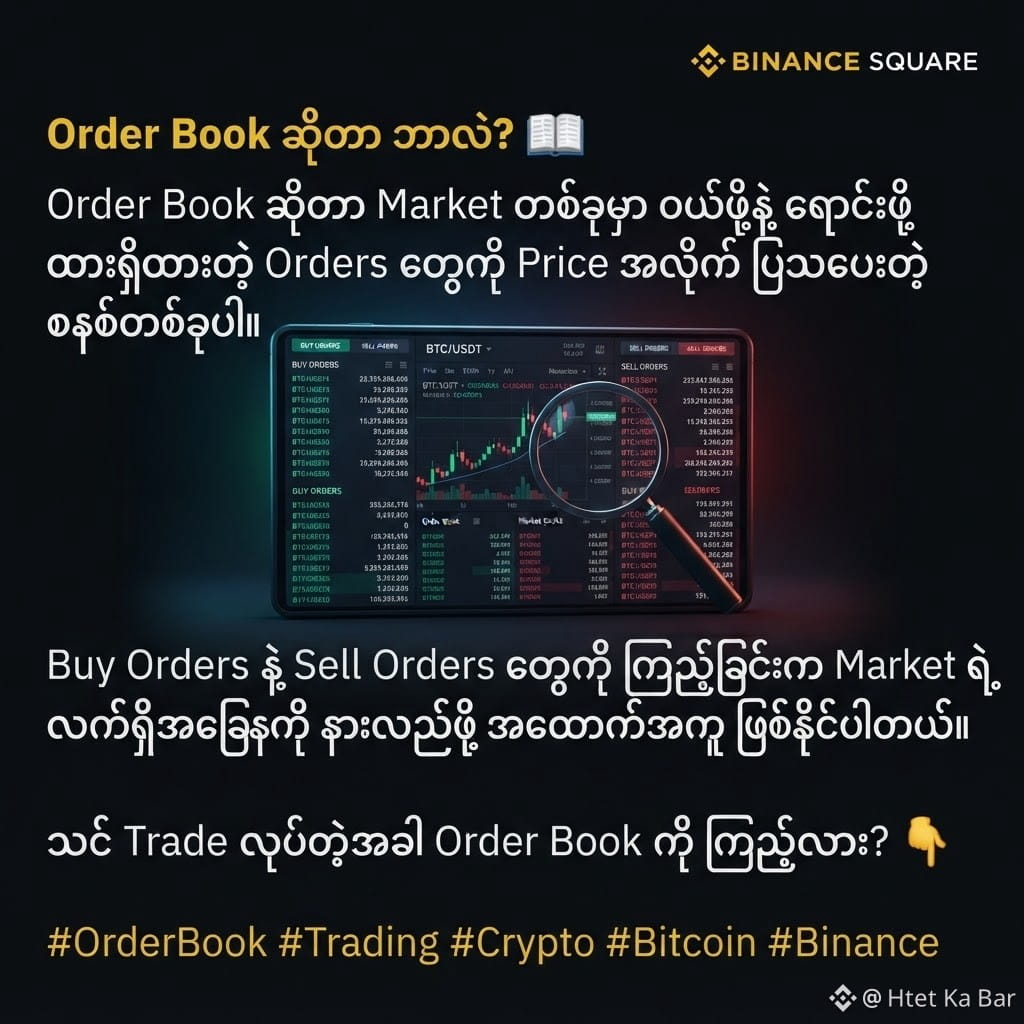
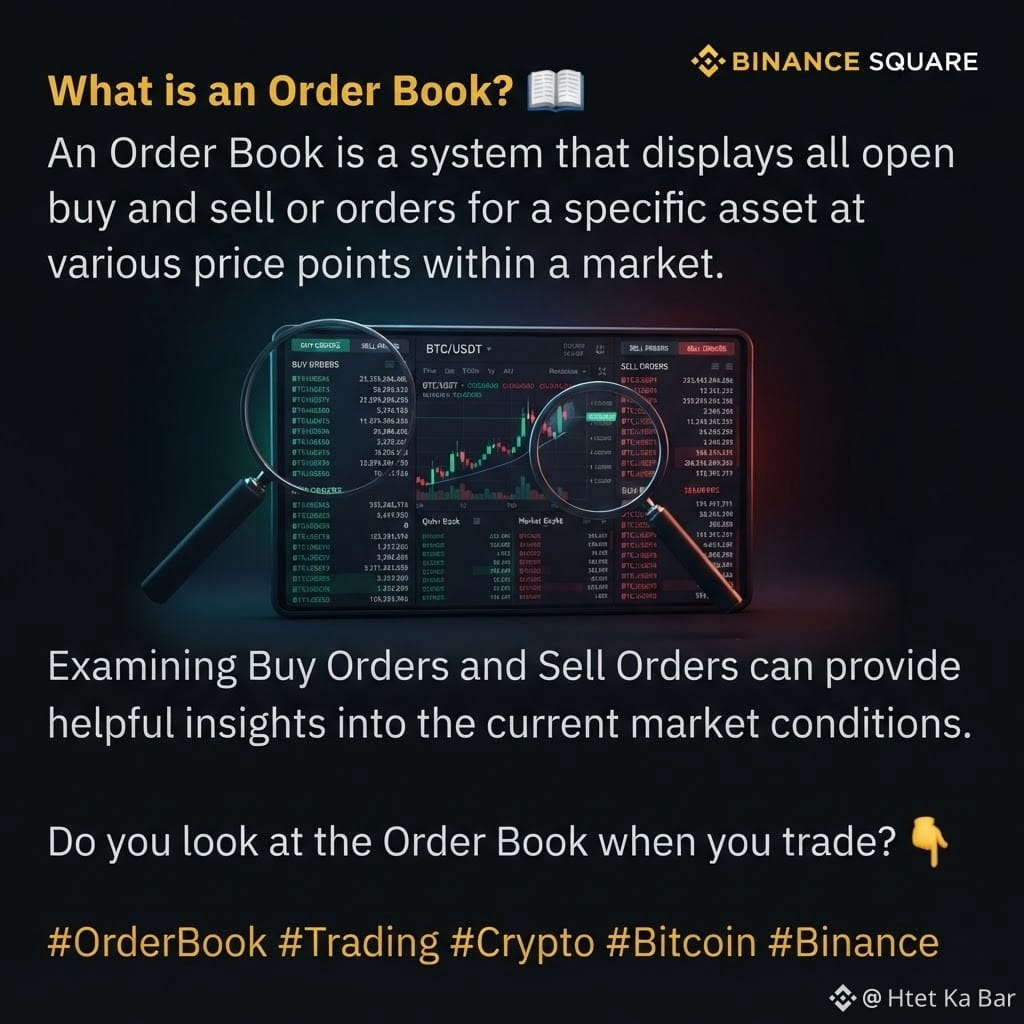
¿Qué es el Order Book?
📖 El Order Book es un sistema que muestra, por precio, las órdenes que hay disponibles en un mercado para comprar y vender.
Ver las órdenes de compra (Buy) y las órdenes de venta (Sell) puede ayudarte a entender la situación actual del mercado.
¿Consultas el Order Book cuando haces trading? 👇
#OrderBook #Trading #Crypto #Bitcoin #Binance $BTC $BNB $DOGE
¿Qué es el Order Book?
📖 El Order Book es un sistema que muestra, por precio, las órdenes que hay disponibles en un mercado para comprar y vender.
Ver las órdenes de compra (Buy) y las órdenes de venta (Sell) puede ayudarte a entender la situación actual del mercado.
¿Consultas el Order Book cuando haces trading? 👇
#OrderBook #Trading #Crypto #Bitcoin #Binance $BTC $BNB $DOGE
📖 El Order Book es un sistema que muestra, por precio, las órdenes que hay disponibles en un mercado para comprar y vender.
Ver las órdenes de compra (Buy) y las órdenes de venta (Sell) puede ayudarte a entender la situación actual del mercado.
¿Consultas el Order Book cuando haces trading? 👇
#OrderBook #Trading #Crypto #Bitcoin #Binance $BTC $BNB $DOGE
97

Tu saldo de cartera es una ilusión matemática hasta que la orden de venta se ejecuta realmente.
La mayoría de los traders se queda mirando las ganancias no realizadas con pura euforia, solo para ver cómo esa riqueza que cambiaría la vida se evapora en el aire apenas intentan salir. Es una de las lecciones más dolorosas en cripto: ganar en pantalla es fácil, pero en realidad llevarlo fuera de la mesa es donde las cuentas se destruyen.
He visto esta película desarrollarse en cada ciclo alcista desde 2017. Alguien ve un titular de 8M$ de beneficio en un altcoin ilíquido, pero intentar descargar un paquete de ese tamaño consume al instante cada oferta del libro. Entra una deslizamiento masivo: los precios de ejecución caen muchísimo por debajo del precio que se ve en pantalla, y esa fortuna “de papel” desaparece antes incluso de que la transacción se confirme.
Los activos líquidos como $BTC y $ETH pueden absorber un volumen considerable, pero en el momento en que te sales por la curva de riesgo con pares de baja capitalización como $PEPE, los libros de órdenes se secan rápido. Las ganancias en papel no pagan las cuentas; la profundidad real del mercado es la que decide qué es lo que realmente te quedas.
¿Cómo gestionas tu liquidez y tu estrategia de salida cuando una posición se vuelve parabólica?
#CryptoTrading #OrderBook #GestiónDeRiesgo
Tu saldo de cartera es una ilusión matemática hasta que la orden de venta se ejecuta realmente.
La mayoría de los traders se queda mirando las ganancias no realizadas con pura euforia, solo para ver cómo esa riqueza que cambiaría la vida se evapora en el aire apenas intentan salir. Es una de las lecciones más dolorosas en cripto: ganar en pantalla es fácil, pero en realidad llevarlo fuera de la mesa es donde las cuentas se destruyen.
He visto esta película desarrollarse en cada ciclo alcista desde 2017. Alguien ve un titular de 8M$ de beneficio en un altcoin ilíquido, pero intentar descargar un paquete de ese tamaño consume al instante cada oferta del libro. Entra una deslizamiento masivo: los precios de ejecución caen muchísimo por debajo del precio que se ve en pantalla, y esa fortuna “de papel” desaparece antes incluso de que la transacción se confirme.
Los activos líquidos como $BTC y $ETH pueden absorber un volumen considerable, pero en el momento en que te sales por la curva de riesgo con pares de baja capitalización como $PEPE , los libros de órdenes se secan rápido. Las ganancias en papel no pagan las cuentas; la profundidad real del mercado es la que decide qué es lo que realmente te quedas.
¿Cómo gestionas tu liquidez y tu estrategia de salida cuando una posición se vuelve parabólica?
#CryptoTrading #OrderBook #GestiónDeRiesgo
La mayoría de los traders se queda mirando las ganancias no realizadas con pura euforia, solo para ver cómo esa riqueza que cambiaría la vida se evapora en el aire apenas intentan salir. Es una de las lecciones más dolorosas en cripto: ganar en pantalla es fácil, pero en realidad llevarlo fuera de la mesa es donde las cuentas se destruyen.
He visto esta película desarrollarse en cada ciclo alcista desde 2017. Alguien ve un titular de 8M$ de beneficio en un altcoin ilíquido, pero intentar descargar un paquete de ese tamaño consume al instante cada oferta del libro. Entra una deslizamiento masivo: los precios de ejecución caen muchísimo por debajo del precio que se ve en pantalla, y esa fortuna “de papel” desaparece antes incluso de que la transacción se confirme.
Los activos líquidos como $BTC y $ETH pueden absorber un volumen considerable, pero en el momento en que te sales por la curva de riesgo con pares de baja capitalización como $PEPE , los libros de órdenes se secan rápido. Las ganancias en papel no pagan las cuentas; la profundidad real del mercado es la que decide qué es lo que realmente te quedas.
¿Cómo gestionas tu liquidez y tu estrategia de salida cuando una posición se vuelve parabólica?
#CryptoTrading #OrderBook #GestiónDeRiesgo
21

·
--
Imagina esto: un operador ve cómo aparece una ganancia no realizada de $8M en la pantalla, convencido de que acaba de asegurar una salida que cambia la vida.
La mayoría de los inversores se obsesionan con los puntos de entrada y con capturas de su cartera, olvidando que las ganancias en papel no significan nada hasta que el dinero entra en la cuenta. Cuando se seca la liquidez (market depth), esa posición ganadora se convierte en un drawdown agresivo antes de que incluso termine de enrutarse la orden de venta.
Esto es lo que realmente pasa por debajo de la superficie. El precio cotizado del ticker solo refleja la parte más alta del libro de órdenes. Cuando alguien intenta colocar millones en un activo poco líquido frente a mercados profundos como $BTC, la orden de venta agota rápidamente todas las ofertas existentes.
La desviación (slippage) se multiplica en cuestión de segundos. A medida que la operación se come una profundidad escasa, el precio de ejecución cae muy por debajo de la cotización inicial del mercado. Ese aclamado titular de $8M se reduce a una fracción de su valor percibido en el momento en que se pone a prueba la liquidez en tokens como $SOL o en operaciones de impulso (momentum) como $PEPE.
Las ganancias en papel crean la ilusión de seguridad, pero la profundidad del libro de órdenes determina el pago real.
¿Cómo gestionas tu estrategia de salida cuando te retiras gradualmente (scale out) de posiciones poco líquidas?
#CryptoTrading #RiskManagement #OrderBook
Imagina esto: un operador ve cómo aparece una ganancia no realizada de $8M en la pantalla, convencido de que acaba de asegurar una salida que cambia la vida.
La mayoría de los inversores se obsesionan con los puntos de entrada y con capturas de su cartera, olvidando que las ganancias en papel no significan nada hasta que el dinero entra en la cuenta. Cuando se seca la liquidez (market depth), esa posición ganadora se convierte en un drawdown agresivo antes de que incluso termine de enrutarse la orden de venta.
Esto es lo que realmente pasa por debajo de la superficie. El precio cotizado del ticker solo refleja la parte más alta del libro de órdenes. Cuando alguien intenta colocar millones en un activo poco líquido frente a mercados profundos como $BTC , la orden de venta agota rápidamente todas las ofertas existentes.
La desviación (slippage) se multiplica en cuestión de segundos. A medida que la operación se come una profundidad escasa, el precio de ejecución cae muy por debajo de la cotización inicial del mercado. Ese aclamado titular de $8M se reduce a una fracción de su valor percibido en el momento en que se pone a prueba la liquidez en tokens como $SOL o en operaciones de impulso (momentum) como $PEPE .
Las ganancias en papel crean la ilusión de seguridad, pero la profundidad del libro de órdenes determina el pago real.
¿Cómo gestionas tu estrategia de salida cuando te retiras gradualmente (scale out) de posiciones poco líquidas?
#CryptoTrading #RiskManagement #OrderBook
La mayoría de los inversores se obsesionan con los puntos de entrada y con capturas de su cartera, olvidando que las ganancias en papel no significan nada hasta que el dinero entra en la cuenta. Cuando se seca la liquidez (market depth), esa posición ganadora se convierte en un drawdown agresivo antes de que incluso termine de enrutarse la orden de venta.
Esto es lo que realmente pasa por debajo de la superficie. El precio cotizado del ticker solo refleja la parte más alta del libro de órdenes. Cuando alguien intenta colocar millones en un activo poco líquido frente a mercados profundos como $BTC , la orden de venta agota rápidamente todas las ofertas existentes.
La desviación (slippage) se multiplica en cuestión de segundos. A medida que la operación se come una profundidad escasa, el precio de ejecución cae muy por debajo de la cotización inicial del mercado. Ese aclamado titular de $8M se reduce a una fracción de su valor percibido en el momento en que se pone a prueba la liquidez en tokens como $SOL o en operaciones de impulso (momentum) como $PEPE .
Las ganancias en papel crean la ilusión de seguridad, pero la profundidad del libro de órdenes determina el pago real.
¿Cómo gestionas tu estrategia de salida cuando te retiras gradualmente (scale out) de posiciones poco líquidas?
#CryptoTrading #RiskManagement #OrderBook

1
31
·
--
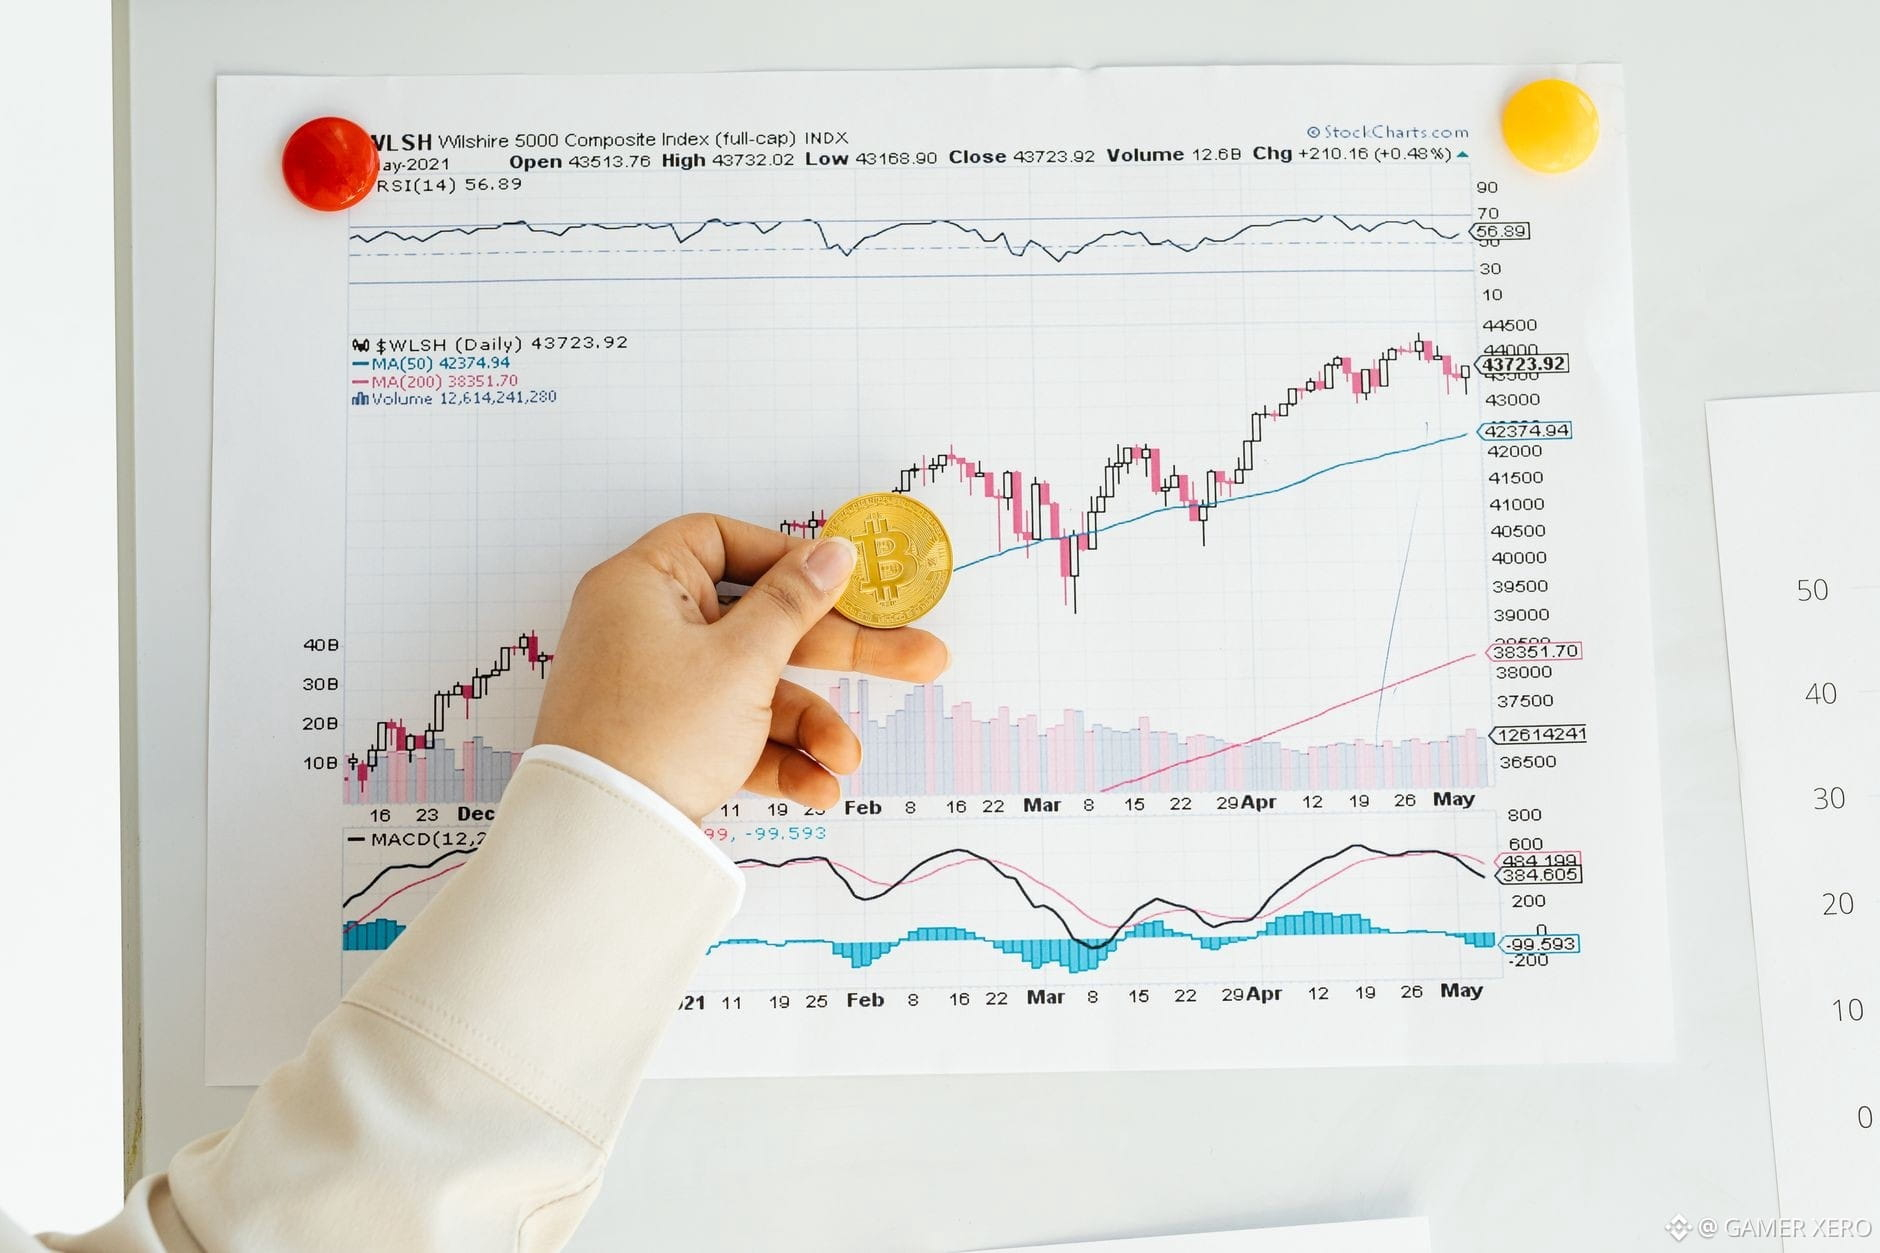
Observar el libro de órdenes en vivo en Binance puede revelar dónde se sitúa la presión real de compra y venta en tiempo real. Toma $BTC ahora: la mejor oferta ronda justo por debajo del mínimo de 24 horas en $76,264, mientras que la mejor demanda está cerca del máximo de $77,792. Si abres la vista de profundidad, verás aproximadamente 1 M BTC agrupados entre $76,200 y $76,300 en el lado de la oferta, pero solo unos pocos cientos de miles en el lado de la demanda en el mismo rango. Ese desequilibrio sugiere que los vendedores están defendiendo el límite superior, mientras que los compradores se están reuniendo cerca del borde inferior.
Al monitorear estas proporciones junto con la acción del precio, puedes detectar cuándo la liquidez se está moviendo antes de que lo haga la vela. ¿Has usado las razones de la profundidad del libro de órdenes en tu propia planificación de operaciones, y qué tamaño de ventana funciona mejor para ti?
#CryptoEducation #BinanceTips #OrderBook #GAMERXERO
Observar el libro de órdenes en vivo en Binance puede revelar dónde se sitúa la presión real de compra y venta en tiempo real. Toma $BTC ahora: la mejor oferta ronda justo por debajo del mínimo de 24 horas en $76,264, mientras que la mejor demanda está cerca del máximo de $77,792. Si abres la vista de profundidad, verás aproximadamente 1 M BTC agrupados entre $76,200 y $76,300 en el lado de la oferta, pero solo unos pocos cientos de miles en el lado de la demanda en el mismo rango. Ese desequilibrio sugiere que los vendedores están defendiendo el límite superior, mientras que los compradores se están reuniendo cerca del borde inferior.
Al monitorear estas proporciones junto con la acción del precio, puedes detectar cuándo la liquidez se está moviendo antes de que lo haga la vela. ¿Has usado las razones de la profundidad del libro de órdenes en tu propia planificación de operaciones, y qué tamaño de ventana funciona mejor para ti?
#CryptoEducation #BinanceTips #OrderBook #GAMERXERO
Al monitorear estas proporciones junto con la acción del precio, puedes detectar cuándo la liquidez se está moviendo antes de que lo haga la vela. ¿Has usado las razones de la profundidad del libro de órdenes en tu propia planificación de operaciones, y qué tamaño de ventana funciona mejor para ti?
#CryptoEducation #BinanceTips #OrderBook #GAMERXERO
27

Desmitificando la profundidad de mercado: cómo los libros de órdenes moldean la acción del precio y la ejecución de operacionesCuando se negocian criptomonedas, la mayoría de los principiantes se centra exclusivamente en el gráfico de precio principal, observando cómo las velas suben o bajan en tiempo real. Sin embargo, el precio spot actual que se muestra en la pantalla de un exchange es solo el resultado de la transacción más reciente ejecutada. Te indica dónde estaba el mercado hace un momento, pero revela muy poco sobre la cantidad de volumen de operaciones que el mercado puede manejar ahora mismo sin moverse significativamente.
Para entender qué tan fácil puede moverse el precio de un activo, cómo se completan las órdenes y por qué a veces las transacciones grandes provocan picos de precio repentinos, los traders deben mirar “bajo el capó” en la profundidad de mercado.
Desmitificando la profundidad de mercado: cómo los libros de órdenes moldean la acción del precio y la ejecución de operaciones
Cuando se negocian criptomonedas, la mayoría de los principiantes se centra exclusivamente en el gráfico de precio principal, observando cómo las velas suben o bajan en tiempo real. Sin embargo, el precio spot actual que se muestra en la pantalla de un exchange es solo el resultado de la transacción más reciente ejecutada. Te indica dónde estaba el mercado hace un momento, pero revela muy poco sobre la cantidad de volumen de operaciones que el mercado puede manejar ahora mismo sin moverse significativamente.
Para entender qué tan fácil puede moverse el precio de un activo, cómo se completan las órdenes y por qué a veces las transacciones grandes provocan picos de precio repentinos, los traders deben mirar “bajo el capó” en la profundidad de mercado.
Para entender qué tan fácil puede moverse el precio de un activo, cómo se completan las órdenes y por qué a veces las transacciones grandes provocan picos de precio repentinos, los traders deben mirar “bajo el capó” en la profundidad de mercado.
104

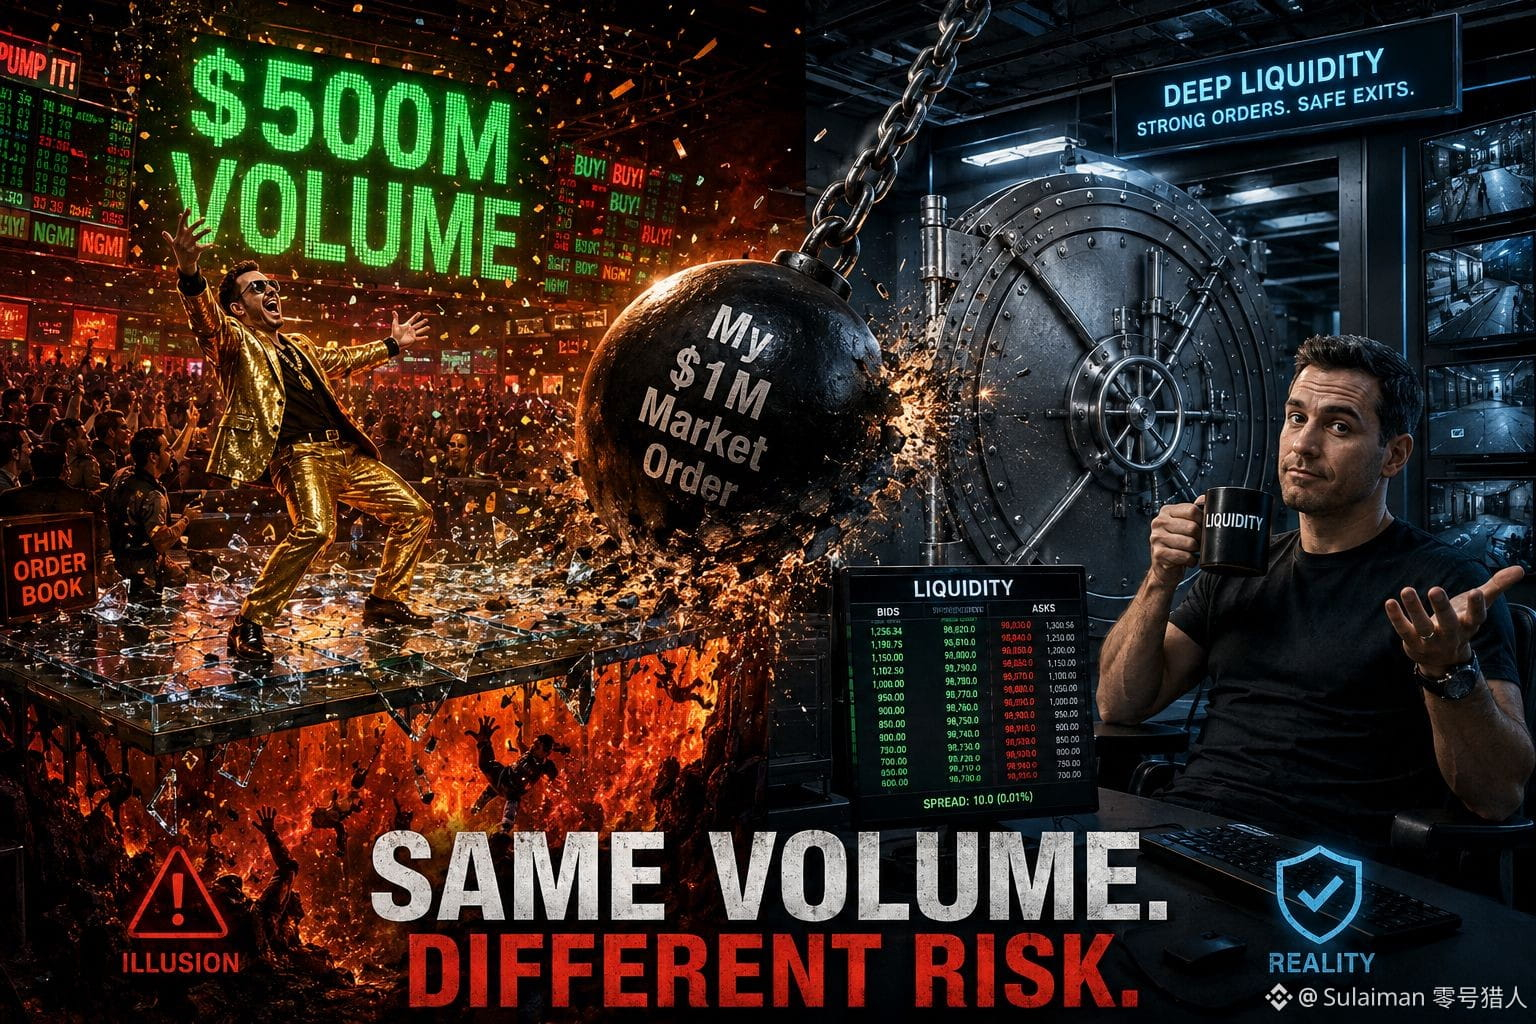
🔥 Mismo volumen. Diferente riesgo.
Una moneda puede generar $500M en volumen y aun así arruinar tu operación si el libro está delgado.
Volumen = cuánto se negoció. Liquidez = cuánto tamaño puede absorber el mercado sin explotar.
$500M de volumen + libro profundo = tu orden apenas mueve el precio. $500M de volumen + libro delgado = tu propia orden de $1M se convierte en la vela.
Antes de confiar en un número de volumen, revisa la profundidad del libro de órdenes, el spread y si ese volumen realmente se sostiene con el tiempo — no solo en un pico aislado.
Alto volumen + fuerte liquidez = mercado saludable. Alto volumen + liquidez débil = una trampa esperando a que entre tamaño.
No persigas el número ruidoso. Persigue el que protege tu salida.
#Liquidity #CryptoTrading #OrderBook
$BTC $ETH $BNB
🔥 Mismo volumen. Diferente riesgo.
Una moneda puede generar $500M en volumen y aun así arruinar tu operación si el libro está delgado.
Volumen = cuánto se negoció. Liquidez = cuánto tamaño puede absorber el mercado sin explotar.
$500M de volumen + libro profundo = tu orden apenas mueve el precio. $500M de volumen + libro delgado = tu propia orden de $1M se convierte en la vela.
Antes de confiar en un número de volumen, revisa la profundidad del libro de órdenes, el spread y si ese volumen realmente se sostiene con el tiempo — no solo en un pico aislado.
Alto volumen + fuerte liquidez = mercado saludable. Alto volumen + liquidez débil = una trampa esperando a que entre tamaño.
No persigas el número ruidoso. Persigue el que protege tu salida.
#Liquidity #CryptoTrading #OrderBook
$BTC $ETH $BNB
Una moneda puede generar $500M en volumen y aun así arruinar tu operación si el libro está delgado.
Volumen = cuánto se negoció. Liquidez = cuánto tamaño puede absorber el mercado sin explotar.
$500M de volumen + libro profundo = tu orden apenas mueve el precio. $500M de volumen + libro delgado = tu propia orden de $1M se convierte en la vela.
Antes de confiar en un número de volumen, revisa la profundidad del libro de órdenes, el spread y si ese volumen realmente se sostiene con el tiempo — no solo en un pico aislado.
Alto volumen + fuerte liquidez = mercado saludable. Alto volumen + liquidez débil = una trampa esperando a que entre tamaño.
No persigas el número ruidoso. Persigue el que protege tu salida.
#Liquidity #CryptoTrading #OrderBook
$BTC $ETH $BNB
2
3
156
·
--
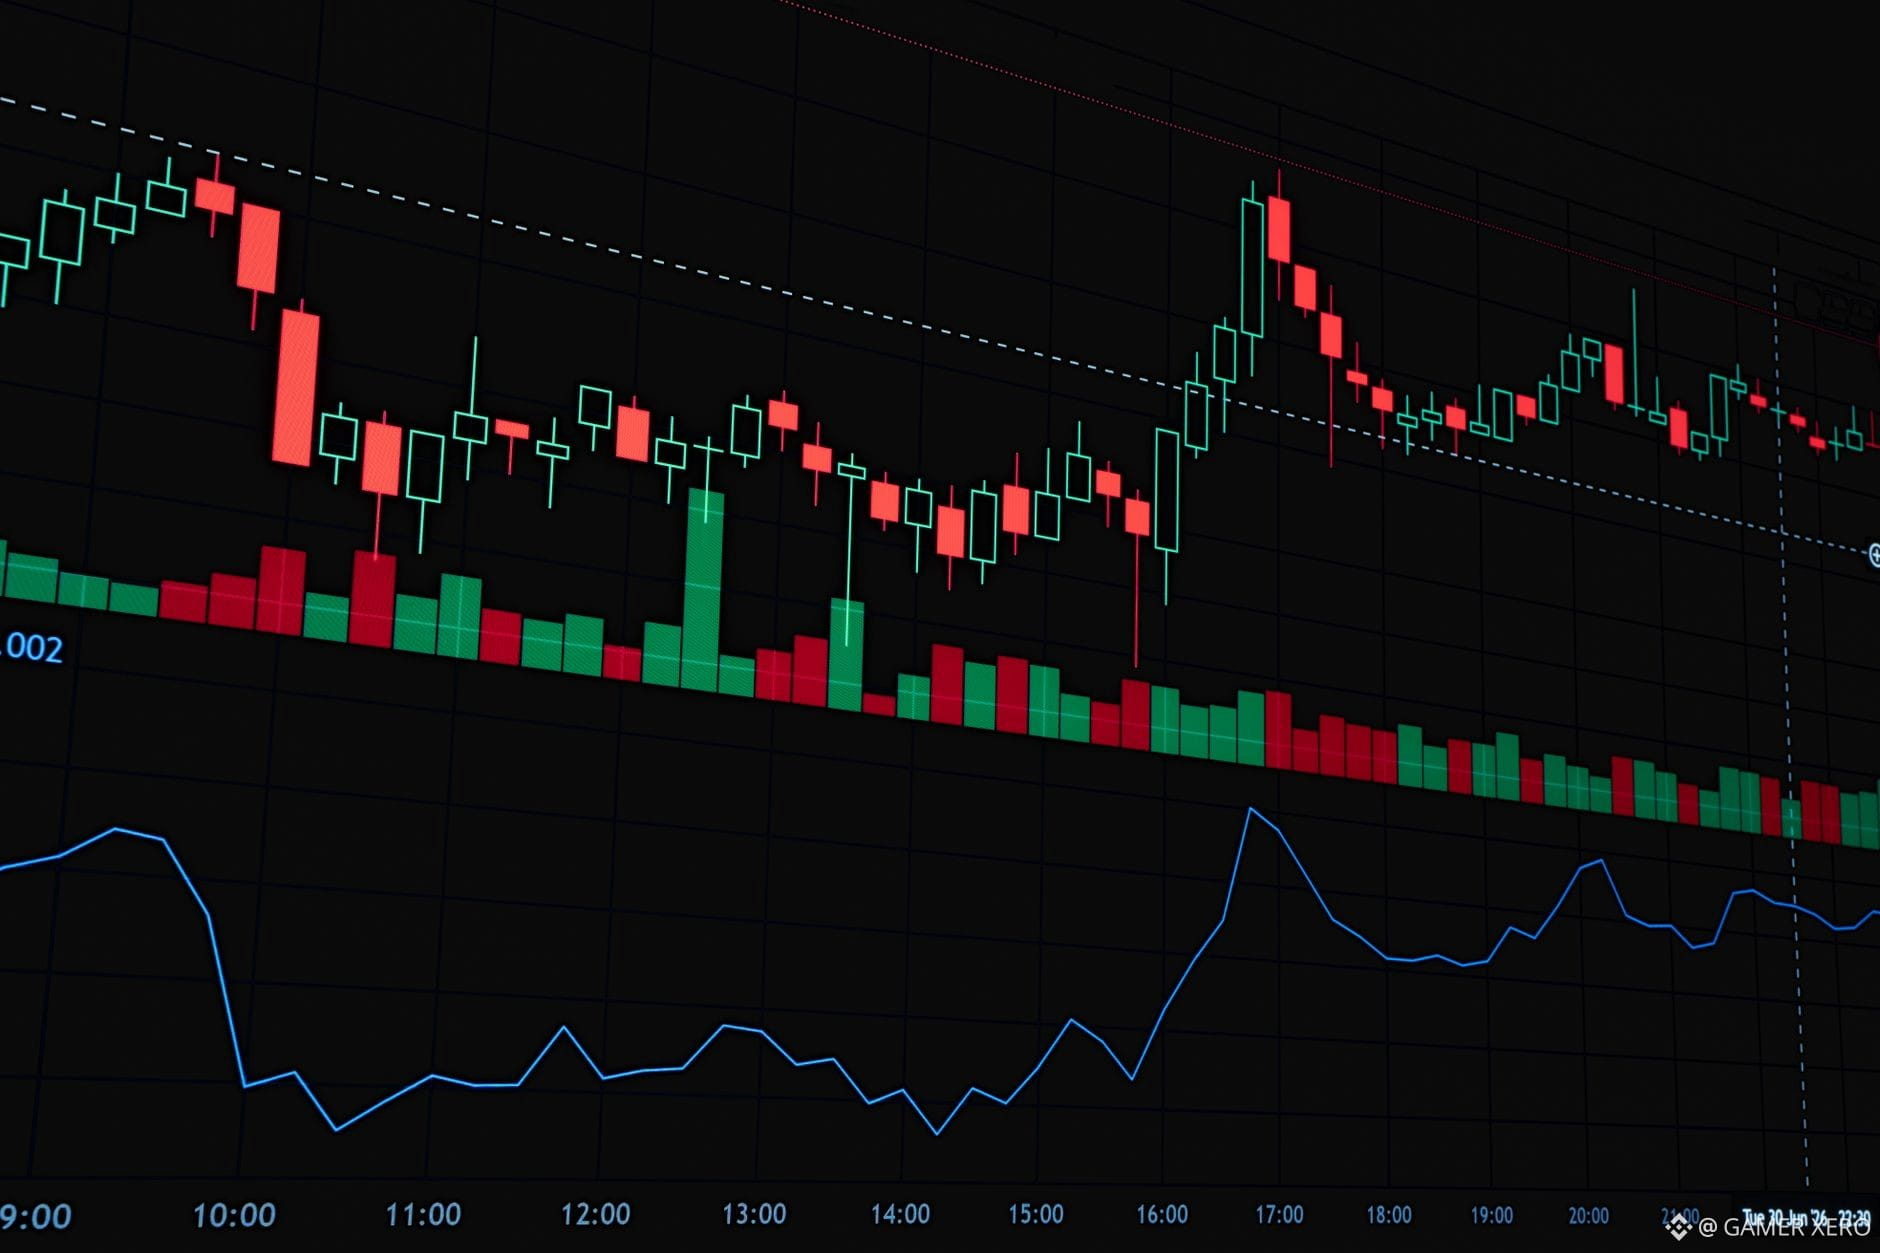
Cuando el mercado se mueve en un rango ajustado de 24 horas, la mejor forma de mejorar tu precio de entrada no es perseguir el ticker: es usar el order book. En Binance puedes cambiar a la vista de “Depth” y ver el volumen acumulado en cada nivel de precio. Si el lado de las ofertas (verde) se acumula solo unos cuantos dólares por debajo del precio actual, esa zona a menudo actúa como un suelo temporal. Colocar una compra limitada justo dentro de ese cúmulo significa que te ejecutan en cuanto el precio pruebe el soporte, en lugar de entrar al precio de mercado y pagar el spread.
Pruébalo en el próximo impulso: abre la vista de profundidad, identifica un muro de ofertas claro a unos cuantos dólares por debajo del precio actual y coloca una pequeña orden limitada dentro de él. ¿Cómo decides el tamaño de esa orden en relación con tu posición total?
#CryptoEducation #BinanceTips #OrderBook #GAMERXERO
Cuando el mercado se mueve en un rango ajustado de 24 horas, la mejor forma de mejorar tu precio de entrada no es perseguir el ticker: es usar el order book. En Binance puedes cambiar a la vista de “Depth” y ver el volumen acumulado en cada nivel de precio. Si el lado de las ofertas (verde) se acumula solo unos cuantos dólares por debajo del precio actual, esa zona a menudo actúa como un suelo temporal. Colocar una compra limitada justo dentro de ese cúmulo significa que te ejecutan en cuanto el precio pruebe el soporte, en lugar de entrar al precio de mercado y pagar el spread.
Pruébalo en el próximo impulso: abre la vista de profundidad, identifica un muro de ofertas claro a unos cuantos dólares por debajo del precio actual y coloca una pequeña orden limitada dentro de él. ¿Cómo decides el tamaño de esa orden en relación con tu posición total?
#CryptoEducation #BinanceTips #OrderBook #GAMERXERO
Pruébalo en el próximo impulso: abre la vista de profundidad, identifica un muro de ofertas claro a unos cuantos dólares por debajo del precio actual y coloca una pequeña orden limitada dentro de él. ¿Cómo decides el tamaño de esa orden en relación con tu posición total?
#CryptoEducation #BinanceTips #OrderBook #GAMERXERO
19
·
--
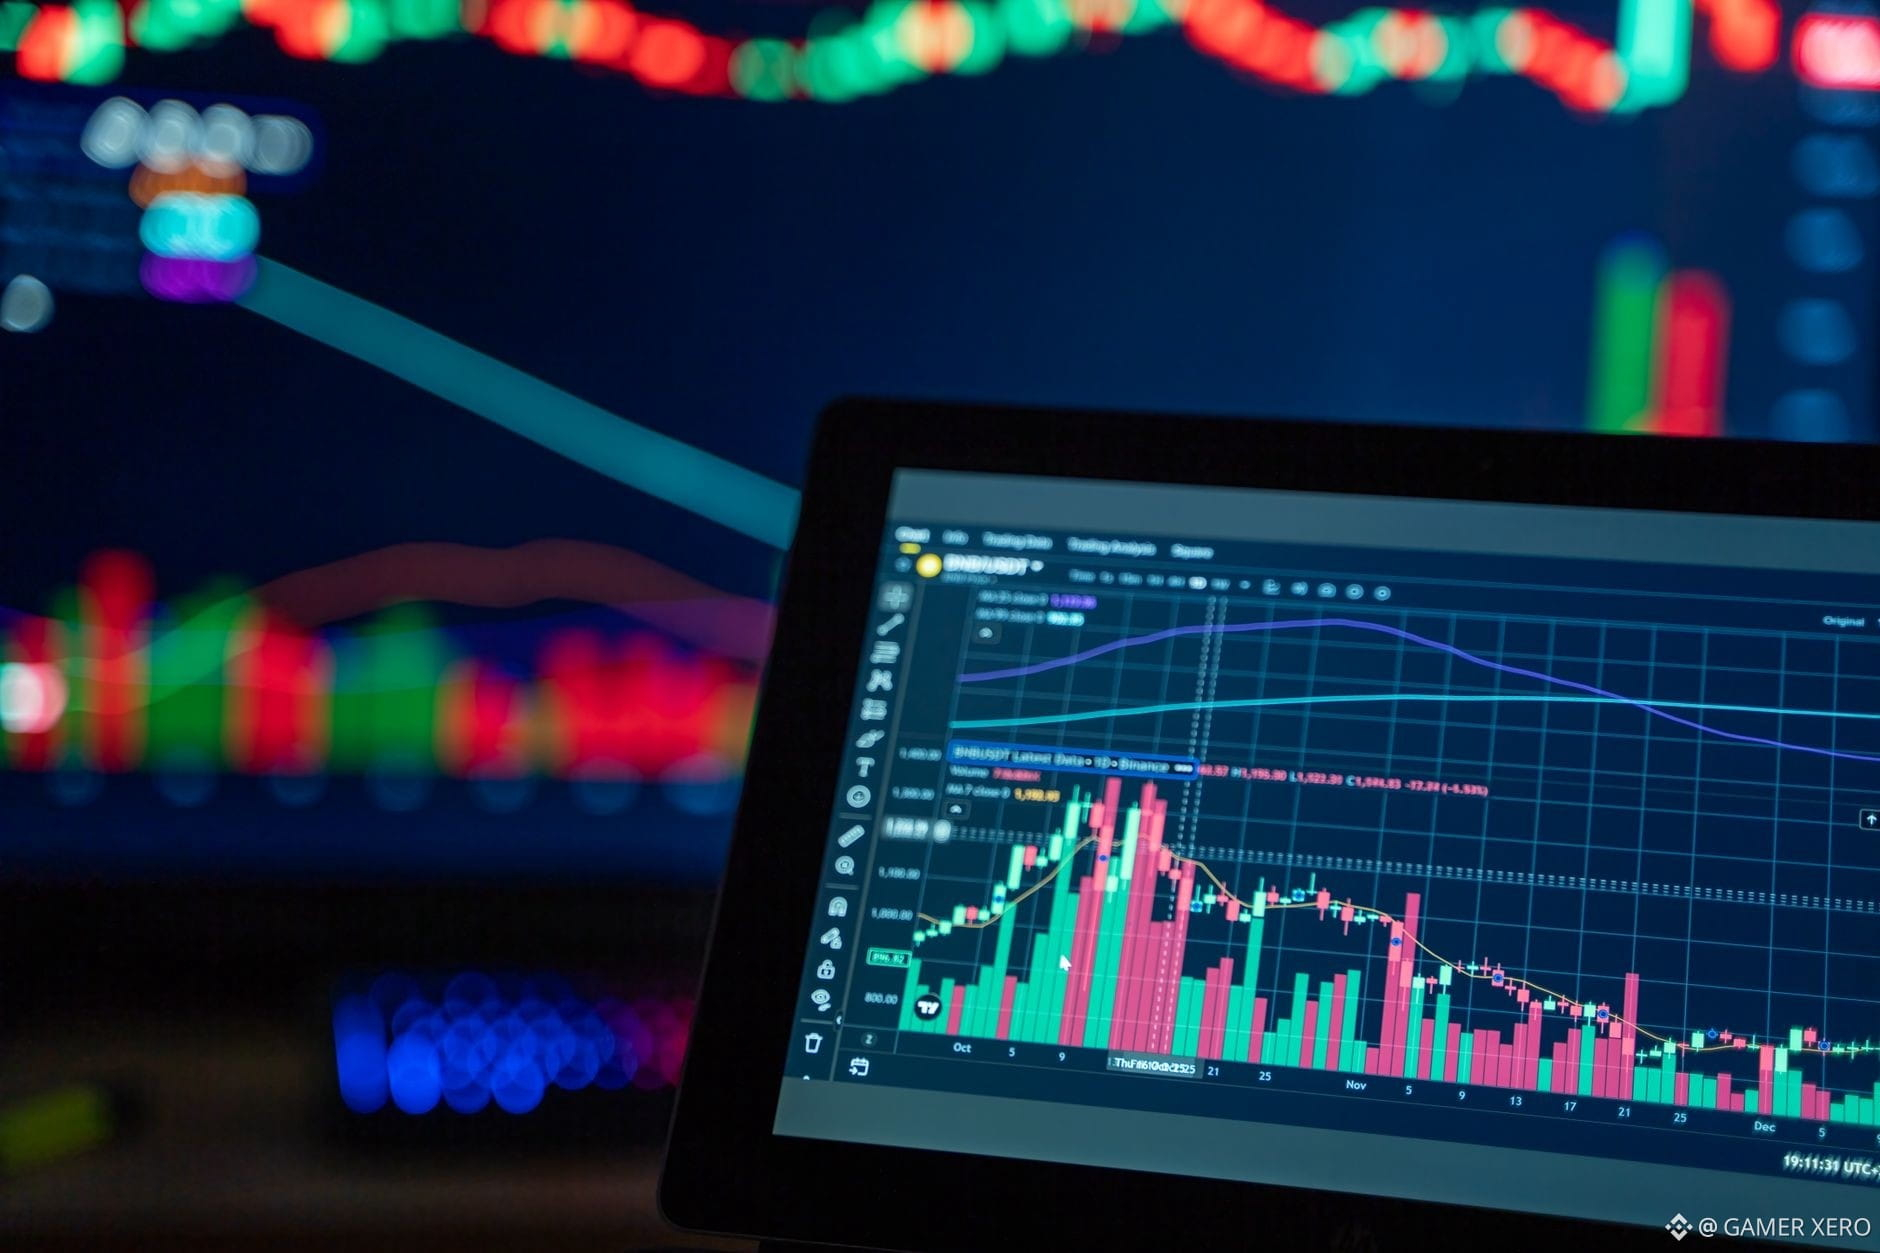
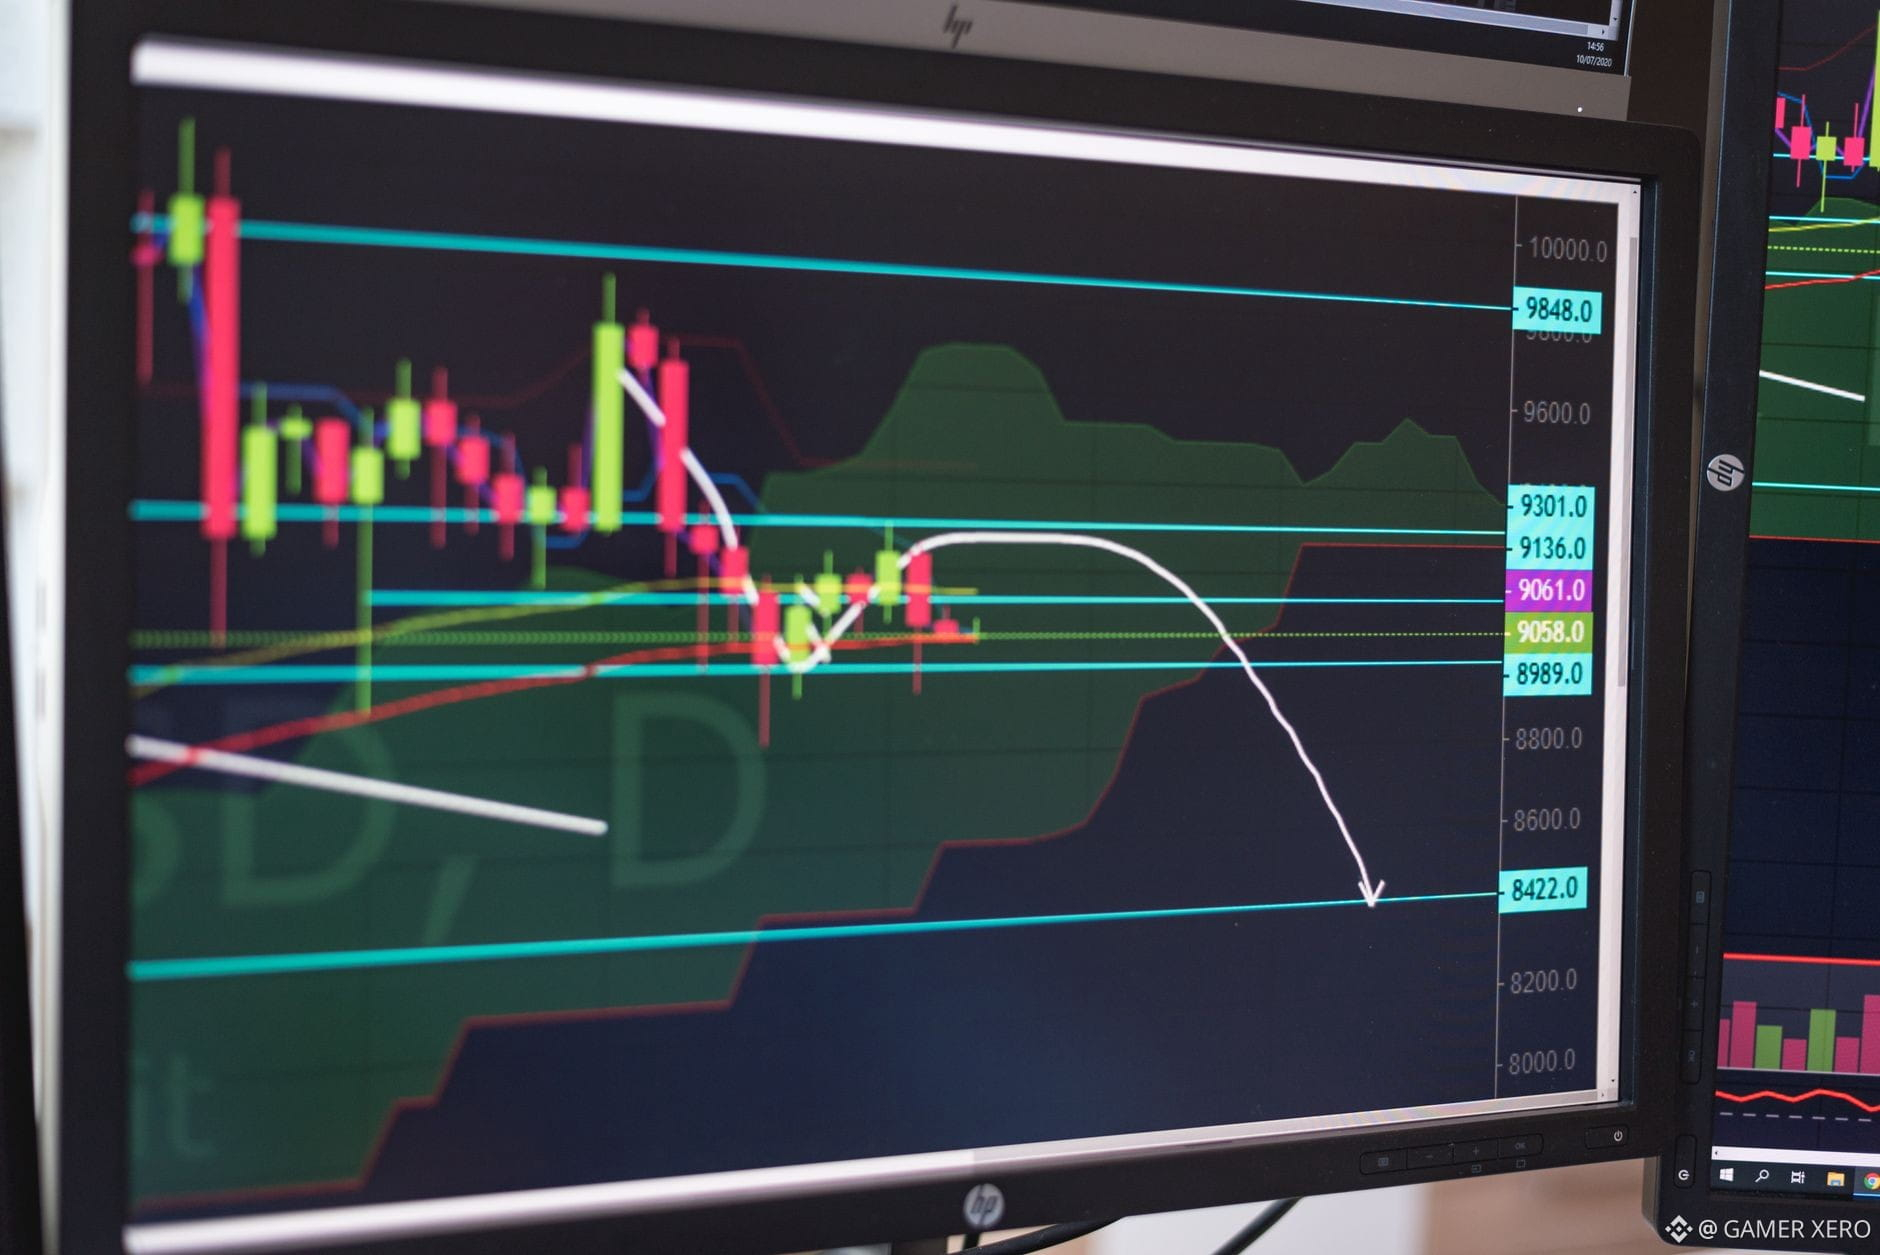
Detecta la presión del libro de órdenes antes de que aparezca en el gráfico. En Binance puedes activar la vista de profundidad y ver el volumen acumulado en cada nivel de precio. Si las ofertas (bids) justo debajo del precio actual superan a las demandas (asks) que están por encima, el mercado presenta un desequilibrio hacia el lado corto y podría mantenerse o rebotar más arriba; lo contrario sugiere presión a la baja.
Ahora mismo $BTC está en $77,888 con un rango de 24 horas de $77,600–$79,250. Abre el gráfico de profundidad y verás que hay aproximadamente un 35% más de volumen de bids entre $77,800 y $77,850 que de asks en la misma franja. Esa proporción bid‑to‑ask de 1.3:1 sugiere que está aumentando el interés de compra cerca del nivel actual. Para $ETH, que cotiza en $2,448.68, la profundidad muestra un balance más ajustado: bids y asks casi por igual, lo que coincide con su movimiento plano del 0.10%.
Supervisar estas proporciones te ayuda a decidir si ajustas stops, agregas a una posición o te mantienes al margen. ¿Cómo integras los desequilibrios del libro de órdenes en tu rutina de preparación de operaciones?
#CryptoTools #OrderBook #TradingTips #GAMERXERO
Detecta la presión del libro de órdenes antes de que aparezca en el gráfico. En Binance puedes activar la vista de profundidad y ver el volumen acumulado en cada nivel de precio. Si las ofertas (bids) justo debajo del precio actual superan a las demandas (asks) que están por encima, el mercado presenta un desequilibrio hacia el lado corto y podría mantenerse o rebotar más arriba; lo contrario sugiere presión a la baja.
Ahora mismo $BTC está en $77,888 con un rango de 24 horas de $77,600–$79,250. Abre el gráfico de profundidad y verás que hay aproximadamente un 35% más de volumen de bids entre $77,800 y $77,850 que de asks en la misma franja. Esa proporción bid‑to‑ask de 1.3:1 sugiere que está aumentando el interés de compra cerca del nivel actual. Para $ETH , que cotiza en $2,448.68, la profundidad muestra un balance más ajustado: bids y asks casi por igual, lo que coincide con su movimiento plano del 0.10%.
Supervisar estas proporciones te ayuda a decidir si ajustas stops, agregas a una posición o te mantienes al margen. ¿Cómo integras los desequilibrios del libro de órdenes en tu rutina de preparación de operaciones?
#CryptoTools #OrderBook #TradingTips #GAMERXERO
Ahora mismo $BTC está en $77,888 con un rango de 24 horas de $77,600–$79,250. Abre el gráfico de profundidad y verás que hay aproximadamente un 35% más de volumen de bids entre $77,800 y $77,850 que de asks en la misma franja. Esa proporción bid‑to‑ask de 1.3:1 sugiere que está aumentando el interés de compra cerca del nivel actual. Para $ETH , que cotiza en $2,448.68, la profundidad muestra un balance más ajustado: bids y asks casi por igual, lo que coincide con su movimiento plano del 0.10%.
Supervisar estas proporciones te ayuda a decidir si ajustas stops, agregas a una posición o te mantienes al margen. ¿Cómo integras los desequilibrios del libro de órdenes en tu rutina de preparación de operaciones?
#CryptoTools #OrderBook #TradingTips #GAMERXERO
23
·
--
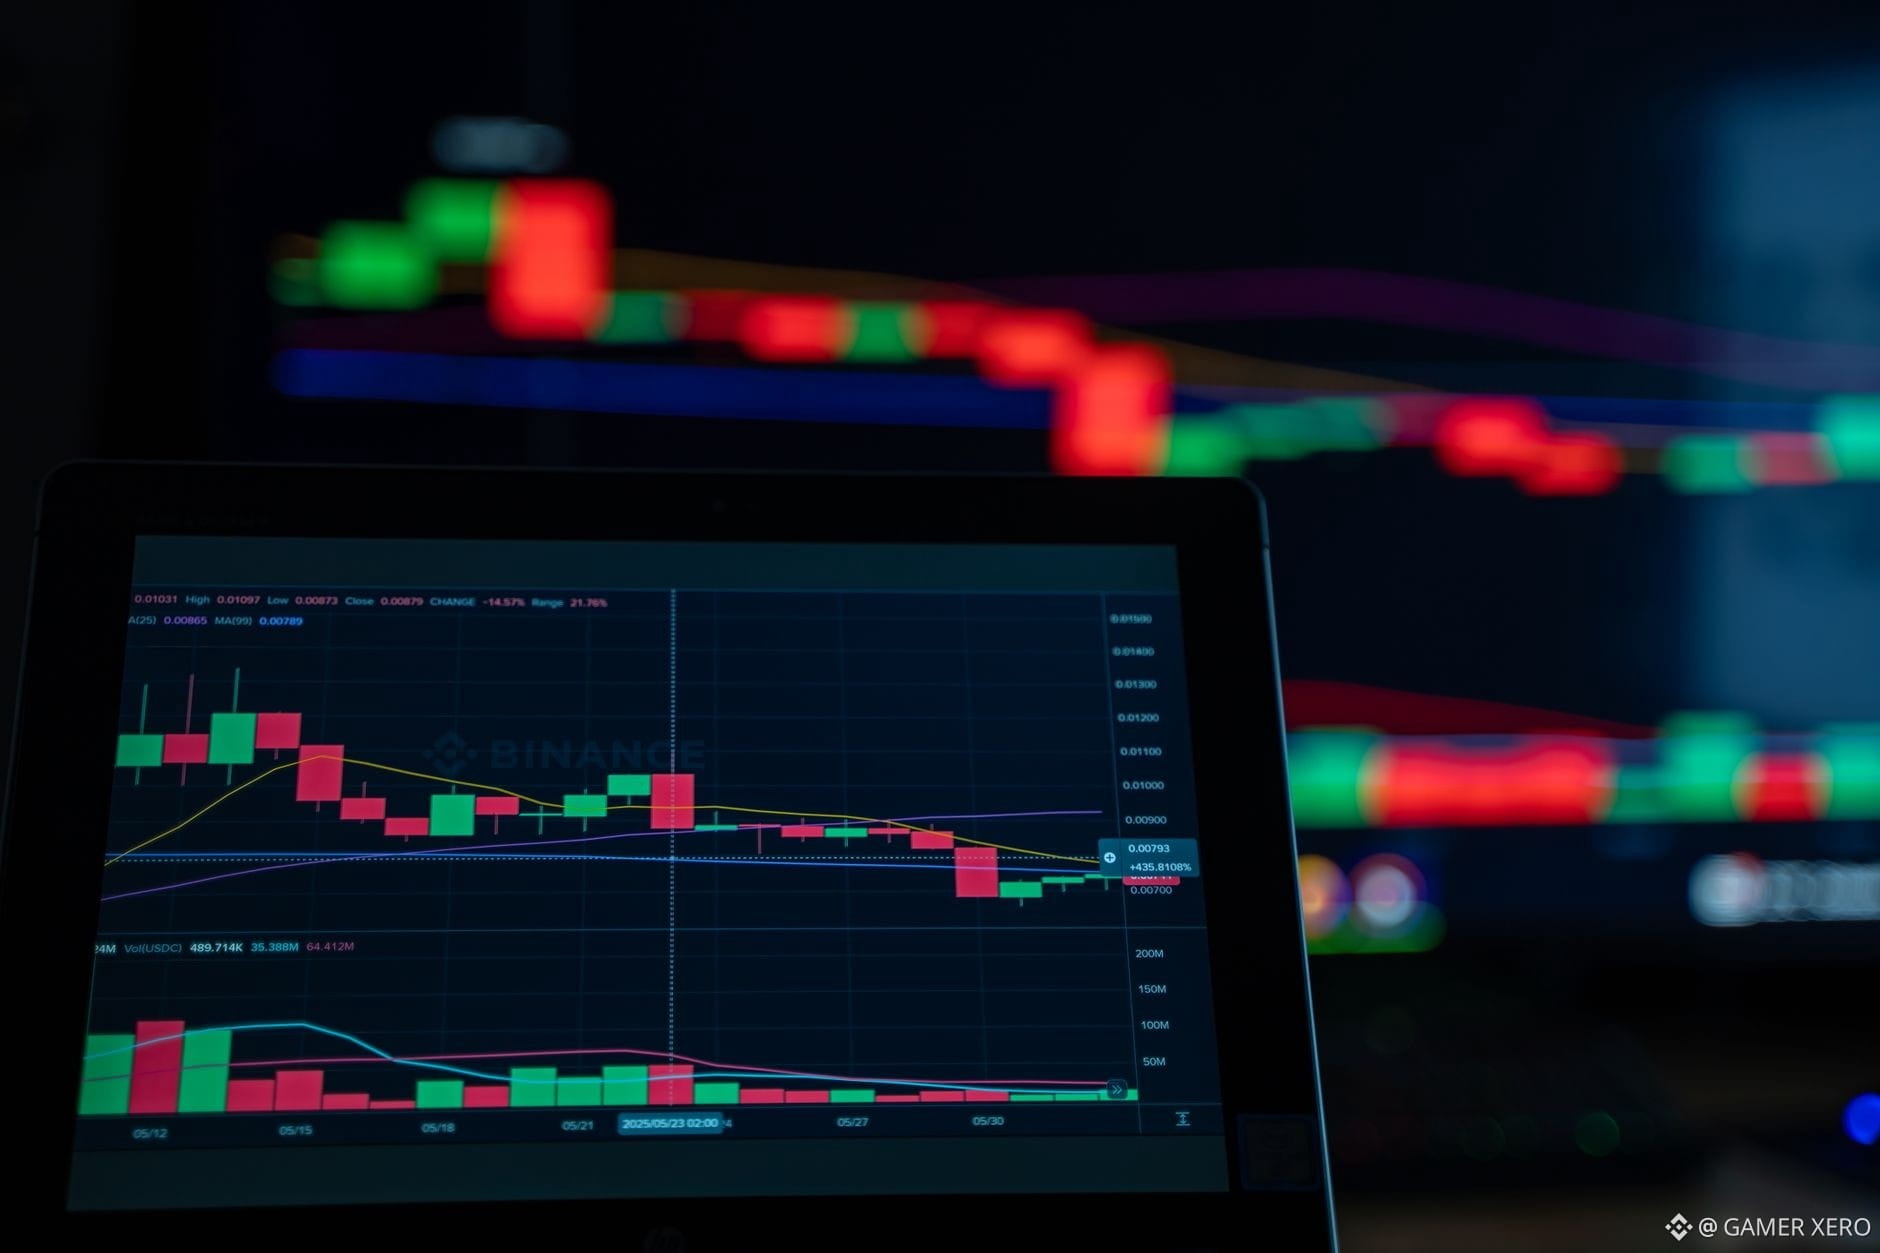
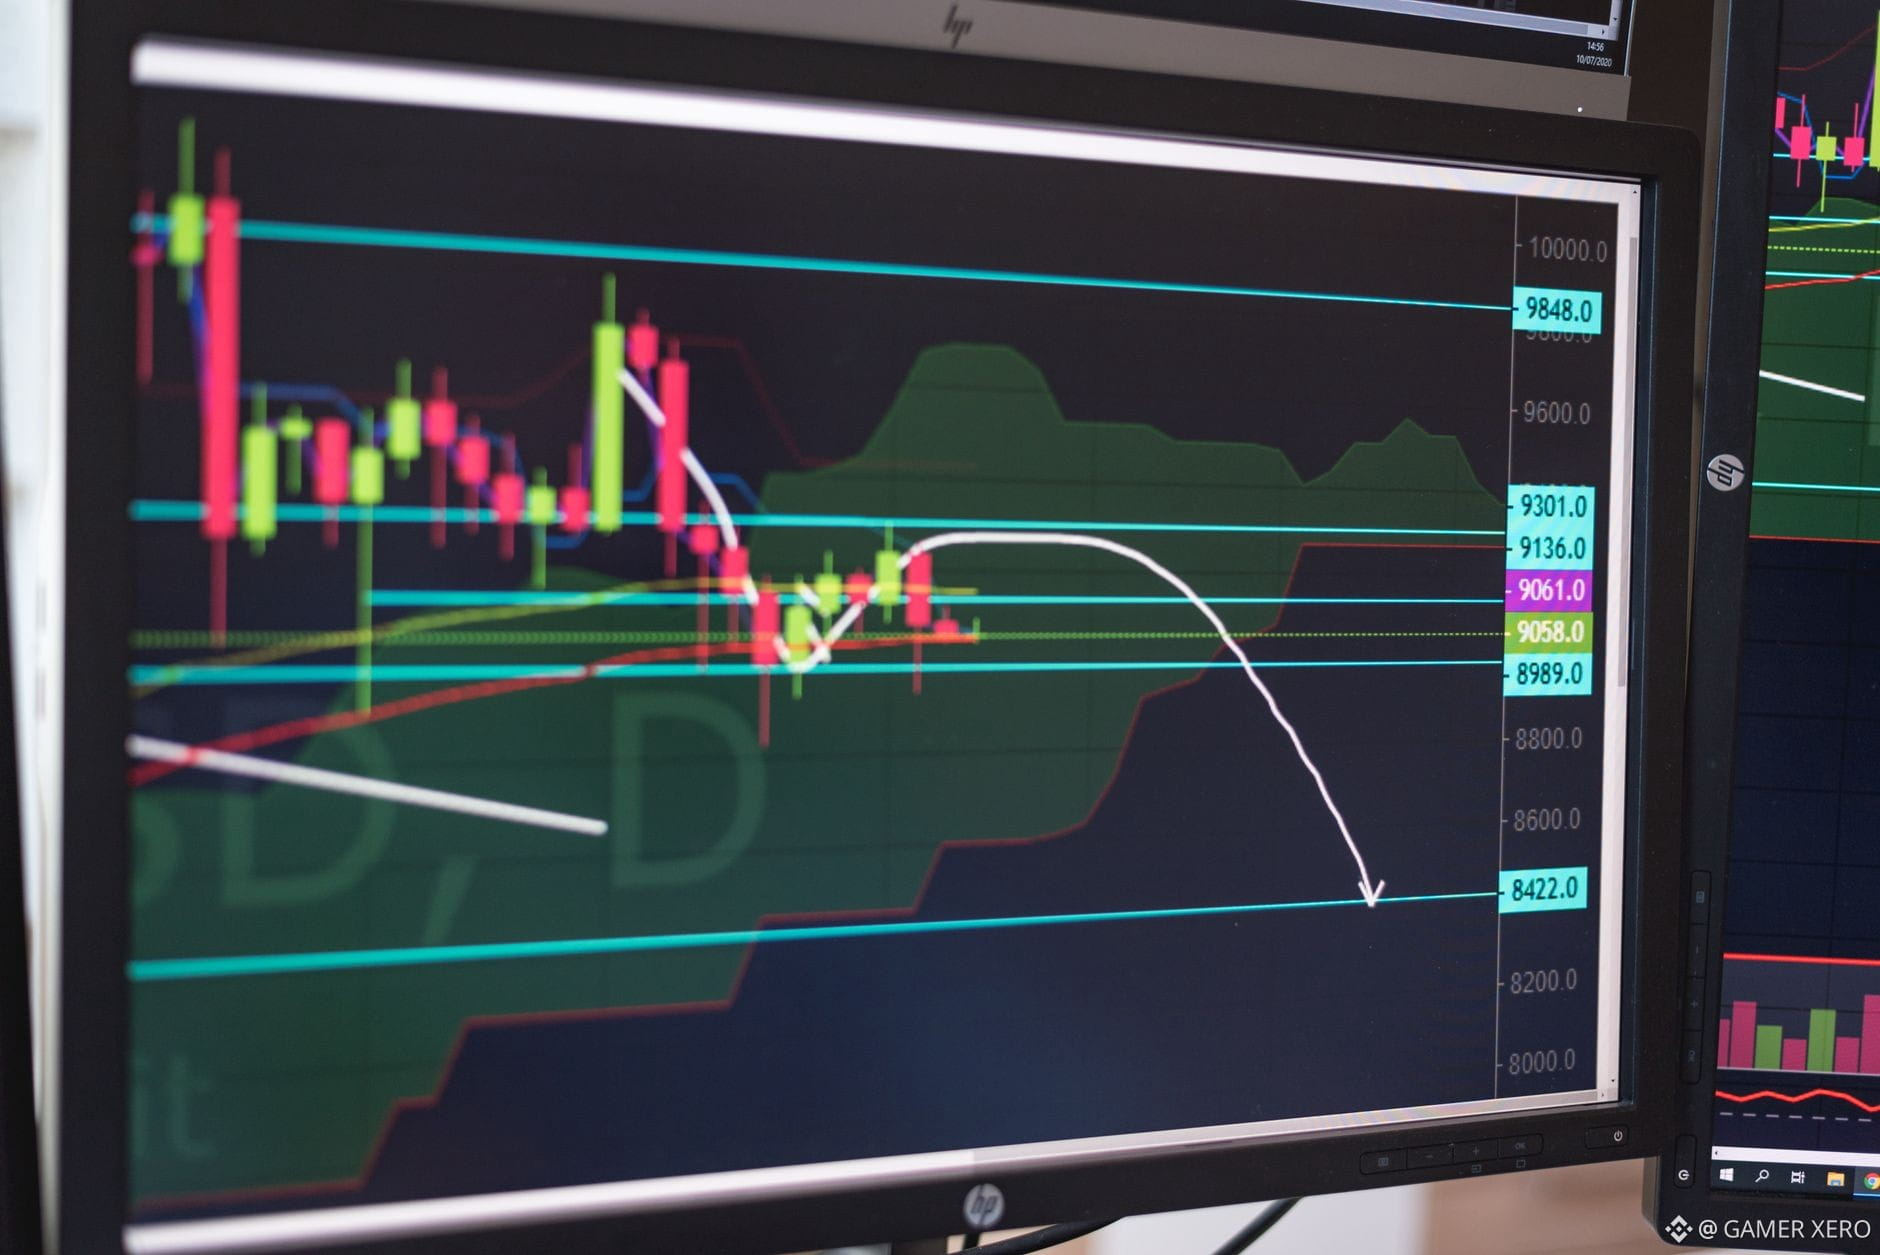
Ver a $BTC sentado en 78.644 dólares con un rango de 24 horas de 77.000 a 79.400 dólares, el libro de órdenes ofrece una verificación rápida de salud. Abre la vista de profundidad en Binance y compara el volumen total de compra en los niveles de mejor precio con el volumen total de venta; eso es el Desequilibrio del Libro de Órdenes (OBI). Si las compras superan a las ventas, el OBI es positivo y los traders a menudo lo interpretan como una presión compradora a corto plazo; un OBI negativo sugiere que los vendedores tienen el control.
Ahora mismo, los 5 niveles de precio principales del lado de la compra concentran aproximadamente 1,2 B de dólares en BTC, mientras que la misma profundidad del lado de la venta muestra alrededor de 950 M. Eso se traduce en un OBI de (+12 %). En la práctica, un desequilibrio positivo moderado como este puede empujar el precio hacia el borde superior del rango, especialmente cuando el mercado está relativamente tranquilo. En cambio, un giro repentino hacia un OBI negativo normalmente precedería una corrección hacia el límite inferior.
Seguir el OBI día a día te ayuda a evaluar si la postura actual del mercado está más cargada de demanda o de oferta sin depender solo de la acción del precio. ¿Has detectado algún cambio de OBI que haya coincidido con movimientos a corto plazo en tu propia operativa?
#CryptoTools #OrderBook #TradingInsights #GAMERXERO
Ver a $BTC sentado en 78.644 dólares con un rango de 24 horas de 77.000 a 79.400 dólares, el libro de órdenes ofrece una verificación rápida de salud. Abre la vista de profundidad en Binance y compara el volumen total de compra en los niveles de mejor precio con el volumen total de venta; eso es el Desequilibrio del Libro de Órdenes (OBI). Si las compras superan a las ventas, el OBI es positivo y los traders a menudo lo interpretan como una presión compradora a corto plazo; un OBI negativo sugiere que los vendedores tienen el control.
Ahora mismo, los 5 niveles de precio principales del lado de la compra concentran aproximadamente 1,2 B de dólares en BTC, mientras que la misma profundidad del lado de la venta muestra alrededor de 950 M. Eso se traduce en un OBI de (+12 %). En la práctica, un desequilibrio positivo moderado como este puede empujar el precio hacia el borde superior del rango, especialmente cuando el mercado está relativamente tranquilo. En cambio, un giro repentino hacia un OBI negativo normalmente precedería una corrección hacia el límite inferior.
Seguir el OBI día a día te ayuda a evaluar si la postura actual del mercado está más cargada de demanda o de oferta sin depender solo de la acción del precio. ¿Has detectado algún cambio de OBI que haya coincidido con movimientos a corto plazo en tu propia operativa?
#CryptoTools #OrderBook #TradingInsights #GAMERXERO
Ahora mismo, los 5 niveles de precio principales del lado de la compra concentran aproximadamente 1,2 B de dólares en BTC, mientras que la misma profundidad del lado de la venta muestra alrededor de 950 M. Eso se traduce en un OBI de (+12 %). En la práctica, un desequilibrio positivo moderado como este puede empujar el precio hacia el borde superior del rango, especialmente cuando el mercado está relativamente tranquilo. En cambio, un giro repentino hacia un OBI negativo normalmente precedería una corrección hacia el límite inferior.
Seguir el OBI día a día te ayuda a evaluar si la postura actual del mercado está más cargada de demanda o de oferta sin depender solo de la acción del precio. ¿Has detectado algún cambio de OBI que haya coincidido con movimientos a corto plazo en tu propia operativa?
#CryptoTools #OrderBook #TradingInsights #GAMERXERO
15
·
--
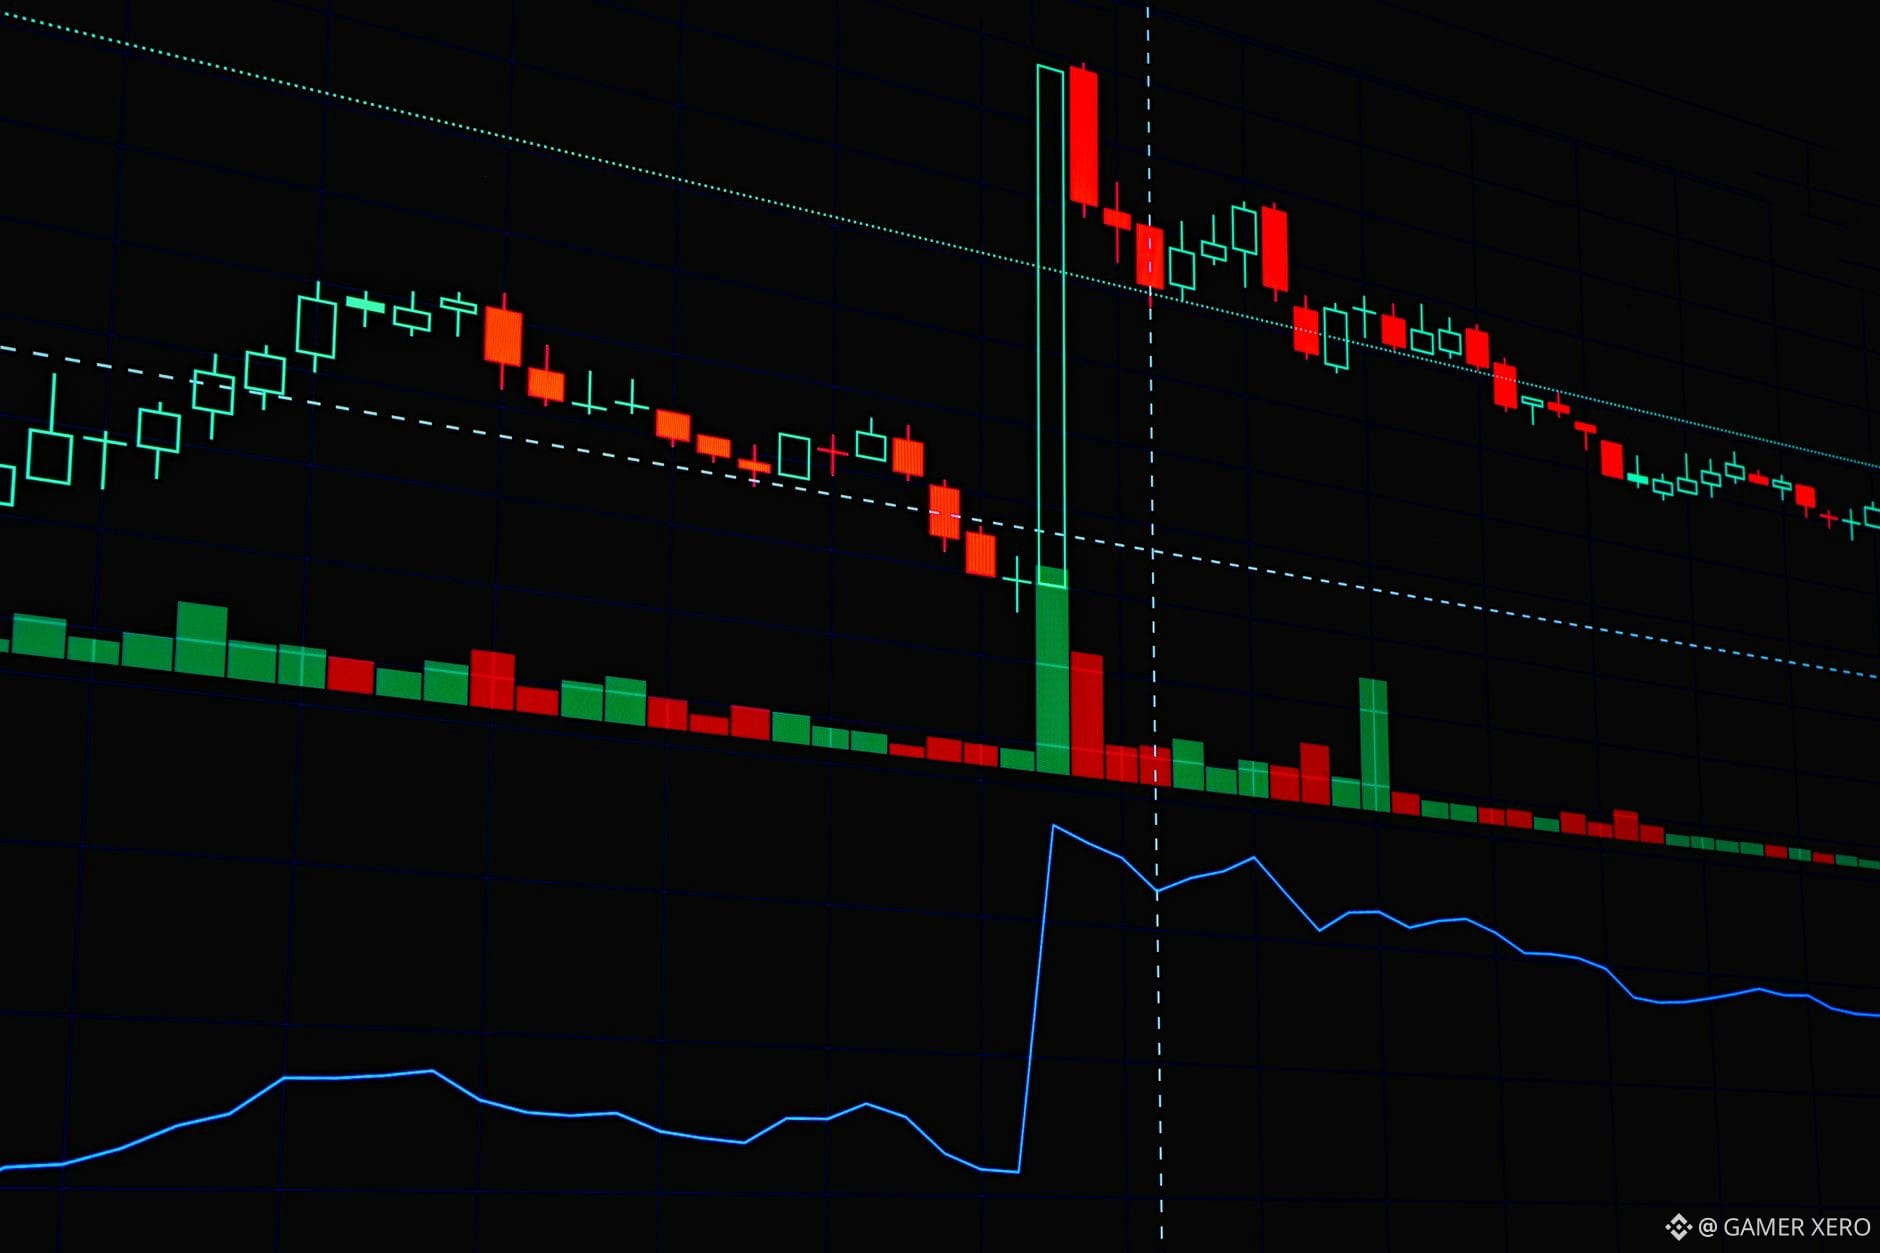
Viendo $BTC trade alrededor de $78,008 con el rango de 24 horas apretado entre $77,000 y $79,400, esto resalta un mercado clásico “limitado por rango”. En ese entorno, el desequilibrio del libro de órdenes (OBI) se convierte en una señal útil: mide el volumen neto en el lado de la oferta (bid) frente al de demanda (ask) en los mejores niveles de precio. Cuando las ofertas superan a las demandas, la presión compradora aumenta y el precio a menudo tiende a subir un poco; lo contrario sugiere una corrección a corto plazo.
Usar OBI te permite que la propia dinámica de oferta-demanda del mercado guíe tu operación, en lugar de adivinar la dirección del precio. ¿Has intentado leer el gráfico de profundidad antes de hacer un movimiento y qué notaste sobre su fiabilidad?
#CryptoEducation #OrderBook #TradingTips #GAMERXERO
Viendo $BTC trade alrededor de $78,008 con el rango de 24 horas apretado entre $77,000 y $79,400, esto resalta un mercado clásico “limitado por rango”. En ese entorno, el desequilibrio del libro de órdenes (OBI) se convierte en una señal útil: mide el volumen neto en el lado de la oferta (bid) frente al de demanda (ask) en los mejores niveles de precio. Cuando las ofertas superan a las demandas, la presión compradora aumenta y el precio a menudo tiende a subir un poco; lo contrario sugiere una corrección a corto plazo.
Usar OBI te permite que la propia dinámica de oferta-demanda del mercado guíe tu operación, en lugar de adivinar la dirección del precio. ¿Has intentado leer el gráfico de profundidad antes de hacer un movimiento y qué notaste sobre su fiabilidad?
#CryptoEducation #OrderBook #TradingTips #GAMERXERO
Usar OBI te permite que la propia dinámica de oferta-demanda del mercado guíe tu operación, en lugar de adivinar la dirección del precio. ¿Has intentado leer el gráfico de profundidad antes de hacer un movimiento y qué notaste sobre su fiabilidad?
#CryptoEducation #OrderBook #TradingTips #GAMERXERO
50

·
--
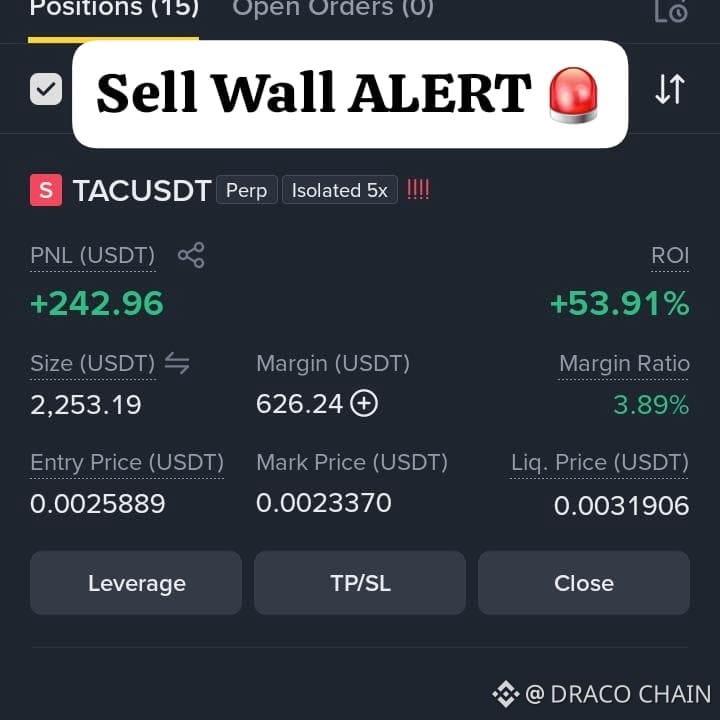
🚨 DENSIDAD DE LIQUIDEZ DE VENTA ABUNDANTE ADELANTE PARA $TAC AT $0.002342! 📉
El análisis de la profundidad del libro de órdenes revela un denso clúster de suministro acumulándose alrededor del nivel de $0.002342 para $TAC . 📊 Este muro de venta representa un bloque concentrado de oferta que los compradores agresivos deben absorber por completo para desbloquear una expansión estructural superior más allá de $0.002343.
🔍 Si el volumen del lado comprador no tiene el impulso para atravesar este desequilibrio del libro de órdenes, espera que el dinero inteligente provoque un retroceso local controlado para buscar liquidez de demanda más profunda. 💡 Monitorear la cinta para ver la absorción en tiempo real en este pivote será crucial para confirmar la inclinación direccional.
💬 ¿Crees que los compradores absorberán este muro de oferta sin problemas, o nos dirigimos hacia un rechazo? 👇
⚠️ No es asesoramiento financiero. Gestiona siempre tu riesgo. 🛡️
🏷️ #TAC #OrderBook #MarketStructure #Crypto
🎯 🦈
🚨 DENSIDAD DE LIQUIDEZ DE VENTA ABUNDANTE ADELANTE PARA $TAC AT $0.002342! 📉
El análisis de la profundidad del libro de órdenes revela un denso clúster de suministro acumulándose alrededor del nivel de $0.002342 para $TAC . 📊 Este muro de venta representa un bloque concentrado de oferta que los compradores agresivos deben absorber por completo para desbloquear una expansión estructural superior más allá de $0.002343.
🔍 Si el volumen del lado comprador no tiene el impulso para atravesar este desequilibrio del libro de órdenes, espera que el dinero inteligente provoque un retroceso local controlado para buscar liquidez de demanda más profunda. 💡 Monitorear la cinta para ver la absorción en tiempo real en este pivote será crucial para confirmar la inclinación direccional.
💬 ¿Crees que los compradores absorberán este muro de oferta sin problemas, o nos dirigimos hacia un rechazo? 👇
⚠️ No es asesoramiento financiero. Gestiona siempre tu riesgo. 🛡️
🏷️ #TAC #OrderBook #MarketStructure #Crypto
🎯 🦈
El análisis de la profundidad del libro de órdenes revela un denso clúster de suministro acumulándose alrededor del nivel de $0.002342 para $TAC . 📊 Este muro de venta representa un bloque concentrado de oferta que los compradores agresivos deben absorber por completo para desbloquear una expansión estructural superior más allá de $0.002343.
🔍 Si el volumen del lado comprador no tiene el impulso para atravesar este desequilibrio del libro de órdenes, espera que el dinero inteligente provoque un retroceso local controlado para buscar liquidez de demanda más profunda. 💡 Monitorear la cinta para ver la absorción en tiempo real en este pivote será crucial para confirmar la inclinación direccional.
💬 ¿Crees que los compradores absorberán este muro de oferta sin problemas, o nos dirigimos hacia un rechazo? 👇
⚠️ No es asesoramiento financiero. Gestiona siempre tu riesgo. 🛡️
🏷️ #TAC #OrderBook #MarketStructure #Crypto
🎯 🦈
91
Inicia sesión para explorar más contenidos
Únete a usuarios globales de criptomonedas en Binance Square
⚡️ Obtén información útil y actualizada sobre criptos.
💬 Avalado por el mayor exchange de criptomonedas en el mundo.
👍 Descubre perspectivas reales de creadores verificados.
Email/número de teléfono
Temas populares
1
#AppleDebutsFoldablePhone
6,739 vistas
182 están debatiendo
2
#US10YTreasuryYieldHitsHighestSinceNov2023
10,908 vistas
223 están debatiendo
3
#USTreasuryToBuyBackUpTo$6BLongDatedDebt
10,496 vistas
140 están debatiendo
4
#BitcoinSurpasses$79K
58,150 vistas
260 están debatiendo
5
#BrentCrudeTops$100
113,518 vistas
386 están debatiendo
6
#USADPWeeklyEmploymentRises12000
91,370 vistas
1,135 están debatiendo
7
#BankOfAmericaGroupPilotsUSBDCStablecoin
67,743 vistas
912 están debatiendo
8
#RippleLobbiesToAdvanceCLARITYActVote
101,900 vistas
1,182 están debatiendo
9
#GrayscaleZcashETFTops$500M
16,534 vistas
125 están debatiendo
10
#LAPTOPFoundationXAccountSuspended
6,762 vistas
113 están debatiendo