

#cryptota
cryptota
799,595 vistas
5,250 están debatiendo
Hot
Lo último

·
--
Imagínate esto: una obstinada línea de tendencia descendente frenando cada rebote durante semanas, tal como vimos con $ADA antes de su expansión anterior.
Muchos hemos sentido la frustración de esperar la confirmación perfecta y terminar perdiéndonos el movimiento, o de entrar en la ruptura y acabar con el stop activado cuando resulta ser una falsa ruptura. No saber si aguantar durante la prueba de $0.65 o tomar ganancias antes es lo que separa a las cuentas que crecen de las que se desangran.
Si los alcistas finalmente rompen esa línea de tendencia y recuperan los $0.63, podríamos ver los $0.65 y $0.66 casi de inmediato. Esa fue una zona clave en configuraciones similares de $XRP, donde mantenerse por encima sentó las bases para el siguiente tramo.
Si los compradores realmente la defienden y el impulso se afianza en vez de estancarse, los $0.70 entran en juego. Recuerda cómo $SOL superó varias resistencias consecutivas tras romper su propia línea de tendencia el año pasado.
¿Hacia dónde creen que irá desde aquí si el volumen confirma la recuperación?
#CryptoTA #Altcoins #TradingSetup
Imagínate esto: una obstinada línea de tendencia descendente frenando cada rebote durante semanas, tal como vimos con $ADA antes de su expansión anterior.
Muchos hemos sentido la frustración de esperar la confirmación perfecta y terminar perdiéndonos el movimiento, o de entrar en la ruptura y acabar con el stop activado cuando resulta ser una falsa ruptura. No saber si aguantar durante la prueba de $0.65 o tomar ganancias antes es lo que separa a las cuentas que crecen de las que se desangran.
Si los alcistas finalmente rompen esa línea de tendencia y recuperan los $0.63, podríamos ver los $0.65 y $0.66 casi de inmediato. Esa fue una zona clave en configuraciones similares de $XRP , donde mantenerse por encima sentó las bases para el siguiente tramo.
Si los compradores realmente la defienden y el impulso se afianza en vez de estancarse, los $0.70 entran en juego. Recuerda cómo $SOL superó varias resistencias consecutivas tras romper su propia línea de tendencia el año pasado.
¿Hacia dónde creen que irá desde aquí si el volumen confirma la recuperación?
#CryptoTA #Altcoins #TradingSetup
Muchos hemos sentido la frustración de esperar la confirmación perfecta y terminar perdiéndonos el movimiento, o de entrar en la ruptura y acabar con el stop activado cuando resulta ser una falsa ruptura. No saber si aguantar durante la prueba de $0.65 o tomar ganancias antes es lo que separa a las cuentas que crecen de las que se desangran.
Si los alcistas finalmente rompen esa línea de tendencia y recuperan los $0.63, podríamos ver los $0.65 y $0.66 casi de inmediato. Esa fue una zona clave en configuraciones similares de $XRP , donde mantenerse por encima sentó las bases para el siguiente tramo.
Si los compradores realmente la defienden y el impulso se afianza en vez de estancarse, los $0.70 entran en juego. Recuerda cómo $SOL superó varias resistencias consecutivas tras romper su propia línea de tendencia el año pasado.
¿Hacia dónde creen que irá desde aquí si el volumen confirma la recuperación?
#CryptoTA #Altcoins #TradingSetup
5

·
--
Defensa del suelo: $COVENANT mantiene la línea 🛡️
Evolución del precio: $COVENANT cotiza a $0.0845 en Binance Spot (COVENANT/USDT), con una subida del 0.9 % en las últimas 24 h. El token se ha estabilizado tras una breve caída desde los $0.092 a principios de esta semana, lo que sugiere que los compradores están entrando mientras el mercado se mantiene neutral.
Niveles clave: El soporte inmediato se sitúa en $0.0800, un número redondo que anteriormente ha absorbido la presión vendedora. Se identifica un punto pivote intermedio cerca de $0.0860, que podría ofrecer una zona de rebote. La resistencia se concentra en torno a $0.0900, con la siguiente barrera alcista en $0.0950, nivel donde se frenaron retrocesos anteriores.
Perspectiva: Desde el punto de vista de la defensa del soporte, la prueba crucial es si los compradores pueden mantener el suelo de $0.0800. Si se sostiene con firmeza, el precio podría volver a probar el pivote de $0.0860 y desafiar la resistencia de $0.0900. Por el contrario, una caída por debajo de $0.0800 podría abrir el camino a descensos más profundos hacia $0.0725. Vigilar el volumen y la profundidad del libro de órdenes será clave para evaluar el compromiso de los compradores.
#CryptoTA #SupportDefense #BinanceSpot
Defensa del suelo: $COVENANT mantiene la línea 🛡️
Evolución del precio: $COVENANT cotiza a $0.0845 en Binance Spot (COVENANT/USDT), con una subida del 0.9 % en las últimas 24 h. El token se ha estabilizado tras una breve caída desde los $0.092 a principios de esta semana, lo que sugiere que los compradores están entrando mientras el mercado se mantiene neutral.
Niveles clave: El soporte inmediato se sitúa en $0.0800, un número redondo que anteriormente ha absorbido la presión vendedora. Se identifica un punto pivote intermedio cerca de $0.0860, que podría ofrecer una zona de rebote. La resistencia se concentra en torno a $0.0900, con la siguiente barrera alcista en $0.0950, nivel donde se frenaron retrocesos anteriores.
Perspectiva: Desde el punto de vista de la defensa del soporte, la prueba crucial es si los compradores pueden mantener el suelo de $0.0800. Si se sostiene con firmeza, el precio podría volver a probar el pivote de $0.0860 y desafiar la resistencia de $0.0900. Por el contrario, una caída por debajo de $0.0800 podría abrir el camino a descensos más profundos hacia $0.0725. Vigilar el volumen y la profundidad del libro de órdenes será clave para evaluar el compromiso de los compradores.
#CryptoTA #SupportDefense #BinanceSpot
Evolución del precio: $COVENANT cotiza a $0.0845 en Binance Spot (COVENANT/USDT), con una subida del 0.9 % en las últimas 24 h. El token se ha estabilizado tras una breve caída desde los $0.092 a principios de esta semana, lo que sugiere que los compradores están entrando mientras el mercado se mantiene neutral.
Niveles clave: El soporte inmediato se sitúa en $0.0800, un número redondo que anteriormente ha absorbido la presión vendedora. Se identifica un punto pivote intermedio cerca de $0.0860, que podría ofrecer una zona de rebote. La resistencia se concentra en torno a $0.0900, con la siguiente barrera alcista en $0.0950, nivel donde se frenaron retrocesos anteriores.
Perspectiva: Desde el punto de vista de la defensa del soporte, la prueba crucial es si los compradores pueden mantener el suelo de $0.0800. Si se sostiene con firmeza, el precio podría volver a probar el pivote de $0.0860 y desafiar la resistencia de $0.0900. Por el contrario, una caída por debajo de $0.0800 podría abrir el camino a descensos más profundos hacia $0.0725. Vigilar el volumen y la profundidad del libro de órdenes será clave para evaluar el compromiso de los compradores.
#CryptoTA #SupportDefense #BinanceSpot
83

·
--
Alcista
Optimism ($OP) se está moviendo. Esto es lo que muestran los datos ahora mismo:
📈 Acción del precio: OP subió un +9,2 % en 24 h y recuperó su EMA 200 diaria, un indicador clave de tendencia. El precio se mantiene por encima de $0.148 después de abrir en $0.1586.
📊 Configuración técnica:
· Cruce de medias móviles: La MA5 ($0.1427) cruzó por encima de la MA20 ($0.13728): se está formando una estructura alcista a corto plazo
· MACD: Histograma en +0.001041, mantiene el impulso positivo
· RSI: En 65.5, acercándose a territorio de sobrecompra: zona de cautela
· Interés abierto: Subió un 17.25 % hasta aproximadamente $107.82M, lo que sugiere la entrada de nuevo capital
⚠️ Qué observar: Si OP se mantiene por encima de $0.148, la próxima resistencia está cerca de $0.16. Un rechazo en este nivel podría hacer que vuelva a probar la EMA 200, en torno a $0.135. Un RSI cercano a la sobrecompra indica que el movimiento podría estar extendiéndose, aunque no está garantizado.
Mi opinión: La estructura está mejorando, pero una sola vela verde no confirma un cambio de tendencia. Observa si el volumen se mantiene y si el cierre diario supera los $0.155.
Esto no es asesoramiento financiero. Investiga siempre por tu cuenta.
$OP #Layer2s #CryptoTA
Optimism ($OP ) se está moviendo. Esto es lo que muestran los datos ahora mismo:
📈 Acción del precio: OP subió un +9,2 % en 24 h y recuperó su EMA 200 diaria, un indicador clave de tendencia. El precio se mantiene por encima de $0.148 después de abrir en $0.1586.
📊 Configuración técnica:
· Cruce de medias móviles: La MA5 ($0.1427) cruzó por encima de la MA20 ($0.13728): se está formando una estructura alcista a corto plazo
· MACD: Histograma en +0.001041, mantiene el impulso positivo
· RSI: En 65.5, acercándose a territorio de sobrecompra: zona de cautela
· Interés abierto: Subió un 17.25 % hasta aproximadamente $107.82M, lo que sugiere la entrada de nuevo capital
⚠️ Qué observar: Si OP se mantiene por encima de $0.148, la próxima resistencia está cerca de $0.16. Un rechazo en este nivel podría hacer que vuelva a probar la EMA 200, en torno a $0.135. Un RSI cercano a la sobrecompra indica que el movimiento podría estar extendiéndose, aunque no está garantizado.
Mi opinión: La estructura está mejorando, pero una sola vela verde no confirma un cambio de tendencia. Observa si el volumen se mantiene y si el cierre diario supera los $0.155.
Esto no es asesoramiento financiero. Investiga siempre por tu cuenta.
$OP #Layer2s #CryptoTA
📈 Acción del precio: OP subió un +9,2 % en 24 h y recuperó su EMA 200 diaria, un indicador clave de tendencia. El precio se mantiene por encima de $0.148 después de abrir en $0.1586.
📊 Configuración técnica:
· Cruce de medias móviles: La MA5 ($0.1427) cruzó por encima de la MA20 ($0.13728): se está formando una estructura alcista a corto plazo
· MACD: Histograma en +0.001041, mantiene el impulso positivo
· RSI: En 65.5, acercándose a territorio de sobrecompra: zona de cautela
· Interés abierto: Subió un 17.25 % hasta aproximadamente $107.82M, lo que sugiere la entrada de nuevo capital
⚠️ Qué observar: Si OP se mantiene por encima de $0.148, la próxima resistencia está cerca de $0.16. Un rechazo en este nivel podría hacer que vuelva a probar la EMA 200, en torno a $0.135. Un RSI cercano a la sobrecompra indica que el movimiento podría estar extendiéndose, aunque no está garantizado.
Mi opinión: La estructura está mejorando, pero una sola vela verde no confirma un cambio de tendencia. Observa si el volumen se mantiene y si el cierre diario supera los $0.155.
Esto no es asesoramiento financiero. Investiga siempre por tu cuenta.
$OP #Layer2s #CryptoTA

141

·
--
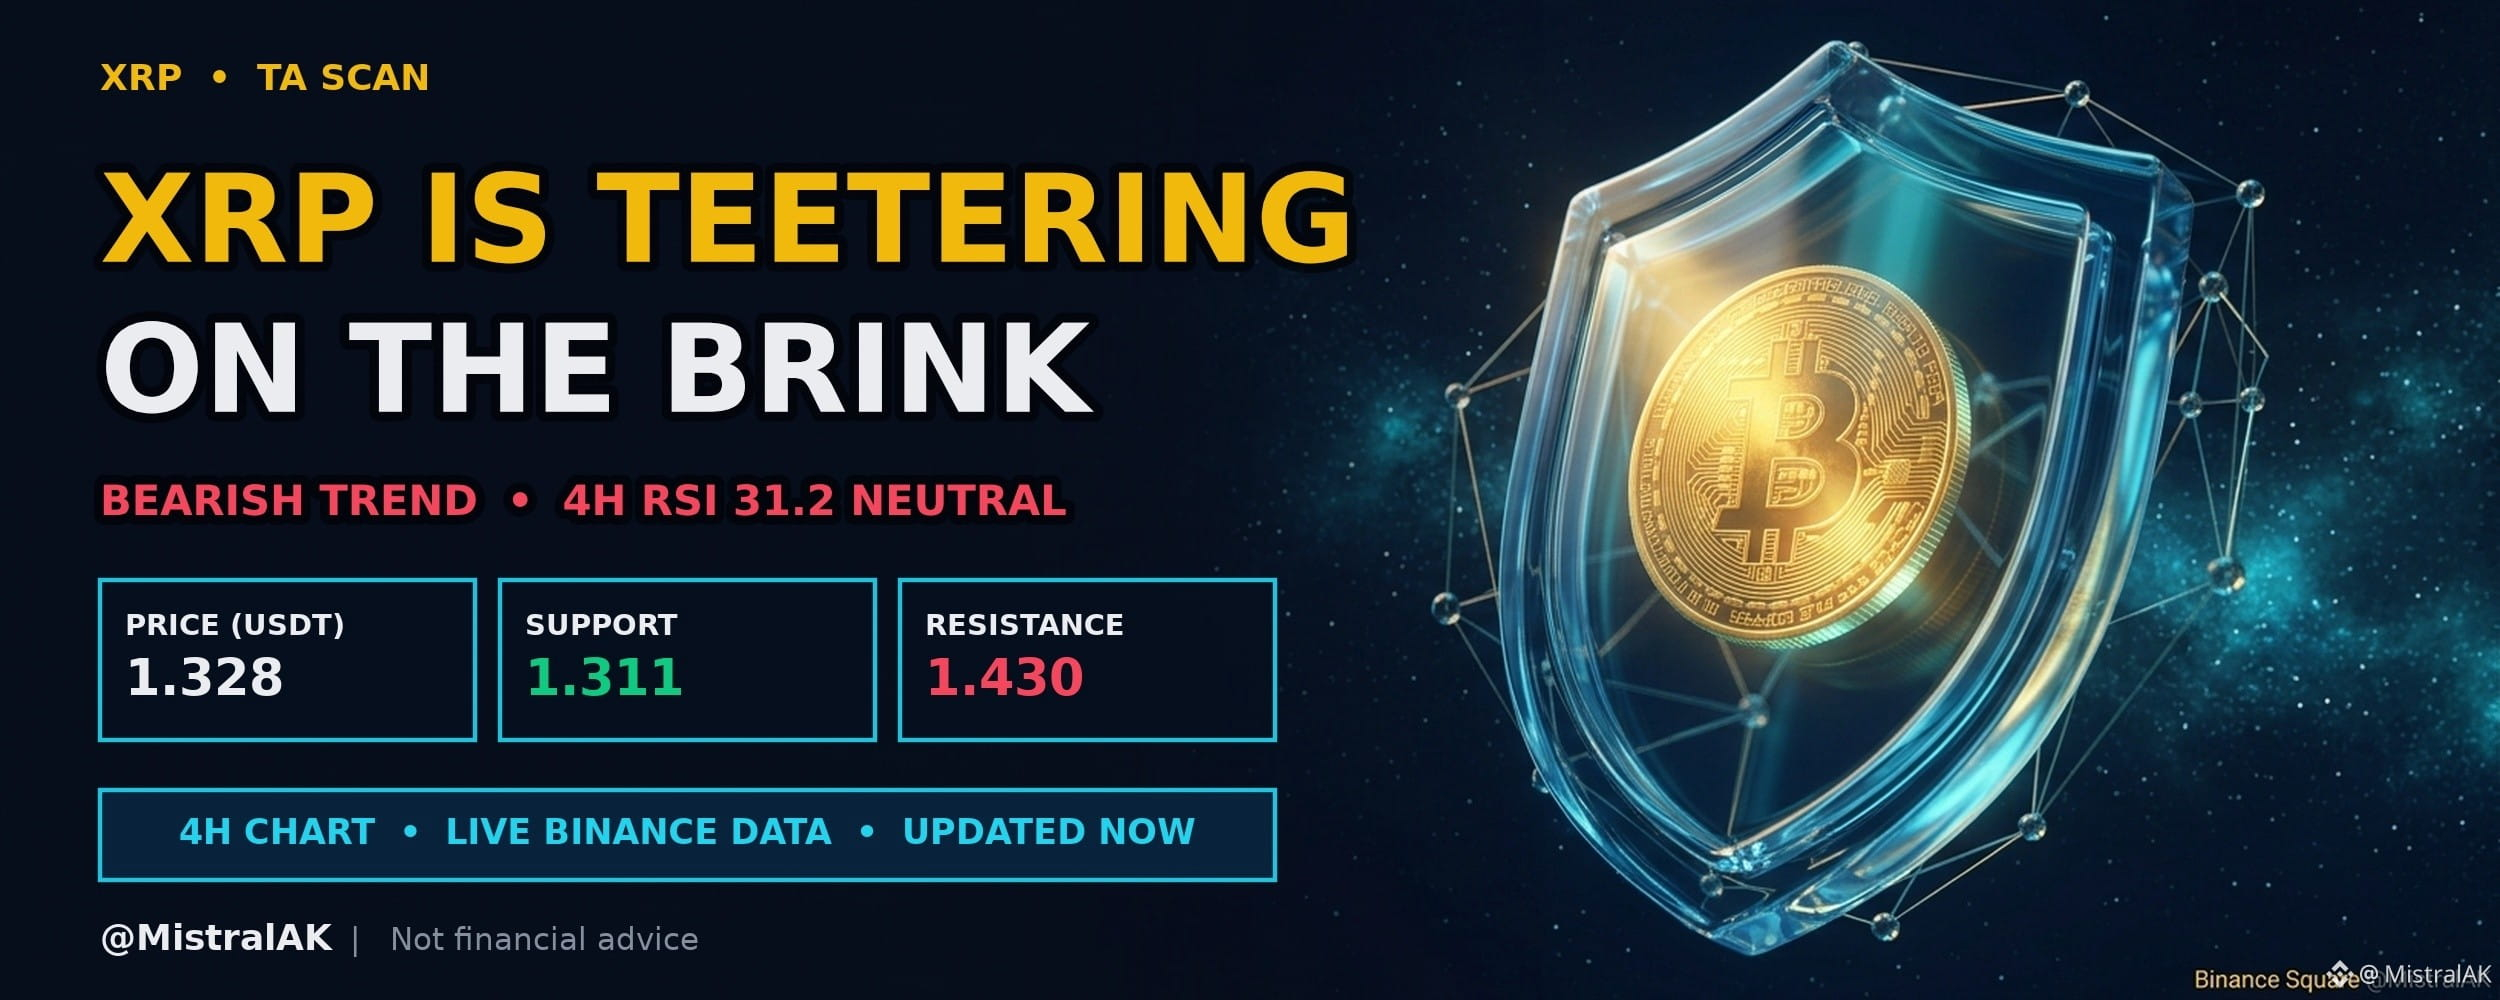
XRP ESTÁ AL BORDE DE UNA RUPTURA ALCISTA
ANÁLISIS TÉCNICO
▪️ El RSI de 4H en 31.2 señala condiciones de sobreventa extrema y apunta a una inminente reversión alcista del impulso.
▪️ El precio está por debajo de la EMA 20 (1.3712) y la EMA 50 (1.4001), lo que confirma una estructura bajista a corto plazo.
▪️ El soporte clave en 1.3112 actúa como nivel mínimo crítico; mantenerse por encima podría desencadenar un rápido rebote.
ESCENARIOS DE OPERACIÓN
▪️ Ruptura alcista: Si el precio recupera 1.4001, se espera un rápido avance hacia la zona de resistencia de 1.43.
▪️ Rechazo bajista: No mantenerse por encima de 1.3112 abre la puerta a una corrección más profunda, por debajo de niveles psicológicos clave.
▪️ Rango de consolidación: El precio podría oscilar entre 1.3112 y 1.3712, acumulando impulso para el próximo movimiento direccional.
PARTICIPA
¿Crees que $XR P superará con fuerza la resistencia de 1.43 o volverá a probar primero el soporte de 1.3112? ¡Deja tu pronóstico abajo!
Esto no es asesoramiento financiero. Investiga siempre por tu cuenta (DYOR).
Dale a Me gusta y síguenos para recibir análisis diarios de operaciones y noticias exclusivas. @MistralAK
#XRP #TechnicalAnalysis #CryptoTA
XRP ESTÁ AL BORDE DE UNA RUPTURA ALCISTA
ANÁLISIS TÉCNICO
▪️ El RSI de 4H en 31.2 señala condiciones de sobreventa extrema y apunta a una inminente reversión alcista del impulso.
▪️ El precio está por debajo de la EMA 20 (1.3712) y la EMA 50 (1.4001), lo que confirma una estructura bajista a corto plazo.
▪️ El soporte clave en 1.3112 actúa como nivel mínimo crítico; mantenerse por encima podría desencadenar un rápido rebote.
ESCENARIOS DE OPERACIÓN
▪️ Ruptura alcista: Si el precio recupera 1.4001, se espera un rápido avance hacia la zona de resistencia de 1.43.
▪️ Rechazo bajista: No mantenerse por encima de 1.3112 abre la puerta a una corrección más profunda, por debajo de niveles psicológicos clave.
▪️ Rango de consolidación: El precio podría oscilar entre 1.3112 y 1.3712, acumulando impulso para el próximo movimiento direccional.
PARTICIPA
¿Crees que $XR P superará con fuerza la resistencia de 1.43 o volverá a probar primero el soporte de 1.3112? ¡Deja tu pronóstico abajo!
Esto no es asesoramiento financiero. Investiga siempre por tu cuenta (DYOR).
Dale a Me gusta y síguenos para recibir análisis diarios de operaciones y noticias exclusivas. @MistralAK
#XRP #TechnicalAnalysis #CryptoTA
ANÁLISIS TÉCNICO
▪️ El RSI de 4H en 31.2 señala condiciones de sobreventa extrema y apunta a una inminente reversión alcista del impulso.
▪️ El precio está por debajo de la EMA 20 (1.3712) y la EMA 50 (1.4001), lo que confirma una estructura bajista a corto plazo.
▪️ El soporte clave en 1.3112 actúa como nivel mínimo crítico; mantenerse por encima podría desencadenar un rápido rebote.
ESCENARIOS DE OPERACIÓN
▪️ Ruptura alcista: Si el precio recupera 1.4001, se espera un rápido avance hacia la zona de resistencia de 1.43.
▪️ Rechazo bajista: No mantenerse por encima de 1.3112 abre la puerta a una corrección más profunda, por debajo de niveles psicológicos clave.
▪️ Rango de consolidación: El precio podría oscilar entre 1.3112 y 1.3712, acumulando impulso para el próximo movimiento direccional.
PARTICIPA
¿Crees que $XR P superará con fuerza la resistencia de 1.43 o volverá a probar primero el soporte de 1.3112? ¡Deja tu pronóstico abajo!
Esto no es asesoramiento financiero. Investiga siempre por tu cuenta (DYOR).
Dale a Me gusta y síguenos para recibir análisis diarios de operaciones y noticias exclusivas. @MistralAK
#XRP #TechnicalAnalysis #CryptoTA
1
96
·
--
Ola de Wisp: $WISP pone a prueba nuevos máximos 🌊
Evolución del precio: $WISP/USDT cotiza a $0.0427 en Binance Spot, con una subida del 21.3 % en las últimas 24 horas. El volumen de 24 horas ronda los $12 M, lo que refleja un sólido interés comprador en un contexto de mercado neutral.
Niveles clave: El soporte inmediato se sitúa en $0.0385, mientras que la próxima zona de resistencia está cerca de $0.0470. El nivel pivote del rango se encuentra alrededor de $0.0420, que el par está poniendo a prueba actualmente desde arriba.
Perspectivas: La reciente subida parece haberse extendido demasiado; se recomienda actuar con cautela. Si el precio vuelve a probar el soporte de $0.0385 y se mantiene por encima, el siguiente movimiento podría apuntar a $0.0450. Sin embargo, si no logra mantenerse en ese nivel, podría producirse un retroceso hacia la zona de $0.0350. Los operadores deberían vigilar el volumen y el flujo de órdenes para detectar señales de pérdida de impulso.
#CryptoTA #Wisp #BinanceSpot
Ola de Wisp: $WISP pone a prueba nuevos máximos 🌊
Evolución del precio: $WISP/USDT cotiza a $0.0427 en Binance Spot, con una subida del 21.3 % en las últimas 24 horas. El volumen de 24 horas ronda los $12 M, lo que refleja un sólido interés comprador en un contexto de mercado neutral.
Niveles clave: El soporte inmediato se sitúa en $0.0385, mientras que la próxima zona de resistencia está cerca de $0.0470. El nivel pivote del rango se encuentra alrededor de $0.0420, que el par está poniendo a prueba actualmente desde arriba.
Perspectivas: La reciente subida parece haberse extendido demasiado; se recomienda actuar con cautela. Si el precio vuelve a probar el soporte de $0.0385 y se mantiene por encima, el siguiente movimiento podría apuntar a $0.0450. Sin embargo, si no logra mantenerse en ese nivel, podría producirse un retroceso hacia la zona de $0.0350. Los operadores deberían vigilar el volumen y el flujo de órdenes para detectar señales de pérdida de impulso.
#CryptoTA #Wisp #BinanceSpot
Evolución del precio: $WISP/USDT cotiza a $0.0427 en Binance Spot, con una subida del 21.3 % en las últimas 24 horas. El volumen de 24 horas ronda los $12 M, lo que refleja un sólido interés comprador en un contexto de mercado neutral.
Niveles clave: El soporte inmediato se sitúa en $0.0385, mientras que la próxima zona de resistencia está cerca de $0.0470. El nivel pivote del rango se encuentra alrededor de $0.0420, que el par está poniendo a prueba actualmente desde arriba.
Perspectivas: La reciente subida parece haberse extendido demasiado; se recomienda actuar con cautela. Si el precio vuelve a probar el soporte de $0.0385 y se mantiene por encima, el siguiente movimiento podría apuntar a $0.0450. Sin embargo, si no logra mantenerse en ese nivel, podría producirse un retroceso hacia la zona de $0.0350. Los operadores deberían vigilar el volumen y el flujo de órdenes para detectar señales de pérdida de impulso.
#CryptoTA #Wisp #BinanceSpot
22
·
--
El repunte silencioso de Plume: la vista puesta en la próxima barrera 🌥️
Acción del precio: $PLUME cotiza a $0.022130, con una subida del 16.47 % en las últimas 24 horas y un volumen de $10.5 M. El repunte ha sacado al token de su reciente zona lateral, pero la presión compradora sigue siendo moderada, ya que el sentimiento se mantiene neutral.
Niveles clave: El soporte inmediato se sitúa cerca de $0.0205, con un piso secundario alrededor de $0.0190. La resistencia se encuentra en $0.0240‑$0.0245, mientras que el precio actual actúa como pivote del rango medio en $0.0221. Una ruptura por encima de $0.0240 señalaría un movimiento hacia la siguiente franja alcista; una caída por debajo de $0.0205 podría reabrir la puerta a una corrección más profunda.
Perspectivas: Con el mercado en una postura neutral, es probable que el token se consolide dentro de este rango. Los operadores deberían esperar una ruptura decisiva en cualquier dirección antes de adoptar una tendencia. Se recomienda paciencia y una gestión estricta del riesgo mientras el precio oscila entre los niveles identificados.
#Altcoin #CryptoTA #Plume
El repunte silencioso de Plume: la vista puesta en la próxima barrera 🌥️
Acción del precio: $PLUME cotiza a $0.022130, con una subida del 16.47 % en las últimas 24 horas y un volumen de $10.5 M. El repunte ha sacado al token de su reciente zona lateral, pero la presión compradora sigue siendo moderada, ya que el sentimiento se mantiene neutral.
Niveles clave: El soporte inmediato se sitúa cerca de $0.0205, con un piso secundario alrededor de $0.0190. La resistencia se encuentra en $0.0240‑$0.0245, mientras que el precio actual actúa como pivote del rango medio en $0.0221. Una ruptura por encima de $0.0240 señalaría un movimiento hacia la siguiente franja alcista; una caída por debajo de $0.0205 podría reabrir la puerta a una corrección más profunda.
Perspectivas: Con el mercado en una postura neutral, es probable que el token se consolide dentro de este rango. Los operadores deberían esperar una ruptura decisiva en cualquier dirección antes de adoptar una tendencia. Se recomienda paciencia y una gestión estricta del riesgo mientras el precio oscila entre los niveles identificados.
#Altcoin #CryptoTA #Plume
Acción del precio: $PLUME cotiza a $0.022130, con una subida del 16.47 % en las últimas 24 horas y un volumen de $10.5 M. El repunte ha sacado al token de su reciente zona lateral, pero la presión compradora sigue siendo moderada, ya que el sentimiento se mantiene neutral.
Niveles clave: El soporte inmediato se sitúa cerca de $0.0205, con un piso secundario alrededor de $0.0190. La resistencia se encuentra en $0.0240‑$0.0245, mientras que el precio actual actúa como pivote del rango medio en $0.0221. Una ruptura por encima de $0.0240 señalaría un movimiento hacia la siguiente franja alcista; una caída por debajo de $0.0205 podría reabrir la puerta a una corrección más profunda.
Perspectivas: Con el mercado en una postura neutral, es probable que el token se consolide dentro de este rango. Los operadores deberían esperar una ruptura decisiva en cualquier dirección antes de adoptar una tendencia. Se recomienda paciencia y una gestión estricta del riesgo mientras el precio oscila entre los niveles identificados.
#Altcoin #CryptoTA #Plume
83


·
--
Alcista
$FIL
{future}(FILUSDT)
/USDT — Configuración alcista 🚀
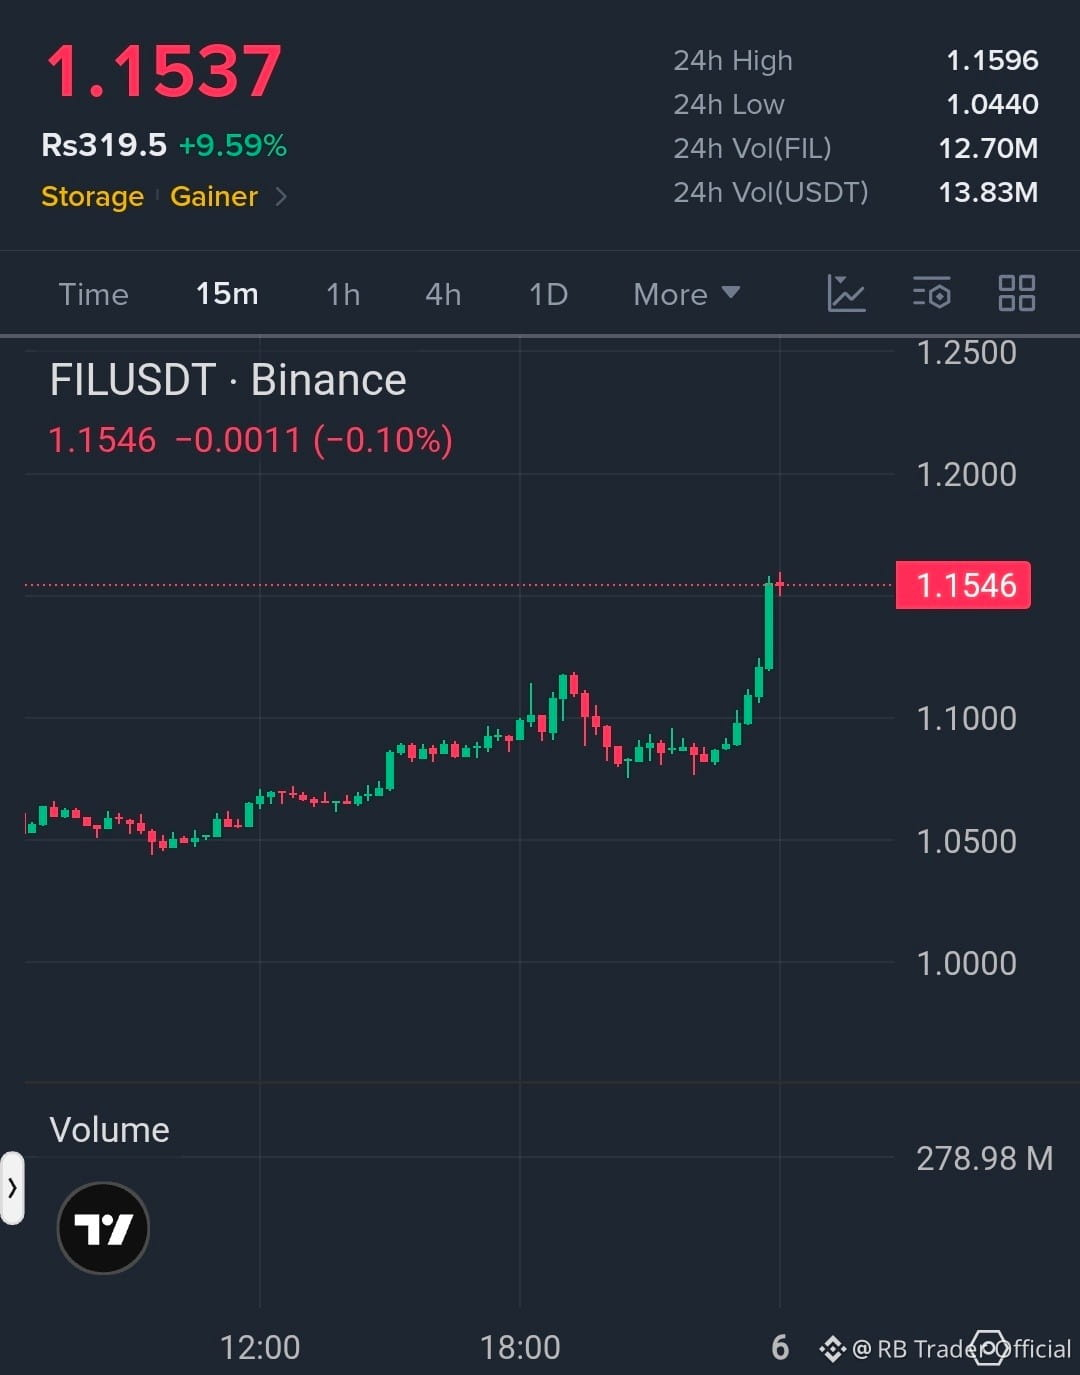
FIL muestra un fuerte impulso alcista y cotiza cerca del máximo de las últimas 24 h.
🟢 Entrada: 1.145–1.155
🎯 TP1: 1.180
🎯 TP2: 1.220
🛑 SL: 1.115
Tendencia: alcista 🔥
Presta atención a una ruptura por encima de 1.160 para un mayor potencial alcista.
#FIL #Filecoin #FILUSDT #Binance #CryptoTA #Alcista$
$FIL
/USDT — Configuración alcista 🚀
FIL muestra un fuerte impulso alcista y cotiza cerca del máximo de las últimas 24 h.
🟢 Entrada: 1.145–1.155
🎯 TP1: 1.180
🎯 TP2: 1.220
🛑 SL: 1.115
Tendencia: alcista 🔥
Presta atención a una ruptura por encima de 1.160 para un mayor potencial alcista.
#FIL #Filecoin #FILUSDT #Binance #CryptoTA #Alcista$
/USDT — Configuración alcista 🚀
FIL muestra un fuerte impulso alcista y cotiza cerca del máximo de las últimas 24 h.
🟢 Entrada: 1.145–1.155
🎯 TP1: 1.180
🎯 TP2: 1.220
🛑 SL: 1.115
Tendencia: alcista 🔥
Presta atención a una ruptura por encima de 1.160 para un mayor potencial alcista.
#FIL #Filecoin #FILUSDT #Binance #CryptoTA #Alcista$
4
1.1k

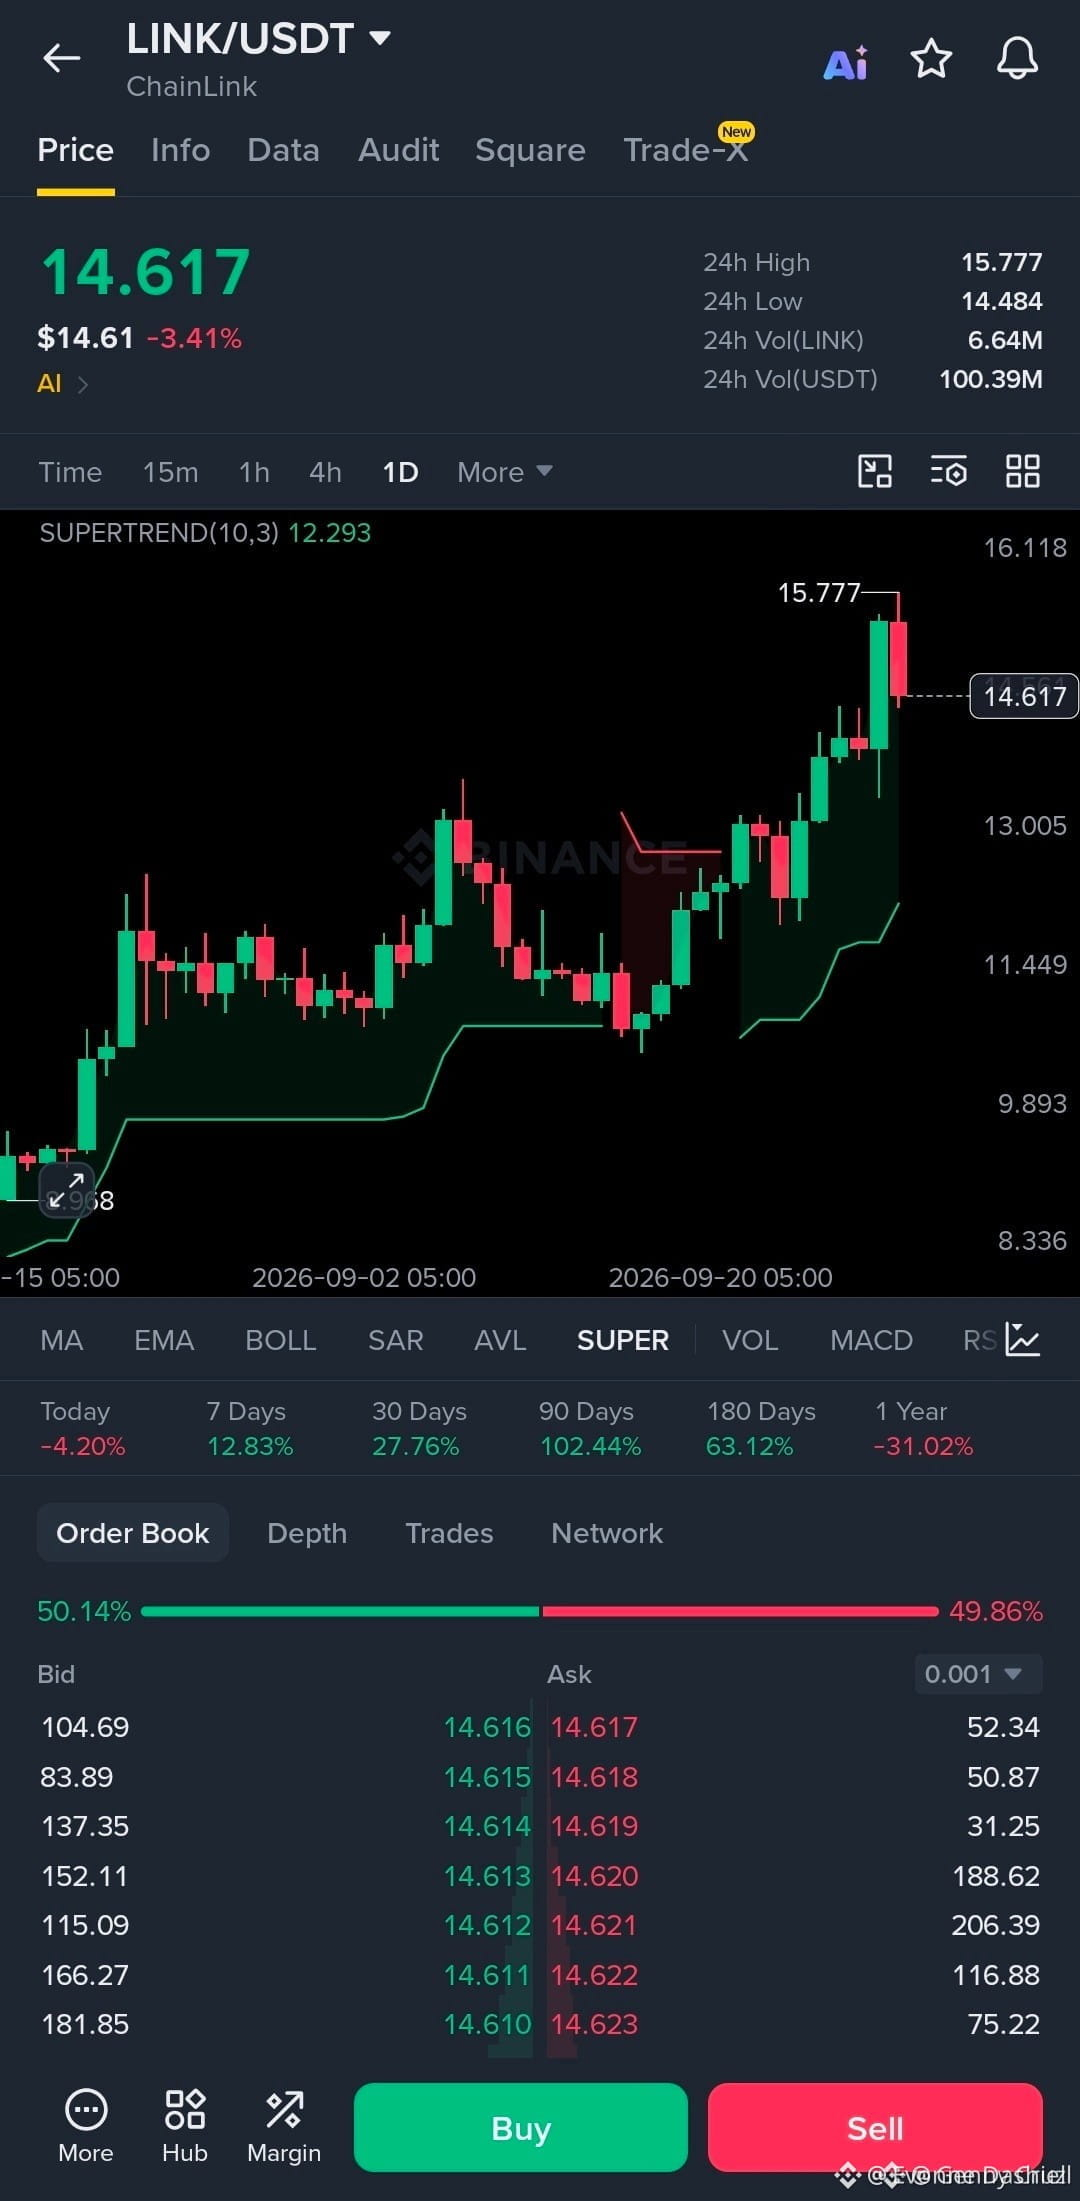
Una ruptura por debajo de $13.50 en $LINK señalaría que el reciente repunte fue solo la onda 1, no el comienzo de una tendencia alcista sostenida.
Los traders siguen comprando cada retroceso pensando que esto es el inicio de algo más grande, pero si no se cuenta la onda, terminas cargando con las pérdidas cuando llega la corrección. Así es como pierdes dinero en algo que parecía una apuesta segura.
El rango de $8.28 a $11.50 todavía está actuando como soporte crucial para $LINK ahora mismo. Es la zona que debe mantenerse para que este rebote dure. Una ruptura decisiva por debajo de $13.50 confirmaría que el máximo de esta onda ya está dentro, lo que a menudo lleva a una retrocesión que rompe los mínimos recientes.
Hemos visto patrones similares cuando $BTC empieza a consolidar y $ETH el volumen se agota. El riesgo es quedar atrapado en una posición que parece segura hasta que deja de serlo.
¿Hacia dónde crees que se dirige esta configuración de $LINK si se rompe ese nivel clave?
#LINK #ElliottWave #CryptoTA
Una ruptura por debajo de $13.50 en $LINK señalaría que el reciente repunte fue solo la onda 1, no el comienzo de una tendencia alcista sostenida.
Los traders siguen comprando cada retroceso pensando que esto es el inicio de algo más grande, pero si no se cuenta la onda, terminas cargando con las pérdidas cuando llega la corrección. Así es como pierdes dinero en algo que parecía una apuesta segura.
El rango de $8.28 a $11.50 todavía está actuando como soporte crucial para $LINK ahora mismo. Es la zona que debe mantenerse para que este rebote dure. Una ruptura decisiva por debajo de $13.50 confirmaría que el máximo de esta onda ya está dentro, lo que a menudo lleva a una retrocesión que rompe los mínimos recientes.
Hemos visto patrones similares cuando $BTC empieza a consolidar y $ETH el volumen se agota. El riesgo es quedar atrapado en una posición que parece segura hasta que deja de serlo.
¿Hacia dónde crees que se dirige esta configuración de $LINK si se rompe ese nivel clave?
#LINK #ElliottWave #CryptoTA
Los traders siguen comprando cada retroceso pensando que esto es el inicio de algo más grande, pero si no se cuenta la onda, terminas cargando con las pérdidas cuando llega la corrección. Así es como pierdes dinero en algo que parecía una apuesta segura.
El rango de $8.28 a $11.50 todavía está actuando como soporte crucial para $LINK ahora mismo. Es la zona que debe mantenerse para que este rebote dure. Una ruptura decisiva por debajo de $13.50 confirmaría que el máximo de esta onda ya está dentro, lo que a menudo lleva a una retrocesión que rompe los mínimos recientes.
Hemos visto patrones similares cuando $BTC empieza a consolidar y $ETH el volumen se agota. El riesgo es quedar atrapado en una posición que parece segura hasta que deja de serlo.
¿Hacia dónde crees que se dirige esta configuración de $LINK si se rompe ese nivel clave?
#LINK #ElliottWave #CryptoTA
22

·
--
$ETH está haciendo en silencio lo que $BTC no puede ahora mismo: sostener en verde. El precio está en $2,686.61, +0.41% en un volumen de $586.81M, mientras que $BTC se estanca en $83,926 (-0.16%) y $SOL se dispara +3.57%. Fuerza relativa, pero en una banda estrecha: esto suena a acumulación, no a ruptura.
En pura acción del precio, ETH se está encogiendo entre el nivel de oferta de $2,650 (soporte intradía repetido) y el clúster de suministro de $2,720–$2,730. El volumen no impresiona frente a los $1.43B de BTC, así que ETH se queda rezagada en la próxima fase expansiva de BTC hasta que recupere $2,730 con expansión. El rendimiento del staking frente a la demanda de apalancamiento importa menos aquí que la estructura: la financiación se mantiene neutral, no hay un long abarrotado para apretar, lo que favorece una subida gradual antes que una cascada.
Nivel clave: $2,650. Si lo pierdes en un cierre diario, el patrón se resuelve hacia abajo hacia $2,580; recupera $2,730 y ETH lidera.
Gestión del riesgo: mantén el tamaño moderado hasta que alguno de los límites se rompa con volumen; el punto medio de este rango es donde las paradas se recortan.
#ETH #ETHUSDT #PriceAction #CryptoTA
$ETH está haciendo en silencio lo que $BTC no puede ahora mismo: sostener en verde. El precio está en $2,686.61, +0.41% en un volumen de $586.81M, mientras que $BTC se estanca en $83,926 (-0.16%) y $SOL se dispara +3.57%. Fuerza relativa, pero en una banda estrecha: esto suena a acumulación, no a ruptura.
En pura acción del precio, ETH se está encogiendo entre el nivel de oferta de $2,650 (soporte intradía repetido) y el clúster de suministro de $2,720–$2,730. El volumen no impresiona frente a los $1.43B de BTC, así que ETH se queda rezagada en la próxima fase expansiva de BTC hasta que recupere $2,730 con expansión. El rendimiento del staking frente a la demanda de apalancamiento importa menos aquí que la estructura: la financiación se mantiene neutral, no hay un long abarrotado para apretar, lo que favorece una subida gradual antes que una cascada.
Nivel clave: $2,650. Si lo pierdes en un cierre diario, el patrón se resuelve hacia abajo hacia $2,580; recupera $2,730 y ETH lidera.
Gestión del riesgo: mantén el tamaño moderado hasta que alguno de los límites se rompa con volumen; el punto medio de este rango es donde las paradas se recortan.
#ETH #ETHUSDT #PriceAction #CryptoTA
En pura acción del precio, ETH se está encogiendo entre el nivel de oferta de $2,650 (soporte intradía repetido) y el clúster de suministro de $2,720–$2,730. El volumen no impresiona frente a los $1.43B de BTC, así que ETH se queda rezagada en la próxima fase expansiva de BTC hasta que recupere $2,730 con expansión. El rendimiento del staking frente a la demanda de apalancamiento importa menos aquí que la estructura: la financiación se mantiene neutral, no hay un long abarrotado para apretar, lo que favorece una subida gradual antes que una cascada.
Nivel clave: $2,650. Si lo pierdes en un cierre diario, el patrón se resuelve hacia abajo hacia $2,580; recupera $2,730 y ETH lidera.
Gestión del riesgo: mantén el tamaño moderado hasta que alguno de los límites se rompa con volumen; el punto medio de este rango es donde las paradas se recortan.
#ETH #ETHUSDT #PriceAction #CryptoTA
121
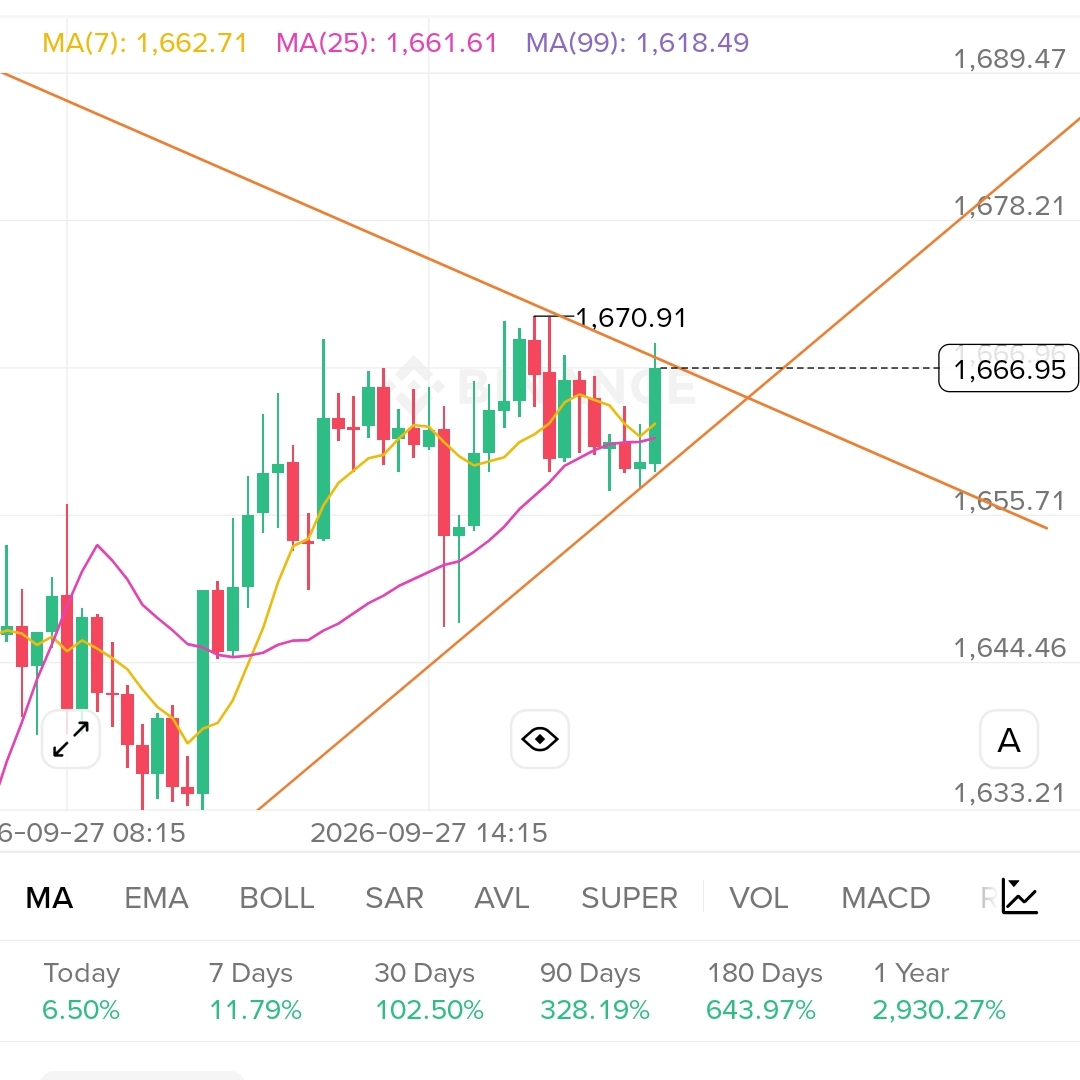
El análisis técnico predice perfectamente los movimientos del precio de las criptomonedas.
Perdí mi camisa con los futuros de ADA y DOGE pensando que había descifrado el código con mis líneas de RSI y MACD. Los gráficos *se veían* tan claros para un impulso, pero un solo gran volcado de una ballena o un titular de última hora puede destruir cualquier patrón perfecto que veas. El AT no es una bola de cristal; es una herramienta para probabilidades, para encontrar posibles operaciones de alta probabilidad y para gestionar tu riesgo con stop-loss. Te ayuda a prepararte para los movimientos, no a predecirlos. ¿Estás usando los gráficos para confirmar tu sesgo o para construir un plan de trading sólido?
#CryptoTA #TradingMistakes #RiskManagement #LearnTheHardWay #FuturesTrading
El análisis técnico predice perfectamente los movimientos del precio de las criptomonedas.
Perdí mi camisa con los futuros de ADA y DOGE pensando que había descifrado el código con mis líneas de RSI y MACD. Los gráficos *se veían* tan claros para un impulso, pero un solo gran volcado de una ballena o un titular de última hora puede destruir cualquier patrón perfecto que veas. El AT no es una bola de cristal; es una herramienta para probabilidades, para encontrar posibles operaciones de alta probabilidad y para gestionar tu riesgo con stop-loss. Te ayuda a prepararte para los movimientos, no a predecirlos. ¿Estás usando los gráficos para confirmar tu sesgo o para construir un plan de trading sólido?
#CryptoTA #TradingMistakes #RiskManagement #LearnTheHardWay #FuturesTrading
Perdí mi camisa con los futuros de ADA y DOGE pensando que había descifrado el código con mis líneas de RSI y MACD. Los gráficos *se veían* tan claros para un impulso, pero un solo gran volcado de una ballena o un titular de última hora puede destruir cualquier patrón perfecto que veas. El AT no es una bola de cristal; es una herramienta para probabilidades, para encontrar posibles operaciones de alta probabilidad y para gestionar tu riesgo con stop-loss. Te ayuda a prepararte para los movimientos, no a predecirlos. ¿Estás usando los gráficos para confirmar tu sesgo o para construir un plan de trading sólido?
#CryptoTA #TradingMistakes #RiskManagement #LearnTheHardWay #FuturesTrading
91

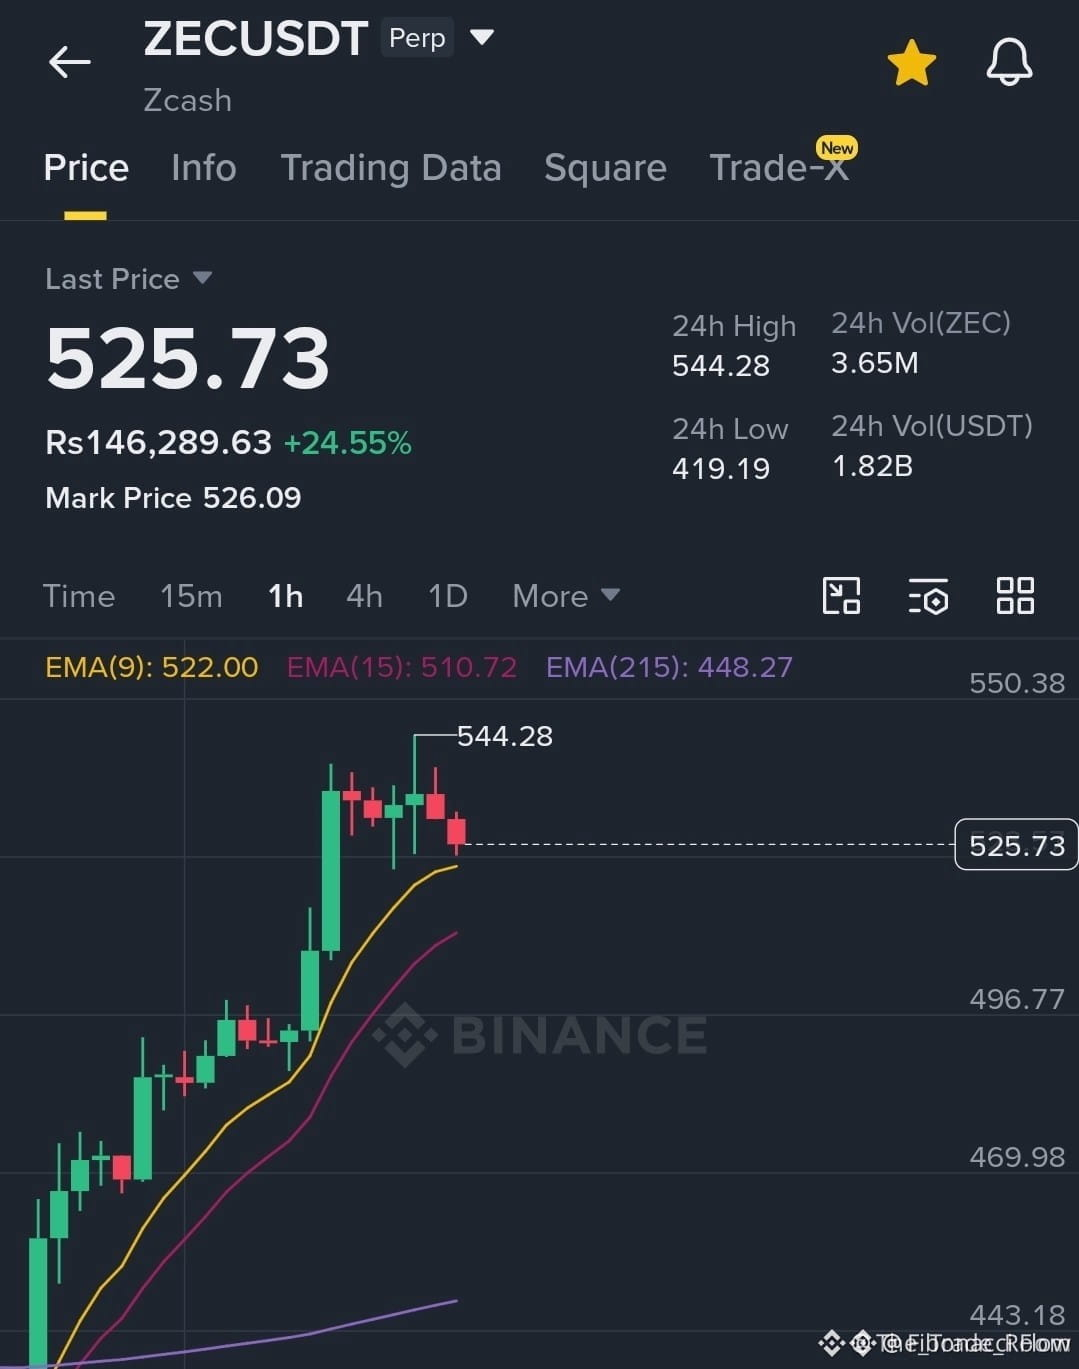
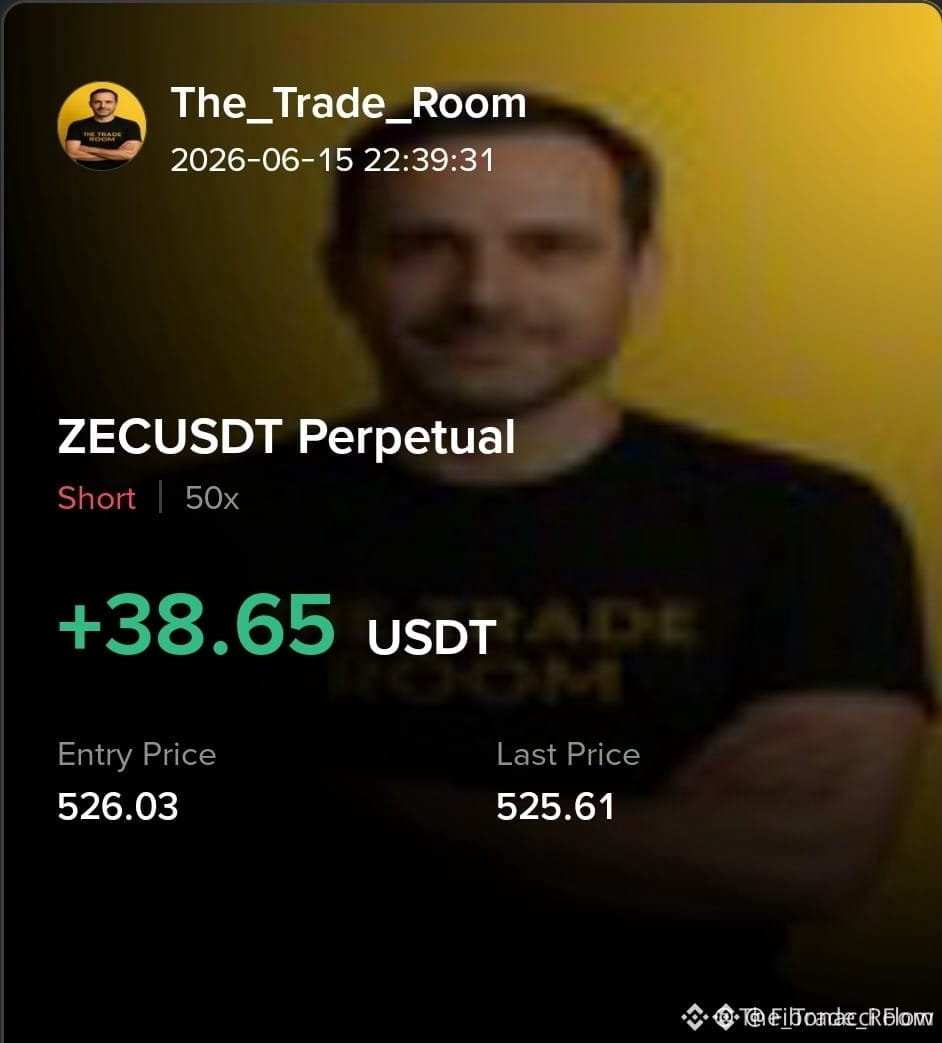
$ZEC configuración de trade en corto se ve limpia 🚨
Entrada: 526$ 🔻
Objetivo: 496$ 🚀
Objetivo: 485$ 💎
Stop Loss: 558$ 🛑
Hermanos, este es el tipo de configuración que puede moverse rápido cuando las manos débiles comienzan a rendirse. Si $ZEC pierde impulso, la caída puede ser fuerte, pero no te pongas creativo. Sigue el plan, respeta el stop y deja que el mercado haga el trabajo pesado.
No es un consejo financiero. Maneja tu riesgo.
#ZEC #ShortSetup #CryptoTA #BearishTrade
🛑
$ZEC configuración de trade en corto se ve limpia 🚨
Entrada: 526$ 🔻
Objetivo: 496$ 🚀
Objetivo: 485$ 💎
Stop Loss: 558$ 🛑
Hermanos, este es el tipo de configuración que puede moverse rápido cuando las manos débiles comienzan a rendirse. Si $ZEC pierde impulso, la caída puede ser fuerte, pero no te pongas creativo. Sigue el plan, respeta el stop y deja que el mercado haga el trabajo pesado.
No es un consejo financiero. Maneja tu riesgo.
#ZEC #ShortSetup #CryptoTA #BearishTrade
🛑
Entrada: 526$ 🔻
Objetivo: 496$ 🚀
Objetivo: 485$ 💎
Stop Loss: 558$ 🛑
Hermanos, este es el tipo de configuración que puede moverse rápido cuando las manos débiles comienzan a rendirse. Si $ZEC pierde impulso, la caída puede ser fuerte, pero no te pongas creativo. Sigue el plan, respeta el stop y deja que el mercado haga el trabajo pesado.
No es un consejo financiero. Maneja tu riesgo.
#ZEC #ShortSetup #CryptoTA #BearishTrade
🛑
16

·
--
LOS PERROS suben 19,1% hoy. Precio: $0,00004730, volumen: $7,35M.
Lectura del escáner: histograma del MACD positivo, RSI 54,2, margen para seguir subiendo. El movimiento es real, pero la configuración es mixta, así que importa el tamaño de la posición.
Niveles clave:
Zona de observación para entrada: $0,00004836 a $0,00004933
TP1: $0,00005132
Stop: por debajo de $0,00004276
Rango 24H: $0,00003921 a $0,00005132. Mantenerse por encima de $0,00004527 con volumen en descenso es la señal de confirmación que debes vigilar.
#THE #Thena #DeFi #CryptoTA #AnálisisTécnico
LOS PERROS suben 19,1% hoy. Precio: $0,00004730, volumen: $7,35M.
Lectura del escáner: histograma del MACD positivo, RSI 54,2, margen para seguir subiendo. El movimiento es real, pero la configuración es mixta, así que importa el tamaño de la posición.
Niveles clave:
Zona de observación para entrada: $0,00004836 a $0,00004933
TP1: $0,00005132
Stop: por debajo de $0,00004276
Rango 24H: $0,00003921 a $0,00005132. Mantenerse por encima de $0,00004527 con volumen en descenso es la señal de confirmación que debes vigilar.
#THE #Thena #DeFi #CryptoTA #AnálisisTécnico
Lectura del escáner: histograma del MACD positivo, RSI 54,2, margen para seguir subiendo. El movimiento es real, pero la configuración es mixta, así que importa el tamaño de la posición.
Niveles clave:
Zona de observación para entrada: $0,00004836 a $0,00004933
TP1: $0,00005132
Stop: por debajo de $0,00004276
Rango 24H: $0,00003921 a $0,00005132. Mantenerse por encima de $0,00004527 con volumen en descenso es la señal de confirmación que debes vigilar.
#THE #Thena #DeFi #CryptoTA #AnálisisTécnico
172

Aquí tienes una publicación de tendencia para EDU/USDT:
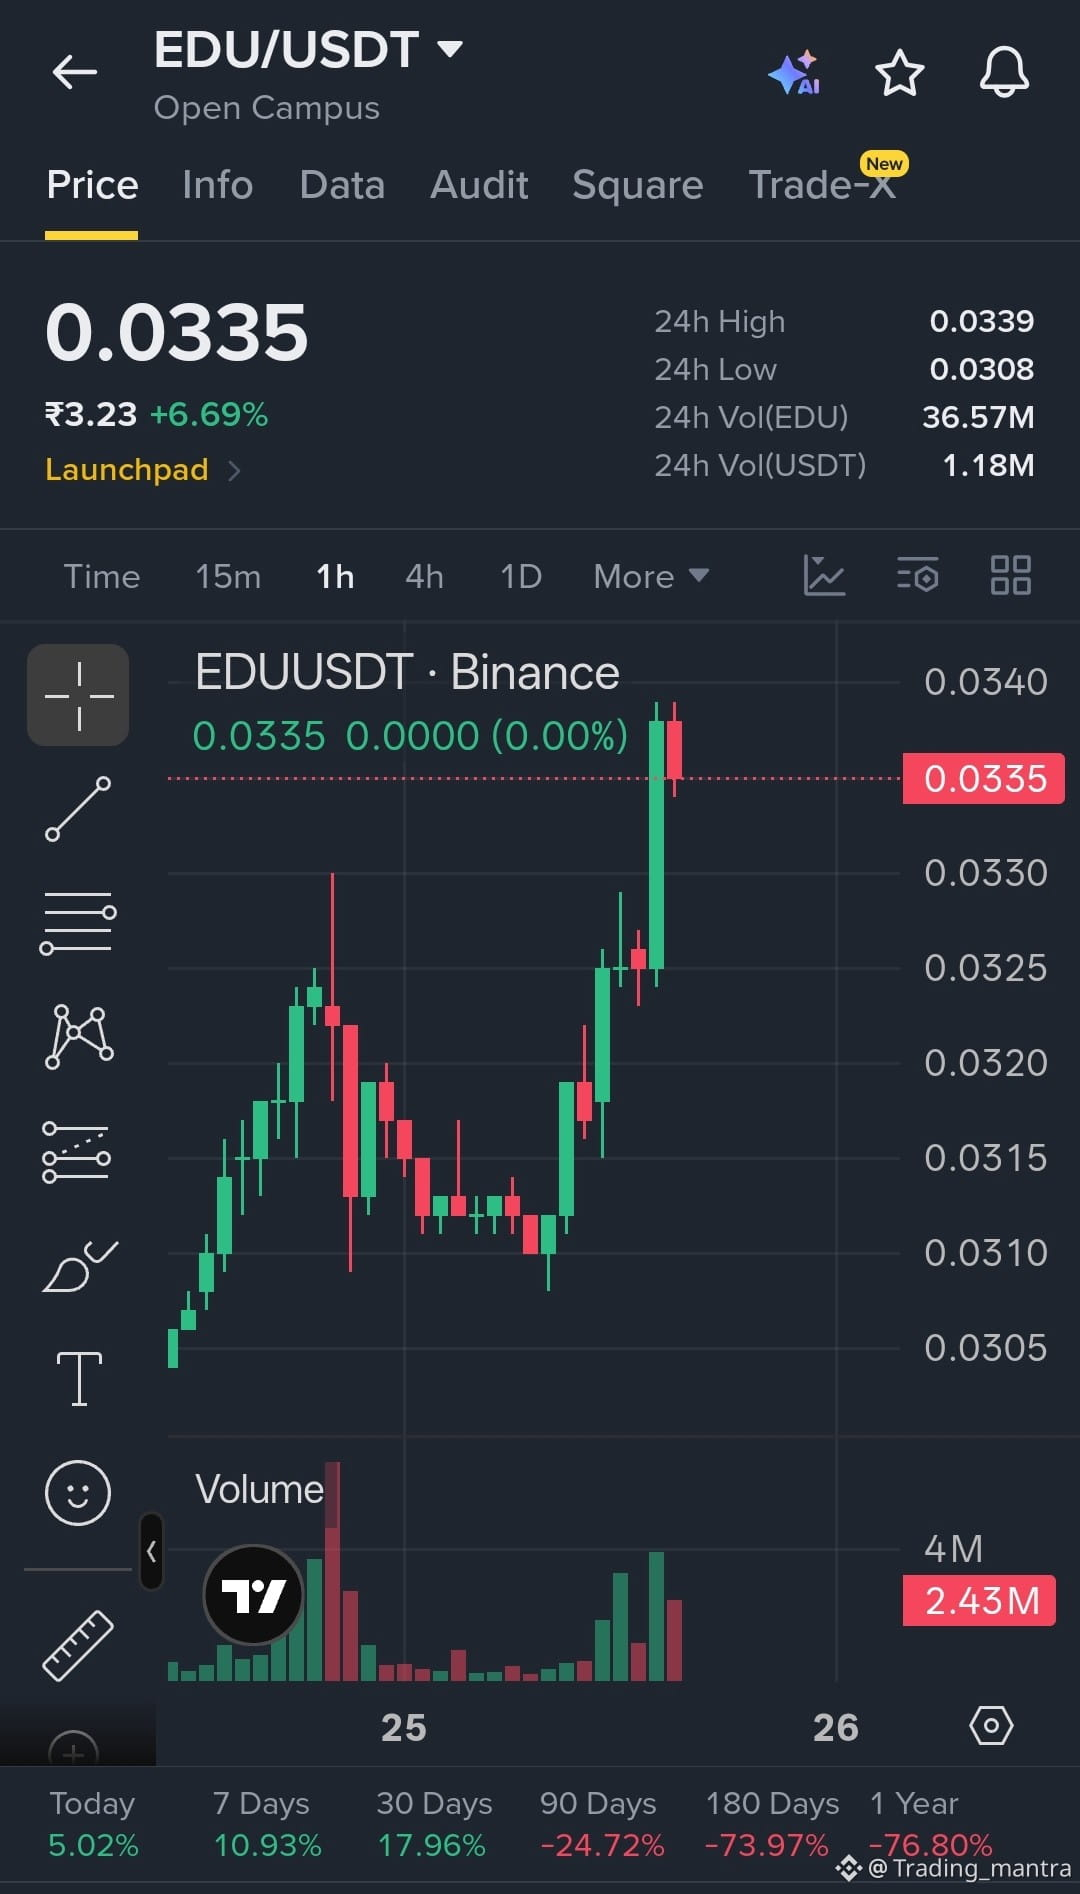
$EDU Rompiendo el rango 🚀📚
EDU/USDT acaba de iniciar un movimiento impulsivo fuerte, subiendo +6.69% en 24h hasta $0.0335, tocando un máximo de $0.0339.
📊 Acción del precio:
Se consolidó durante horas en la zona $0.0310–0.0325
Vela de ruptura limpia con aumento de volumen que confirma el impulso
Mínimo 24h: $0.0308 | Máximo 24h: $0.0339
📈 Tendencia en múltiples marcos temporales:
7D: +10.93%
30D: +17.96%
90D: -24.72%
1Y: -76.80%
El impulso a corto plazo es claramente alcista, pero al alejarse, EDU sigue muy metido en una caída de mayor plazo: esto parece más un rebote de alivio que una reversión de tendencia completa por ahora.
🔑 A vigilar: ¿Puede mantenerse $0.0335 como nuevo soporte, o lo rechazan y vuelve al rango? Un cierre por encima de $0.0339 abriría espacio hacia $0.0350+.
No es asesoramiento financiero — investiga por tu cuenta (DYOR). #EDU #Binance #CryptoTA
{future}(EDUUSDT)
Aquí tienes una publicación de tendencia para EDU/USDT:
$EDU Rompiendo el rango 🚀📚
EDU/USDT acaba de iniciar un movimiento impulsivo fuerte, subiendo +6.69% en 24h hasta $0.0335, tocando un máximo de $0.0339.
📊 Acción del precio:
Se consolidó durante horas en la zona $0.0310–0.0325
Vela de ruptura limpia con aumento de volumen que confirma el impulso
Mínimo 24h: $0.0308 | Máximo 24h: $0.0339
📈 Tendencia en múltiples marcos temporales:
7D: +10.93%
30D: +17.96%
90D: -24.72%
1Y: -76.80%
El impulso a corto plazo es claramente alcista, pero al alejarse, EDU sigue muy metido en una caída de mayor plazo: esto parece más un rebote de alivio que una reversión de tendencia completa por ahora.
🔑 A vigilar: ¿Puede mantenerse $0.0335 como nuevo soporte, o lo rechazan y vuelve al rango? Un cierre por encima de $0.0339 abriría espacio hacia $0.0350+.
No es asesoramiento financiero — investiga por tu cuenta (DYOR). #EDU #Binance #CryptoTA
$EDU Rompiendo el rango 🚀📚
EDU/USDT acaba de iniciar un movimiento impulsivo fuerte, subiendo +6.69% en 24h hasta $0.0335, tocando un máximo de $0.0339.
📊 Acción del precio:
Se consolidó durante horas en la zona $0.0310–0.0325
Vela de ruptura limpia con aumento de volumen que confirma el impulso
Mínimo 24h: $0.0308 | Máximo 24h: $0.0339
📈 Tendencia en múltiples marcos temporales:
7D: +10.93%
30D: +17.96%
90D: -24.72%
1Y: -76.80%
El impulso a corto plazo es claramente alcista, pero al alejarse, EDU sigue muy metido en una caída de mayor plazo: esto parece más un rebote de alivio que una reversión de tendencia completa por ahora.
🔑 A vigilar: ¿Puede mantenerse $0.0335 como nuevo soporte, o lo rechazan y vuelve al rango? Un cierre por encima de $0.0339 abriría espacio hacia $0.0350+.
No es asesoramiento financiero — investiga por tu cuenta (DYOR). #EDU #Binance #CryptoTA
103
·
--
ZKP sube un 32,8% en 24 horas.
Antes de perseguir: el rango de 24H está entre $0,0459 y $0,0696, con un 51,6% de amplitud. Comprar cerca de la parte alta de ese rango hace que tu stop quede muy profundo o que el riesgo quede sin límites.
Los movimientos de alta inercia atraen tres tipos de participantes: los tenedores tempranos que venden aprovechando la fuerza, los compradores de ruptura que entran y los recién llegados que aportan liquidez de salida para los dos primeros.
Las mejores entradas en grandes movimientos llegan después de la consolidación, no durante el pico.
#Crypto #CryptoTA #BTC
ZKP sube un 32,8% en 24 horas.
Antes de perseguir: el rango de 24H está entre $0,0459 y $0,0696, con un 51,6% de amplitud. Comprar cerca de la parte alta de ese rango hace que tu stop quede muy profundo o que el riesgo quede sin límites.
Los movimientos de alta inercia atraen tres tipos de participantes: los tenedores tempranos que venden aprovechando la fuerza, los compradores de ruptura que entran y los recién llegados que aportan liquidez de salida para los dos primeros.
Las mejores entradas en grandes movimientos llegan después de la consolidación, no durante el pico.
#Crypto #CryptoTA #BTC
Antes de perseguir: el rango de 24H está entre $0,0459 y $0,0696, con un 51,6% de amplitud. Comprar cerca de la parte alta de ese rango hace que tu stop quede muy profundo o que el riesgo quede sin límites.
Los movimientos de alta inercia atraen tres tipos de participantes: los tenedores tempranos que venden aprovechando la fuerza, los compradores de ruptura que entran y los recién llegados que aportan liquidez de salida para los dos primeros.
Las mejores entradas en grandes movimientos llegan después de la consolidación, no durante el pico.
#Crypto #CryptoTA #BTC
60

·
--
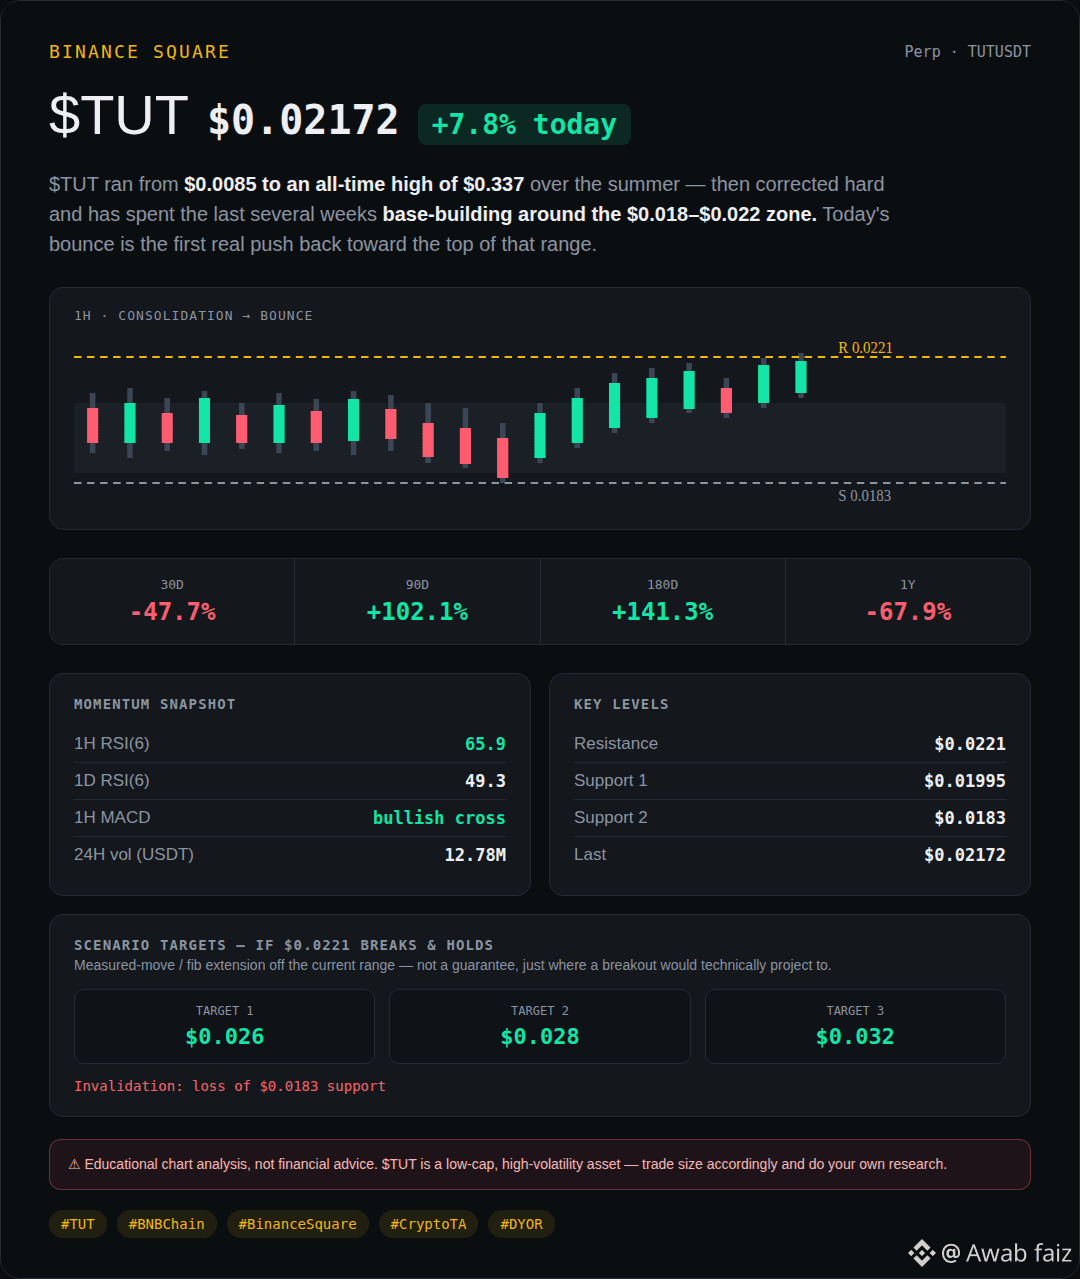
#TUT waking up 👀
Rebotó limpio desde 0.0183$ y recuperó 0.0217$ — +7.8% hoy.
📊 Lectura rápida:
🔹 RSI(6) 1H: 65.9 — compradores activos, aún hay margen
🔹 MACD 1H: cruce alcista manteniéndose
🔹 Rango 24H: 0.01995$ – 0.02210$
🔹 El RSI diario acaba de volver a cruzar por encima de 50 = el impulso se está invirtiendo
🟢 Soporte: 0.01995$ / 0.0183$
🔴 Resistencia: 0.0221$ (máximo de hoy — nivel clave para cambiar)
Superar + mantenerse por encima de 0.0221$ y esto podría extenderse. Perder 0.0183$ y volvemos al rango.
Aún está ~48% abajo en el mes, así que es un rebote dentro de una tendencia bajista mayor — todavía no es una reversión confirmada. Vigilando la confirmación. 👇
#BNBChain #TUT #CryptoTA #TUTAlert
No es asesoramiento financiero, haz tu propia investigación ⚠️
#TUT waking up 👀
Rebotó limpio desde 0.0183$ y recuperó 0.0217$ — +7.8% hoy.
📊 Lectura rápida:
🔹 RSI(6) 1H: 65.9 — compradores activos, aún hay margen
🔹 MACD 1H: cruce alcista manteniéndose
🔹 Rango 24H: 0.01995$ – 0.02210$
🔹 El RSI diario acaba de volver a cruzar por encima de 50 = el impulso se está invirtiendo
🟢 Soporte: 0.01995$ / 0.0183$
🔴 Resistencia: 0.0221$ (máximo de hoy — nivel clave para cambiar)
Superar + mantenerse por encima de 0.0221$ y esto podría extenderse. Perder 0.0183$ y volvemos al rango.
Aún está ~48% abajo en el mes, así que es un rebote dentro de una tendencia bajista mayor — todavía no es una reversión confirmada. Vigilando la confirmación. 👇
#BNBChain #TUT #CryptoTA #TUTAlert
No es asesoramiento financiero, haz tu propia investigación ⚠️
Rebotó limpio desde 0.0183$ y recuperó 0.0217$ — +7.8% hoy.
📊 Lectura rápida:
🔹 RSI(6) 1H: 65.9 — compradores activos, aún hay margen
🔹 MACD 1H: cruce alcista manteniéndose
🔹 Rango 24H: 0.01995$ – 0.02210$
🔹 El RSI diario acaba de volver a cruzar por encima de 50 = el impulso se está invirtiendo
🟢 Soporte: 0.01995$ / 0.0183$
🔴 Resistencia: 0.0221$ (máximo de hoy — nivel clave para cambiar)
Superar + mantenerse por encima de 0.0221$ y esto podría extenderse. Perder 0.0183$ y volvemos al rango.
Aún está ~48% abajo en el mes, así que es un rebote dentro de una tendencia bajista mayor — todavía no es una reversión confirmada. Vigilando la confirmación. 👇
#BNBChain #TUT #CryptoTA #TUTAlert
No es asesoramiento financiero, haz tu propia investigación ⚠️
2
367

·
--
$ETH /USDT: Retroceso Premium o Trampa Antes de la Próxima Pierna?
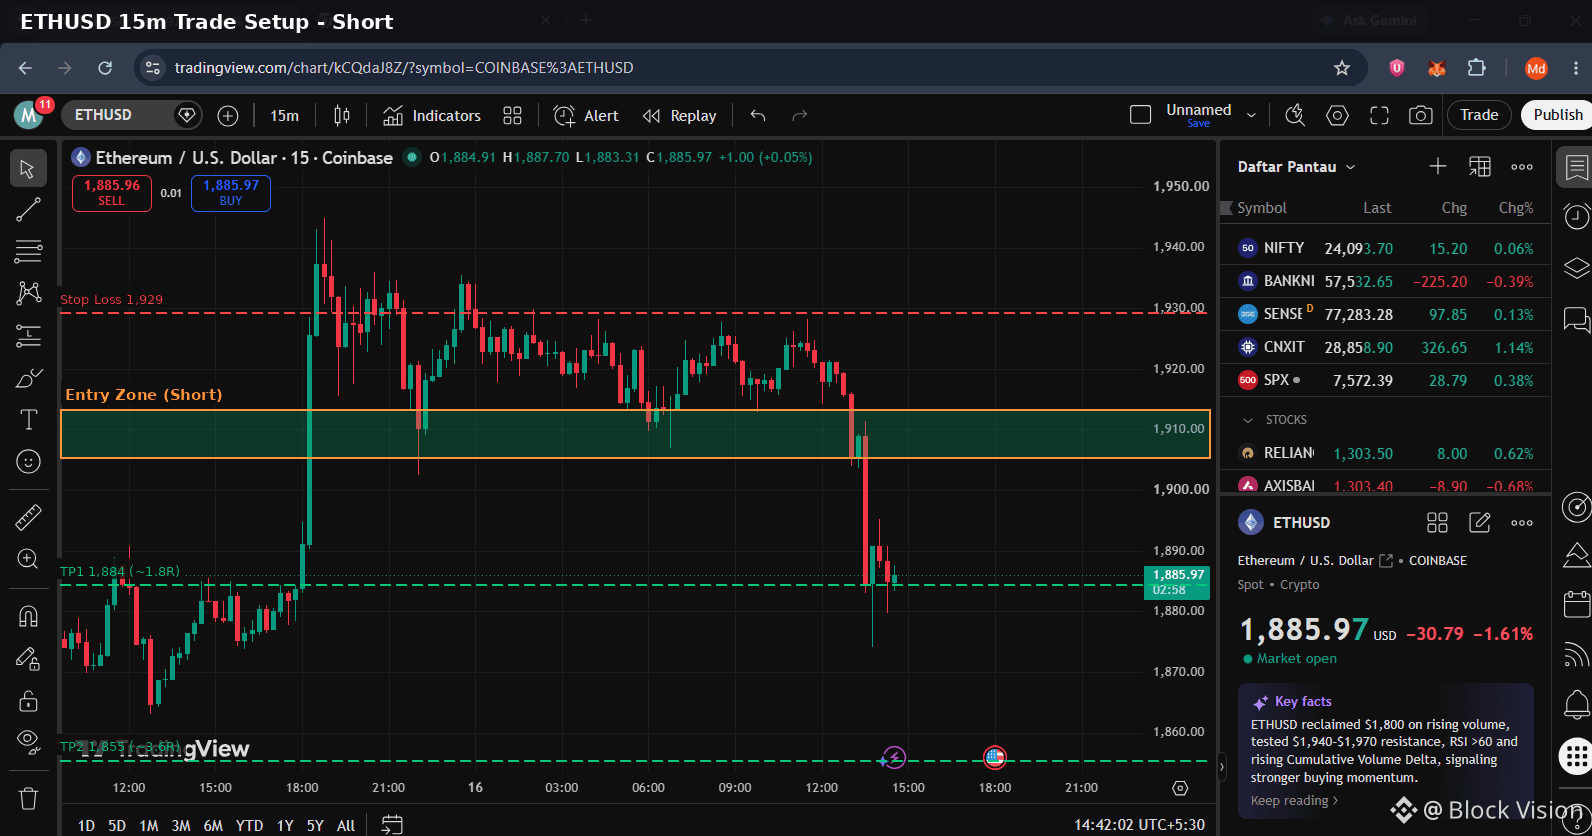
$ETH acaba de marcar $1,945 y fue rechazado con fuerza, y el gráfico de 15m cuenta una historia distinta a la del diario.
Haz zoom hacia afuera y esto sigue siendo una recuperación desde el mínimo de junio de $1,500.
Haz zoom hacia adentro y en las últimas horas el flujo de órdenes interno se dio vuelta a bajista: 1H acaba de imprimir un CHoCH, rompiendo por debajo de su último higher-low.
El precio está en la mitad premium de ambos rangos de swing de 4H y 1H, ubicación de manual para buscar cortos, no para perseguir largos.
El imán de abajo es evidente: liquidez del lado vendedor en $1,883, justo donde ya se han formado mínimos iguales dos veces.
Estoy vigilando un retest de la zona de flip rota $1,905–$1,913 con una vela de rechazo antes de entrar en corto, apuntando primero a ese pool de $1,883 y luego a $1,855.
La invalidación está por encima de $1,929. Si el precio en cambio barre $1,883 y revierte con fuerza, eso voltea toda la lectura a alcista nuevamente hacia $1,945.
Protege el capital: dimensiona primero para que tu stop sea lo único que duela, nunca la operación en sí.
¿Estás echándote contra este retroceso o esperando la barrida de liquidez? 👇
{future}(ETHUSDT)
$ETH #ETHUSD #SmartMoneyConcepts #ICT #CryptoTA
$ETH /USDT: Retroceso Premium o Trampa Antes de la Próxima Pierna?
$ETH acaba de marcar $1,945 y fue rechazado con fuerza, y el gráfico de 15m cuenta una historia distinta a la del diario.
Haz zoom hacia afuera y esto sigue siendo una recuperación desde el mínimo de junio de $1,500.
Haz zoom hacia adentro y en las últimas horas el flujo de órdenes interno se dio vuelta a bajista: 1H acaba de imprimir un CHoCH, rompiendo por debajo de su último higher-low.
El precio está en la mitad premium de ambos rangos de swing de 4H y 1H, ubicación de manual para buscar cortos, no para perseguir largos.
El imán de abajo es evidente: liquidez del lado vendedor en $1,883, justo donde ya se han formado mínimos iguales dos veces.
Estoy vigilando un retest de la zona de flip rota $1,905–$1,913 con una vela de rechazo antes de entrar en corto, apuntando primero a ese pool de $1,883 y luego a $1,855.
La invalidación está por encima de $1,929. Si el precio en cambio barre $1,883 y revierte con fuerza, eso voltea toda la lectura a alcista nuevamente hacia $1,945.
Protege el capital: dimensiona primero para que tu stop sea lo único que duela, nunca la operación en sí.
¿Estás echándote contra este retroceso o esperando la barrida de liquidez? 👇
$ETH #ETHUSD #SmartMoneyConcepts #ICT #CryptoTA
$ETH acaba de marcar $1,945 y fue rechazado con fuerza, y el gráfico de 15m cuenta una historia distinta a la del diario.
Haz zoom hacia afuera y esto sigue siendo una recuperación desde el mínimo de junio de $1,500.
Haz zoom hacia adentro y en las últimas horas el flujo de órdenes interno se dio vuelta a bajista: 1H acaba de imprimir un CHoCH, rompiendo por debajo de su último higher-low.
El precio está en la mitad premium de ambos rangos de swing de 4H y 1H, ubicación de manual para buscar cortos, no para perseguir largos.
El imán de abajo es evidente: liquidez del lado vendedor en $1,883, justo donde ya se han formado mínimos iguales dos veces.
Estoy vigilando un retest de la zona de flip rota $1,905–$1,913 con una vela de rechazo antes de entrar en corto, apuntando primero a ese pool de $1,883 y luego a $1,855.
La invalidación está por encima de $1,929. Si el precio en cambio barre $1,883 y revierte con fuerza, eso voltea toda la lectura a alcista nuevamente hacia $1,945.
Protege el capital: dimensiona primero para que tu stop sea lo único que duela, nunca la operación en sí.
¿Estás echándote contra este retroceso o esperando la barrida de liquidez? 👇
$ETH #ETHUSD #SmartMoneyConcepts #ICT #CryptoTA
2
409

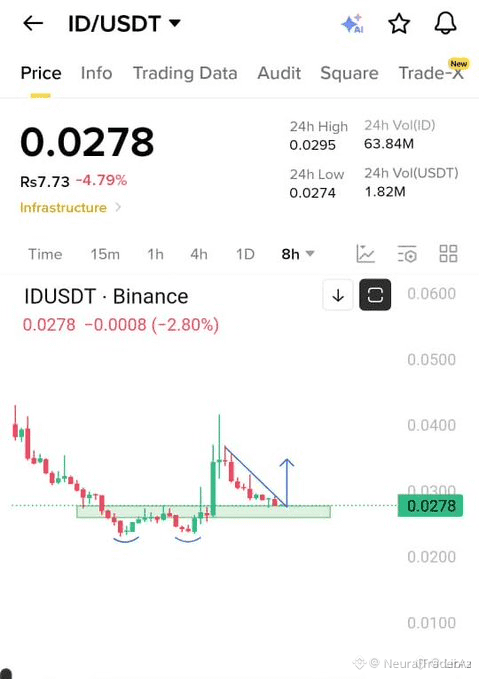
$ID Muestra un Setup de Acumulación Limpia 📈
$ID está empezando a verse más estructurado después de una fase prolongada de acumulación. Si el precio sigue manteniendo la base actual, el próximo movimiento podría ser impulsado por un barrido de liquidez y una rotación de vuelta hacia la zona de suministro más alta.
La clave es si el momentum se confirma por encima del rango local. Hasta entonces, este es un setup para monitorear, no para perseguir.
No es asesoría financiera. Maneja tu riesgo.
#ID #LongSetup #CryptoTA #Altcoins
📌
$ID Muestra un Setup de Acumulación Limpia 📈
$ID está empezando a verse más estructurado después de una fase prolongada de acumulación. Si el precio sigue manteniendo la base actual, el próximo movimiento podría ser impulsado por un barrido de liquidez y una rotación de vuelta hacia la zona de suministro más alta.
La clave es si el momentum se confirma por encima del rango local. Hasta entonces, este es un setup para monitorear, no para perseguir.
No es asesoría financiera. Maneja tu riesgo.
#ID #LongSetup #CryptoTA #Altcoins
📌
$ID está empezando a verse más estructurado después de una fase prolongada de acumulación. Si el precio sigue manteniendo la base actual, el próximo movimiento podría ser impulsado por un barrido de liquidez y una rotación de vuelta hacia la zona de suministro más alta.
La clave es si el momentum se confirma por encima del rango local. Hasta entonces, este es un setup para monitorear, no para perseguir.
No es asesoría financiera. Maneja tu riesgo.
#ID #LongSetup #CryptoTA #Altcoins
📌
143

·
--
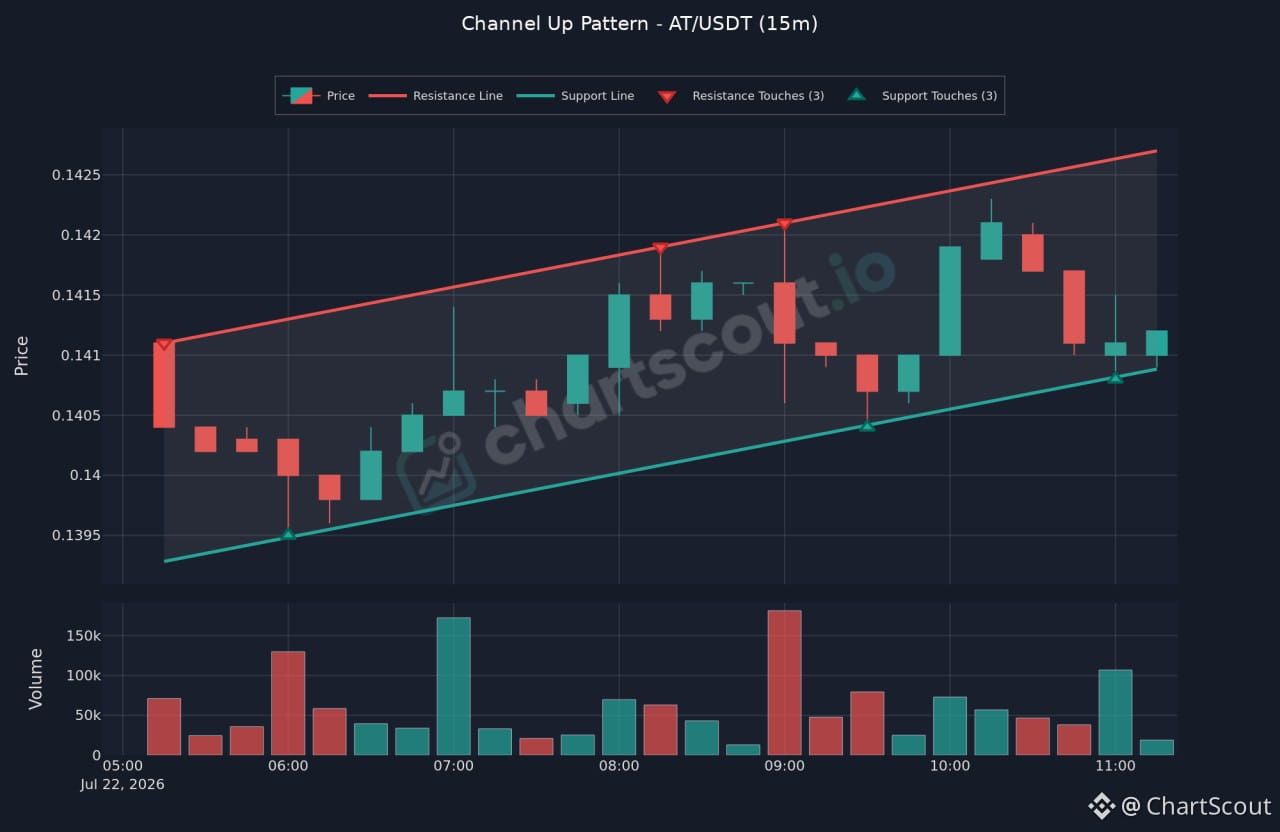
📈 AT/USDT - Patrón de Subida del Canal (15m)
AT/USDT está subiendo de forma constante dentro de un canal ascendente, con el precio respetando tanto las líneas de soporte como las de resistencia en 3 toques cada una. Este tipo de estructura ordenada a menudo refleja una tendencia alcista sana y controlada, más que un pico eufórico.
Mientras el precio siga rotando dentro del canal, la inclinación alcista se mantiene intacta. Una ruptura por encima de la resistencia podría impulsar la continuación, mientras que una caída por debajo del soporte sería la primera señal de debilitamiento del impulso.
Observa de cerca cómo el precio prueba los bordes del canal. 👀
DYOR no es asesoramiento financiero. 🧠
#ChartScout #AT #ChannelUp #CryptoTA
📈 AT/USDT - Patrón de Subida del Canal (15m)
AT/USDT está subiendo de forma constante dentro de un canal ascendente, con el precio respetando tanto las líneas de soporte como las de resistencia en 3 toques cada una. Este tipo de estructura ordenada a menudo refleja una tendencia alcista sana y controlada, más que un pico eufórico.
Mientras el precio siga rotando dentro del canal, la inclinación alcista se mantiene intacta. Una ruptura por encima de la resistencia podría impulsar la continuación, mientras que una caída por debajo del soporte sería la primera señal de debilitamiento del impulso.
Observa de cerca cómo el precio prueba los bordes del canal. 👀
DYOR no es asesoramiento financiero. 🧠
#ChartScout #AT #ChannelUp #CryptoTA
AT/USDT está subiendo de forma constante dentro de un canal ascendente, con el precio respetando tanto las líneas de soporte como las de resistencia en 3 toques cada una. Este tipo de estructura ordenada a menudo refleja una tendencia alcista sana y controlada, más que un pico eufórico.
Mientras el precio siga rotando dentro del canal, la inclinación alcista se mantiene intacta. Una ruptura por encima de la resistencia podría impulsar la continuación, mientras que una caída por debajo del soporte sería la primera señal de debilitamiento del impulso.
Observa de cerca cómo el precio prueba los bordes del canal. 👀
DYOR no es asesoramiento financiero. 🧠
#ChartScout #AT #ChannelUp #CryptoTA
1
87
·
--
EPIC sube 29.6% hoy. Precio: $0.6090.
Rango 24H: $0.4580 a $0.6190. Volumen: ~$1.5M.
La expansión del rango con un volumen elevado es una reevaluación, no ruido. La pregunta ahora es si esto fue un evento de una sola sesión o el inicio de un movimiento sostenido.
Nivel clave a vigilar: $0.6190. Si se mantiene como soporte en el próximo retroceso, la estructura habrá cambiado. Si el precio se retrae por debajo del punto medio en $0.5385, el movimiento fue búsqueda de liquidez, no acumulación.
#Crypto #CryptoTA #BTC
EPIC sube 29.6% hoy. Precio: $0.6090.
Rango 24H: $0.4580 a $0.6190. Volumen: ~$1.5M.
La expansión del rango con un volumen elevado es una reevaluación, no ruido. La pregunta ahora es si esto fue un evento de una sola sesión o el inicio de un movimiento sostenido.
Nivel clave a vigilar: $0.6190. Si se mantiene como soporte en el próximo retroceso, la estructura habrá cambiado. Si el precio se retrae por debajo del punto medio en $0.5385, el movimiento fue búsqueda de liquidez, no acumulación.
#Crypto #CryptoTA #BTC
Rango 24H: $0.4580 a $0.6190. Volumen: ~$1.5M.
La expansión del rango con un volumen elevado es una reevaluación, no ruido. La pregunta ahora es si esto fue un evento de una sola sesión o el inicio de un movimiento sostenido.
Nivel clave a vigilar: $0.6190. Si se mantiene como soporte en el próximo retroceso, la estructura habrá cambiado. Si el precio se retrae por debajo del punto medio en $0.5385, el movimiento fue búsqueda de liquidez, no acumulación.
#Crypto #CryptoTA #BTC
85
Inicia sesión para explorar más contenidos
Únete a usuarios globales de criptomonedas en Binance Square
⚡️ Obtén información útil y actualizada sobre criptos.
💬 Avalado por el mayor exchange de criptomonedas en el mundo.
👍 Descubre perspectivas reales de creadores verificados.
Email/número de teléfono
Temas populares
1
#BinancePick
2.6M vistas
140,754 están debatiendo
2
#EarningsSeason
5M vistas
24,263 están debatiendo
3
#FranklinTempletonFilesForTwoDividendToBitcoinETFs
427 vistas
53 están debatiendo
4
#StrategyMSTRSurpassesNasdaqInMarketCap
607 vistas
60 están debatiendo
5
#CanadaProposesStablecoinRedemptionWithin3BusinessDays
63 vistas
9 están debatiendo
6
#ElectrumWalletBugLetRogueServersStealFunds
7,034 vistas
216 están debatiendo
7
#ArgentineCourtDismissesLIBRACaseAgainstMilei
16,066 vistas
295 están debatiendo
8
#SKHynixReportedlyPlansSpecialDividendFromKioxiaStakeSale
2,989 vistas
48 están debatiendo
9
#KeystoneWebsiteBreachExposesBuyersShippingAddresses
1,614 vistas
40 están debatiendo
10
#USQ3GDPAndSeptemberPCEDueNextWeek
92,514 vistas
1,113 están debatiendo