
沐涵AA
1.2k Posts

沐涵AA
选择大于努力,思维决定口袋(围脖同名)
0 Following
542 Followers
842 Liked
Posts
All
Quotes
Videos
PINNED
Be in awe of the market, and never forget your original intention!
Free guidance for follow-trading!
Starts from 10000u!
Free guidance for follow-trading!
Starts from 10000u!

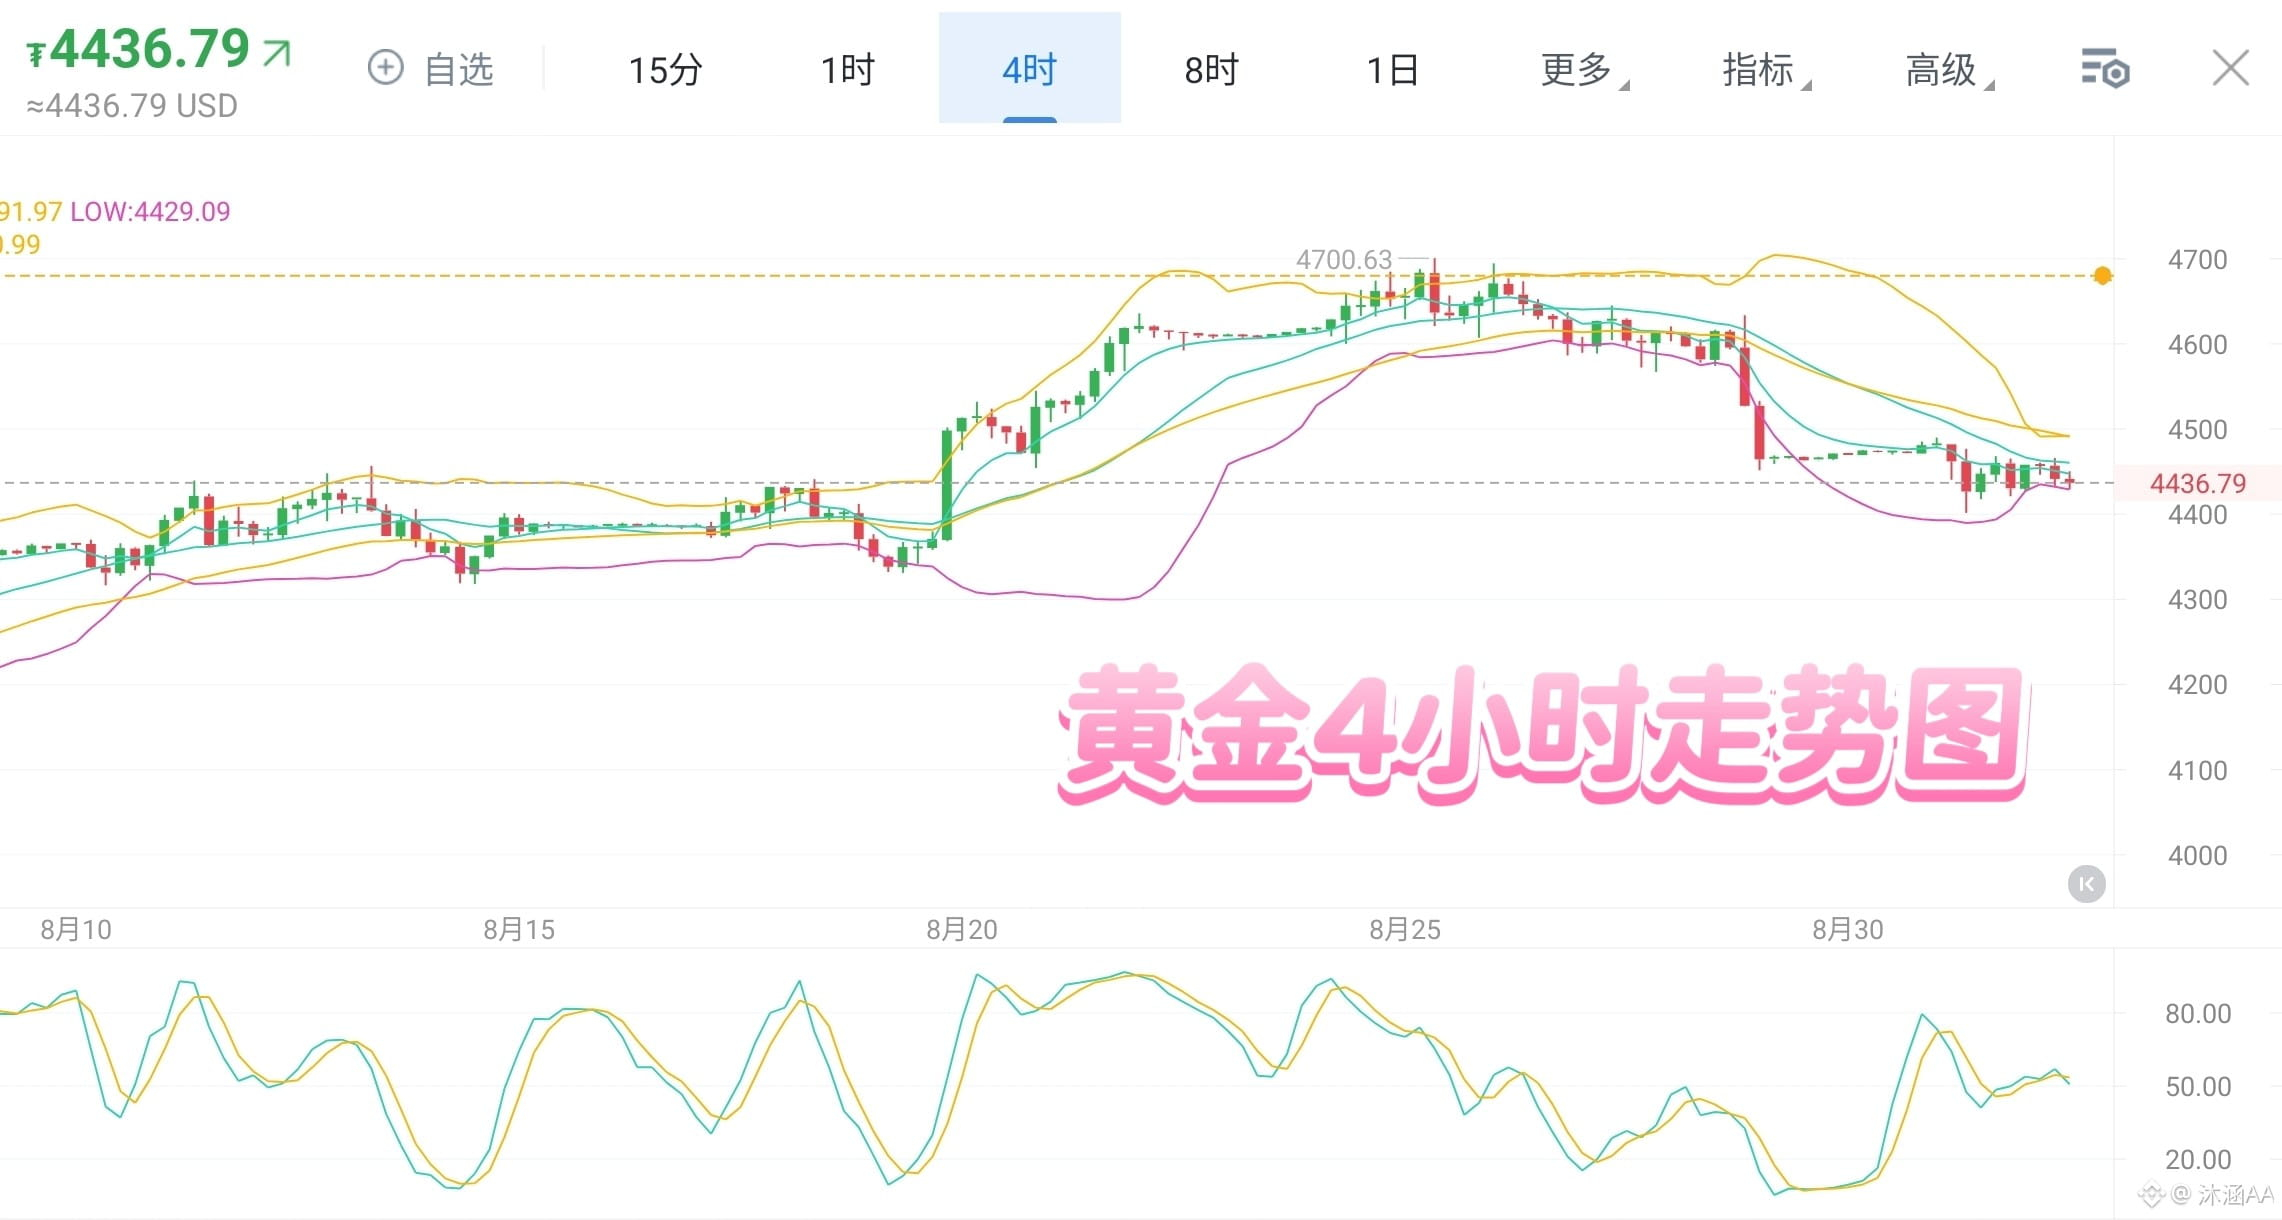
Gold is fluctuating and weakening; short-term focus on the 4,380 support
After the market opened on Tuesday, gold continues the overnight range-bound downward trend, and is still trading around 4,437.
On the 1-hour timeframe, the RSI and KDJ show a slight bearish divergence. MACD momentum has contracted somewhat, but the fast and slow lines remain below the zero axis, indicating that although short-term downside momentum is weakening, the overall structure is still bearish.
On the 4-hour timeframe, the Supertrend downside pressure level has shifted down to around 4,575, while the MA20 is at about 4,523. Key support to watch is near 4,430—this area is where the 120-period moving average formed recent support.
Trade references:
Longs: go long near 4,400–4,405; targets: 4,525–4,535
Shorts: go short near 4,460–4,470; targets: 4,340–4,330
Overall: the main idea remains—range-bound with a bearish bias. Prefer selling on rebounds; when price falls to the key support level, then watch how the bulls react.
#比特币守稳78000美元上方 $XAU
After the market opened on Tuesday, gold continues the overnight range-bound downward trend, and is still trading around 4,437.
On the 1-hour timeframe, the RSI and KDJ show a slight bearish divergence. MACD momentum has contracted somewhat, but the fast and slow lines remain below the zero axis, indicating that although short-term downside momentum is weakening, the overall structure is still bearish.
On the 4-hour timeframe, the Supertrend downside pressure level has shifted down to around 4,575, while the MA20 is at about 4,523. Key support to watch is near 4,430—this area is where the 120-period moving average formed recent support.
Trade references:
Longs: go long near 4,400–4,405; targets: 4,525–4,535
Shorts: go short near 4,460–4,470; targets: 4,340–4,330
Overall: the main idea remains—range-bound with a bearish bias. Prefer selling on rebounds; when price falls to the key support level, then watch how the bulls react.
#比特币守稳78000美元上方 $XAU
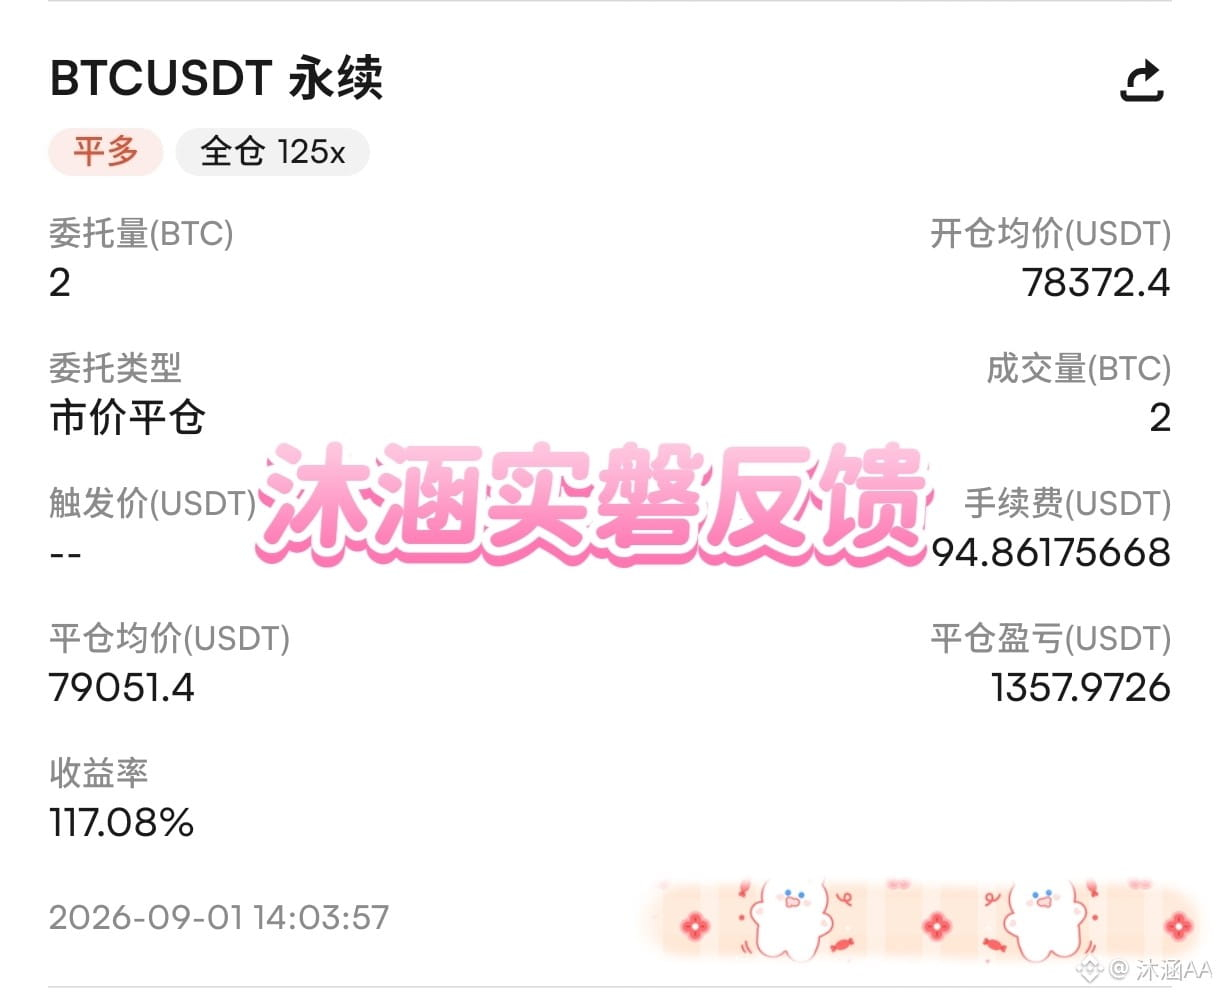
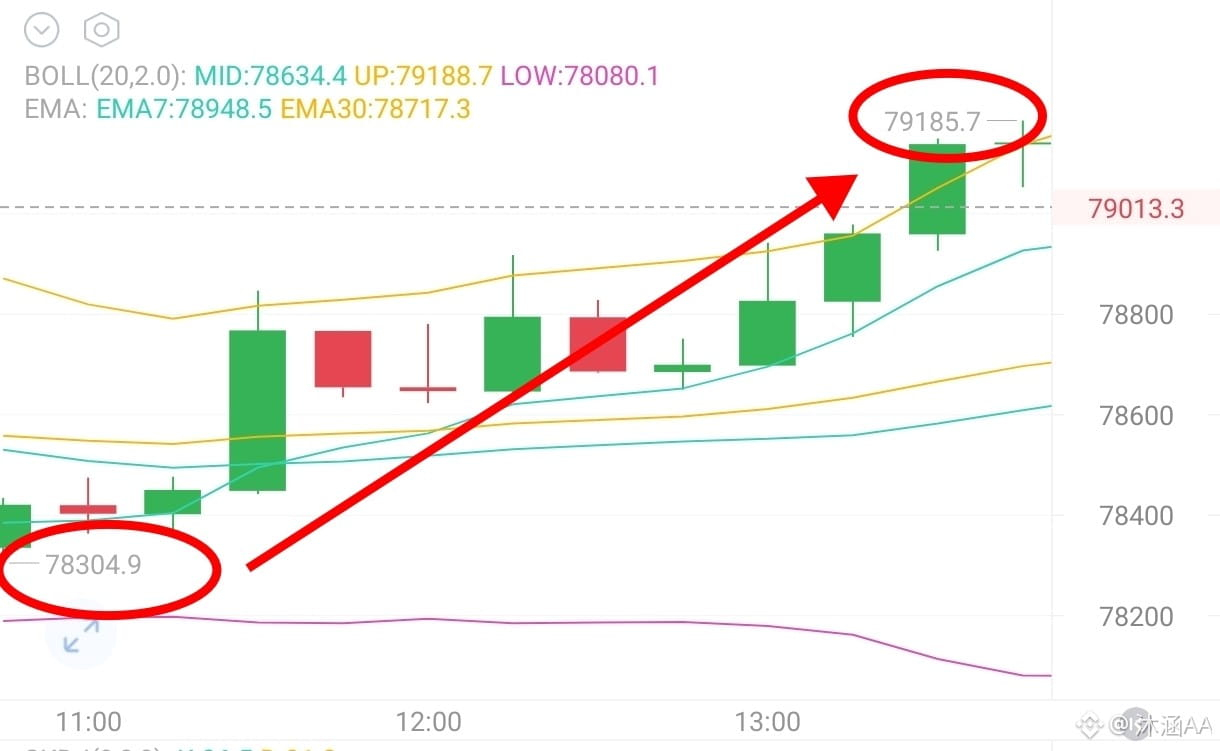
Intra-day Bai-Pan phase market volatility isn’t very large. The overall movement has played out as a sideways consolidation pattern. The long-position idea I shared at midday was also perfectly fulfilled—taking the 700-point opportunity and then exiting. The market is currently in a bottom-building phase. All parties are gathering funds, waiting for a chance. Judging from the overall chart, at the daily level it’s in a stage where the bulls have a slight advantage, just like the swing-trading outlook I gave earlier. In terms of volume and momentum, it has been consistently cooperating with the bulls as well, showing expansion. But as I always say—Mu Han will still make time to synchronize and update my thoughts; follow along and you’ll get to eat well! #比特币守稳78000美元上方 $BTC
9.1 Big Pancake Perspective🔥
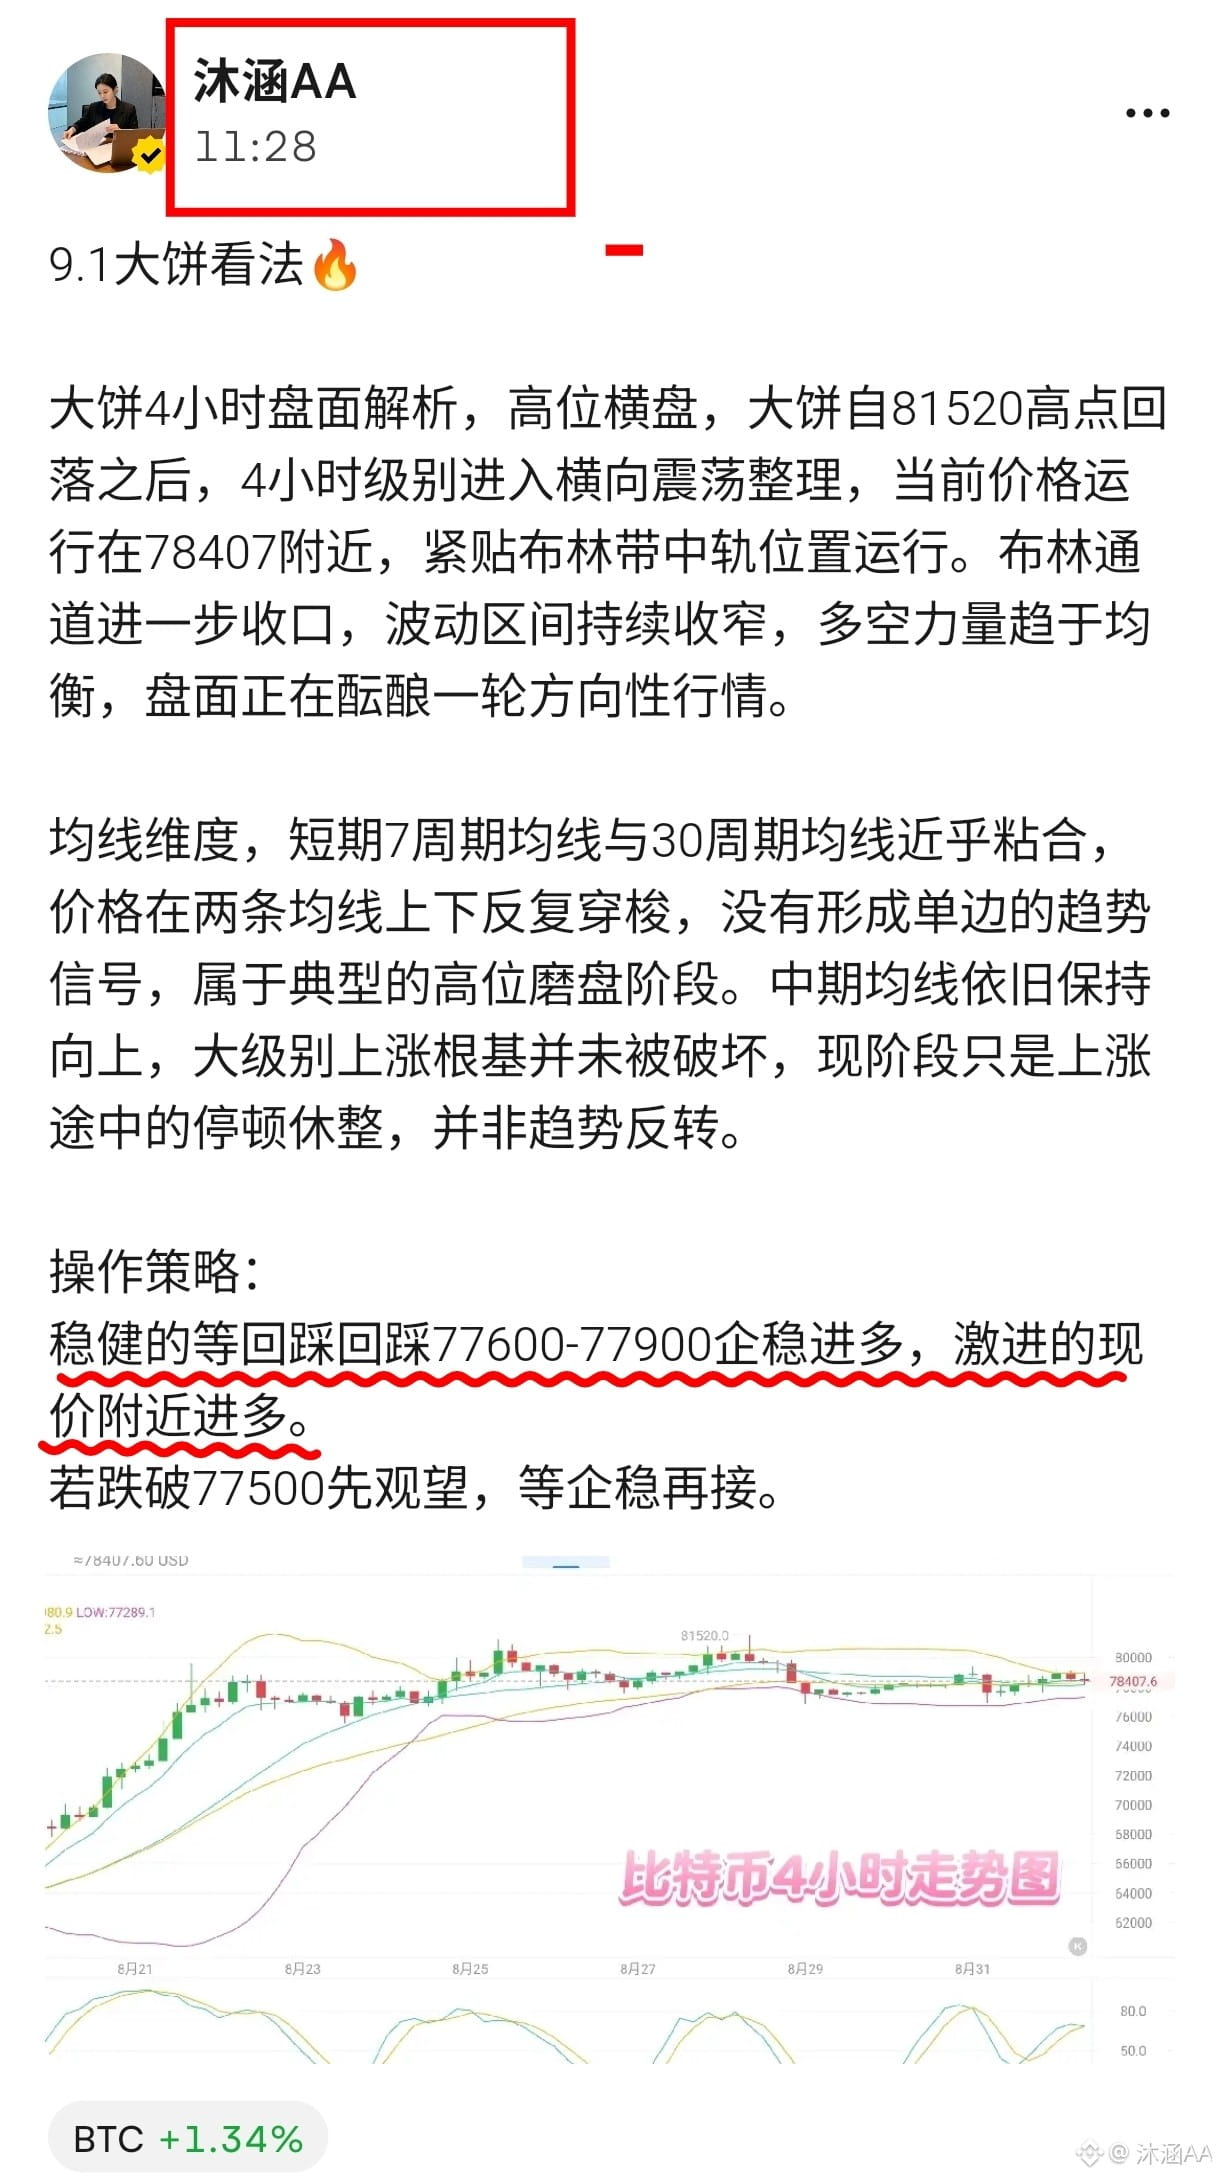
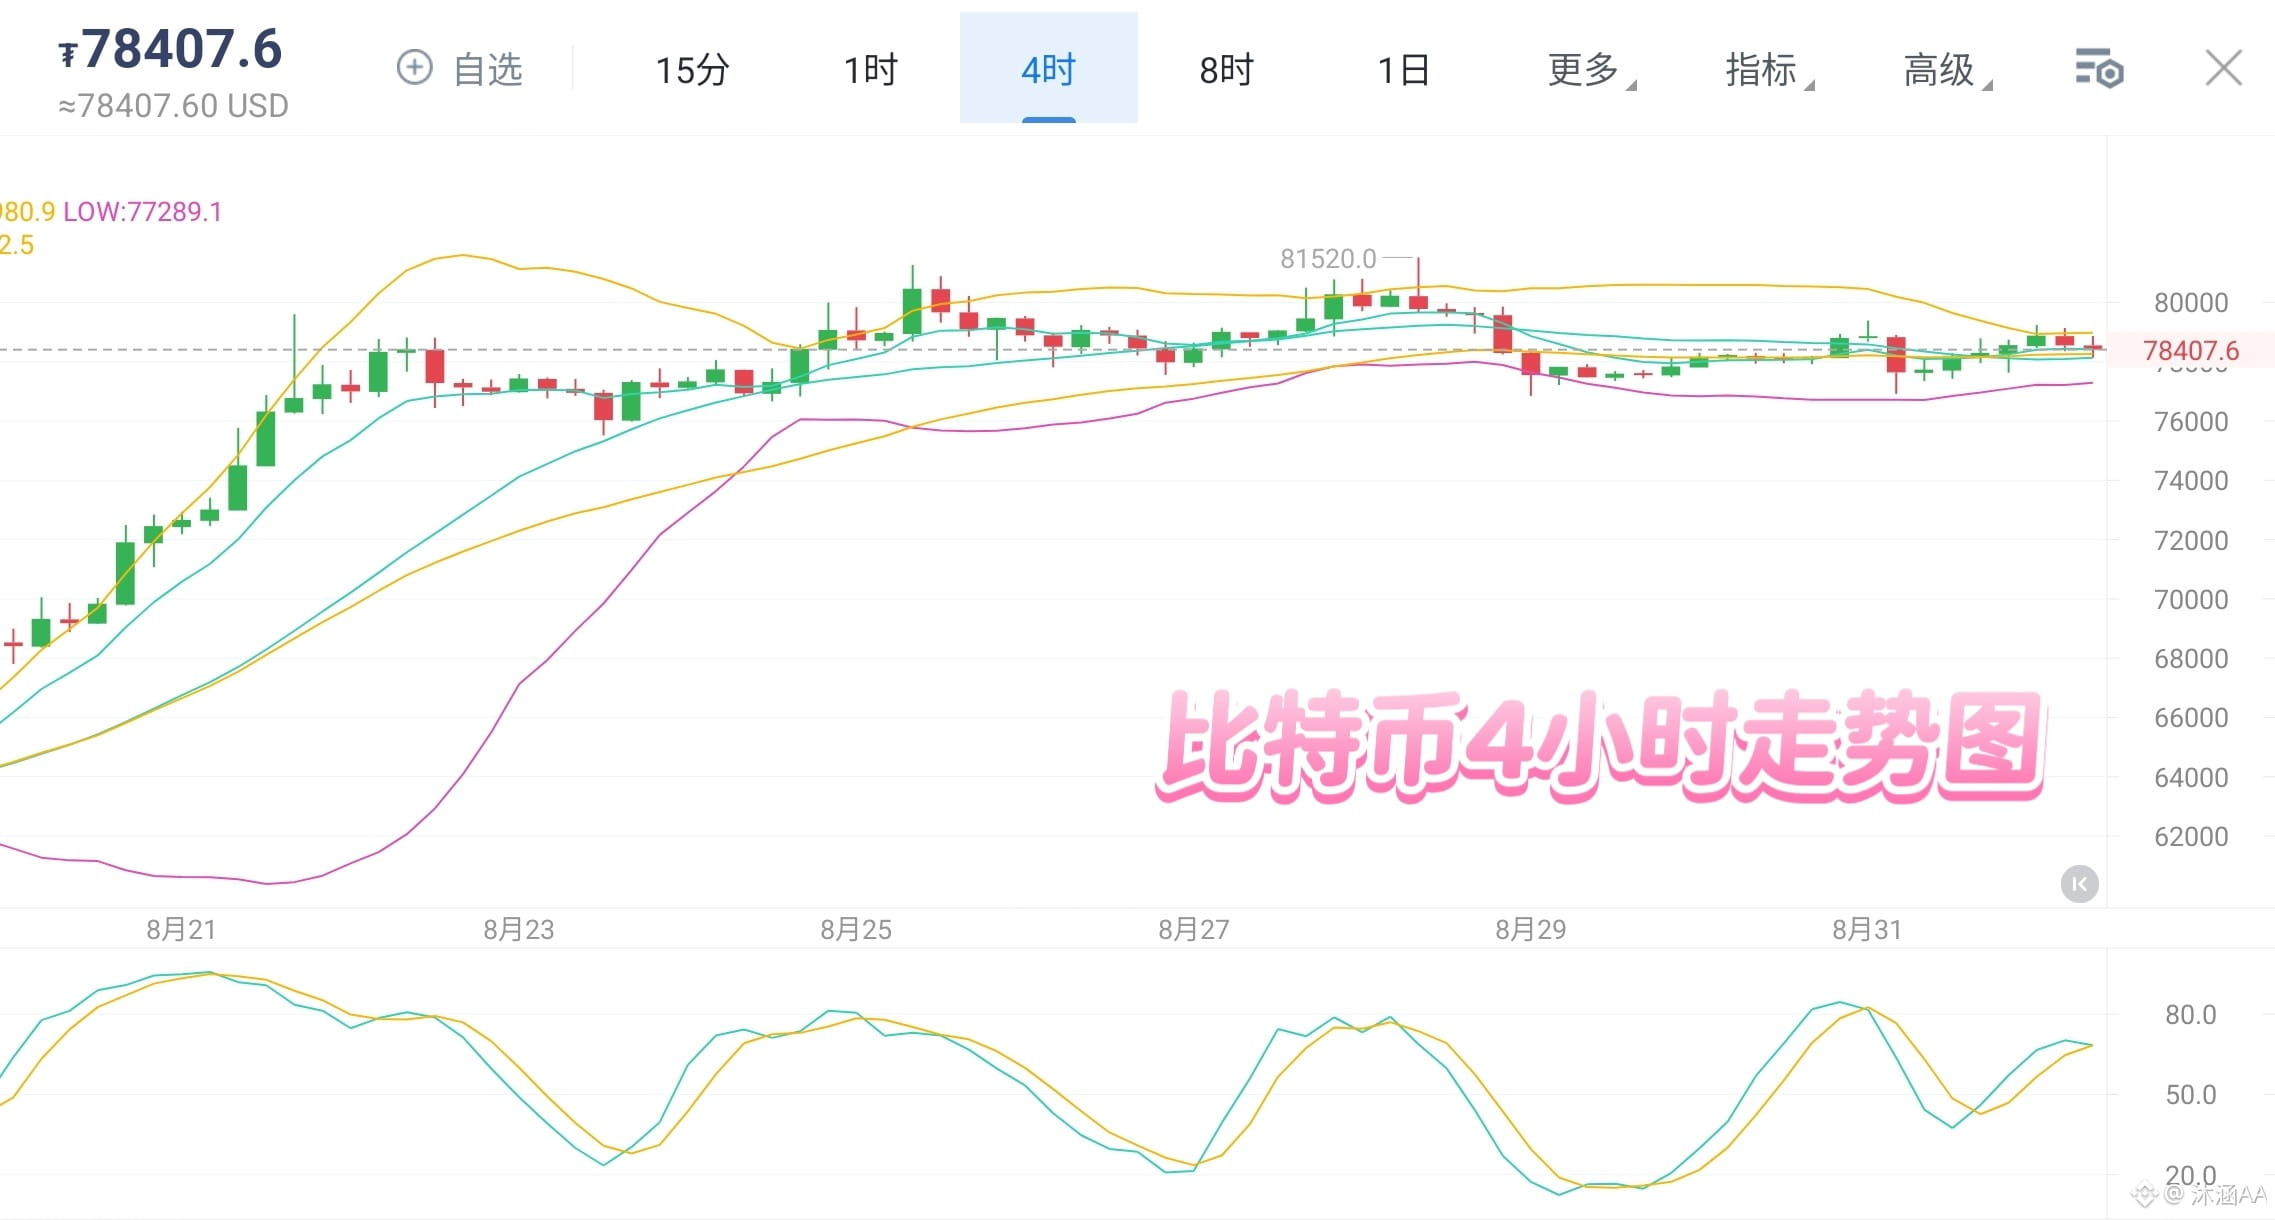
Big Pancake 4-hour chart analysis: the market is ranging at a high level. After Big Pancake fell back from the 81,520 peak, the 4-hour timeframe has entered a sideways consolidation. Currently, the price is hovering around 78,407, trading very close to the middle band of the Bollinger Bands. The Bollinger channel is continuing to narrow, the volatility range is steadily shrinking, and the forces of buyers and sellers are becoming more balanced. The chart is now brewing a directional move.
In terms of moving averages: on the short-term side, the 7-period MA and the 30-period MA are nearly stuck together, with the price repeatedly moving back and forth above and below these two averages. There is no clear one-sided trend signal—this is a typical “grinding盘” phase at a high level. As for the medium-term averages, they are still pointing upward. The foundation of the larger-scale uptrend has not been broken. At this stage, it’s merely a pause and consolidation during the ongoing rise, not a trend reversal.
Trading strategy:
For a more cautious approach, wait for a pullback to 77,600–77,900 and enter long once it stabilizes. For a more aggressive approach, go long near the current price.
If it breaks below 77,500, stand by first and wait for stabilization before entering again. #比特币8月上涨23%跑赢黄金股市 $BTC
Big Pancake 4-hour chart analysis: the market is ranging at a high level. After Big Pancake fell back from the 81,520 peak, the 4-hour timeframe has entered a sideways consolidation. Currently, the price is hovering around 78,407, trading very close to the middle band of the Bollinger Bands. The Bollinger channel is continuing to narrow, the volatility range is steadily shrinking, and the forces of buyers and sellers are becoming more balanced. The chart is now brewing a directional move.
In terms of moving averages: on the short-term side, the 7-period MA and the 30-period MA are nearly stuck together, with the price repeatedly moving back and forth above and below these two averages. There is no clear one-sided trend signal—this is a typical “grinding盘” phase at a high level. As for the medium-term averages, they are still pointing upward. The foundation of the larger-scale uptrend has not been broken. At this stage, it’s merely a pause and consolidation during the ongoing rise, not a trend reversal.
Trading strategy:
For a more cautious approach, wait for a pullback to 77,600–77,900 and enter long once it stabilizes. For a more aggressive approach, go long near the current price.
If it breaks below 77,500, stand by first and wait for stabilization before entering again. #比特币8月上涨23%跑赢黄金股市 $BTC
9.1 Gold Perspectives🔥 Monthly Line Bullish Candle Needs to Push Higher
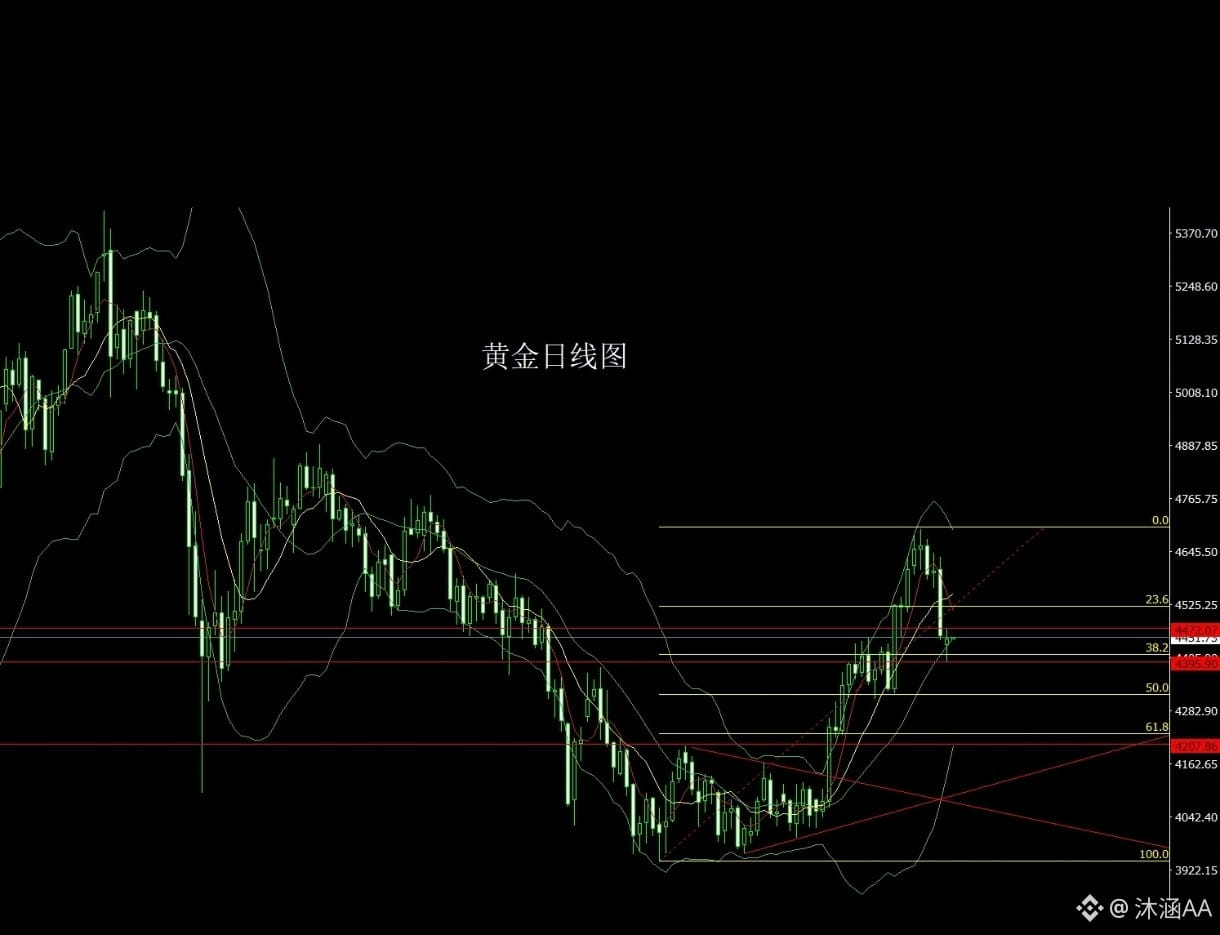
Yesterday, the gold market completed the August structure. Looking back at the move: at the beginning of the month, price opened higher at 4081.2, then first pulled back. The monthly low reached 3993.5, after which price strongly consolidated and surged upward. The monthly high touched 4697.7, but in the late session it fell back under fundamental pressure. Ultimately, the monthly candle closed at 4447.5. The monthly candle formed a very long upper-wick giant bullish candle. After ending with such a pattern, September’s行情 still has bullish technical demand.
As for yesterday’s gold market trading range: in the early session, it opened lower at 4433.3, then rallied to give a daily high at 4472.6 before rapidly falling back. The daily low reached 4396.1, after which price rallied again. After 4-hour consolidation with a揉搓/entangling pattern, the market moved sideways. The daily candle ultimately closed at 4447.5. The daily candle formed a hammer-like pattern with a slightly longer lower wick than the upper wick. After closing with this kind of pattern, today’s pullback should still be followed by longs!
In terms of trading for gold: if price pulls back first today, consider going long from 4410, targeting 4425 and 4436 and 4445. If it breaks down, watch resistance at 4465 and 4472. If it breaks through, then look for 4500 and 4520.#油轮在霍尔木兹海峡触雷起火 $XAU
Yesterday, the gold market completed the August structure. Looking back at the move: at the beginning of the month, price opened higher at 4081.2, then first pulled back. The monthly low reached 3993.5, after which price strongly consolidated and surged upward. The monthly high touched 4697.7, but in the late session it fell back under fundamental pressure. Ultimately, the monthly candle closed at 4447.5. The monthly candle formed a very long upper-wick giant bullish candle. After ending with such a pattern, September’s行情 still has bullish technical demand.
As for yesterday’s gold market trading range: in the early session, it opened lower at 4433.3, then rallied to give a daily high at 4472.6 before rapidly falling back. The daily low reached 4396.1, after which price rallied again. After 4-hour consolidation with a揉搓/entangling pattern, the market moved sideways. The daily candle ultimately closed at 4447.5. The daily candle formed a hammer-like pattern with a slightly longer lower wick than the upper wick. After closing with this kind of pattern, today’s pullback should still be followed by longs!
In terms of trading for gold: if price pulls back first today, consider going long from 4410, targeting 4425 and 4436 and 4445. If it breaks down, watch resistance at 4465 and 4472. If it breaks through, then look for 4500 and 4520.#油轮在霍尔木兹海峡触雷起火 $XAU
August 31st intraday closing review
Today’s big cake provided a long-biased (multi) idea. In the live trading today, I took a total of two trades, netting over 1,600 points. For gold, there are more orders on this side. You can refer to the screenshots in the video! Mu Han is short-term trading, capturing a few hundred points of room by repeatedly catching opportunities back and forth. That’s all for today’s trading. Take the profits you’ve got and rest easy—see you in August 👋🏻 Hello, September! Good night, everyone 🌙$XAU $BTC #比特币守稳78000美元上方
Today’s big cake provided a long-biased (multi) idea. In the live trading today, I took a total of two trades, netting over 1,600 points. For gold, there are more orders on this side. You can refer to the screenshots in the video! Mu Han is short-term trading, capturing a few hundred points of room by repeatedly catching opportunities back and forth. That’s all for today’s trading. Take the profits you’ve got and rest easy—see you in August 👋🏻 Hello, September! Good night, everyone 🌙$XAU $BTC #比特币守稳78000美元上方
On the crypto road, finding a fellow traveler to lead the way is crucial.
Mu Han doesn’t paint grand promises of getting rich overnight—there is no “100% guaranteed” secret.
What she offers is a mature, stable, and dependable trading system, along with genuine sincerity in dealing with people.
No empty hype, no chasing overnight riches—only steady progress day by day.
✅3000‑5000U|Short-term: 10–15% position, 3–5 trading days
✅6000‑20000U|Swing + short-term: 10% position, 5–10 trading days
✅30000‑60000U|Primarily long-term: 10% position, 10–20 trading days
✅10万U以上|Primarily long-term: 5% position, monthly cycle#比特币守稳78000美元上方 $GOOGL.US
Mu Han doesn’t paint grand promises of getting rich overnight—there is no “100% guaranteed” secret.
What she offers is a mature, stable, and dependable trading system, along with genuine sincerity in dealing with people.
No empty hype, no chasing overnight riches—only steady progress day by day.
✅3000‑5000U|Short-term: 10–15% position, 3–5 trading days
✅6000‑20000U|Swing + short-term: 10% position, 5–10 trading days
✅30000‑60000U|Primarily long-term: 10% position, 10–20 trading days
✅10万U以上|Primarily long-term: 5% position, monthly cycle#比特币守稳78000美元上方 $GOOGL.US

BTC+0.75%
GOOGLUS-0.15%
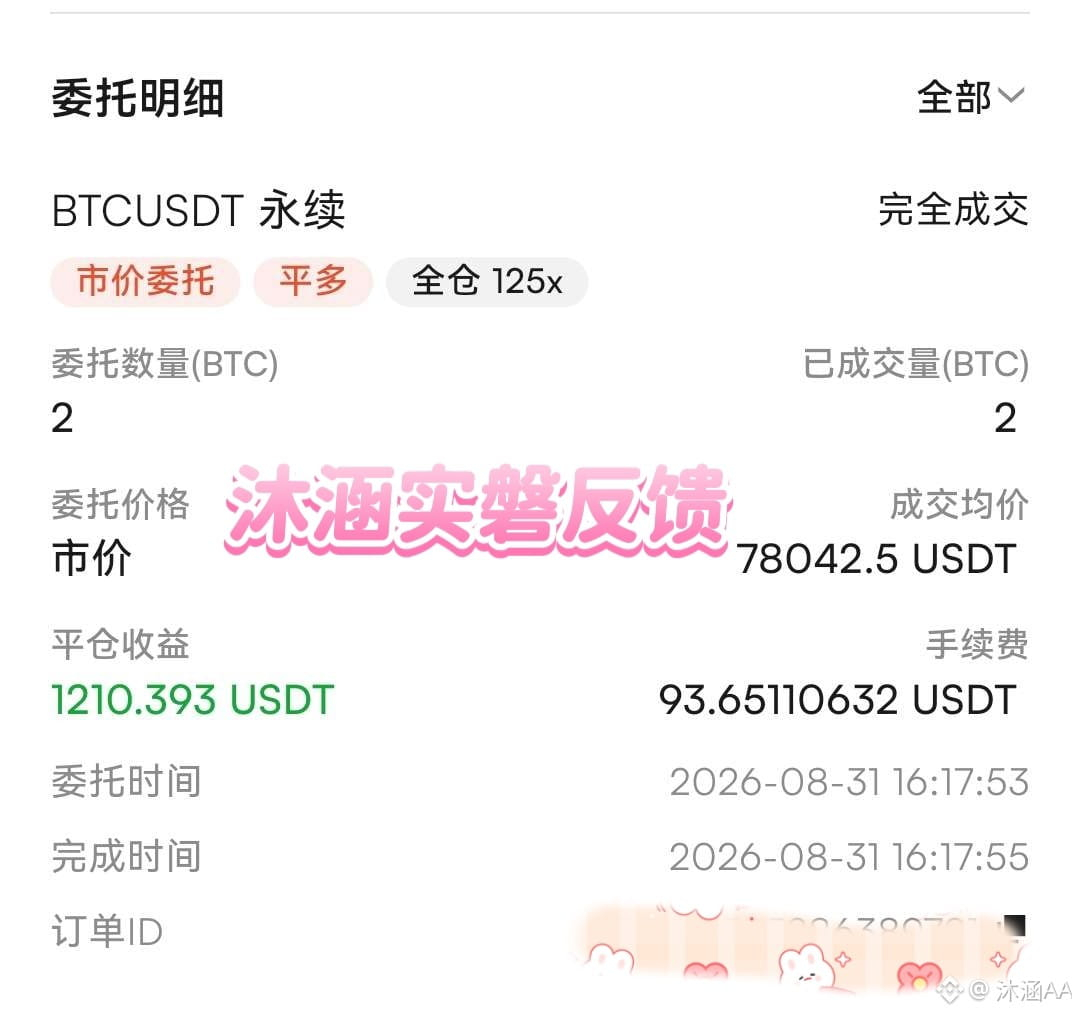
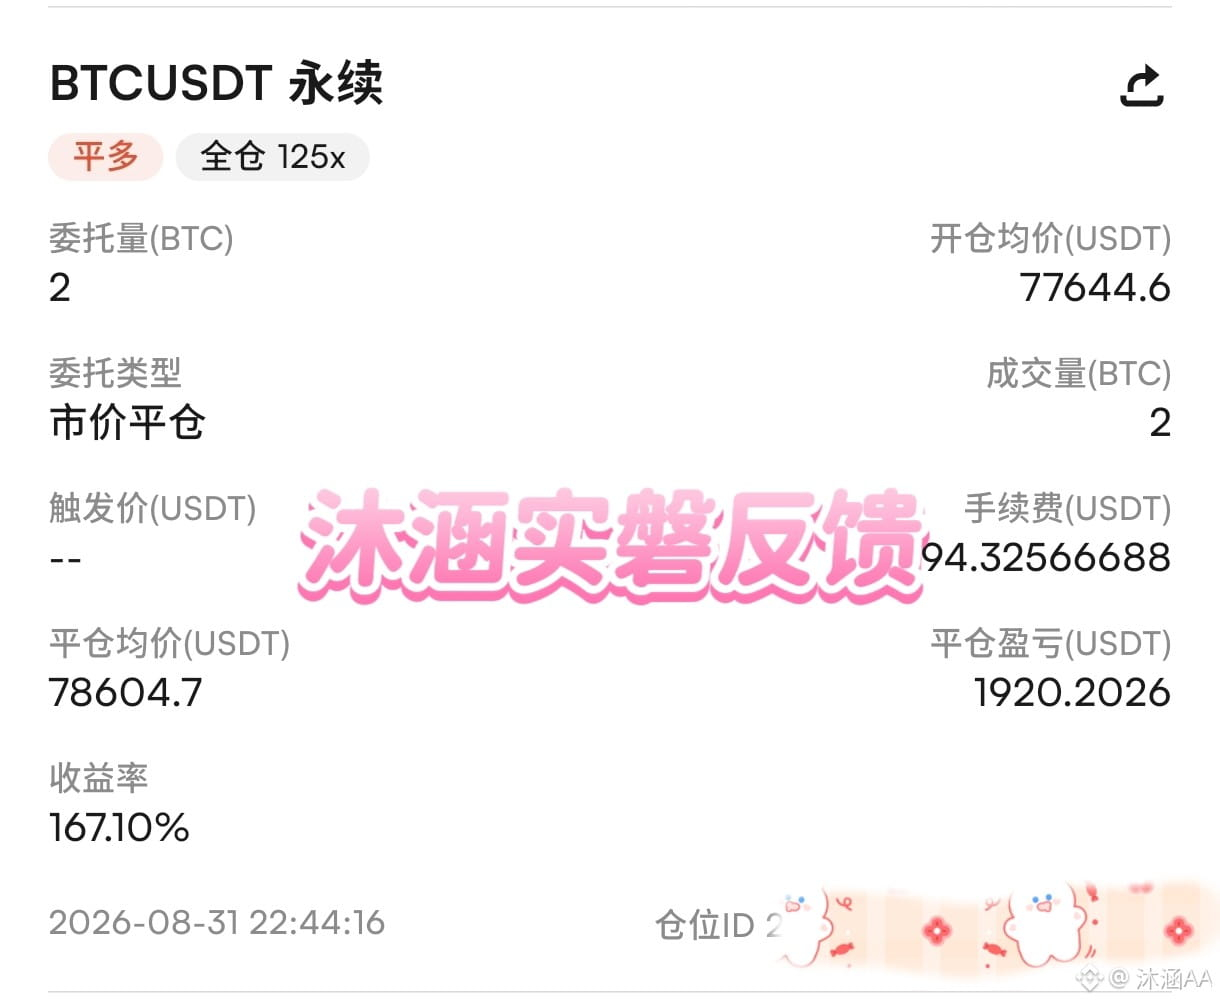
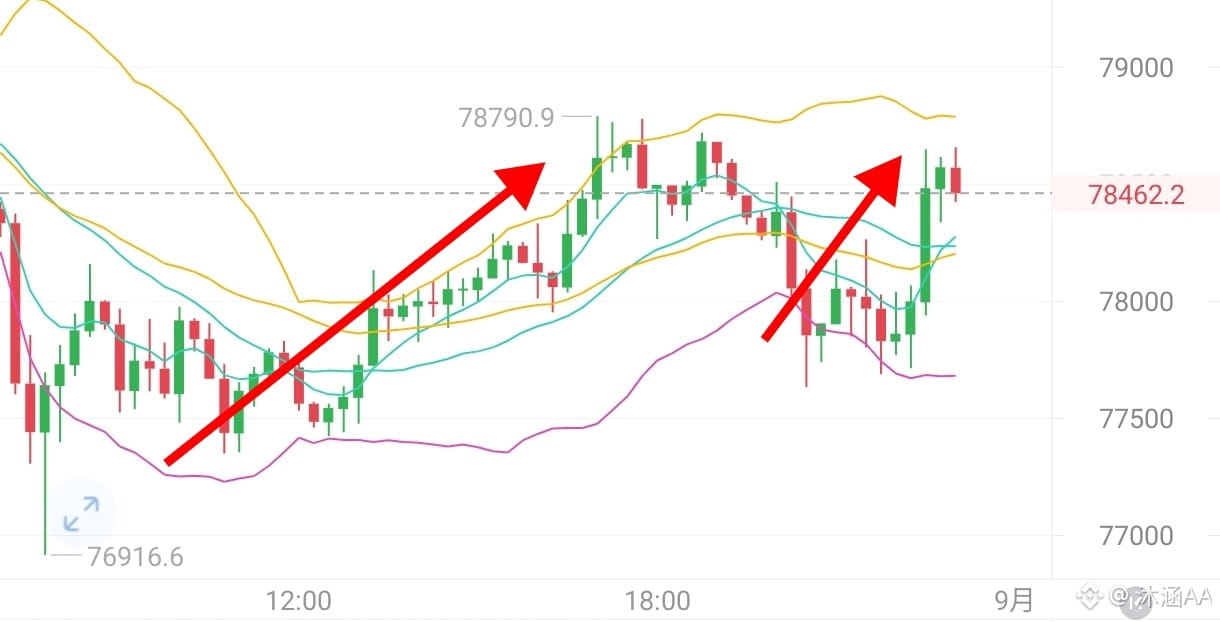
Today, the short-term market provided two pullback opportunities to go long—got them both.
The first wave: at noon, 77437 laid out a long position, and at 4:00 PM, 78043 successfully took profit;
The second wave: at 8:00 PM at night, 77644 once again gave an entry opportunity, and the market directly moved out with more than a 1,000-point upward space.
In trading, it’s not about opening orders nonstop, but waiting for high-certainty opportunities.
Watch the pullback support, enter in line with the trend—one wave of price action is enough.
Want to catch the trades right away? Follow Mu Han! #SK海力士研究在日本合建存储芯片厂 $XAU
The first wave: at noon, 77437 laid out a long position, and at 4:00 PM, 78043 successfully took profit;
The second wave: at 8:00 PM at night, 77644 once again gave an entry opportunity, and the market directly moved out with more than a 1,000-point upward space.
In trading, it’s not about opening orders nonstop, but waiting for high-certainty opportunities.
Watch the pullback support, enter in line with the trend—one wave of price action is enough.
Want to catch the trades right away? Follow Mu Han! #SK海力士研究在日本合建存储芯片厂 $XAU
The real core focus of the market this week is only one thing: Non-Farm Payrolls (NFP).
Currently, the market has already priced in high expectations for a September rate cut, but expectations are not reality—what’s missing is a piece of real employment data.
The U.S. August Non-Farm Payrolls employment report to be released this Friday is the key test of these expectations.
✅ If employment continues to weaken: the market will further reinforce trading expectations for a rate cut;
⚠️ If employment remains resilient: the market will once again question whether the Fed will truly pivot to easing quickly.
So this week, you don’t need to overthink short-term up and down moves.
Before the NFP is released, the market is mostly trading expectations; only after the data comes out will there be a real repricing of the market.
This week, besides the NFP, there will also be the G20 finance ministers and central bank governors meeting, speeches by FOMC voting members, and earnings reports from Dell and Broadcom.
Macroeconomic policy and technology earnings bring multiple variables into play at once.
The closer you get to the key data window, the more likely it is that the market will trade expectations ahead of time—and the more prone it is to sudden volatility driven by an “expectation gap.”
If you can’t be sure of the direction, follow Mu Han! $GOOGL.US #布伦特原油涨破90美元
Currently, the market has already priced in high expectations for a September rate cut, but expectations are not reality—what’s missing is a piece of real employment data.
The U.S. August Non-Farm Payrolls employment report to be released this Friday is the key test of these expectations.
✅ If employment continues to weaken: the market will further reinforce trading expectations for a rate cut;
⚠️ If employment remains resilient: the market will once again question whether the Fed will truly pivot to easing quickly.
So this week, you don’t need to overthink short-term up and down moves.
Before the NFP is released, the market is mostly trading expectations; only after the data comes out will there be a real repricing of the market.
This week, besides the NFP, there will also be the G20 finance ministers and central bank governors meeting, speeches by FOMC voting members, and earnings reports from Dell and Broadcom.
Macroeconomic policy and technology earnings bring multiple variables into play at once.
The closer you get to the key data window, the more likely it is that the market will trade expectations ahead of time—and the more prone it is to sudden volatility driven by an “expectation gap.”
If you can’t be sure of the direction, follow Mu Han! $GOOGL.US #布伦特原油涨破90美元

CL+2.70%
GOOGLUS-0.15%
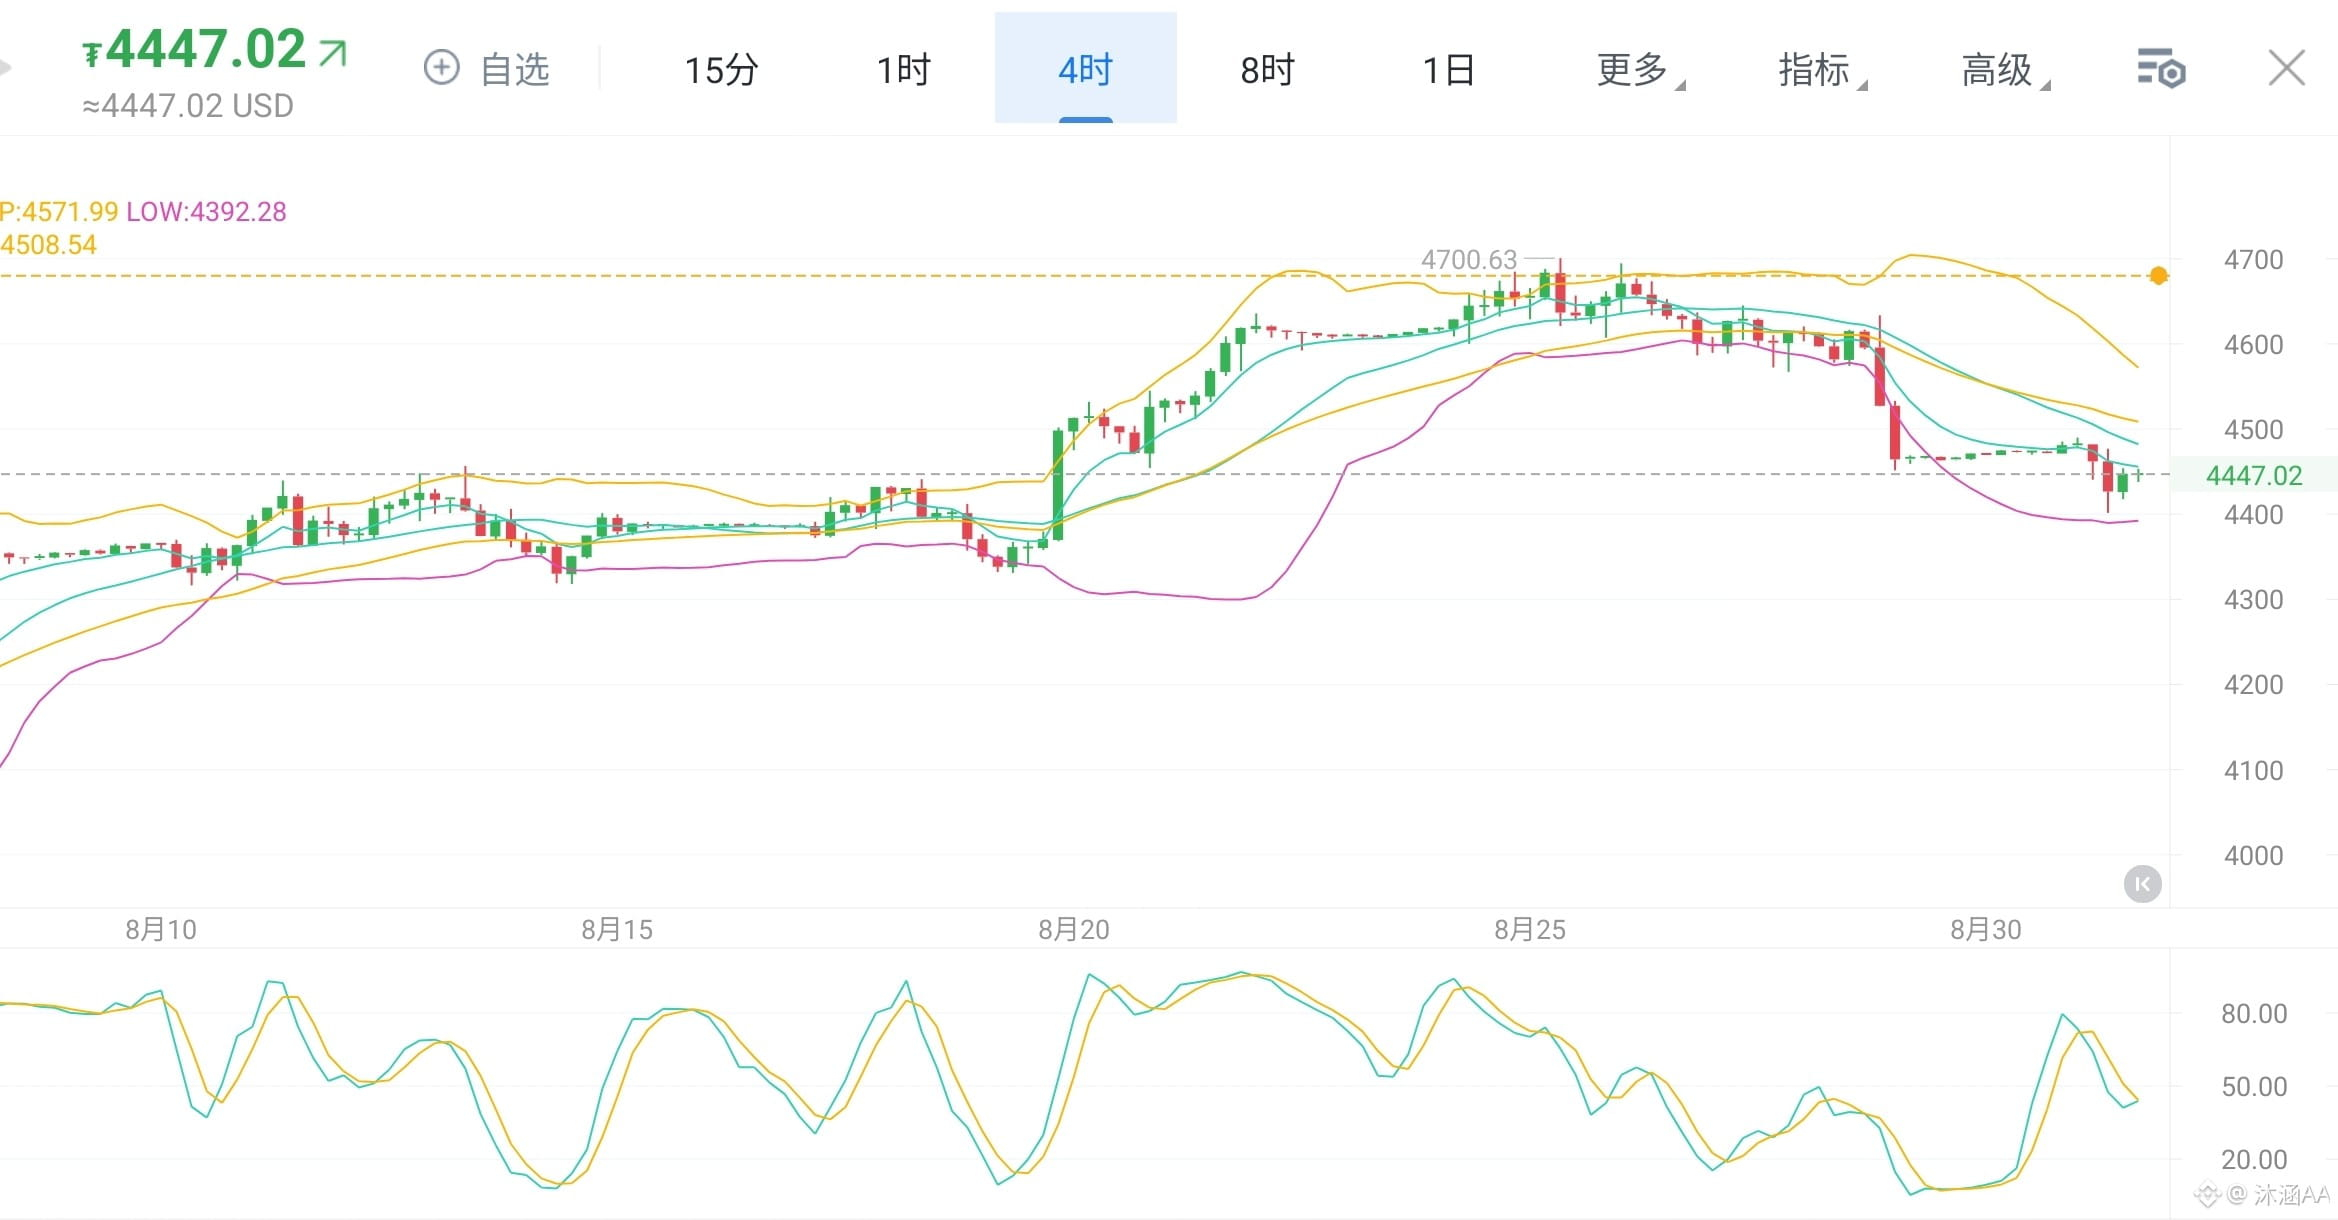
8.31 Gold Evening Outlook
Current gold price is trading around 4447. From the 1-hour chart, after a period of continuous sharp declines, the market has entered a low-range consolidation and repair phase. During the daytime session, price probed down to the 4396 low and then quickly rebounded, indicating there is support below. However, the rebound strength is limited, and the larger-scale downtrend structure has not been broken. This should be viewed as consolidation after a big drop—not a reversal.
For short-term upside pressure, watch 4470-4480. This is the key level for intraday rebounds. If price reaches this range and meets resistance, there is still potential for a pullback. On the downside, focus on support at 4430, which is the area repeatedly tested during the daytime. If this level breaks, the market may probe again to test the 4396 low.
Short on the rebound: If price rebounds into 4470-4480 and faces resistance, consider shorting. Targets: 4440 first, then further down at 4430.
Long at low levels: If price pulls back toward 4430 and stabilizes, consider going long with a light position. Target: 4460-4470{#布伦特原油涨破90美元 $XAU }
Current gold price is trading around 4447. From the 1-hour chart, after a period of continuous sharp declines, the market has entered a low-range consolidation and repair phase. During the daytime session, price probed down to the 4396 low and then quickly rebounded, indicating there is support below. However, the rebound strength is limited, and the larger-scale downtrend structure has not been broken. This should be viewed as consolidation after a big drop—not a reversal.
For short-term upside pressure, watch 4470-4480. This is the key level for intraday rebounds. If price reaches this range and meets resistance, there is still potential for a pullback. On the downside, focus on support at 4430, which is the area repeatedly tested during the daytime. If this level breaks, the market may probe again to test the 4396 low.
Short on the rebound: If price rebounds into 4470-4480 and faces resistance, consider shorting. Targets: 4440 first, then further down at 4430.
Long at low levels: If price pulls back toward 4430 and stabilizes, consider going long with a light position. Target: 4460-4470{#布伦特原油涨破90美元 $XAU }
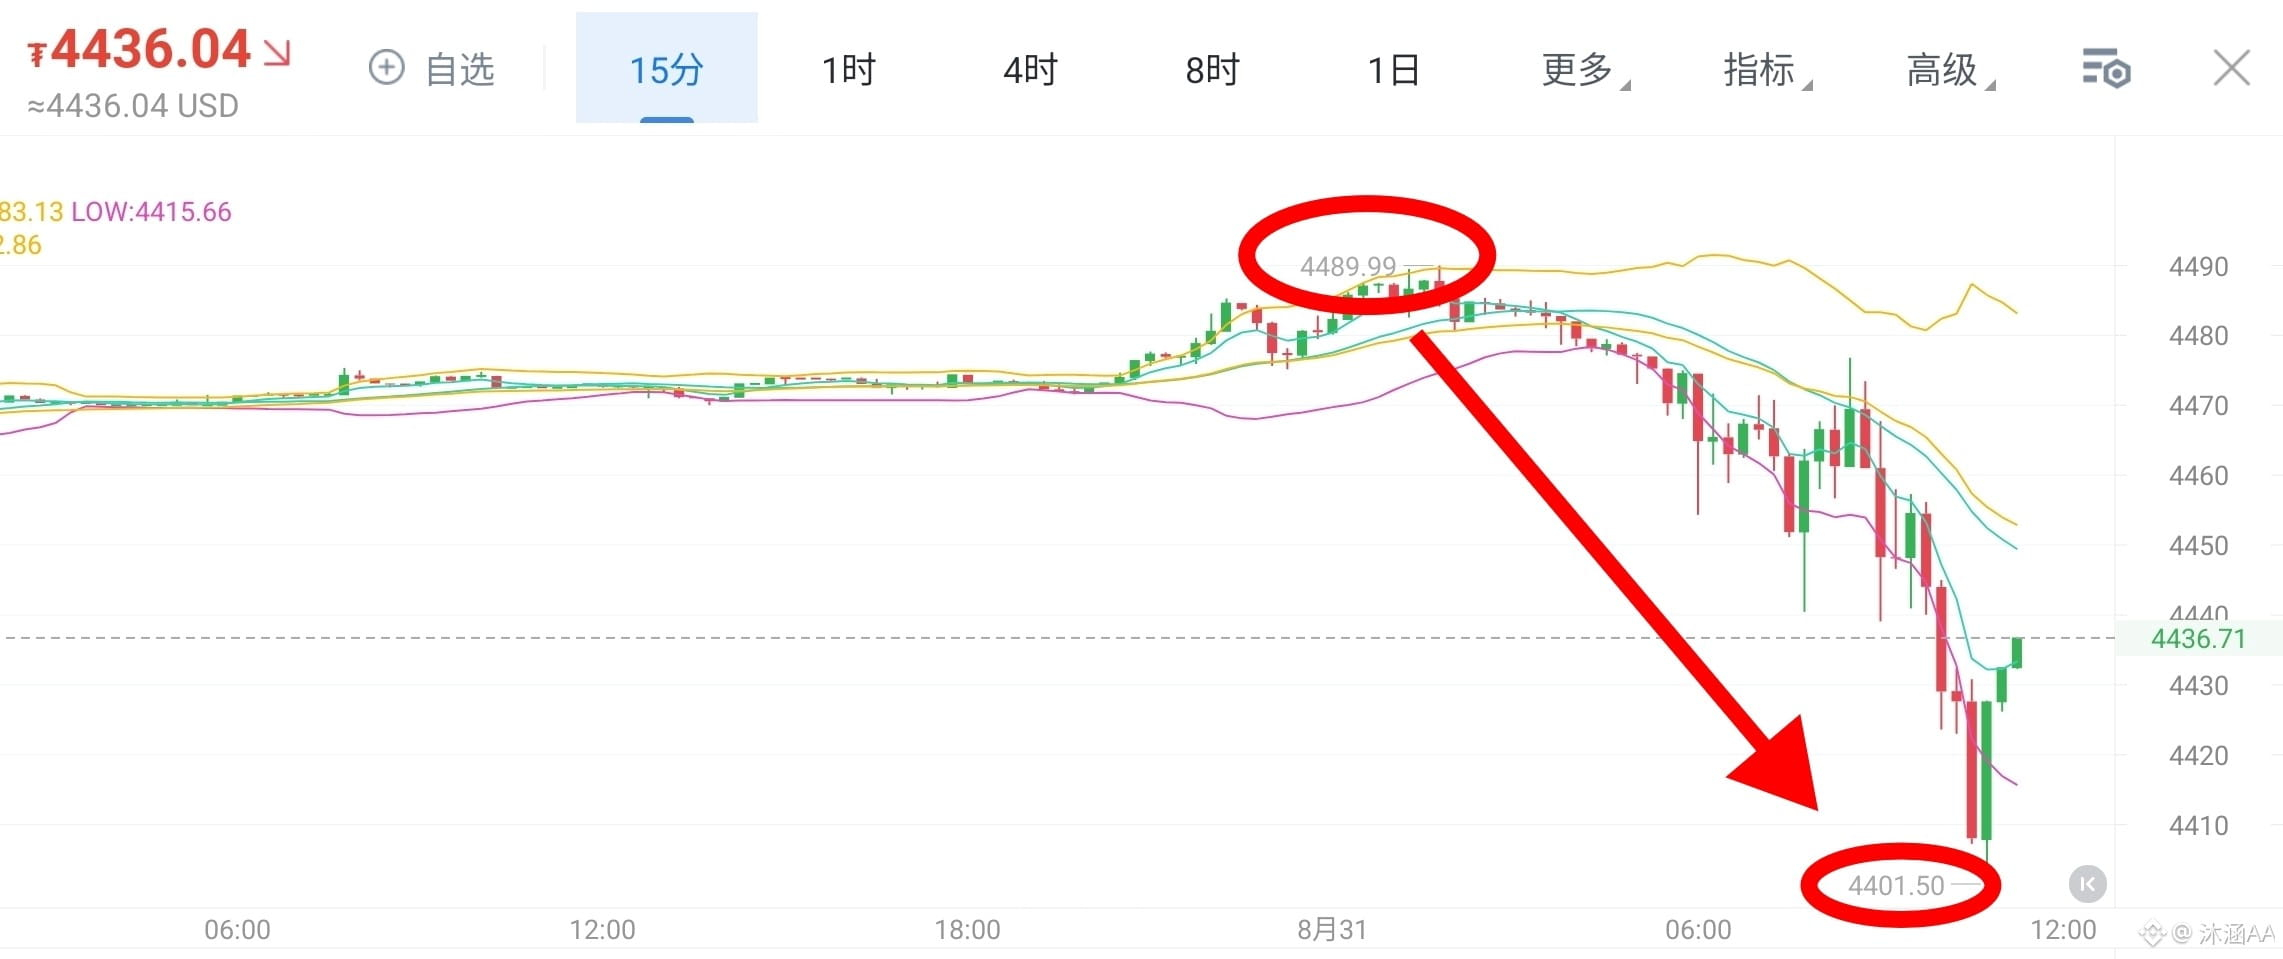
Perfect fulfillment of the short position on gold ✨
On Saturday, the tip was to first look at 4410;
at midnight, it was publicly released at the current price with a bearish playbook.
If it’s going down, it goes down!
Ride the trend and hold it, cash in and bag 30,000 dollars.
Once you understand the trend, going even won’t take you long—everything falls into place 🌾
Want to follow the trades right away? Follow Mu Han! #韩国单股杠杆ETF交易下降 $XAU
On Saturday, the tip was to first look at 4410;
at midnight, it was publicly released at the current price with a bearish playbook.
If it’s going down, it goes down!
Ride the trend and hold it, cash in and bag 30,000 dollars.
Once you understand the trend, going even won’t take you long—everything falls into place 🌾
Want to follow the trades right away? Follow Mu Han! #韩国单股杠杆ETF交易下降 $XAU


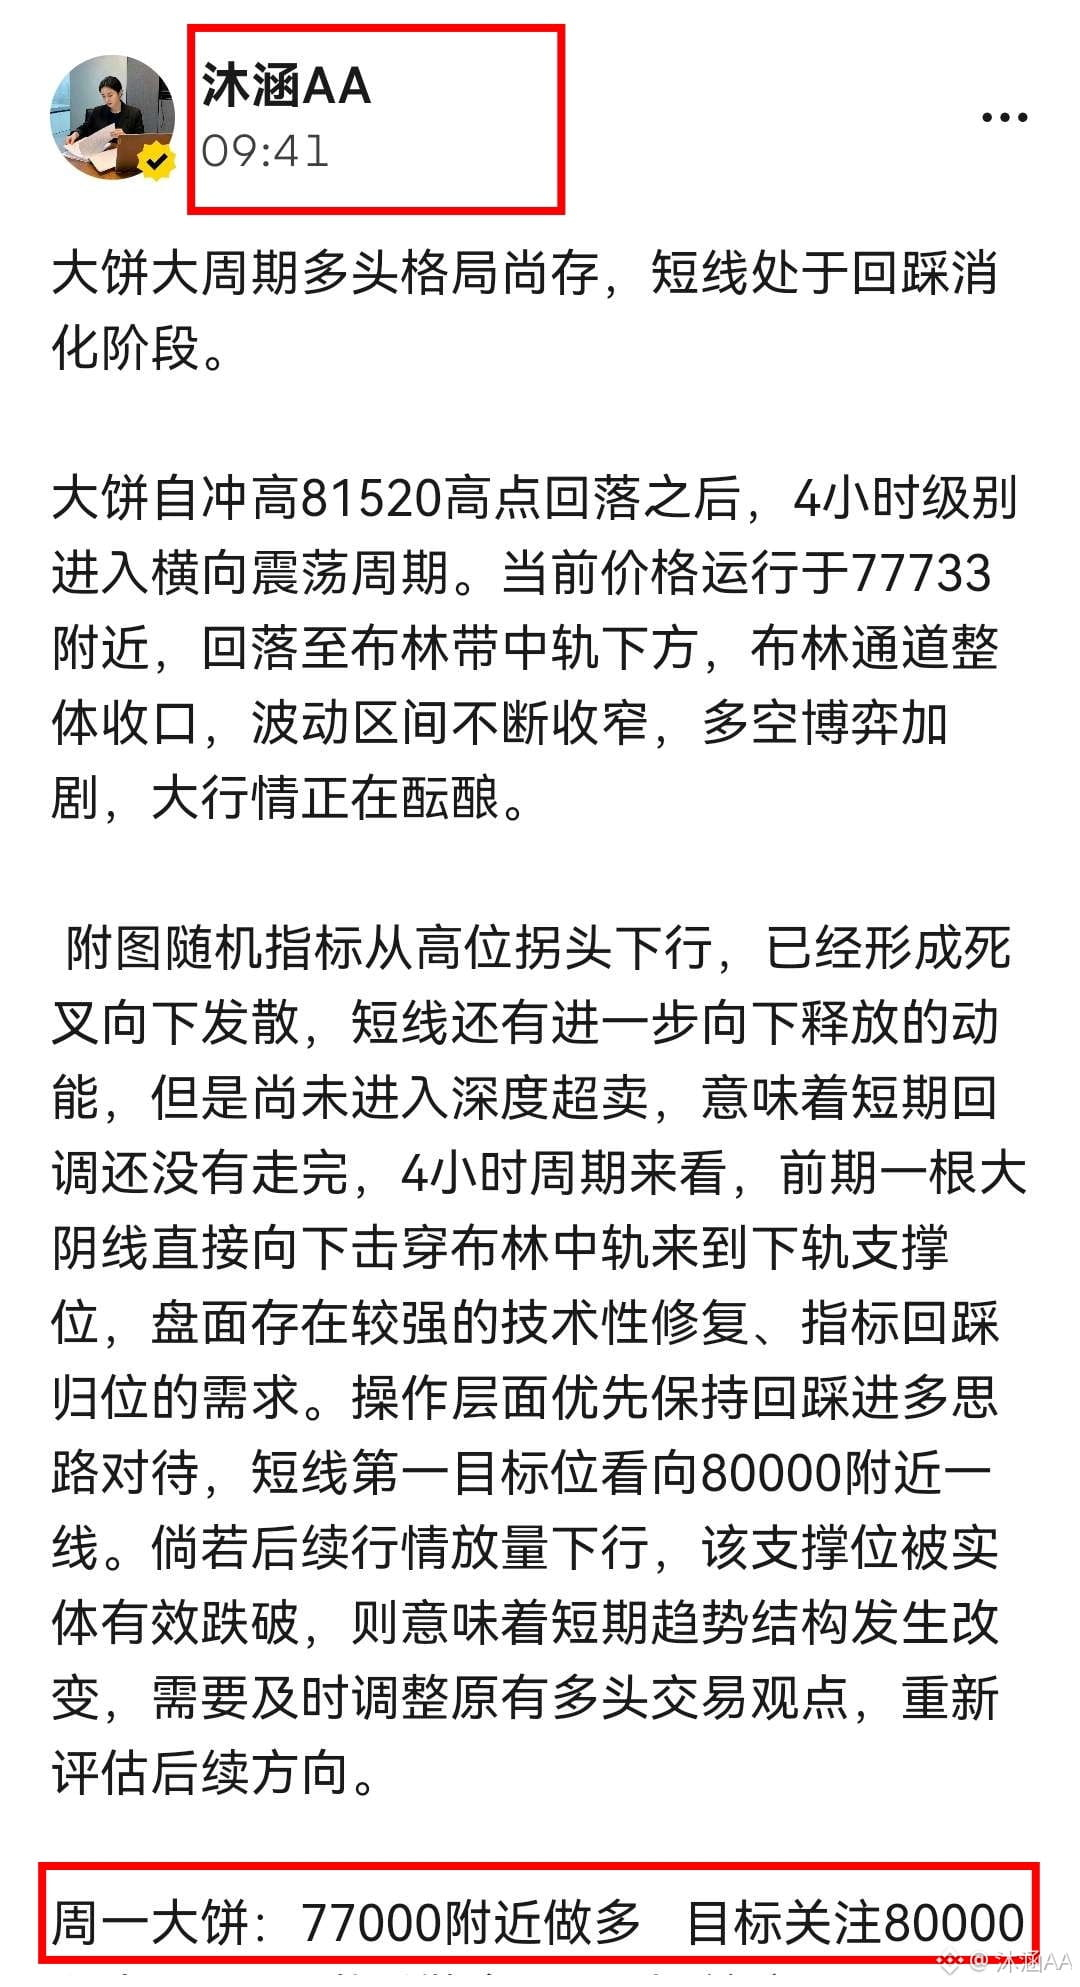
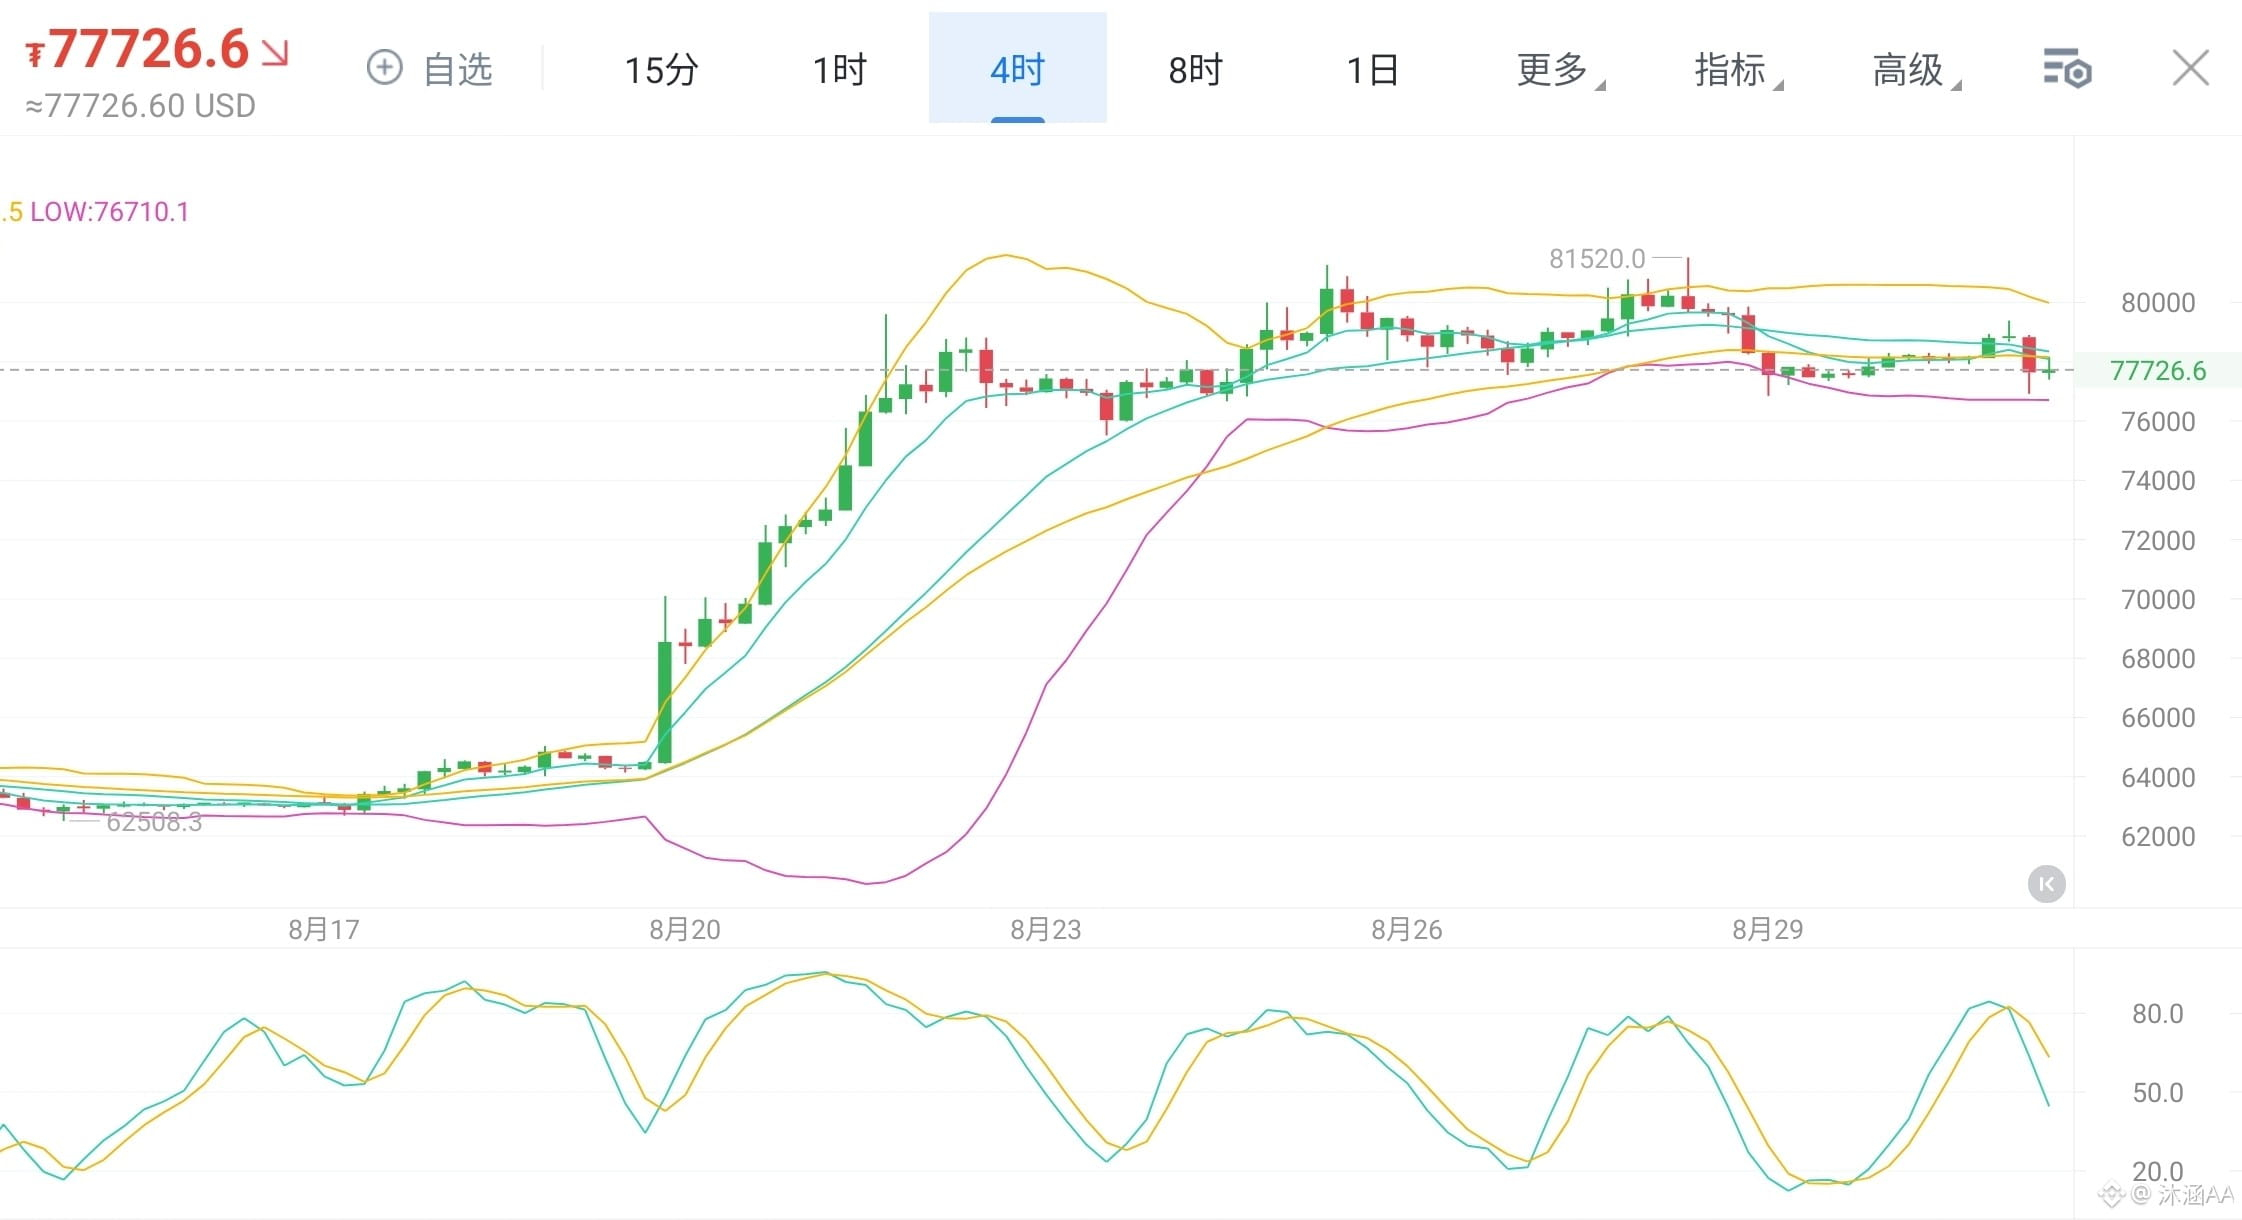
The bullish big-bill (large-cycle) uptrend structure is still intact, while the short-term is in a pullback and digestion phase.
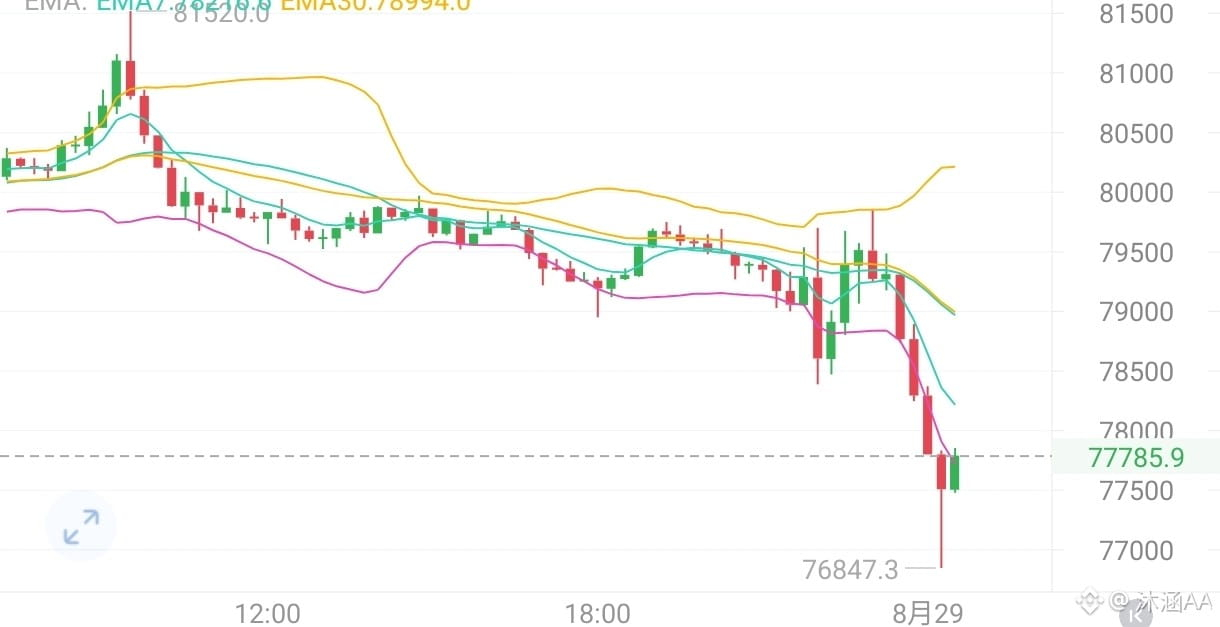
After the Big Bill topped out at the 81520 high and then fell, the 4-hour timeframe entered a sideways consolidation cycle. Current price is hovering around 77733. It has fallen below the middle band of the Bollinger Bands; the Bollinger channel as a whole is contracting, the fluctuation range is steadily narrowing, and the tug-of-war between bulls and bears is intensifying—indicating that a major move is being brewed.
The attached random indicators have turned down from the high. A death cross has already formed and is diverging downward. There is still momentum for further downside release in the short term, but it has not yet entered deep oversold conditions. This means the short-term correction is not fully finished. From the perspective of the 4-hour cycle, the earlier large bearish candle directly broke down and pierced through the Bollinger middle band, reaching the lower-band support zone. The chart still suggests a need for stronger technical repair—an indicator pullback to realign and “reset.”
In terms of execution, prioritize a strategy that treats the pullback as an opportunity to go long. For the short-term, the first target zone is around 80000. If the market subsequently sells off with increased volume and this support level is decisively broken by a full-bodied move, it would mean the short-term trend structure has changed. In that case, you should promptly adjust the original bullish trading view and reassess the subsequent direction.
On Monday, Big Bill: go long around 77000, target around 80000
Ethereum: go long around 2400, target around 2500#首笔抗量子比特币交易主网完成 $BTC
After the Big Bill topped out at the 81520 high and then fell, the 4-hour timeframe entered a sideways consolidation cycle. Current price is hovering around 77733. It has fallen below the middle band of the Bollinger Bands; the Bollinger channel as a whole is contracting, the fluctuation range is steadily narrowing, and the tug-of-war between bulls and bears is intensifying—indicating that a major move is being brewed.
The attached random indicators have turned down from the high. A death cross has already formed and is diverging downward. There is still momentum for further downside release in the short term, but it has not yet entered deep oversold conditions. This means the short-term correction is not fully finished. From the perspective of the 4-hour cycle, the earlier large bearish candle directly broke down and pierced through the Bollinger middle band, reaching the lower-band support zone. The chart still suggests a need for stronger technical repair—an indicator pullback to realign and “reset.”
In terms of execution, prioritize a strategy that treats the pullback as an opportunity to go long. For the short-term, the first target zone is around 80000. If the market subsequently sells off with increased volume and this support level is decisively broken by a full-bodied move, it would mean the short-term trend structure has changed. In that case, you should promptly adjust the original bullish trading view and reassess the subsequent direction.
On Monday, Big Bill: go long around 77000, target around 80000
Ethereum: go long around 2400, target around 2500#首笔抗量子比特币交易主网完成 $BTC
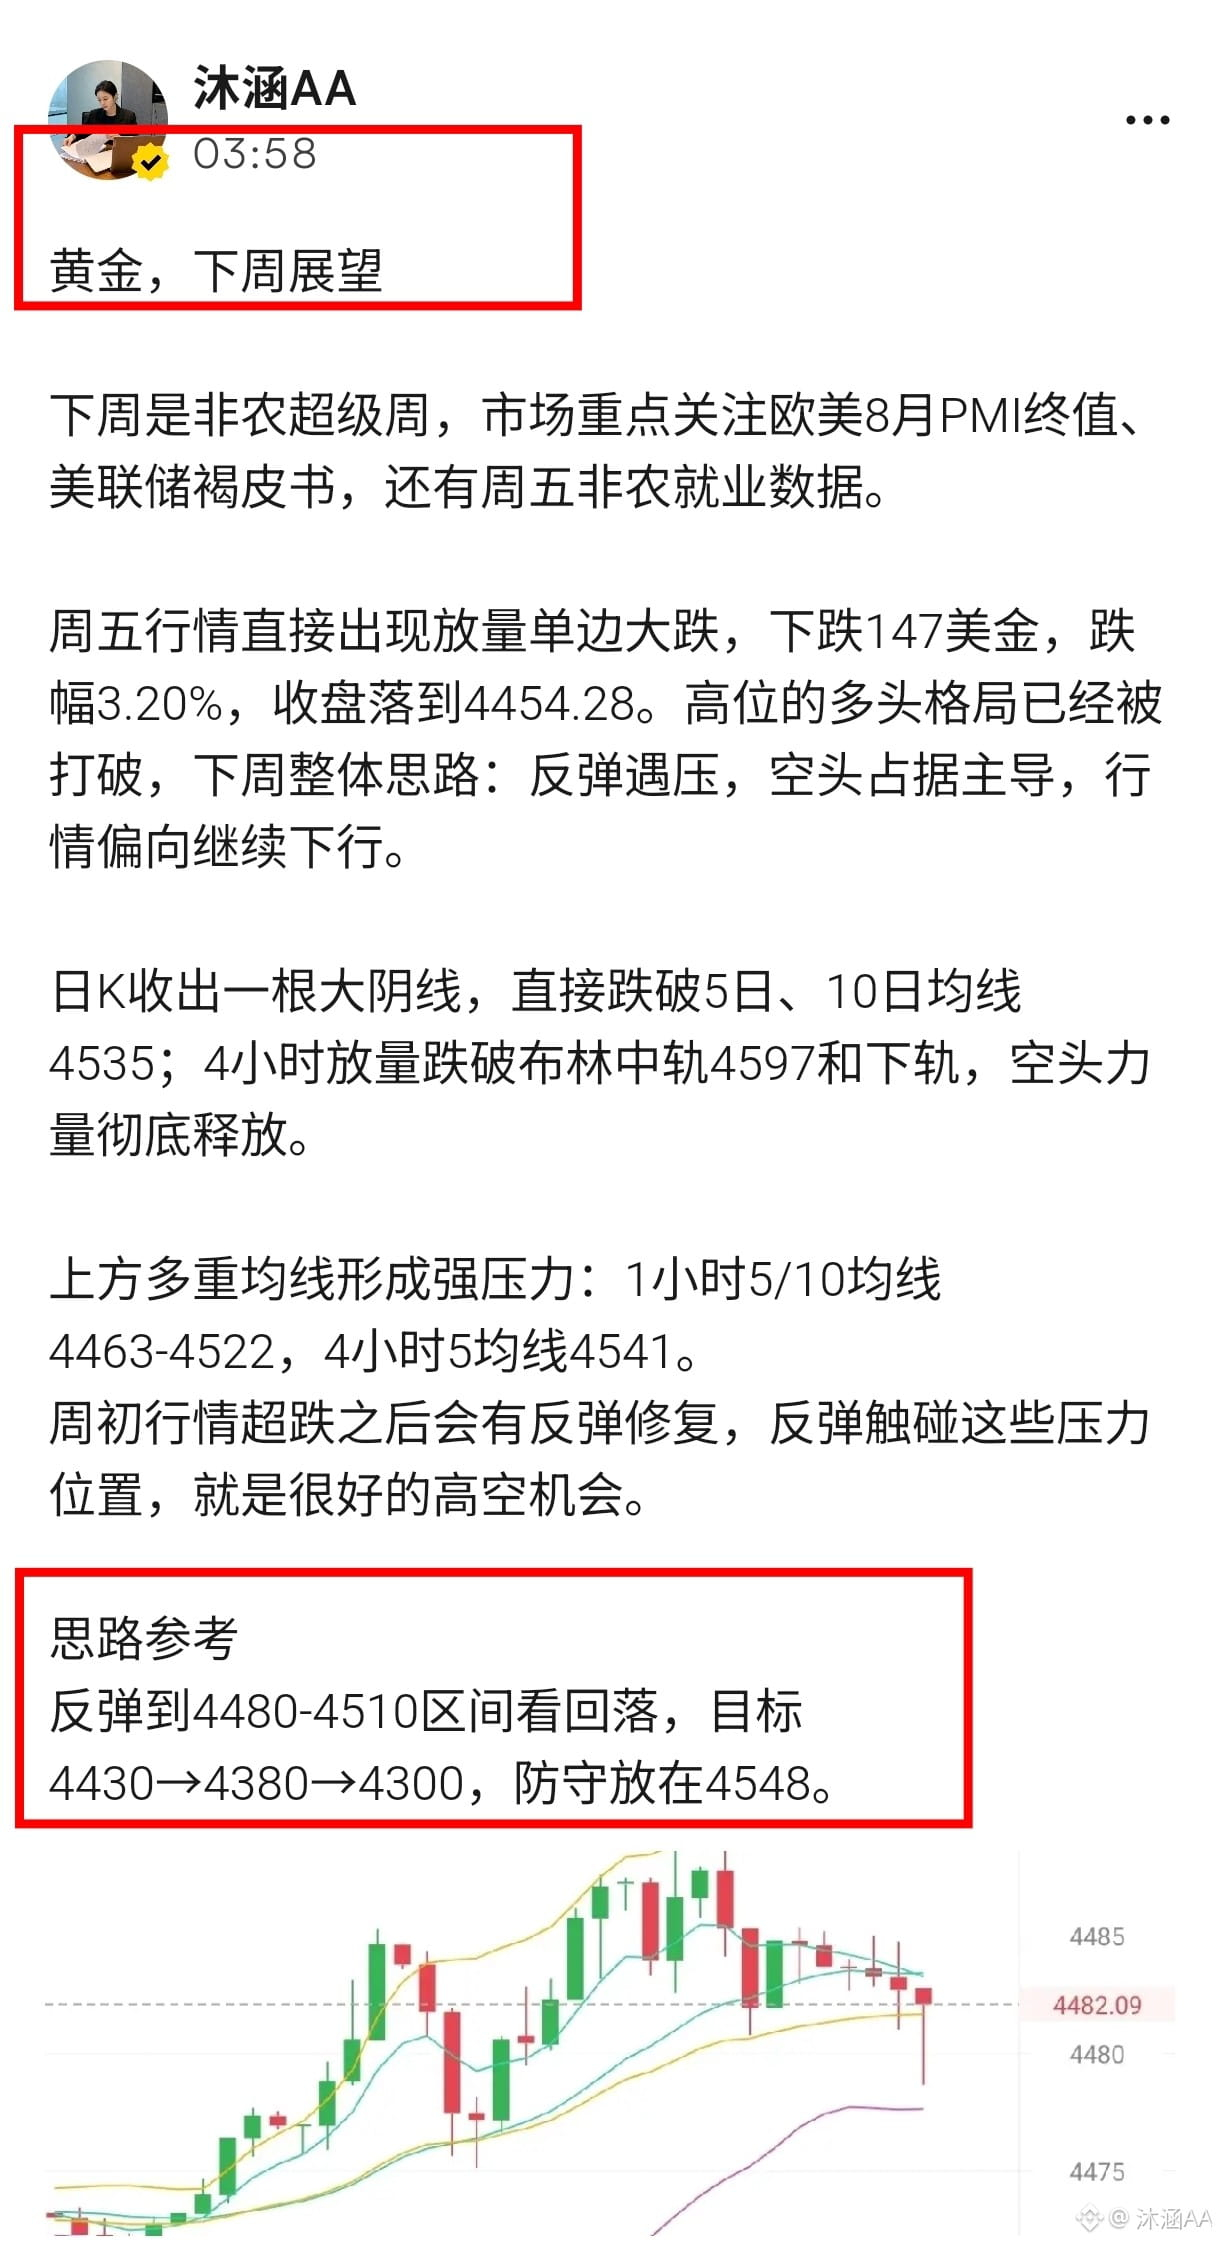
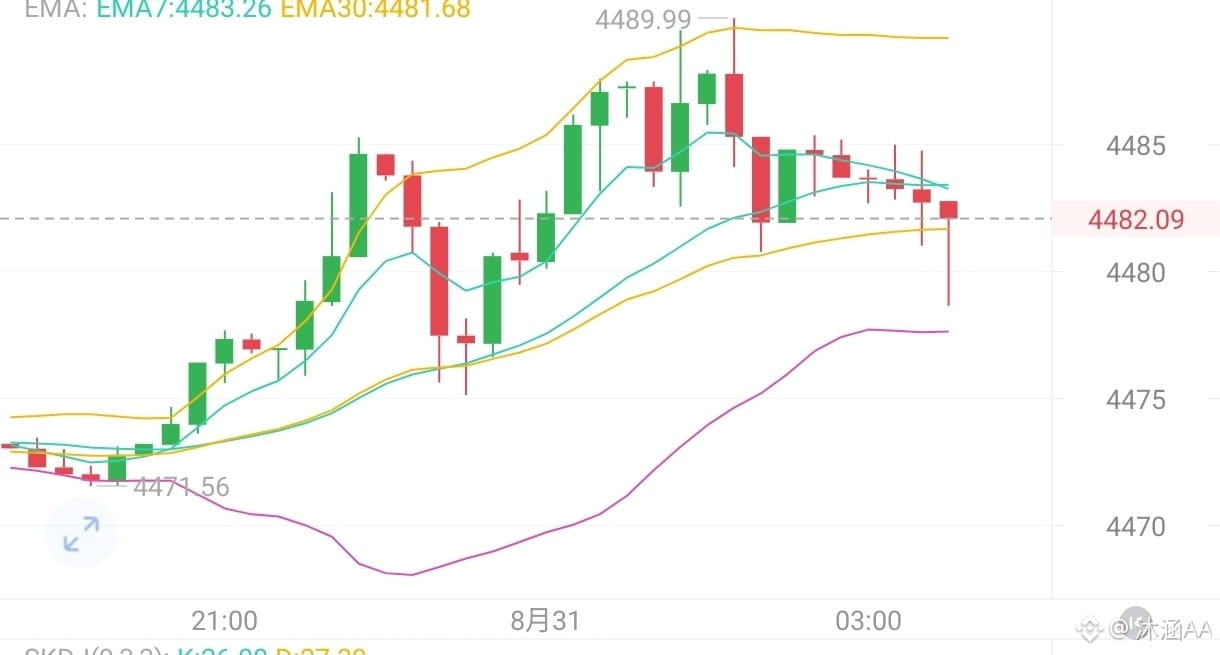
Gold, next week outlook
Next week is the Non-Farm Payrolls super week. The market will focus on the final August PMI readings for Europe and the US, as well as the Fed Beige Book, and then on Friday’s non-farm employment data.
On Friday, price action immediately saw a volume expansion with a one-direction selloff: it dropped by $147, a decline of 3.20%, closing at 4454.28. The long position structure at higher levels has already been broken. The overall outlook for next week is: sell on rallies—bearish momentum dominates, and price action is likely to continue moving lower.
The daily K-line printed a large bearish candle, directly breaking below the 5-day and 10-day moving averages at 4535. On the 4-hour chart, there was a volume expansion and a breakdown below the Bollinger middle band at 4597 and the lower band—bearish force has been fully released.
Multiple moving averages overhead create strong resistance: the 1-hour 5/10 MAs at 4463–4522, and the 4-hour 5 MA at 4541. After the oversold start at the beginning of the week, there may be a rebound and correction. The rebound touching these resistance levels will be a good opportunity to short.
Trading idea reference
Rebound into the 4480–4510 range and look for pullback, targets: 4430 → 4380 → 4300. Place protection/stop at 4548.#黄金本周下跌3.24% $XAU
Next week is the Non-Farm Payrolls super week. The market will focus on the final August PMI readings for Europe and the US, as well as the Fed Beige Book, and then on Friday’s non-farm employment data.
On Friday, price action immediately saw a volume expansion with a one-direction selloff: it dropped by $147, a decline of 3.20%, closing at 4454.28. The long position structure at higher levels has already been broken. The overall outlook for next week is: sell on rallies—bearish momentum dominates, and price action is likely to continue moving lower.
The daily K-line printed a large bearish candle, directly breaking below the 5-day and 10-day moving averages at 4535. On the 4-hour chart, there was a volume expansion and a breakdown below the Bollinger middle band at 4597 and the lower band—bearish force has been fully released.
Multiple moving averages overhead create strong resistance: the 1-hour 5/10 MAs at 4463–4522, and the 4-hour 5 MA at 4541. After the oversold start at the beginning of the week, there may be a rebound and correction. The rebound touching these resistance levels will be a good opportunity to short.
Trading idea reference
Rebound into the 4480–4510 range and look for pullback, targets: 4430 → 4380 → 4300. Place protection/stop at 4548.#黄金本周下跌3.24% $XAU
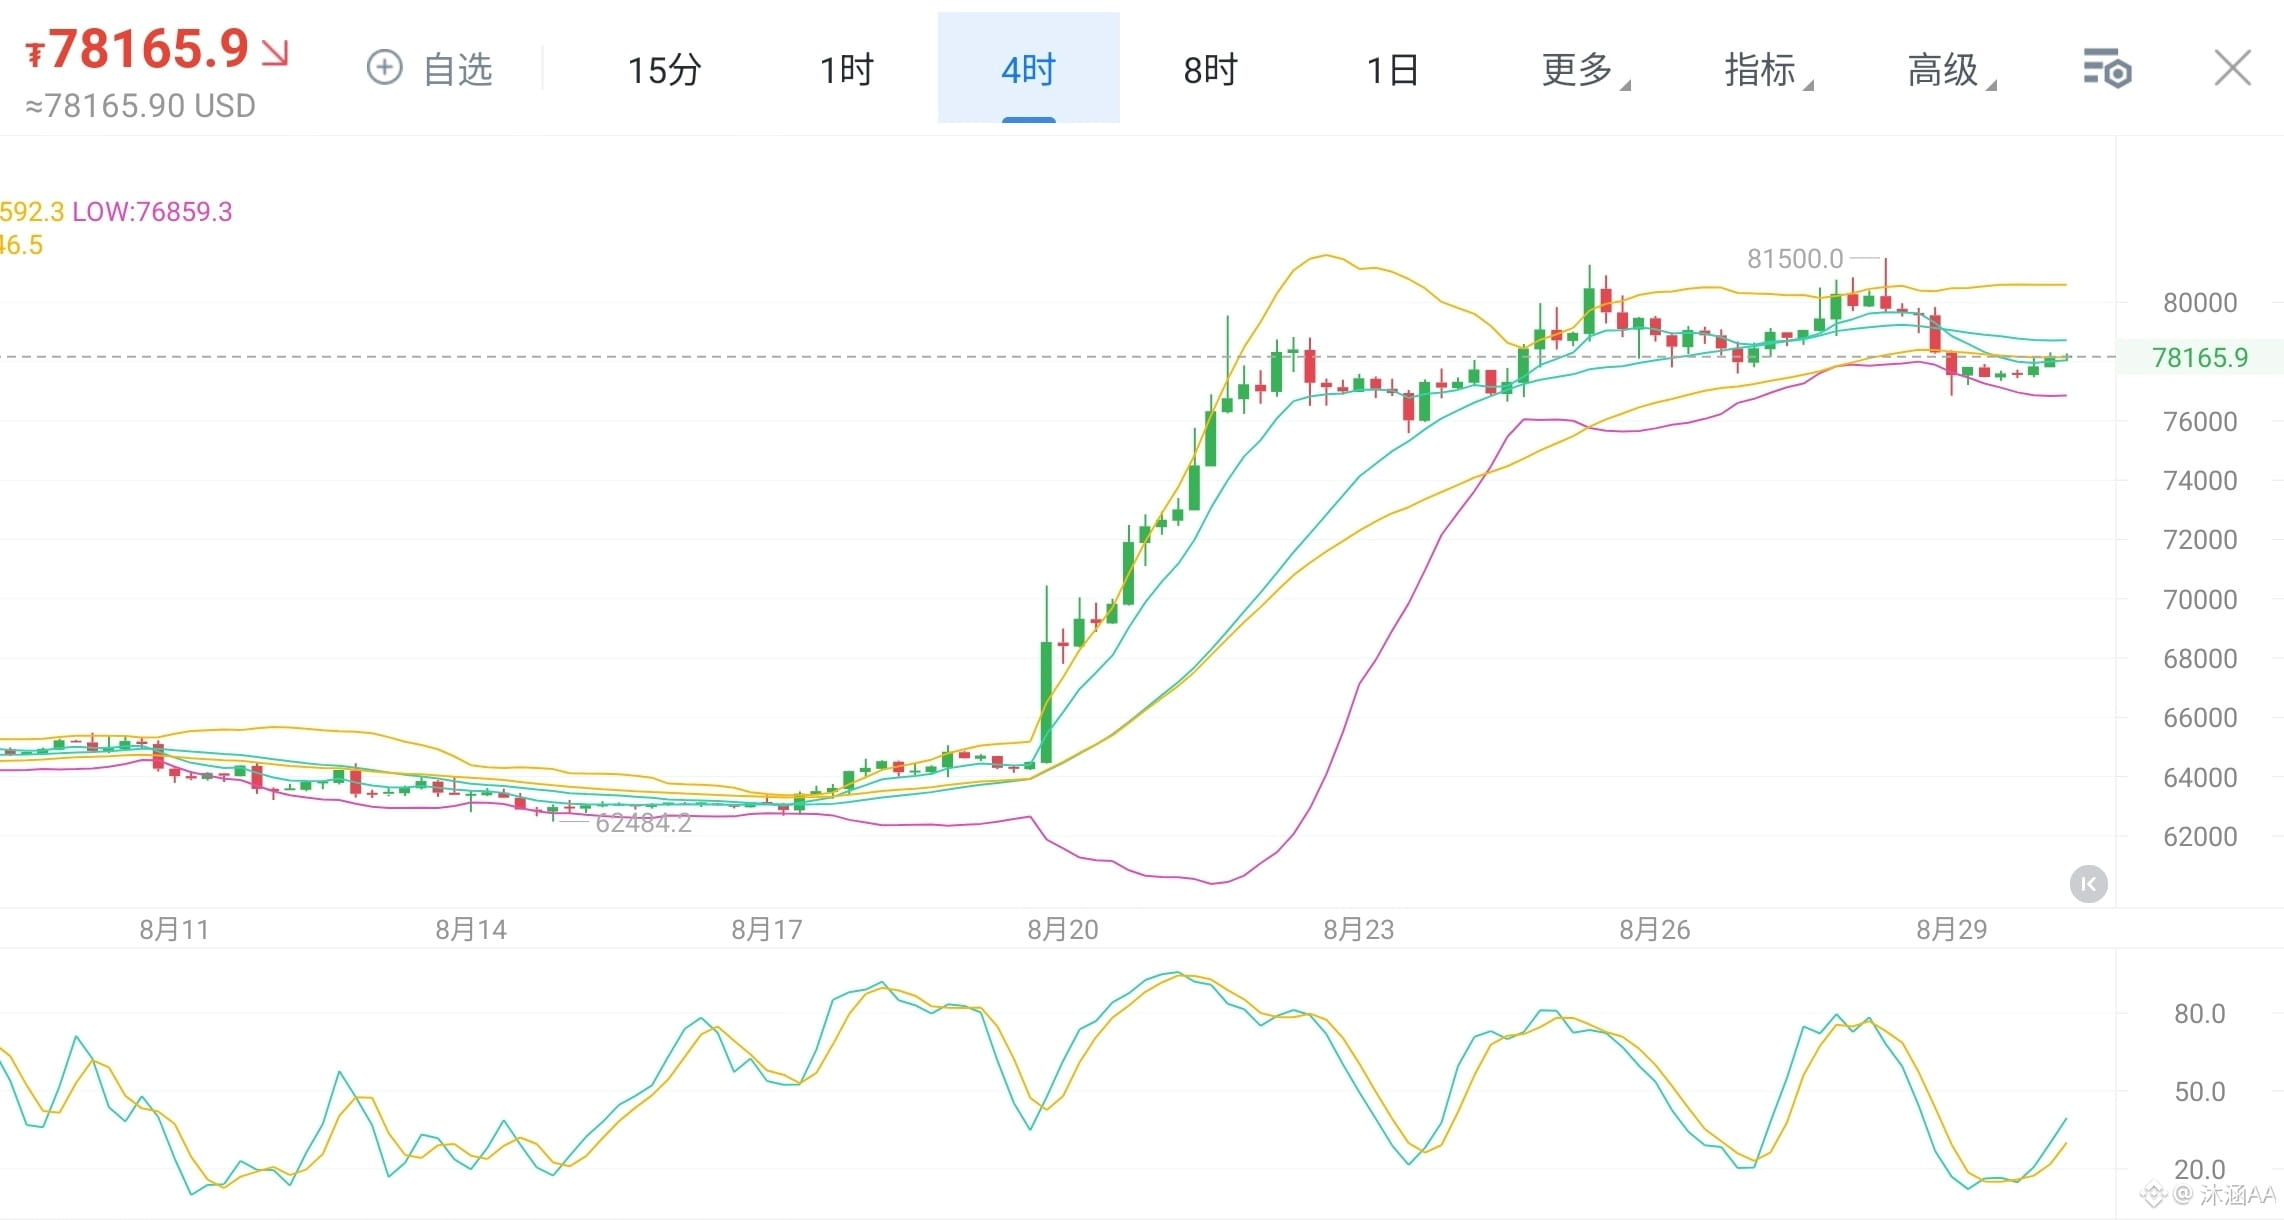
8.30 Big Pie (BTC) Viewpoint 🔥
After rallying to 81,500 and meeting resistance before pulling back, BTC is currently in a high-range consolidation phase, with the current price around 78,198.
From the four-hour chart, the price pulled back to the vicinity of the Bollinger middle band, where it found support; in the short term, there hasn’t been an extreme breakdown to the downside. The SKD indicator has turned upward from a low level, and after being oversold, it’s now seeing a slight rebound/repair.
After a round of deep pullback, the bearish momentum in the short term has been somewhat released. The market has shifted from one-way selling into a tug-of-war between bulls and bears.
Many people are currently stuck on this: has the correction already ended, and can the up-move begin again?
My view: at the moment, it can only be characterized as a rebound repair after a decline; it cannot directly confirm the start of a new uptrend yet.
The first strong resistance zone is 79,200–80,000. Only if the price holds above 80,000 will the bulls regain initiative and there will be a chance to once again test the previous high at 81,500.
The key support area below is 76,800–76,600—this is the bottom defense line of the recent consolidation.
If this level is decisively broken downward, then this rebound will be declared over, and the market will start a deeper pullback, with an outlook toward the 74,600 area.
Over the weekend, it’s very likely to be range-bound trading. You can consider selling near the range high and buying near the range low #比特币24小时跌3.4%至7.74万美元 $BTC
After rallying to 81,500 and meeting resistance before pulling back, BTC is currently in a high-range consolidation phase, with the current price around 78,198.
From the four-hour chart, the price pulled back to the vicinity of the Bollinger middle band, where it found support; in the short term, there hasn’t been an extreme breakdown to the downside. The SKD indicator has turned upward from a low level, and after being oversold, it’s now seeing a slight rebound/repair.
After a round of deep pullback, the bearish momentum in the short term has been somewhat released. The market has shifted from one-way selling into a tug-of-war between bulls and bears.
Many people are currently stuck on this: has the correction already ended, and can the up-move begin again?
My view: at the moment, it can only be characterized as a rebound repair after a decline; it cannot directly confirm the start of a new uptrend yet.
The first strong resistance zone is 79,200–80,000. Only if the price holds above 80,000 will the bulls regain initiative and there will be a chance to once again test the previous high at 81,500.
The key support area below is 76,800–76,600—this is the bottom defense line of the recent consolidation.
If this level is decisively broken downward, then this rebound will be declared over, and the market will start a deeper pullback, with an outlook toward the 74,600 area.
Over the weekend, it’s very likely to be range-bound trading. You can consider selling near the range high and buying near the range low #比特币24小时跌3.4%至7.74万美元 $BTC
Good night💤
Tune your life to the channel you like.
With the weekend market closed for trading, you can temporarily set aside the screen, rest and relax, and build up energy while you wait for what’s next in the market.#比特币24小时跌3.4%至7.74万美元 $XAU
Tune your life to the channel you like.
With the weekend market closed for trading, you can temporarily set aside the screen, rest and relax, and build up energy while you wait for what’s next in the market.#比特币24小时跌3.4%至7.74万美元 $XAU

August is already nearing the end. During this period, I’ve been doing my utmost to ensure everything is as complete as possible. I believe that with everyone continuing to follow Muhan’s footsteps in the “golden September and silver October,” gains will only rise in a step-by-step manner! After the recent big market swings and the washout from the remarks by Wo Shi, a whole new group of “⭕” friends who are at a loss due to losses have emerged. However, if you’ve been paying attention to Muhan, then you definitely aren’t one of them! Next, I’m planning to整理 our thoughts on the future market layout together with partners who are in sync.
🔹 Short-term trading & swing交流: capital range 1W–3W USD. The thinking is aligned—your plan can be adjusted flexibly for entries and exits.
There are only 8 spots. My energy is truly limited; I can’t guarantee the communication quality if there are more.
As long as you trust me enough, I will carry the weight and move forward!
#比特币24小时跌3.4%至7.74万美元 $BTC
🔹 Short-term trading & swing交流: capital range 1W–3W USD. The thinking is aligned—your plan can be adjusted flexibly for entries and exits.
There are only 8 spots. My energy is truly limited; I can’t guarantee the communication quality if there are more.
As long as you trust me enough, I will carry the weight and move forward!
#比特币24小时跌3.4%至7.74万美元 $BTC
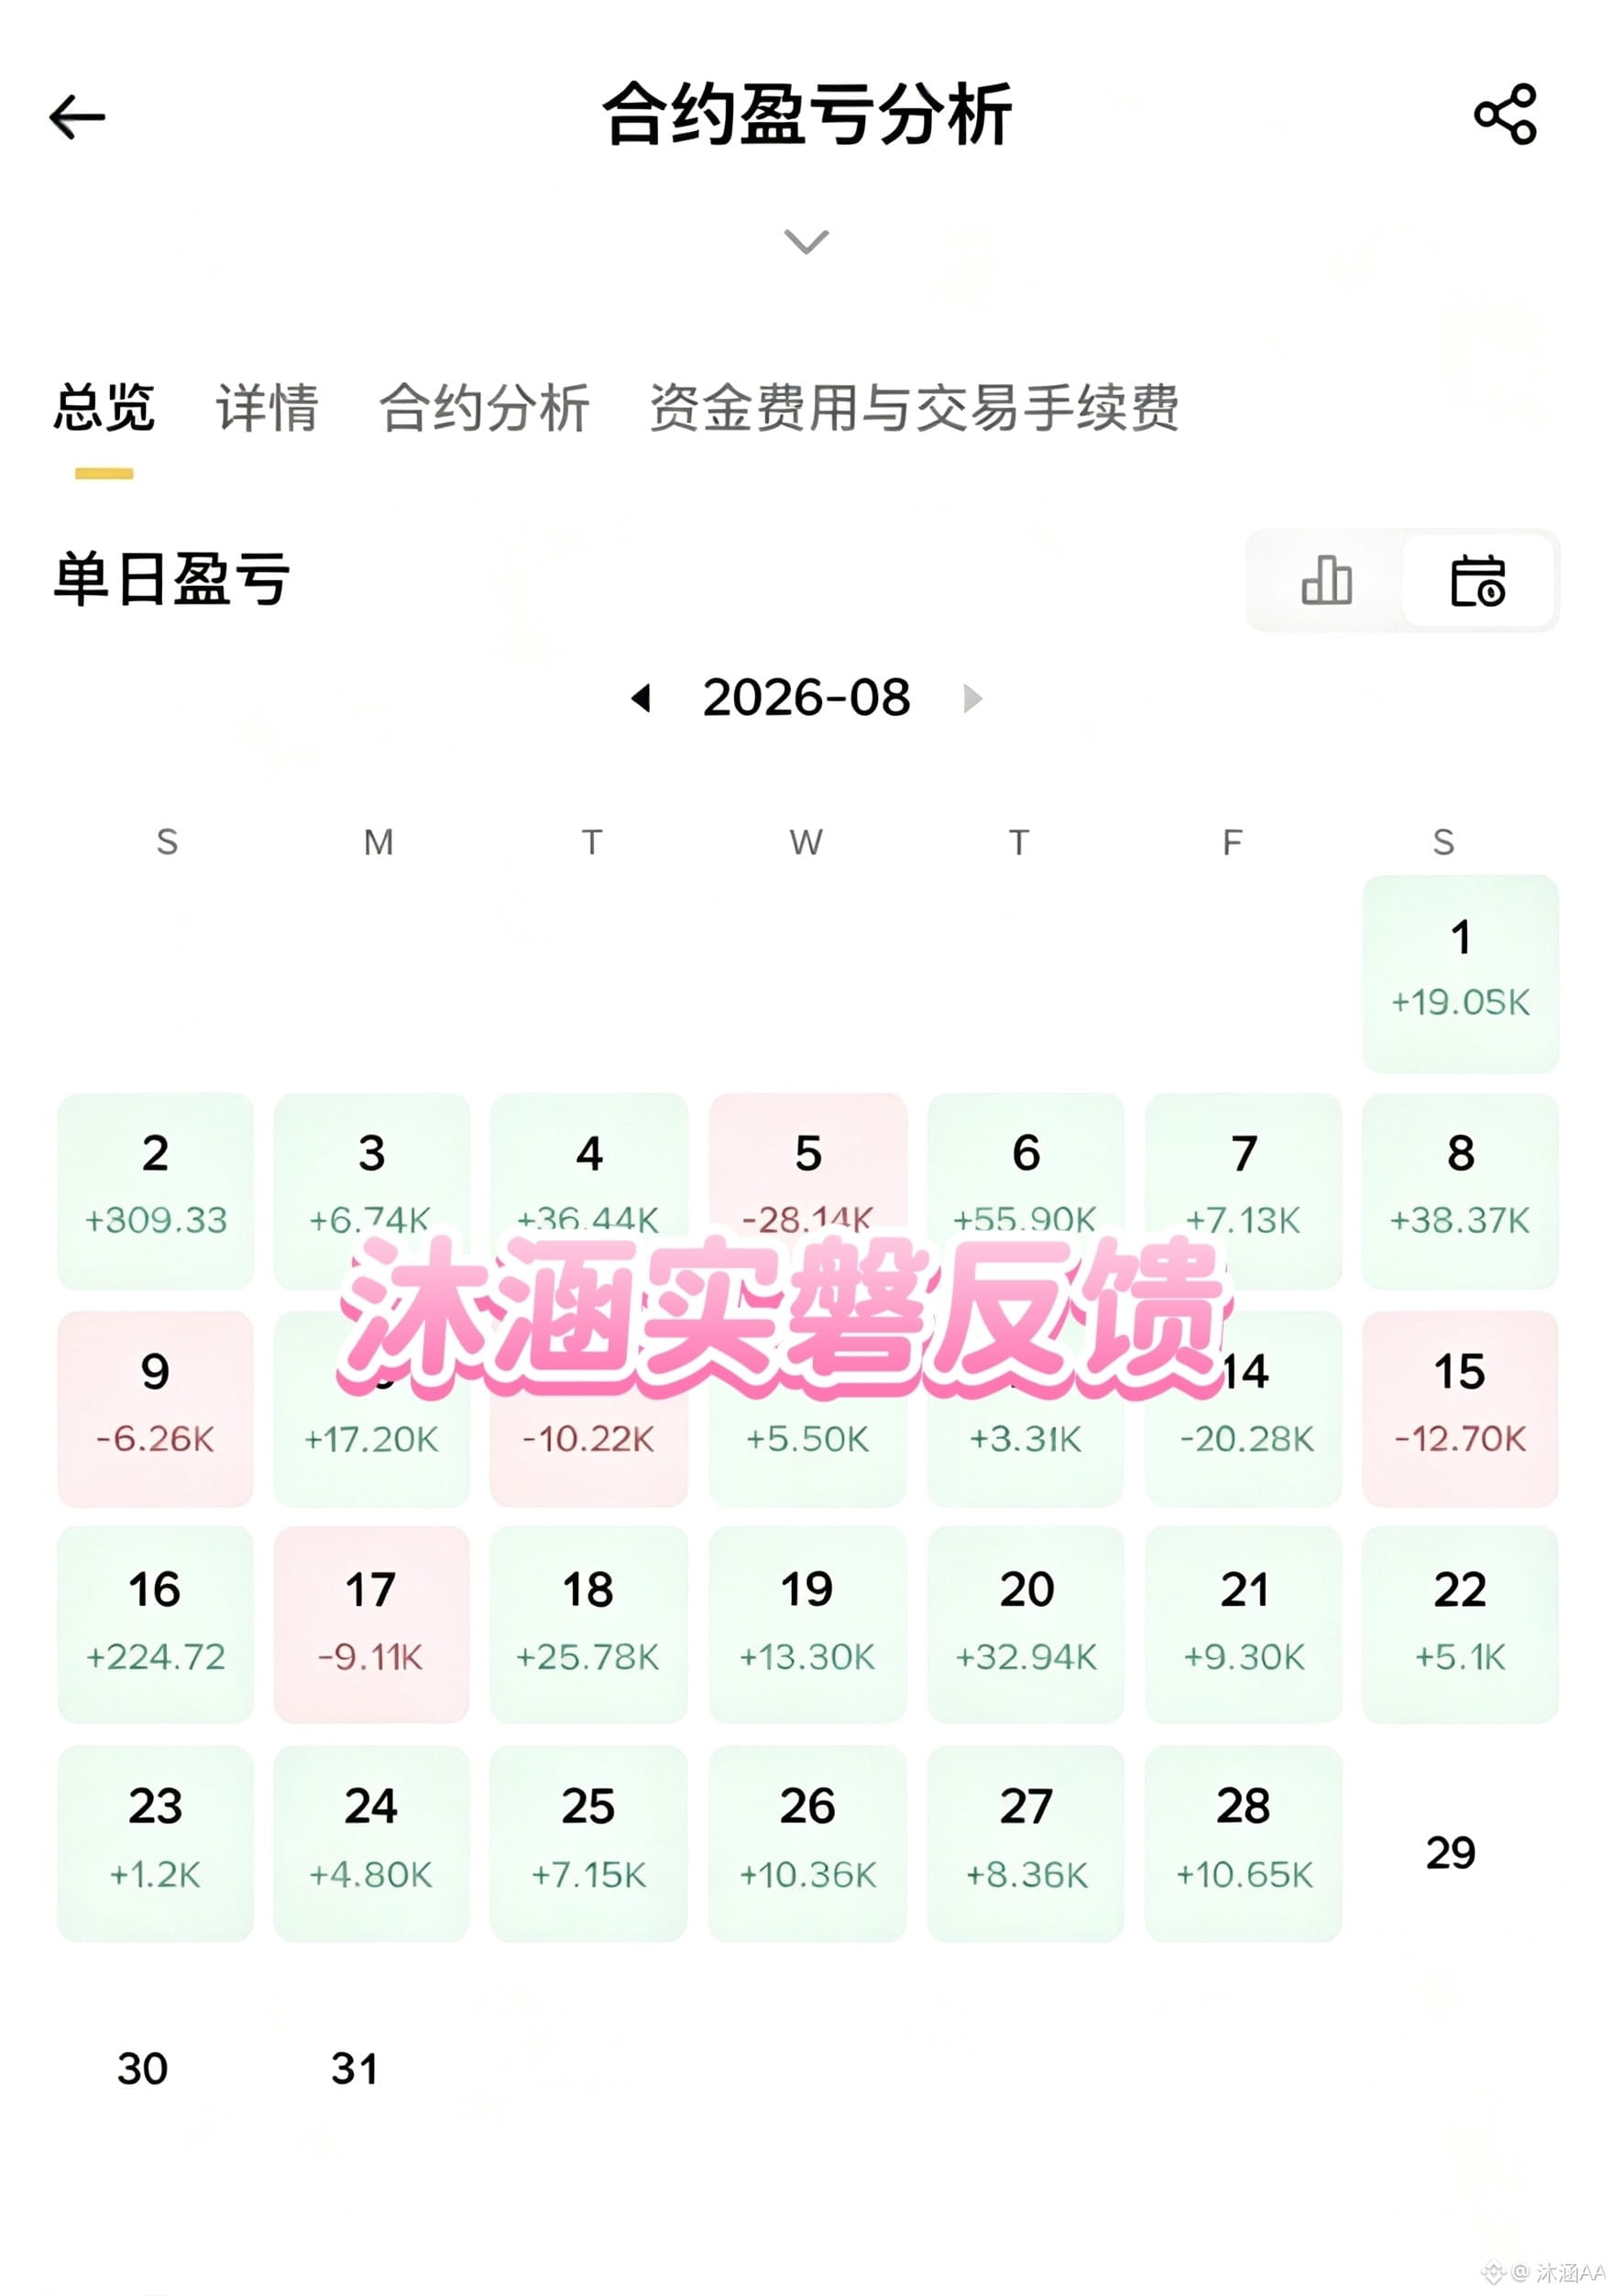
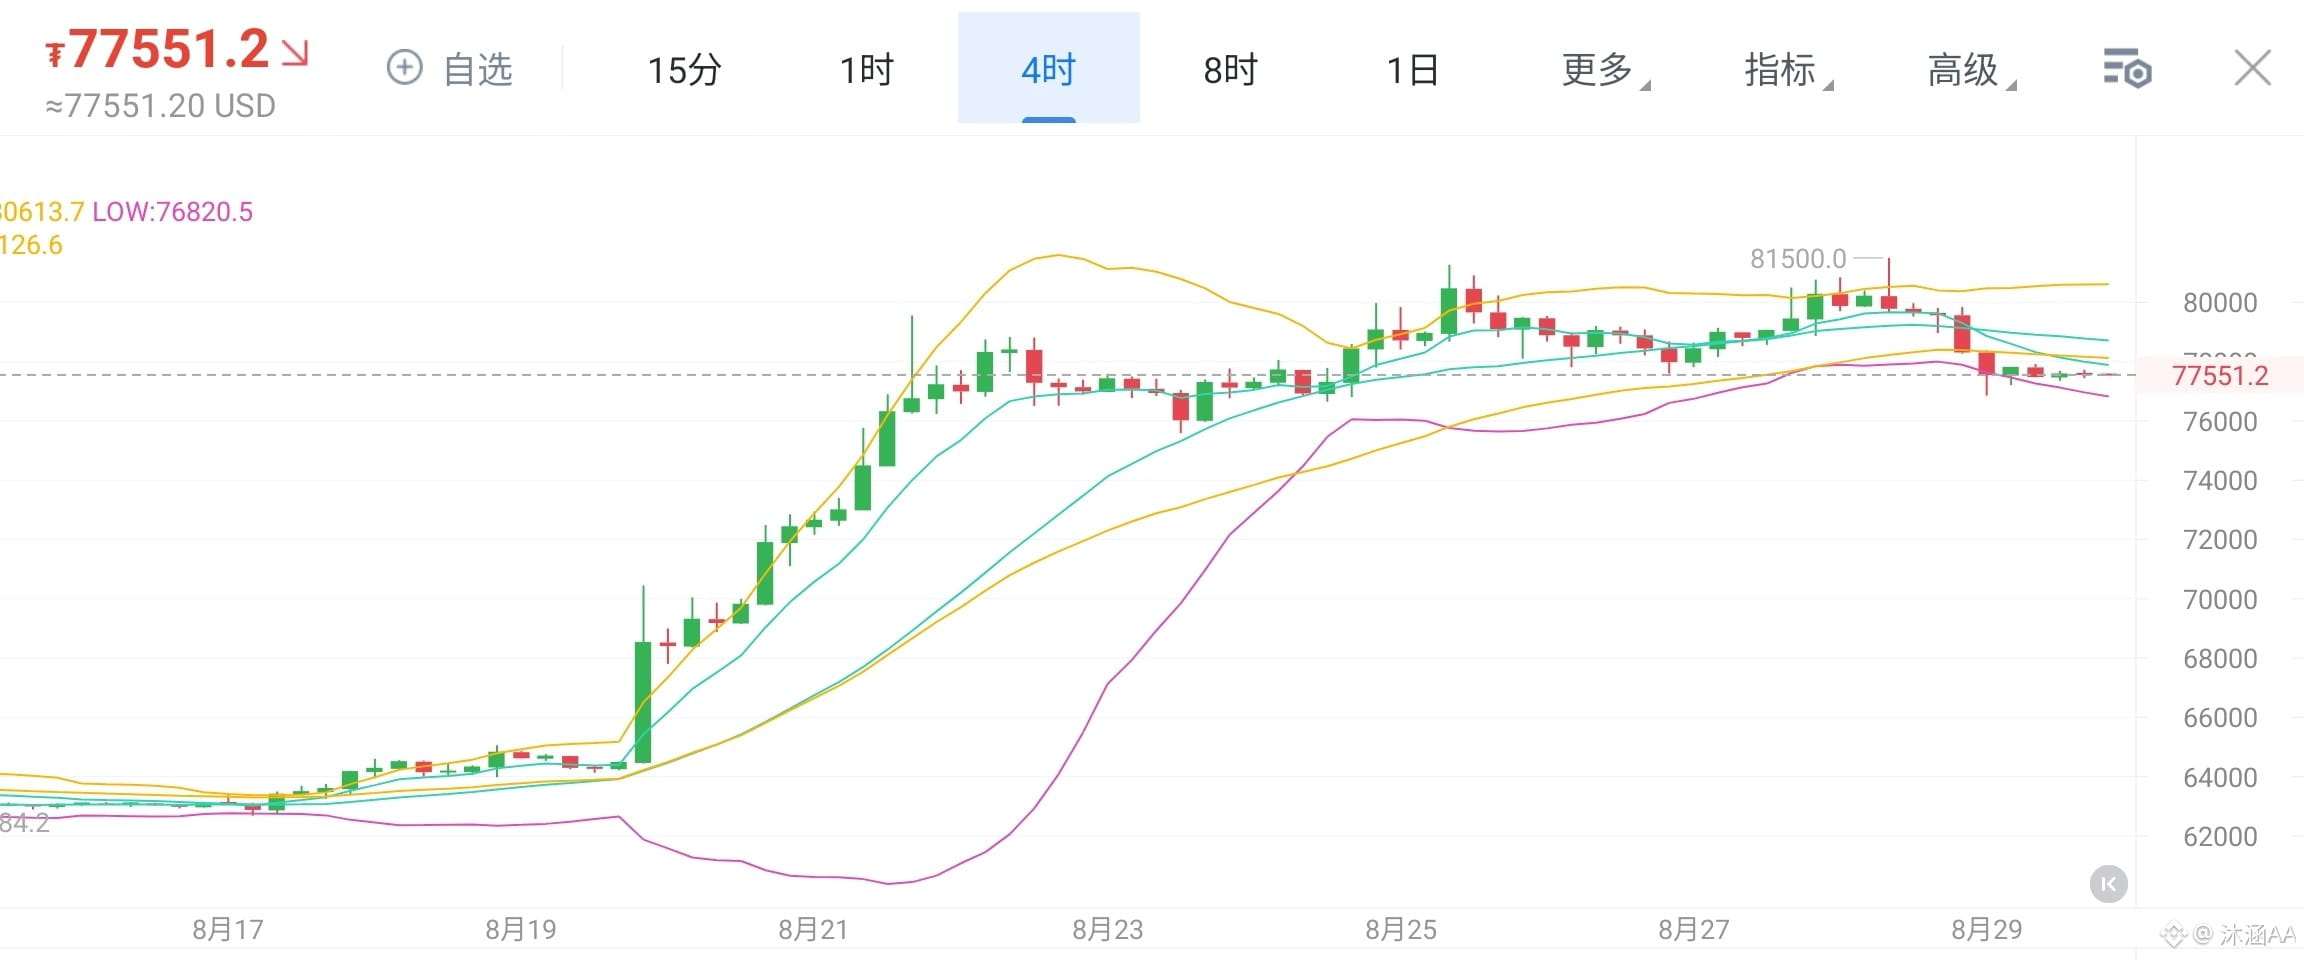
Has the drop in the big coin market ended this time? At the moment, I haven’t seen a complete bottoming signal, so I believe this pullback hasn’t ended yet. It’s just that after falling more, it’s entered a consolidation continuation after a decline. There will probably be one more push before the current pullback can finish.
From the four-hour structure: after failing at 81,500, the price pulled back to around 77,600. The upper band of the Bollinger Bands has turned downward, and the price is moving toward the mid-band. The SKD indicator below has already dropped back into the lower range, and the short-term overbought sentiment has been sufficiently released.
Many people are currently most concerned about two questions: has the trend already ended? Is this pullback a reversal, or is it just a shakeout during an ongoing uptrend?
My view: the weekly-level bullish macro structure has not been directly broken. This move is more like a deep retracement and accumulation after an advance, not an outright trend reversal.
The recent rally started from 62,400, and throughout the move it climbed as high as 81,500—an enormous gain. It has accumulated a large amount of profit-taking positions. When high-level holdings are cashed out, the resulting consolidation and pullback is a normal phenomenon.
In the short term, 78,900–79,200 forms the first major resistance zone. For the price to restart its upward move, it needs to regain and hold above this range;
The core support is at 74,600–73,000. This is the dense accumulation area of positions from this rally, and it’s also the line that determines whether the trend is strong or weak. As long as this zone is not broken to the downside on high volume, the medium-term upward logic remains valid.
Looking ahead to next week’s market, it will most likely follow a rhythm of first suppression and then rebound.
If the pullback can find a floor and stabilize in the 73,000–74,600 range, it will be a window for swing-position setup. In the future, there is still a good chance of another attempt to challenge above 82,000.
If there is a decisive breakdown below 73,000, the pullback cycle will extend, and the market structure will need to be reassessed.
#比特币24小时跌3.4%至7.74万美元 $BTC
From the four-hour structure: after failing at 81,500, the price pulled back to around 77,600. The upper band of the Bollinger Bands has turned downward, and the price is moving toward the mid-band. The SKD indicator below has already dropped back into the lower range, and the short-term overbought sentiment has been sufficiently released.
Many people are currently most concerned about two questions: has the trend already ended? Is this pullback a reversal, or is it just a shakeout during an ongoing uptrend?
My view: the weekly-level bullish macro structure has not been directly broken. This move is more like a deep retracement and accumulation after an advance, not an outright trend reversal.
The recent rally started from 62,400, and throughout the move it climbed as high as 81,500—an enormous gain. It has accumulated a large amount of profit-taking positions. When high-level holdings are cashed out, the resulting consolidation and pullback is a normal phenomenon.
In the short term, 78,900–79,200 forms the first major resistance zone. For the price to restart its upward move, it needs to regain and hold above this range;
The core support is at 74,600–73,000. This is the dense accumulation area of positions from this rally, and it’s also the line that determines whether the trend is strong or weak. As long as this zone is not broken to the downside on high volume, the medium-term upward logic remains valid.
Looking ahead to next week’s market, it will most likely follow a rhythm of first suppression and then rebound.
If the pullback can find a floor and stabilize in the 73,000–74,600 range, it will be a window for swing-position setup. In the future, there is still a good chance of another attempt to challenge above 82,000.
If there is a decisive breakdown below 73,000, the pullback cycle will extend, and the market structure will need to be reassessed.
#比特币24小时跌3.4%至7.74万美元 $BTC
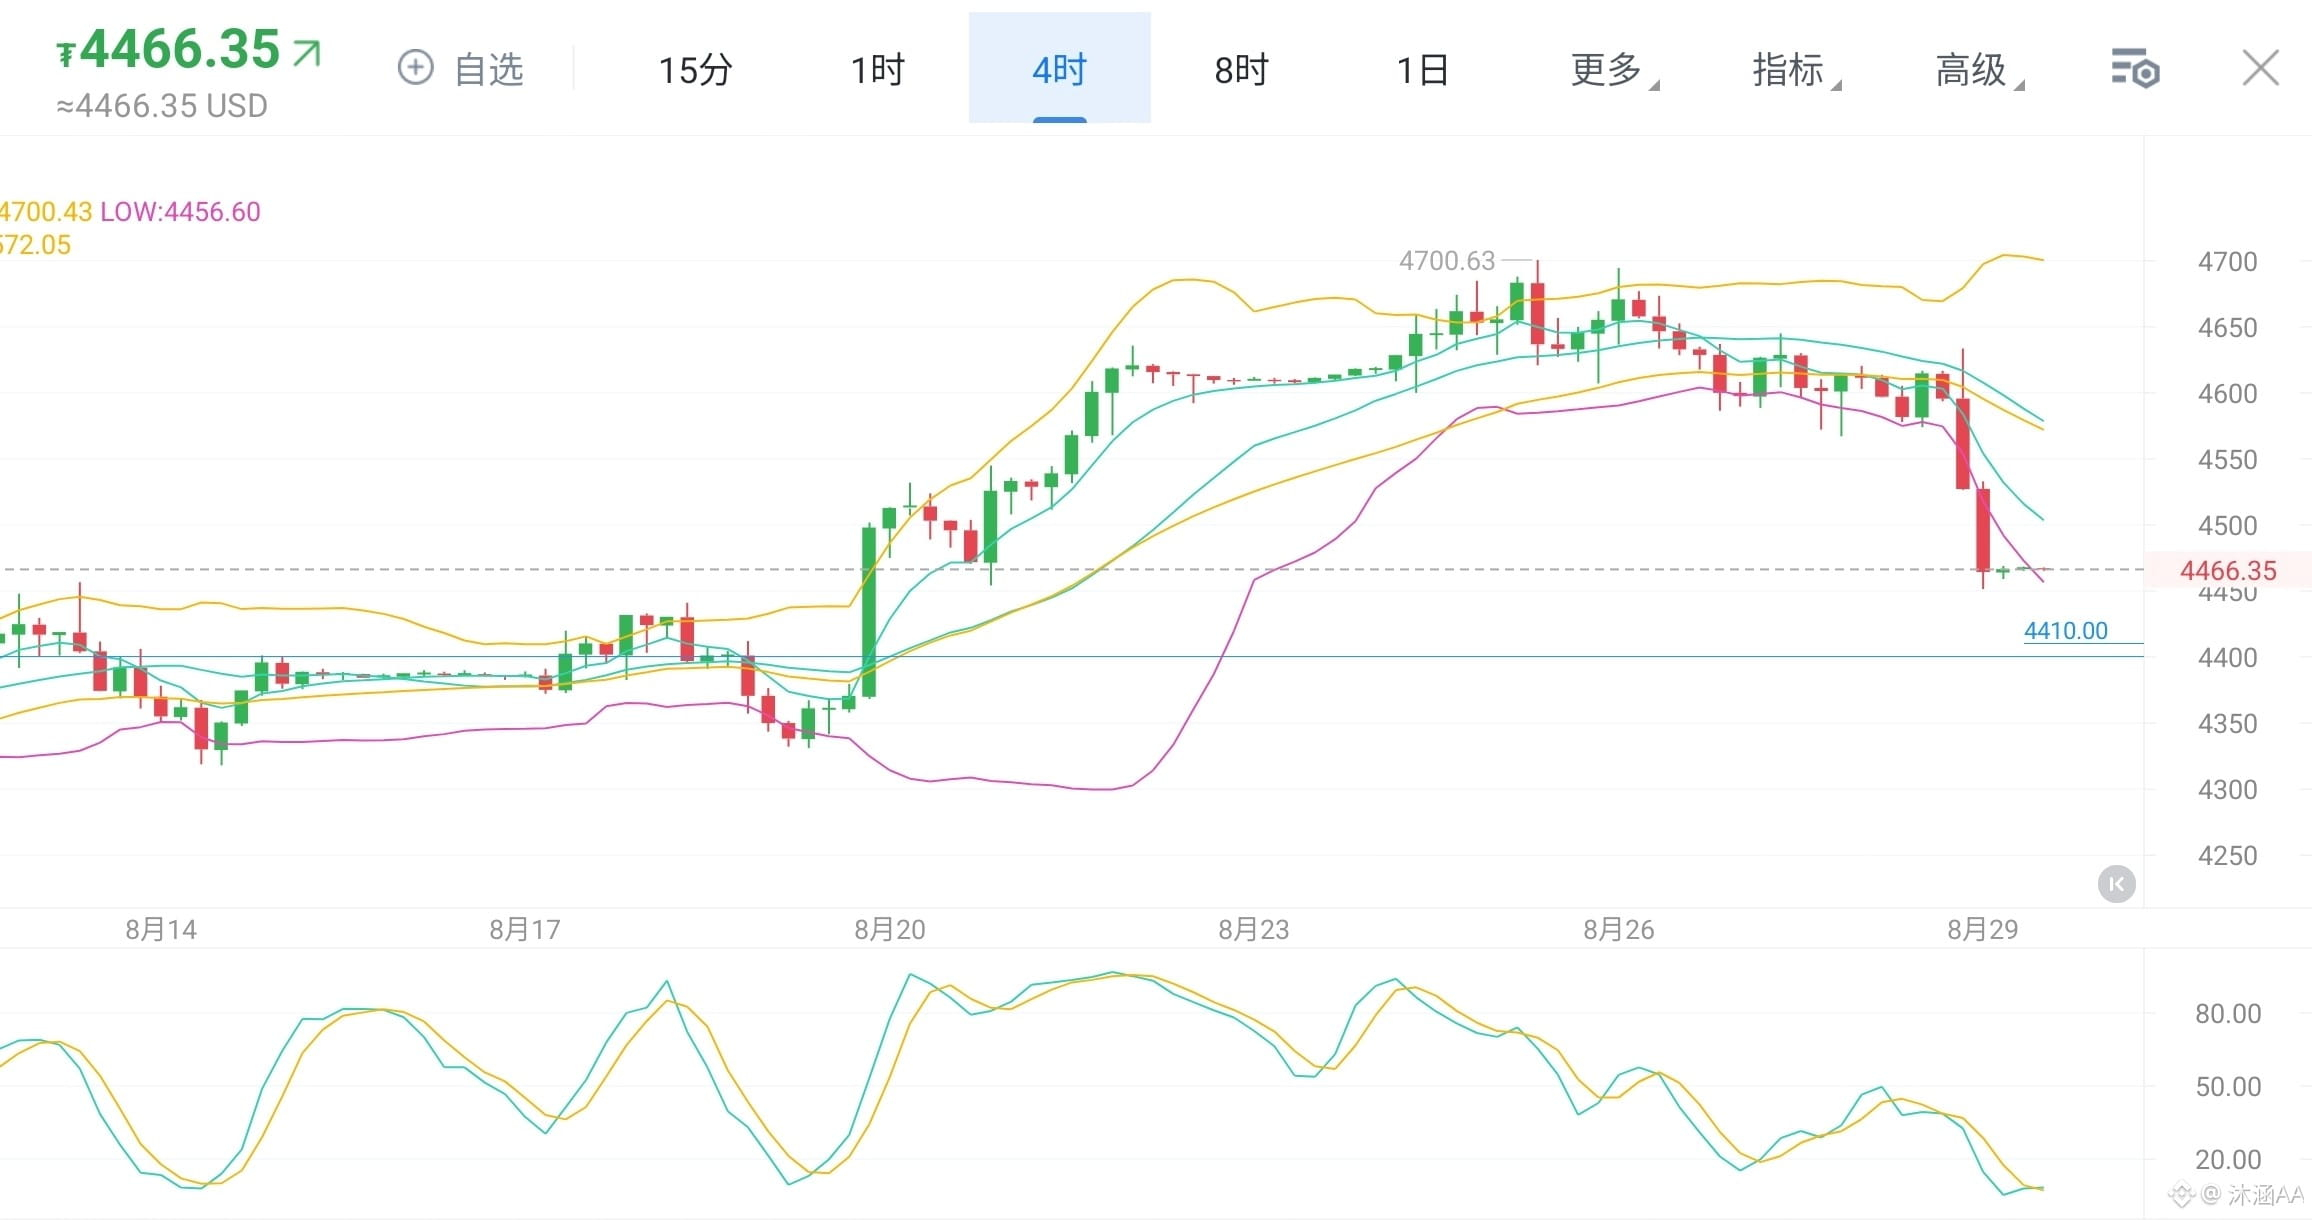
Golden Week Review: Rallies then Retraces—Next Week Watch Whether 4410 Can Become the Bulls’ Last Line of Defense!
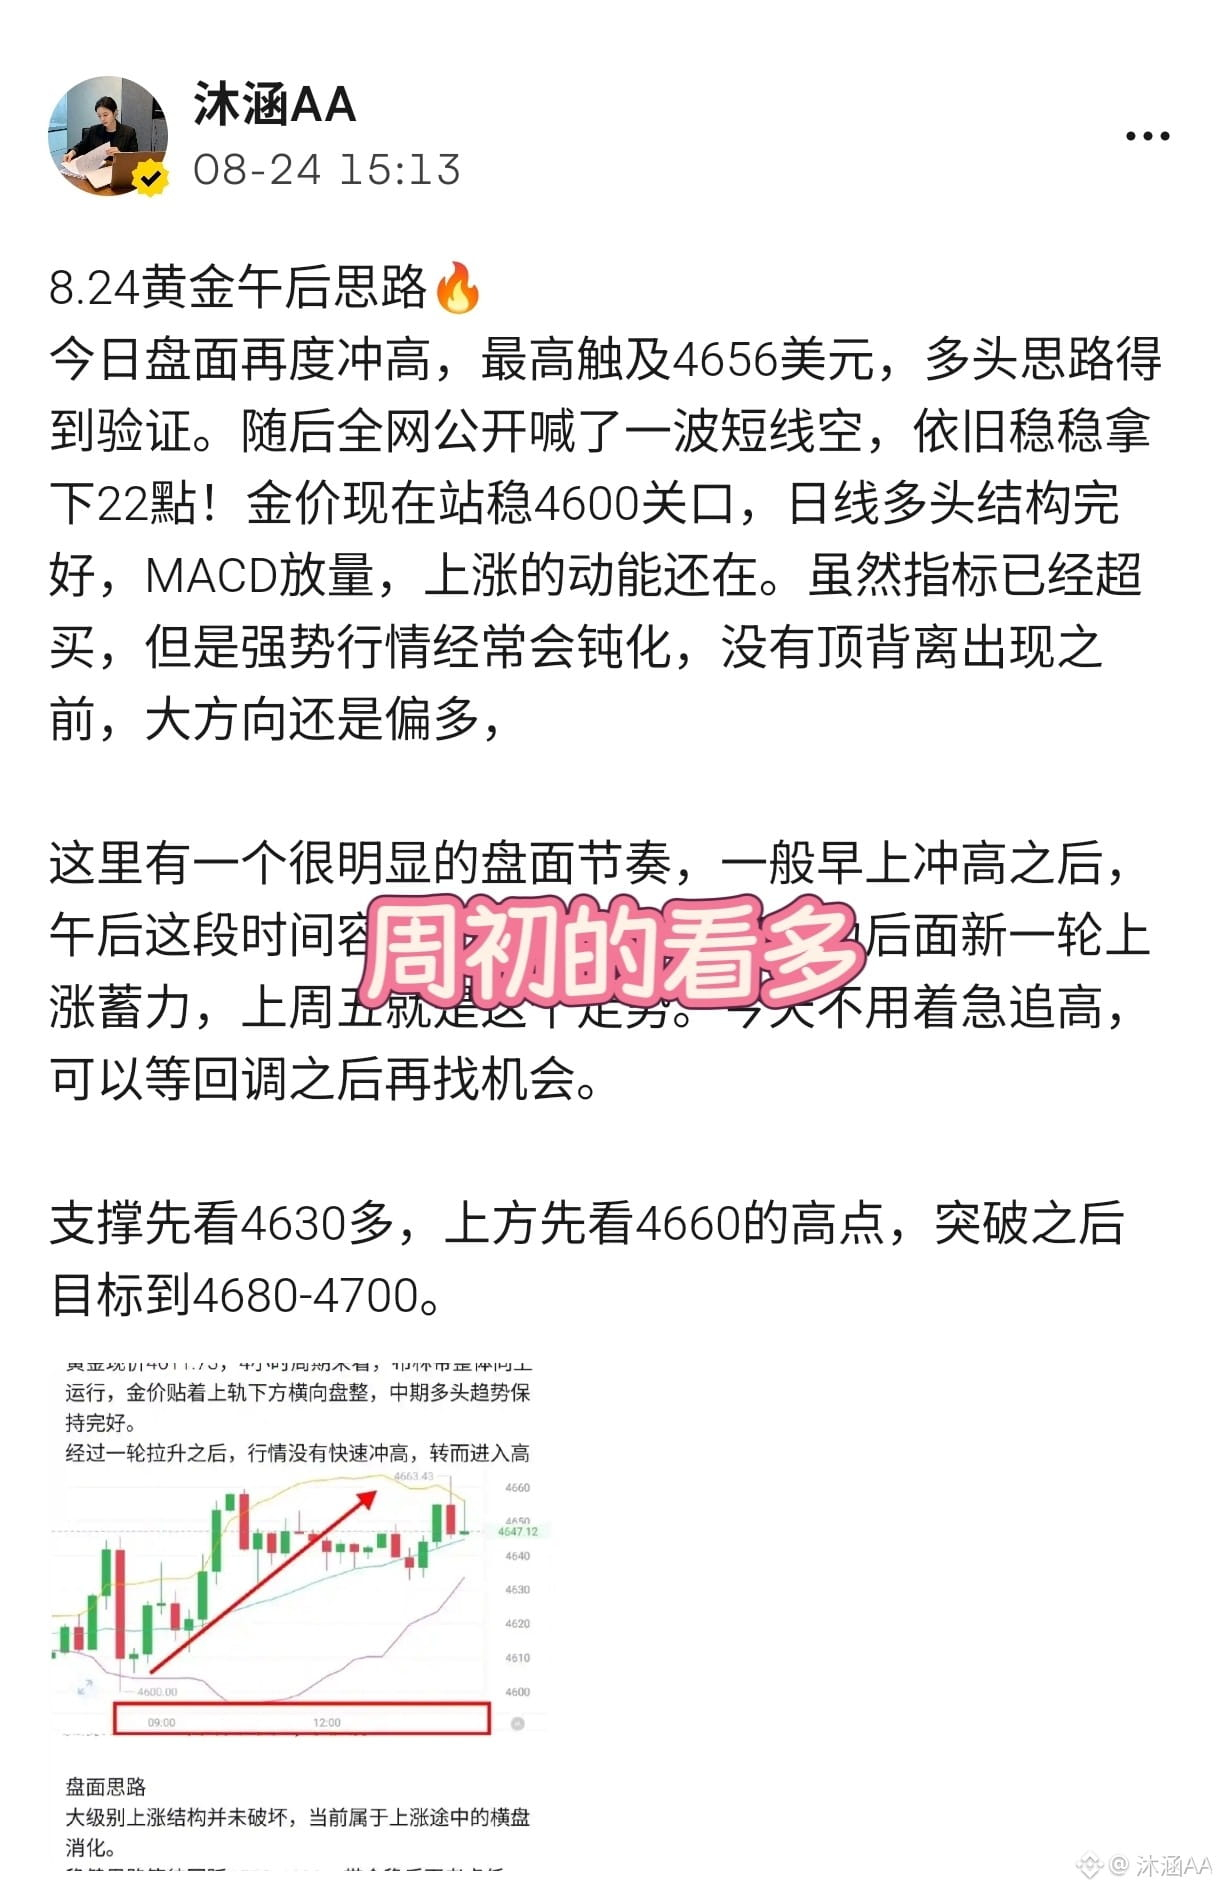
This week gold saw violent fluctuations. In the first half of the week, Mu Han was already looking long with targets at 4700. On Tuesday, gold briefly surged to 4697.66 USD, setting a new high for the phase. Then, as US economic data and expectations for Federal Reserve policy shifted, the price began to gradually pull back.
On Thursday, market expectations that the Fed would turn more hawkish warmed up, and gold fell to around 4566 USD at one point. On Friday during the Jackson Hole meeting, Fed Chair Wosch emphasized that inflation remains the policy focus and hinted that if inflation cannot continue to ease toward the 2% target, further rate hikes would still be necessary. Gold then dropped again to around 4445 USD.
I believe friends who follow Mu Han can see it too! After Friday’s remarks, I started laying out a short position and entered. Target: 4500 and below!
From a weekly perspective, the biggest change this week is not simply a rise or a fall, but rather that market expectations for the Fed’s September policy have shifted noticeably. Reuters reported that after Wosch’s speech, the probability of a September rate hike rose from about 35% to about 60%, and gold was consequently under pressure.
How should we look at gold on the long term next week?
On the technical side, the “Twilight Star” pattern formed at this week’s high is continuing to develop, and bearish momentum in the short term has been clearly released.
However, after Friday’s sharp selloff, gold has quickly approached the daily chart’s key support zone. Daily MA20 is currently around 4410. Therefore, at the start of next week, I do not recommend continuing to chase shorts.
If gold retraces toward 4410, holds steady, and shows a stop-fall signal on the hourly timeframe, then a short-term long attempt could be made here; the first target would be 4470—4500.
On the other hand, if 4410 is broken convincingly and the rebound fails to get back above it, then the “Twilight Star” corrective room may open further, and we should continue to watch 4350 and 4300 below.
Core idea at the beginning of next week
4410 is the first key line of defense.
Hold 4410 → first look for a technical rebound, targeting 4500;
Break below 4410 → pause bottom-buying and wait for the next support to be confirmed.
So, at the start of next week, my plan is: first watch 4410—hold to rebound; if it breaks, then adjust. #SOL本周上涨20% $XAU
This week gold saw violent fluctuations. In the first half of the week, Mu Han was already looking long with targets at 4700. On Tuesday, gold briefly surged to 4697.66 USD, setting a new high for the phase. Then, as US economic data and expectations for Federal Reserve policy shifted, the price began to gradually pull back.
On Thursday, market expectations that the Fed would turn more hawkish warmed up, and gold fell to around 4566 USD at one point. On Friday during the Jackson Hole meeting, Fed Chair Wosch emphasized that inflation remains the policy focus and hinted that if inflation cannot continue to ease toward the 2% target, further rate hikes would still be necessary. Gold then dropped again to around 4445 USD.
I believe friends who follow Mu Han can see it too! After Friday’s remarks, I started laying out a short position and entered. Target: 4500 and below!
From a weekly perspective, the biggest change this week is not simply a rise or a fall, but rather that market expectations for the Fed’s September policy have shifted noticeably. Reuters reported that after Wosch’s speech, the probability of a September rate hike rose from about 35% to about 60%, and gold was consequently under pressure.
How should we look at gold on the long term next week?
On the technical side, the “Twilight Star” pattern formed at this week’s high is continuing to develop, and bearish momentum in the short term has been clearly released.
However, after Friday’s sharp selloff, gold has quickly approached the daily chart’s key support zone. Daily MA20 is currently around 4410. Therefore, at the start of next week, I do not recommend continuing to chase shorts.
If gold retraces toward 4410, holds steady, and shows a stop-fall signal on the hourly timeframe, then a short-term long attempt could be made here; the first target would be 4470—4500.
On the other hand, if 4410 is broken convincingly and the rebound fails to get back above it, then the “Twilight Star” corrective room may open further, and we should continue to watch 4350 and 4300 below.
Core idea at the beginning of next week
4410 is the first key line of defense.
Hold 4410 → first look for a technical rebound, targeting 4500;
Break below 4410 → pause bottom-buying and wait for the next support to be confirmed.
So, at the start of next week, my plan is: first watch 4410—hold to rebound; if it breaks, then adjust. #SOL本周上涨20% $XAU
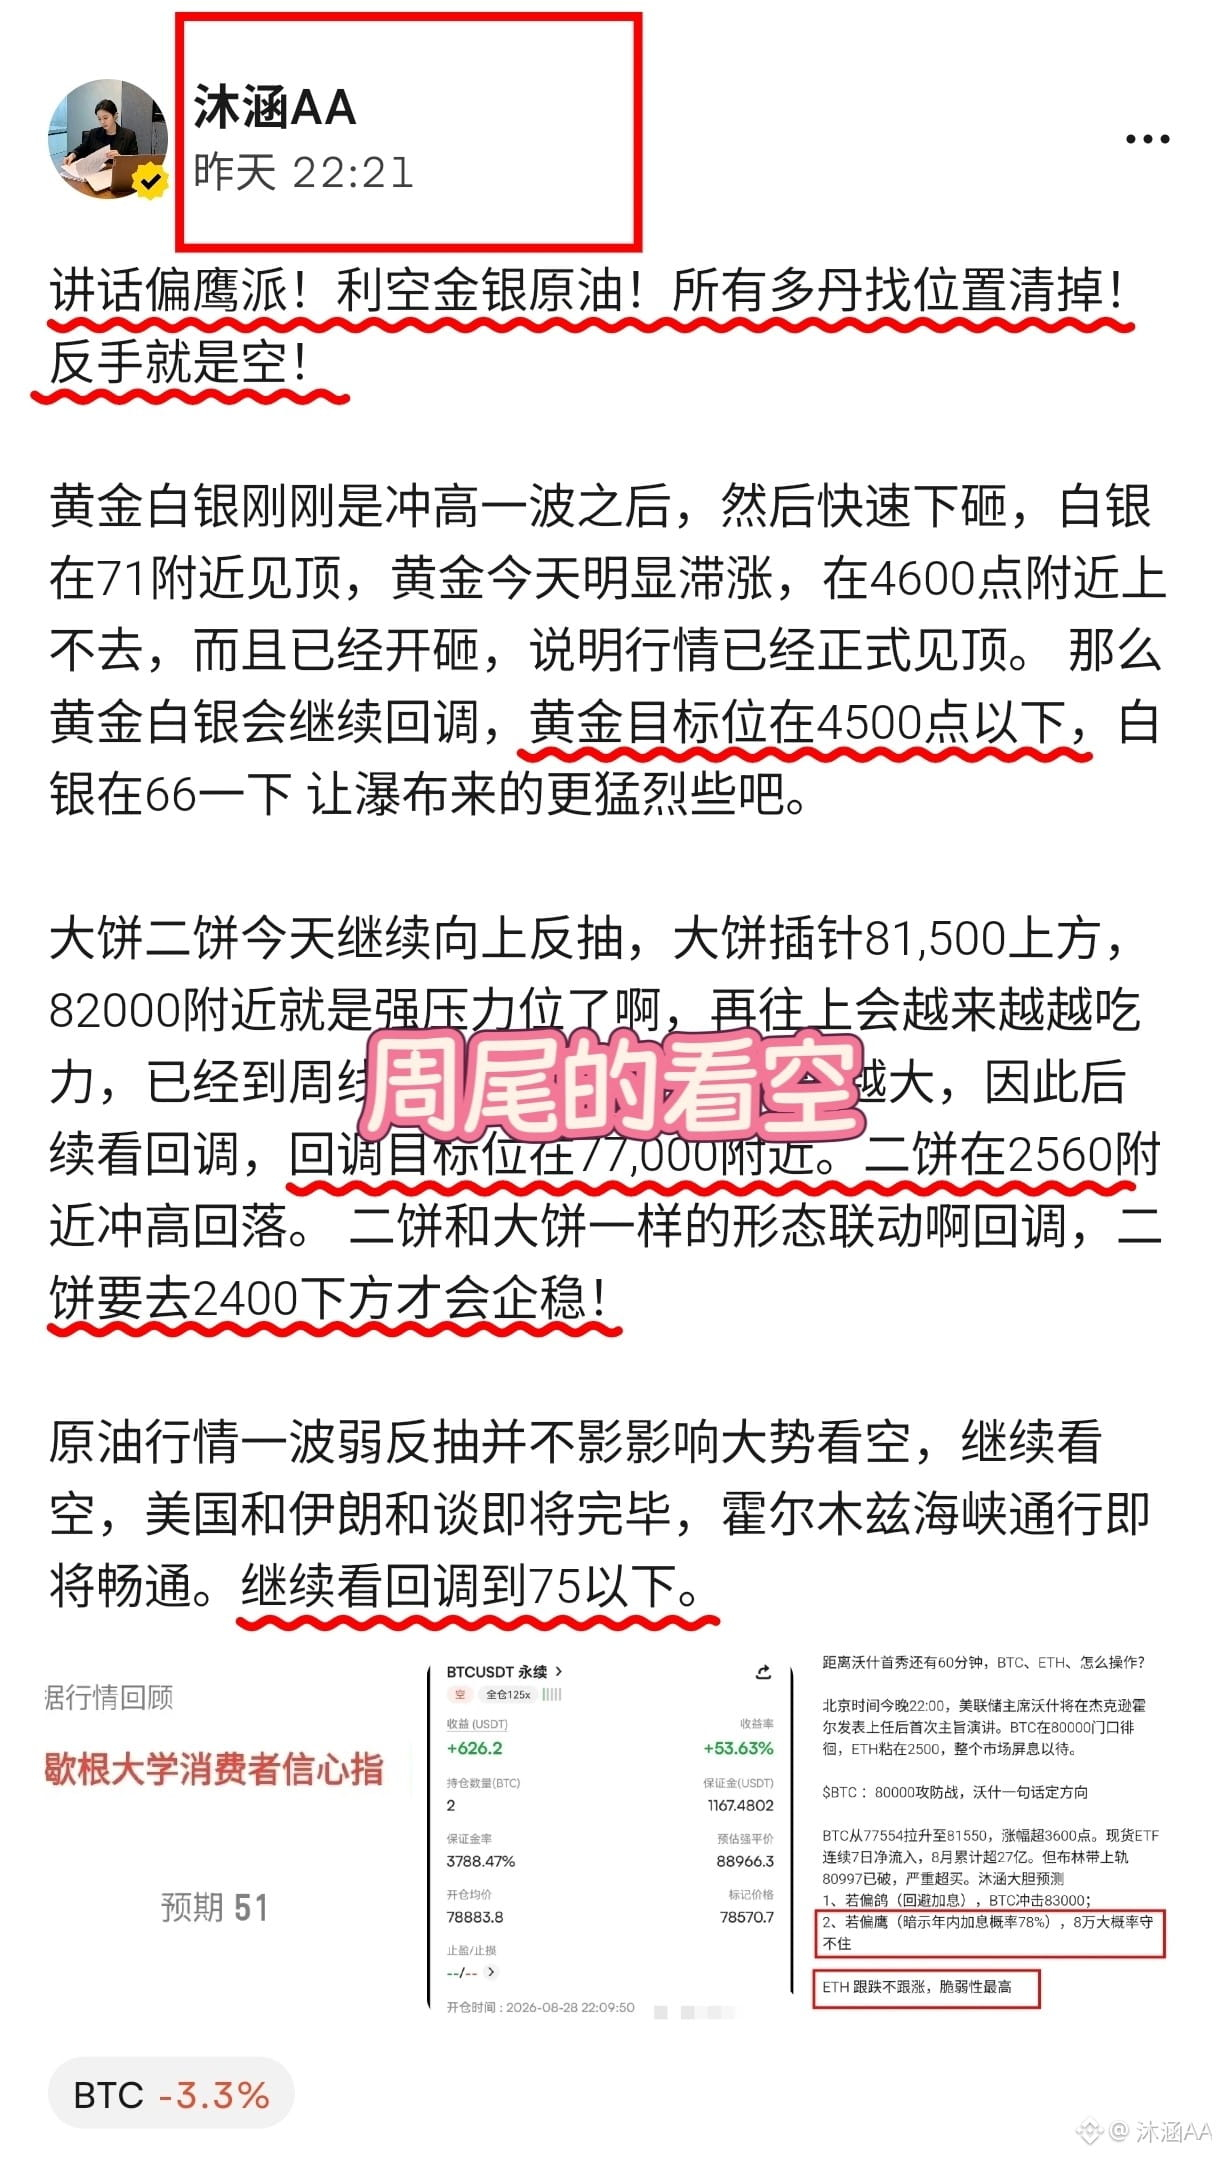
Bearish “hawk faction” triggers the whole market; after 4600 is lost, rebound means sell!
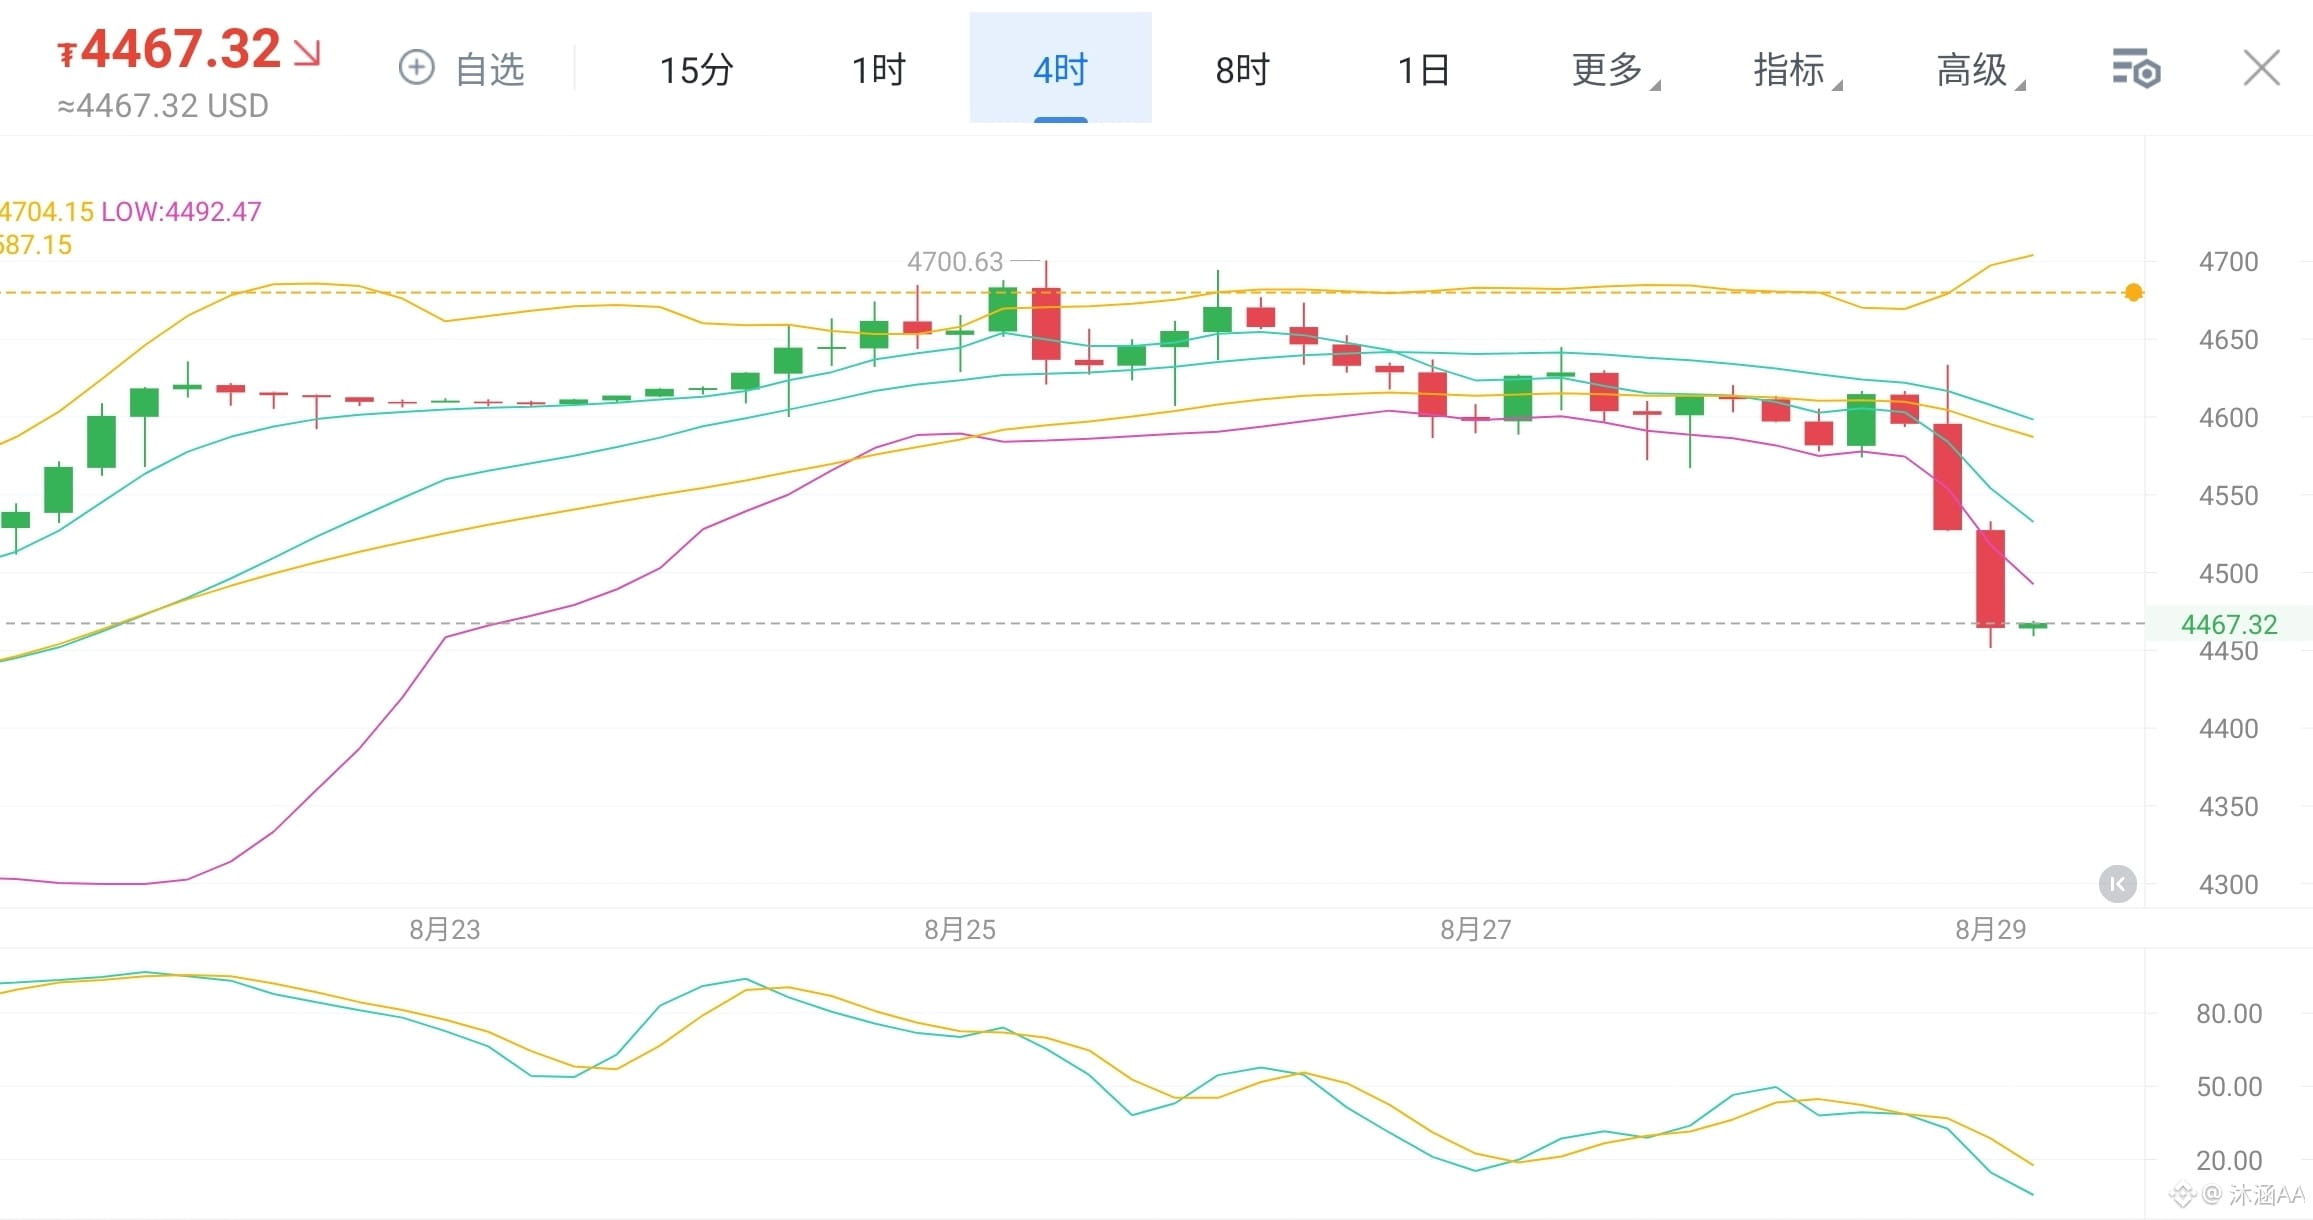
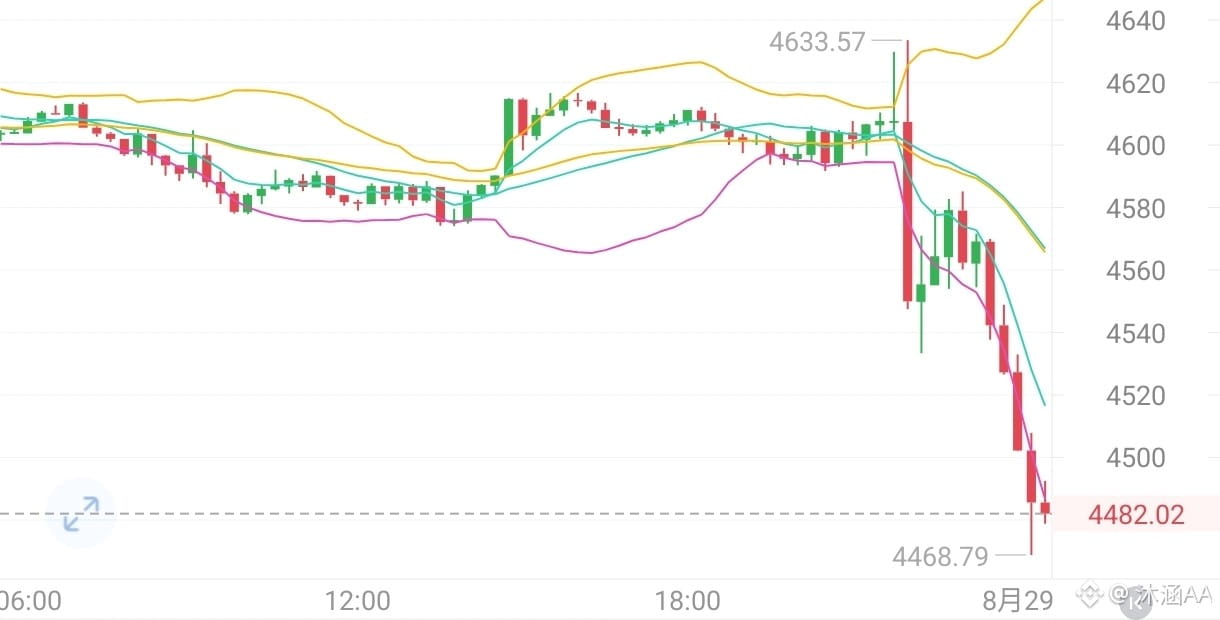
Yesterday evening, Mu Han’s short call hit the take-profit precisely. In the debut of the Fed’s Jackson Hole, Wosh Jacksons delivered a clear hawkish tone, igniting the entire market: a triple message—“the inflation target is firm, there is still work to do, and the financial conditions are not constrained (unrestricted).” This directly pushed the September rate-hike probability from 36% soaring to 50%. The U.S. dollar jumped to 99.62, the 2-year Treasury yield rose by 5bp, and gold plunged 2.88% in a single day, breaking below the 4600 key level; the low tested around 4467. The intraday $162 swing—3 to 4 times typical volatility—signals a clear one-way trend.
Intraday range is $162. The daily candle saw a long bearish move breaking through support, and the 4600 key level was completely lost. Three consecutive bearish 4-hour candles, with the Bollinger Bands’ three lines sloping downward. The high sequence shifted lower: 4696.98 → 4643 → 4629, confirming that the bearish structure is established. Gold fell 2.88% on the day. RSI has entered oversold territory; the hourly chart may need a technical rebound, but the trend is still bearish—“rebound means sell” is the main theme.
Trading plan:
On rebounds, short at 4510–4525, target 4460–4400.
If there is an effective breakdown below 4460 and the candle closes beneath it, then on a rebound at 4470, add a light-position short; targets are 4400–4350.
If 4460–4450 quickly stabilizes and the dollar falls back below 99.30, you may take a light-position short-term long to play the rebound; targets are 4510–4540. Weekend—do not hold any one-direction positions.
#黄金8月上涨约14% $XAU
Yesterday evening, Mu Han’s short call hit the take-profit precisely. In the debut of the Fed’s Jackson Hole, Wosh Jacksons delivered a clear hawkish tone, igniting the entire market: a triple message—“the inflation target is firm, there is still work to do, and the financial conditions are not constrained (unrestricted).” This directly pushed the September rate-hike probability from 36% soaring to 50%. The U.S. dollar jumped to 99.62, the 2-year Treasury yield rose by 5bp, and gold plunged 2.88% in a single day, breaking below the 4600 key level; the low tested around 4467. The intraday $162 swing—3 to 4 times typical volatility—signals a clear one-way trend.
Intraday range is $162. The daily candle saw a long bearish move breaking through support, and the 4600 key level was completely lost. Three consecutive bearish 4-hour candles, with the Bollinger Bands’ three lines sloping downward. The high sequence shifted lower: 4696.98 → 4643 → 4629, confirming that the bearish structure is established. Gold fell 2.88% on the day. RSI has entered oversold territory; the hourly chart may need a technical rebound, but the trend is still bearish—“rebound means sell” is the main theme.
Trading plan:
On rebounds, short at 4510–4525, target 4460–4400.
If there is an effective breakdown below 4460 and the candle closes beneath it, then on a rebound at 4470, add a light-position short; targets are 4400–4350.
If 4460–4450 quickly stabilizes and the dollar falls back below 99.30, you may take a light-position short-term long to play the rebound; targets are 4510–4540. Weekend—do not hold any one-direction positions.
#黄金8月上涨约14% $XAU
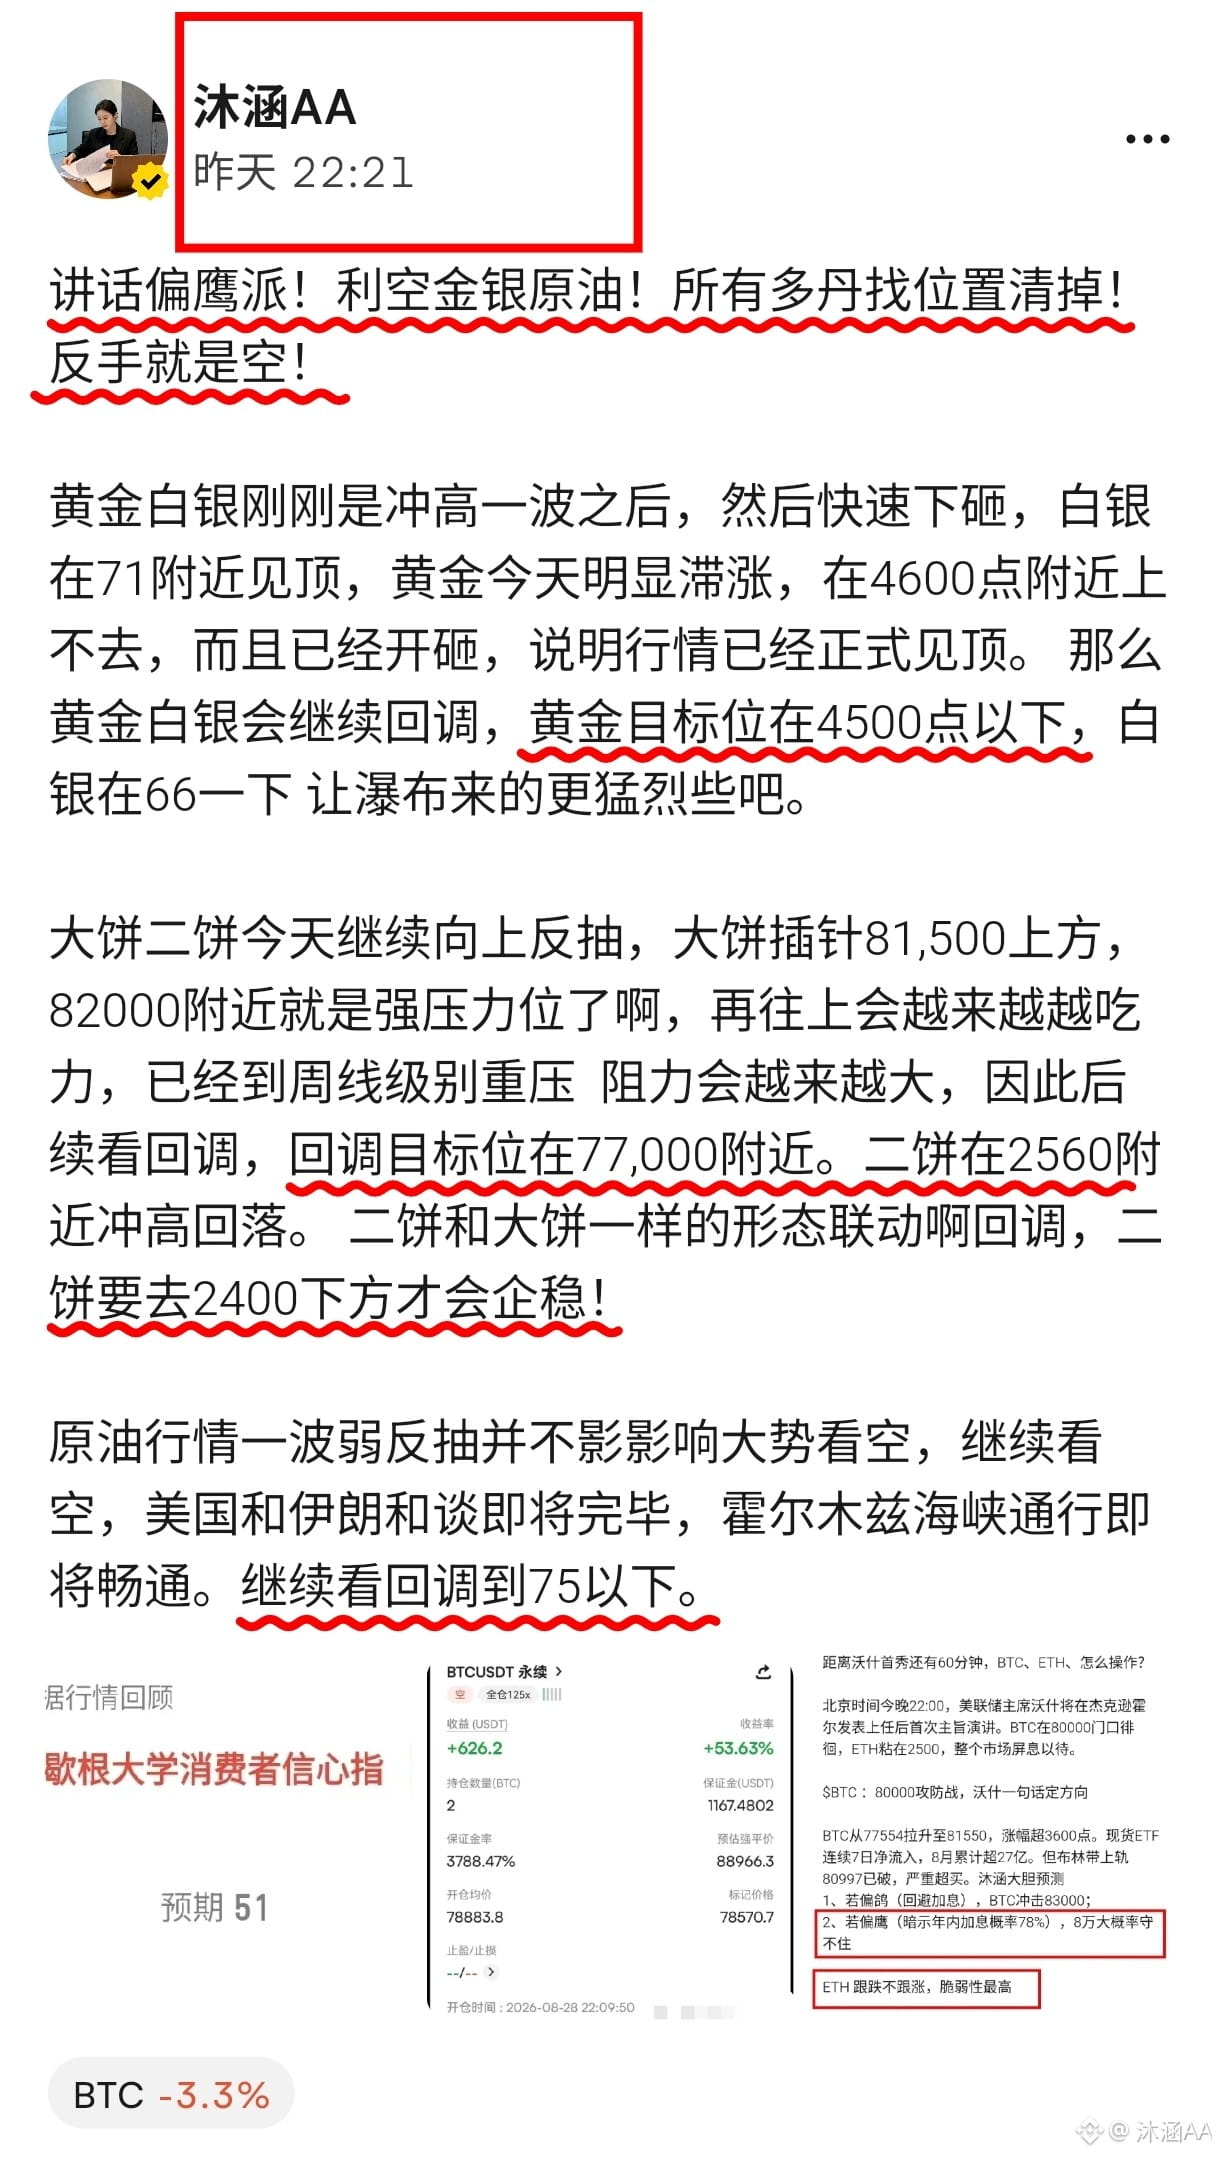
I’ve pointed the way to you—whether you can eat or not depends on whether you believe it! After all, I’m not the Buddha who brings blessings, I can’t do anything for those who don’t believe in me!
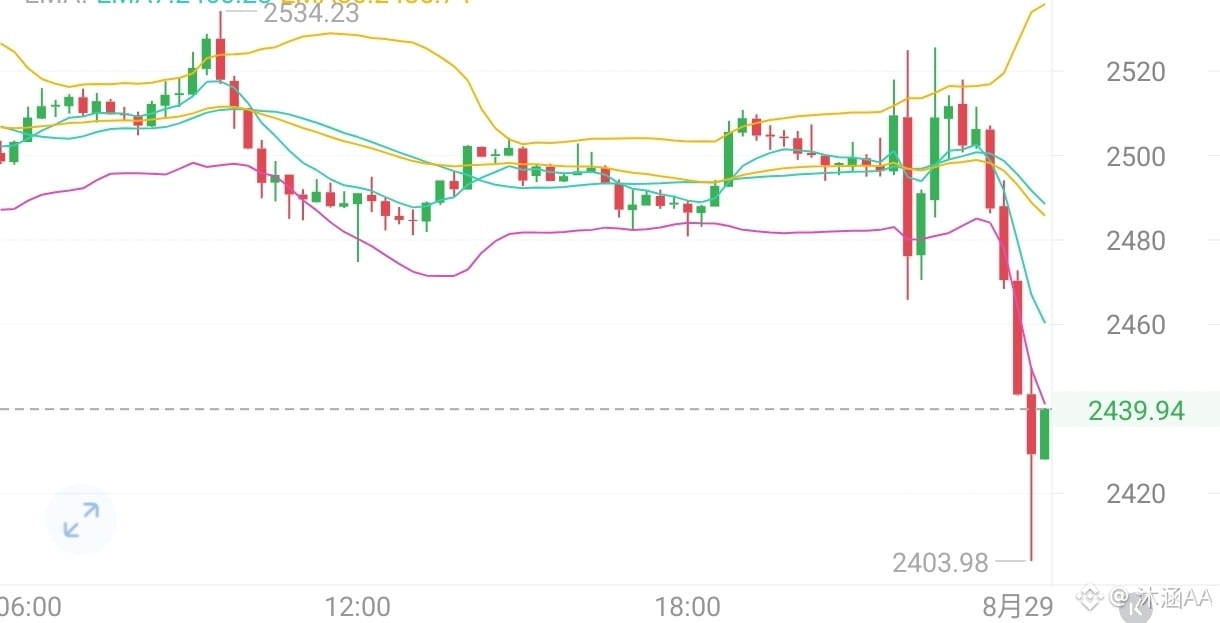
Gold, silver, big pancakes, Ether—everything is all set! Eat to your heart’s content!
That’s a perfect wrap for today! If you did not do well—look over here! Those who get it, get it! #黄金8月上涨约14% $GOOGL.US
Gold, silver, big pancakes, Ether—everything is all set! Eat to your heart’s content!
That’s a perfect wrap for today! If you did not do well—look over here! Those who get it, get it! #黄金8月上涨约14% $GOOGL.US
Log in to explore more content