

Crypto Signals and Analysis
33 Posts

Crypto Signals and Analysis
Report
Block User
Crypto trading signals and market analysis. We identify key levels, clear entry points, and defined targets with a disciplined focus on risk management.
Open Trade
Frequent Trader
3.4 Years
2 Following
33 Followers
47 Liked
Posts
Portfolio
·
--
Bearish
$TIA Price Prediction Today: Celestia Crypto Signal & Technical Analysis 📊
🔴 SHORT | Entry 0.5402 - 0.5424 | TP1 0.5294 | SL 0.5532
👉 Tap $TIA to place your trade fast
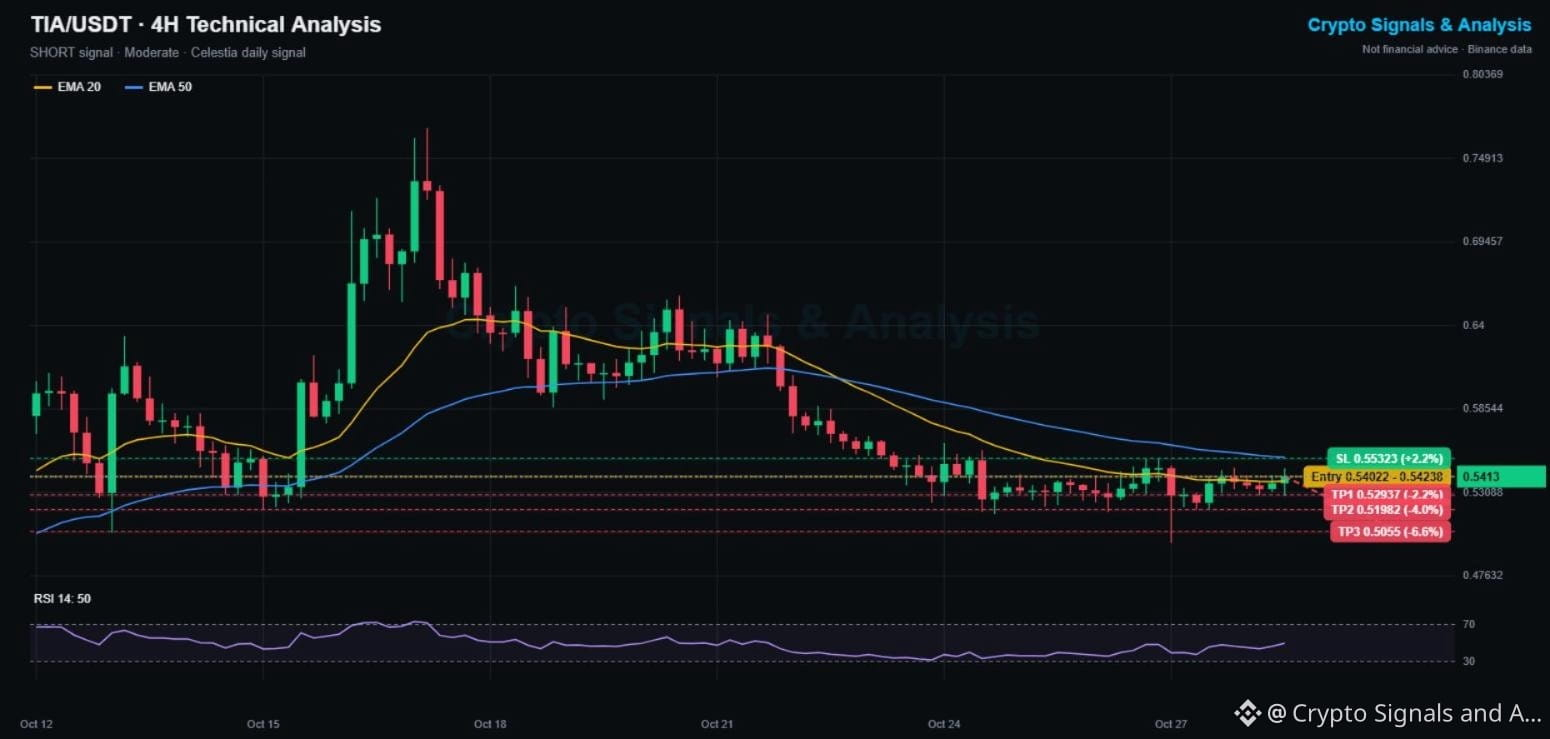
Celestia pumped to 0.769 on Oct 17 and has given back 30% since. It is down 14.5% this week, and every bounce now runs into the falling 4H EMA50 at 0.554.
📌 CELESTIA TRADING SIGNAL (Moderate, 3/5 signals agree)
Entry: 0.5402 - 0.5424
Take profit 1: 0.5294 (-2.2%)
Take profit 2: 0.5198 (-4.0%)
Take profit 3: 0.5055 (-6.6%)
Stop loss: 0.5532 (+2.2%)
📊 TIA TECHNICAL ANALYSIS (4H CHART)
TIA has been grinding sideways at 0.52 to 0.55 for 4 days, right under the EMA50 (0.5539). The EMA20 (0.5383) is still sloping down, and RSI sits at a neutral 50. The long wick down to 0.498 on Oct 27 shows there are buyers lower, so TP3 is set just above that zone.
🔑 KEY LEVELS
Support: 0.5300, then 0.4980
Resistance: 0.5539 (EMA50), then 0.5800
📈 Bullish scenario: a 4H close above 0.5532 and the EMA50 breaks the range upward and cancels the short.
📉 Bearish scenario: losing 0.53 sends TIA back to the 0.50 to 0.52 zone.
💡 Bottom line: a range trade under resistance. Tight stop, quick targets.
👉 Tap $TIA
to open the live chart. NFA
🔥 TRADE WITH LOWER FEES
✅ Get a 20% kickback on your Binance trading fees, for life
👇👇👇
{spot}(TIAUSDT)
[Claim your 20% Binance fee kickback here](https://www.binance.com/register?ref=X0NQWZ4N)
━━━━━━━━━━
Celestia: breakdown to 0.50 or a squeeze back to 0.60? 👇
Follow Crypto Signals and Analysis for daily signals.
#cryptosignals #TIA #EarningsSeason
⚠️ Crypto is volatile: risk only what you can afford to lose.
$TIA Price Prediction Today: Celestia Crypto Signal & Technical Analysis 📊
🔴 SHORT | Entry 0.5402 - 0.5424 | TP1 0.5294 | SL 0.5532
👉 Tap $TIA to place your trade fast
Celestia pumped to 0.769 on Oct 17 and has given back 30% since. It is down 14.5% this week, and every bounce now runs into the falling 4H EMA50 at 0.554.
📌 CELESTIA TRADING SIGNAL (Moderate, 3/5 signals agree)
Entry: 0.5402 - 0.5424
Take profit 1: 0.5294 (-2.2%)
Take profit 2: 0.5198 (-4.0%)
Take profit 3: 0.5055 (-6.6%)
Stop loss: 0.5532 (+2.2%)
📊 TIA TECHNICAL ANALYSIS (4H CHART)
TIA has been grinding sideways at 0.52 to 0.55 for 4 days, right under the EMA50 (0.5539). The EMA20 (0.5383) is still sloping down, and RSI sits at a neutral 50. The long wick down to 0.498 on Oct 27 shows there are buyers lower, so TP3 is set just above that zone.
🔑 KEY LEVELS
Support: 0.5300, then 0.4980
Resistance: 0.5539 (EMA50), then 0.5800
📈 Bullish scenario: a 4H close above 0.5532 and the EMA50 breaks the range upward and cancels the short.
📉 Bearish scenario: losing 0.53 sends TIA back to the 0.50 to 0.52 zone.
💡 Bottom line: a range trade under resistance. Tight stop, quick targets.
👉 Tap $TIA
to open the live chart. NFA
🔥 TRADE WITH LOWER FEES
✅ Get a 20% kickback on your Binance trading fees, for life
👇👇👇
Claim your 20% Binance fee kickback here
━━━━━━━━━━
Celestia: breakdown to 0.50 or a squeeze back to 0.60? 👇
Follow Crypto Signals and Analysis for daily signals.
#cryptosignals #TIA #EarningsSeason
⚠️ Crypto is volatile: risk only what you can afford to lose.
·
--
Bullish
$XLM Price Prediction Today: Stellar Crypto Signal & Technical Analysis 📊
🟢 LONG | Entry 0.1702 - 0.1708 | TP1 0.1746 | SL 0.1664
👉 Tap $XLM to place your trade fast
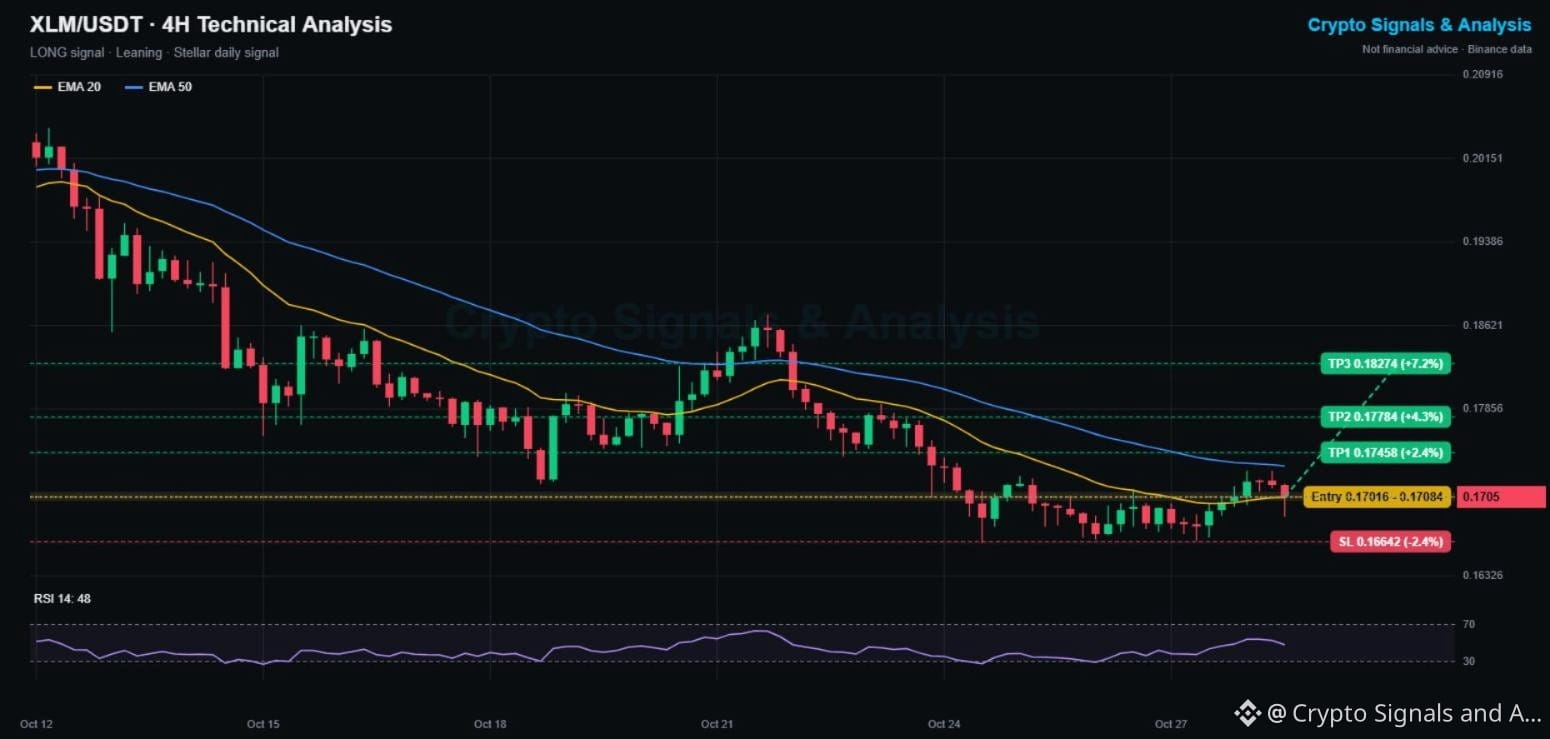
Stellar has formed a double bottom at 0.1663 to 0.1665 after an 18% drop this month. It just reclaimed the 4H EMA20, and this pullback to the EMA is the first chance for a low-risk long entry.
📌 STELLAR TRADING SIGNAL (Leaning, double bottom setup)
Entry: 0.1702 - 0.1708
Take profit 1: 0.1746 (+2.4%)
Take profit 2: 0.1778 (+4.3%)
Take profit 3: 0.1827 (+7.2%)
Stop loss: 0.1664 (-2.4%)
📊 XLM TECHNICAL ANALYSIS (4H CHART)
XLM has bounced off the same 0.1663 level twice, which makes it strong support. Price holds the EMA20 (0.1705), which is now turning up. RSI at 48 is neutral. The EMA50 (0.1733) is the confirmation line: a close above it completes the double bottom and opens 0.178 to 0.183.
🔑 KEY LEVELS
Support: 0.1705 (EMA20), then 0.1663
Resistance: 0.1733 (EMA50), then 0.1786
📈 Bullish scenario: a 4H close above 0.1733 confirms the double bottom and targets TP2 and TP3.
📉 Bearish scenario: losing 0.1663 breaks the double bottom. A close under 0.1664 cancels this signal.
💡 Bottom line: a tight-risk setup with a clear invalidation just under the double bottom.
👉 Tap $XLM
to open the live chart. NFA
🔥 TRADE WITH LOWER FEES
✅ Get a 20% kickback on your Binance trading fees, for life
👇👇👇
{spot}(XLMUSDT)
[Claim your 20% Binance fee kickback here](https://www.binance.com/register?ref=X0NQWZ4N)
━━━━━━━━━━
Stellar or XRP: which payment coin wins this quarter? 👇
Follow Crypto Signals and Analysis for daily signals.
#cryptosignals #XLM #CanMicrosoftDeliverOnAI
⚠️ Crypto is volatile: risk only what you can afford to lose.
$XLM Price Prediction Today: Stellar Crypto Signal & Technical Analysis 📊
🟢 LONG | Entry 0.1702 - 0.1708 | TP1 0.1746 | SL 0.1664
👉 Tap $XLM to place your trade fast
Stellar has formed a double bottom at 0.1663 to 0.1665 after an 18% drop this month. It just reclaimed the 4H EMA20, and this pullback to the EMA is the first chance for a low-risk long entry.
📌 STELLAR TRADING SIGNAL (Leaning, double bottom setup)
Entry: 0.1702 - 0.1708
Take profit 1: 0.1746 (+2.4%)
Take profit 2: 0.1778 (+4.3%)
Take profit 3: 0.1827 (+7.2%)
Stop loss: 0.1664 (-2.4%)
📊 XLM TECHNICAL ANALYSIS (4H CHART)
XLM has bounced off the same 0.1663 level twice, which makes it strong support. Price holds the EMA20 (0.1705), which is now turning up. RSI at 48 is neutral. The EMA50 (0.1733) is the confirmation line: a close above it completes the double bottom and opens 0.178 to 0.183.
🔑 KEY LEVELS
Support: 0.1705 (EMA20), then 0.1663
Resistance: 0.1733 (EMA50), then 0.1786
📈 Bullish scenario: a 4H close above 0.1733 confirms the double bottom and targets TP2 and TP3.
📉 Bearish scenario: losing 0.1663 breaks the double bottom. A close under 0.1664 cancels this signal.
💡 Bottom line: a tight-risk setup with a clear invalidation just under the double bottom.
👉 Tap $XLM
to open the live chart. NFA
🔥 TRADE WITH LOWER FEES
✅ Get a 20% kickback on your Binance trading fees, for life
👇👇👇
Claim your 20% Binance fee kickback here
━━━━━━━━━━
Stellar or XRP: which payment coin wins this quarter? 👇
Follow Crypto Signals and Analysis for daily signals.
#cryptosignals #XLM #CanMicrosoftDeliverOnAI
⚠️ Crypto is volatile: risk only what you can afford to lose.
·
--
Bullish
$PENGU Price Prediction Today: Pudgy Penguins Crypto Signal & Technical Analysis 📊
🟢 LONG | Entry 0.007728 - 0.007758 | TP1 0.008193 | SL 0.007293
👉 Tap $PENGU to place your trade fast
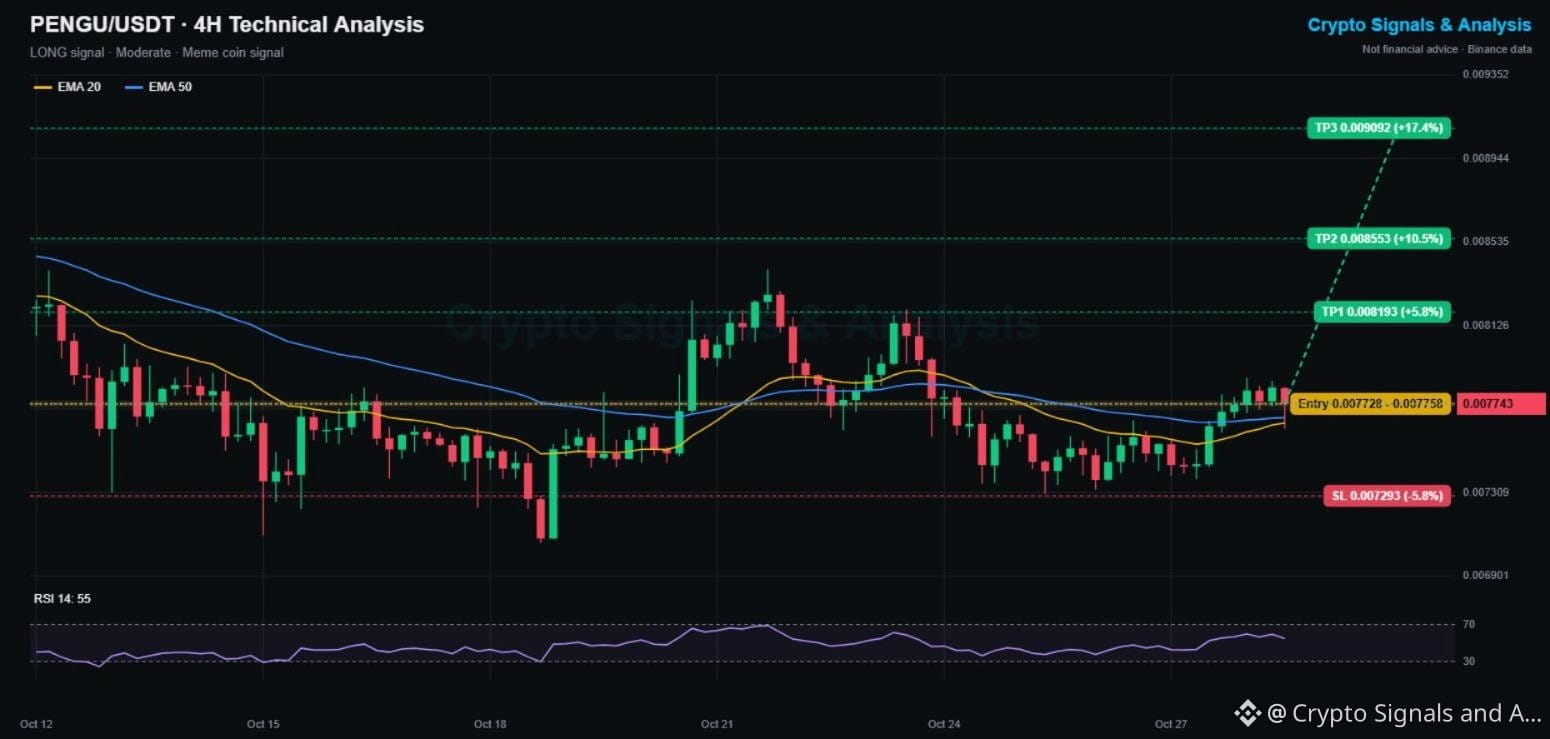
Meme coins are leading today (PEPE +10%), and Pudgy Penguins just reclaimed both 4H EMAs after a 4-day base at 0.0073. The dip back to the EMAs is being bought, a sign that buyers are stepping in.
📌 PENGU TRADING SIGNAL (Moderate, 3/5 signals agree)
Entry: 0.007728 - 0.007758
Take profit 1: 0.008193 (+5.8%)
Take profit 2: 0.008553 (+10.5%)
Take profit 3: 0.009092 (+17.4%)
Stop loss: 0.007293 (-5.8%)
📊 PENGU TECHNICAL ANALYSIS (4H CHART)
Price is above the EMA20 (0.00765) and EMA50 (0.00768), and the EMA20 is about to cross above the EMA50. RSI at 55 leans bullish. The two big hurdles are 0.00787 (recent high) and 0.0082 to 0.0084 (Oct 21 to 23 highs).
🔑 KEY LEVELS
Support: 0.00765 (EMAs), then 0.00730
Resistance: 0.00787, then 0.00820
📈 Bullish scenario: a 4H close above 0.00787 confirms the breakout toward TP1 and TP2.
📉 Bearish scenario: losing the EMAs puts PENGU back in its base. A close under 0.007293 cancels this signal.
💡 Bottom line: when meme season heats up, PENGU tends to move fast. The EMAs are your line in the sand.
👉 Tap $PENGU
to open the live chart. NFA
🔥 TRADE WITH LOWER FEES
✅ Get a 20% kickback on your Binance trading fees, for life
👇👇👇
{spot}(PENGUUSDT)
[Claim your 20% Binance fee kickback here](https://www.binance.com/register?ref=X0NQWZ4N)
━━━━━━━━━━
Best meme coin for the next pump: PEPE, DOGE or PENGU? 👇
Follow Crypto Signals and Analysis for daily signals.
#cryptosignals #PENGU #CanGoogleDefendItsCore
⚠️ Crypto is volatile: risk only what you can afford to lose.
$PENGU Price Prediction Today: Pudgy Penguins Crypto Signal & Technical Analysis 📊
🟢 LONG | Entry 0.007728 - 0.007758 | TP1 0.008193 | SL 0.007293
👉 Tap $PENGU to place your trade fast
Meme coins are leading today (PEPE +10%), and Pudgy Penguins just reclaimed both 4H EMAs after a 4-day base at 0.0073. The dip back to the EMAs is being bought, a sign that buyers are stepping in.
📌 PENGU TRADING SIGNAL (Moderate, 3/5 signals agree)
Entry: 0.007728 - 0.007758
Take profit 1: 0.008193 (+5.8%)
Take profit 2: 0.008553 (+10.5%)
Take profit 3: 0.009092 (+17.4%)
Stop loss: 0.007293 (-5.8%)
📊 PENGU TECHNICAL ANALYSIS (4H CHART)
Price is above the EMA20 (0.00765) and EMA50 (0.00768), and the EMA20 is about to cross above the EMA50. RSI at 55 leans bullish. The two big hurdles are 0.00787 (recent high) and 0.0082 to 0.0084 (Oct 21 to 23 highs).
🔑 KEY LEVELS
Support: 0.00765 (EMAs), then 0.00730
Resistance: 0.00787, then 0.00820
📈 Bullish scenario: a 4H close above 0.00787 confirms the breakout toward TP1 and TP2.
📉 Bearish scenario: losing the EMAs puts PENGU back in its base. A close under 0.007293 cancels this signal.
💡 Bottom line: when meme season heats up, PENGU tends to move fast. The EMAs are your line in the sand.
👉 Tap $PENGU
to open the live chart. NFA
🔥 TRADE WITH LOWER FEES
✅ Get a 20% kickback on your Binance trading fees, for life
👇👇👇
Claim your 20% Binance fee kickback here
━━━━━━━━━━
Best meme coin for the next pump: PEPE, DOGE or PENGU? 👇
Follow Crypto Signals and Analysis for daily signals.
#cryptosignals #PENGU #CanGoogleDefendItsCore
⚠️ Crypto is volatile: risk only what you can afford to lose.
2
·
--
Bearish
$AAVE Price Prediction Today: Aave Crypto Signal & Technical Analysis 📊
🔴 SHORT | Entry 132.4 - 133.0 | TP1 126.3 | SL 139.2
👉 Tap $AAVE to place your trade fast
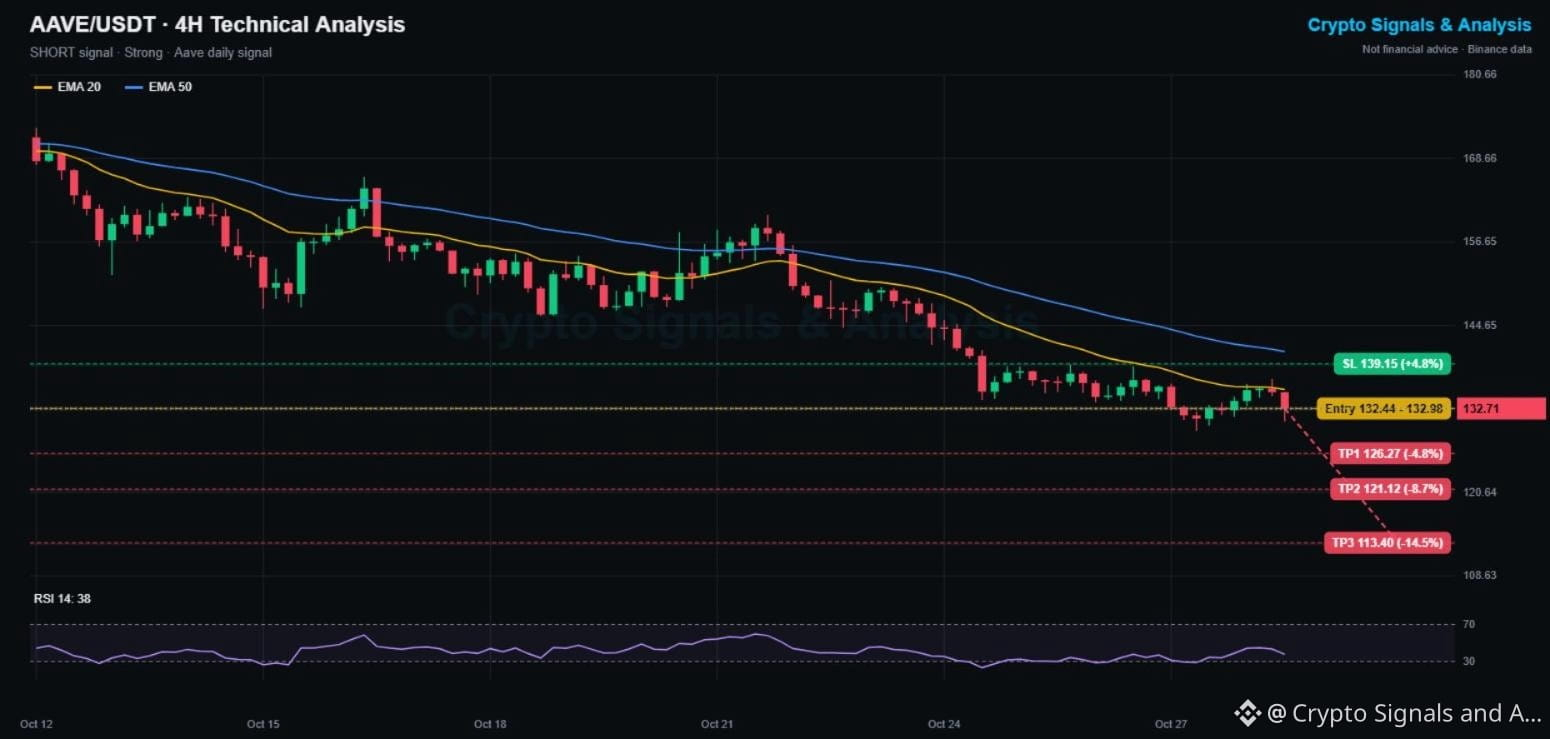
Aave is one of the weakest large caps this month: down 16% in a week and 23% since Oct 12 (from 173 to 129.5). The latest bounce stalled under the falling 4H EMA20, and a fresh red candle is pushing it lower again.
📌 AAVE TRADING SIGNAL (Strong, 5/5 signals agree)
Entry: 132.4 - 133.0
Take profit 1: 126.3 (-4.8%)
Take profit 2: 121.1 (-8.7%)
Take profit 3: 113.4 (-14.5%)
Stop loss: 139.2 (+4.8%)
📊 AAVE TECHNICAL ANALYSIS (4H CHART)
Every trend signal points down: price is under the EMA20 (135.5) and EMA50 (140.9), both EMAs are falling, and RSI is 38. The 129.5 low from yesterday is the next test. Below it, there is no support on this chart until the 120s.
🔑 KEY LEVELS
Support: 129.5, then 121
Resistance: 135.5 (EMA20), then 139 to 141 (EMA50)
📈 Bullish scenario: a 4H close above 139.2 reclaims the EMA zone and cancels the short.
📉 Bearish scenario: losing 129.5 opens TP2 and TP3.
💡 Bottom line: DeFi blue chips are under heavy pressure, and Aave leads the decline. Short the bounces, not the lows.
👉 Tap $AAVE
to open the live chart. NFA
🔥 TRADE WITH LOWER FEES
✅ Get a 20% kickback on your Binance trading fees, for life
👇👇👇
{spot}(AAVEUSDT)
[Claim your 20% Binance fee kickback here](https://www.binance.com/register?ref=X0NQWZ4N)
━━━━━━━━━━
Aave at 120 or 150 first? Vote below 👇
Follow Crypto Signals and Analysis for daily signals.
#cryptosignals #AAVE #EarningsSeason
⚠️ Crypto is volatile: risk only what you can afford to lose.
$AAVE Price Prediction Today: Aave Crypto Signal & Technical Analysis 📊
🔴 SHORT | Entry 132.4 - 133.0 | TP1 126.3 | SL 139.2
👉 Tap $AAVE to place your trade fast
Aave is one of the weakest large caps this month: down 16% in a week and 23% since Oct 12 (from 173 to 129.5). The latest bounce stalled under the falling 4H EMA20, and a fresh red candle is pushing it lower again.
📌 AAVE TRADING SIGNAL (Strong, 5/5 signals agree)
Entry: 132.4 - 133.0
Take profit 1: 126.3 (-4.8%)
Take profit 2: 121.1 (-8.7%)
Take profit 3: 113.4 (-14.5%)
Stop loss: 139.2 (+4.8%)
📊 AAVE TECHNICAL ANALYSIS (4H CHART)
Every trend signal points down: price is under the EMA20 (135.5) and EMA50 (140.9), both EMAs are falling, and RSI is 38. The 129.5 low from yesterday is the next test. Below it, there is no support on this chart until the 120s.
🔑 KEY LEVELS
Support: 129.5, then 121
Resistance: 135.5 (EMA20), then 139 to 141 (EMA50)
📈 Bullish scenario: a 4H close above 139.2 reclaims the EMA zone and cancels the short.
📉 Bearish scenario: losing 129.5 opens TP2 and TP3.
💡 Bottom line: DeFi blue chips are under heavy pressure, and Aave leads the decline. Short the bounces, not the lows.
👉 Tap $AAVE
to open the live chart. NFA
🔥 TRADE WITH LOWER FEES
✅ Get a 20% kickback on your Binance trading fees, for life
👇👇👇
Claim your 20% Binance fee kickback here
━━━━━━━━━━
Aave at 120 or 150 first? Vote below 👇
Follow Crypto Signals and Analysis for daily signals.
#cryptosignals #AAVE #EarningsSeason
⚠️ Crypto is volatile: risk only what you can afford to lose.
·
--
Bullish
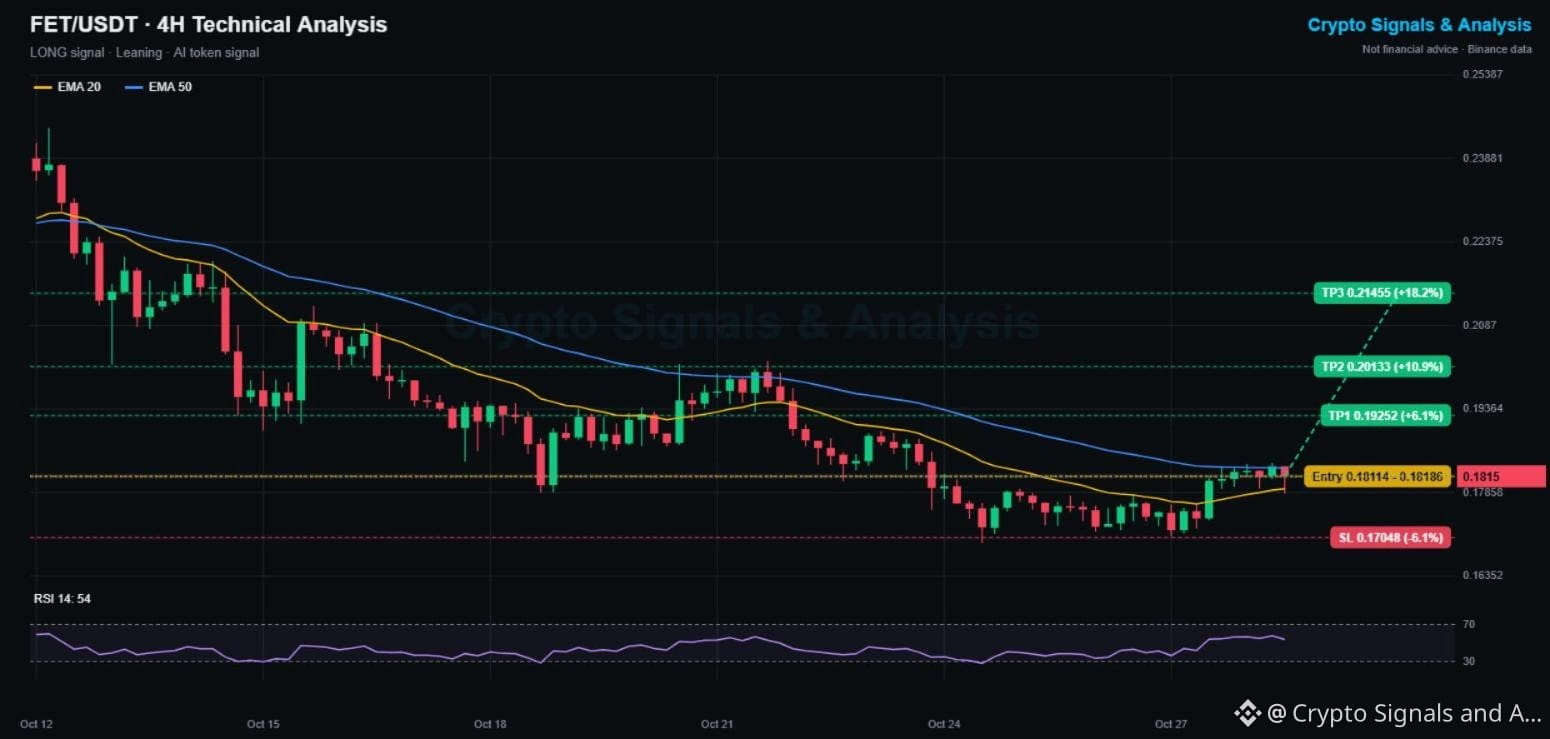
$FET Price Prediction Today: Artificial Superintelligence Alliance Crypto Signal & Technical Analysis 📊
🟢 LONG | Entry 0.1811 - 0.1819 | TP1 0.1925 | SL 0.1705
👉 Tap $FET to place your trade fast
The ASI Alliance token (formerly Fetch.ai) has built a solid base at 0.1695 to 0.171 after a 30% drop this month. Yesterday it jumped above its 4H EMA20, and it is now pressing the EMA50 for the first time since Oct 22.
📌 FET TRADING SIGNAL (Leaning, base breakout setup)
Entry: 0.1811 - 0.1819
Take profit 1: 0.1925 (+6.1%)
Take profit 2: 0.2013 (+10.9%)
Take profit 3: 0.2146 (+18.2%)
Stop loss: 0.1705 (-6.1%)
📊 FET TECHNICAL ANALYSIS (4H CHART)
Price holds above the rising EMA20 (0.1792) and is testing the EMA50 (0.1830). RSI at 54 is mildly bullish. Every rally this month has died at the EMA50, so a clean 4H close above 0.1839 is the trigger. The 0.193 to 0.20 zone (Oct 21 high) is the first big target.
🔑 KEY LEVELS
Support: 0.1792 (EMA20), then 0.1707
Resistance: 0.1839, then 0.193
📈 Bullish scenario: a 4H close above 0.1839 breaks the EMA50 and opens TP1 and TP2.
📉 Bearish scenario: another rejection sends FET back to the 0.171 base. A close under 0.1705 cancels this signal.
💡 Bottom line: the AI sector is beaten down, and FET is trying to turn first. The EMA50 decides it.
👉 Tap $FET
to open the live chart. NFA
🔥 TRADE WITH LOWER FEES
✅ Get a 20% kickback on your Binance trading fees, for life
👇👇👇
{spot}(FETUSDT)
[Claim your 20% Binance fee kickback here](https://www.binance.com/register?ref=X0NQWZ4N)
━━━━━━━━━━
Which AI coin bounces first: FET, TAO or Render? 👇
Follow Crypto Signals and Analysis for daily signals.
#cryptosignals #FET #CanMicrosoftDeliverOnAI
⚠️ Crypto is volatile: risk only what you can afford to lose.
$FET Price Prediction Today: Artificial Superintelligence Alliance Crypto Signal & Technical Analysis 📊
🟢 LONG | Entry 0.1811 - 0.1819 | TP1 0.1925 | SL 0.1705
👉 Tap $FET to place your trade fast
The ASI Alliance token (formerly Fetch.ai) has built a solid base at 0.1695 to 0.171 after a 30% drop this month. Yesterday it jumped above its 4H EMA20, and it is now pressing the EMA50 for the first time since Oct 22.
📌 FET TRADING SIGNAL (Leaning, base breakout setup)
Entry: 0.1811 - 0.1819
Take profit 1: 0.1925 (+6.1%)
Take profit 2: 0.2013 (+10.9%)
Take profit 3: 0.2146 (+18.2%)
Stop loss: 0.1705 (-6.1%)
📊 FET TECHNICAL ANALYSIS (4H CHART)
Price holds above the rising EMA20 (0.1792) and is testing the EMA50 (0.1830). RSI at 54 is mildly bullish. Every rally this month has died at the EMA50, so a clean 4H close above 0.1839 is the trigger. The 0.193 to 0.20 zone (Oct 21 high) is the first big target.
🔑 KEY LEVELS
Support: 0.1792 (EMA20), then 0.1707
Resistance: 0.1839, then 0.193
📈 Bullish scenario: a 4H close above 0.1839 breaks the EMA50 and opens TP1 and TP2.
📉 Bearish scenario: another rejection sends FET back to the 0.171 base. A close under 0.1705 cancels this signal.
💡 Bottom line: the AI sector is beaten down, and FET is trying to turn first. The EMA50 decides it.
👉 Tap $FET
to open the live chart. NFA
🔥 TRADE WITH LOWER FEES
✅ Get a 20% kickback on your Binance trading fees, for life
👇👇👇
Claim your 20% Binance fee kickback here
━━━━━━━━━━
Which AI coin bounces first: FET, TAO or Render? 👇
Follow Crypto Signals and Analysis for daily signals.
#cryptosignals #FET #CanMicrosoftDeliverOnAI
⚠️ Crypto is volatile: risk only what you can afford to lose.
4
·
--
Bullish
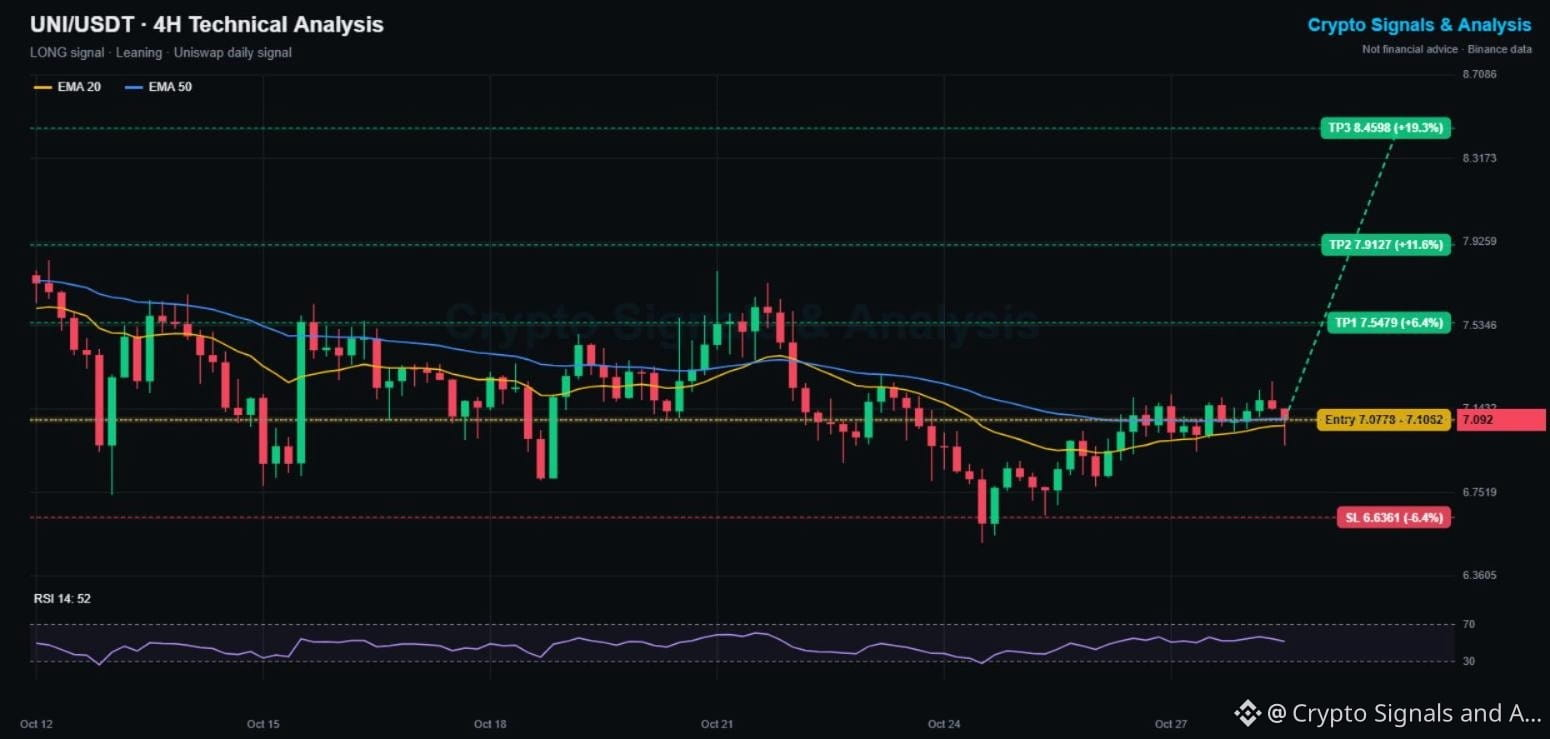
$UNI Price Prediction Today: Uniswap Crypto Signal & Technical Analysis 📊
🟢 LONG | Entry 7.078 - 7.106 | TP1 7.548 | SL 6.636
👉 Tap $UNI to place your trade fast
Uniswap has spent 3 days building higher lows from the 6.52 bottom and is now sitting right on its flattened 4H EMAs at 7.07 to 7.10. The selling pressure has faded, and the next big move is loading.
📌 UNISWAP TRADING SIGNAL (Leaning, early trend change)
Entry: 7.078 - 7.106
Take profit 1: 7.548 (+6.4%)
Take profit 2: 7.913 (+11.6%)
Take profit 3: 8.460 (+19.3%)
Stop loss: 6.636 (-6.4%)
📊 UNI TECHNICAL ANALYSIS (4H CHART)
The EMA20 (7.066) is curling up and about to cross the EMA50 (7.096). RSI sits at a neutral 52. Lows have stepped up from 6.52 to 6.65 to 6.95. The ceiling is 7.27; a breakout there would confirm the trend change toward the 7.54 high from Oct 21.
🔑 KEY LEVELS
Support: 6.95, then 6.645
Resistance: 7.274, then 7.54
📈 Bullish scenario: a 4H close above 7.274 confirms the higher-low structure and targets TP1 and TP2.
📉 Bearish scenario: losing 6.95 puts the bottom back in question. A close under 6.636 cancels this signal.
💡 Bottom line: this setup is still early. Wait for the 7.27 break if you want confirmation.
👉 Tap $UNI
to open the live chart. NFA
🔥 TRADE WITH LOWER FEES
✅ Get a 20% kickback on your Binance trading fees, for life
👇👇👇
{spot}(UNIUSDT)
[Claim your 20% Binance fee kickback here](https://www.binance.com/register?ref=X0NQWZ4N)
━━━━━━━━━━
Is DeFi about to make a comeback? Uniswap could lead it 👇
Follow Crypto Signals and Analysis for daily signals.
#cryptosignals #UNI #CanGoogleDefendItsCore
⚠️ Crypto is volatile: risk only what you can afford to lose.
$UNI Price Prediction Today: Uniswap Crypto Signal & Technical Analysis 📊
🟢 LONG | Entry 7.078 - 7.106 | TP1 7.548 | SL 6.636
👉 Tap $UNI to place your trade fast
Uniswap has spent 3 days building higher lows from the 6.52 bottom and is now sitting right on its flattened 4H EMAs at 7.07 to 7.10. The selling pressure has faded, and the next big move is loading.
📌 UNISWAP TRADING SIGNAL (Leaning, early trend change)
Entry: 7.078 - 7.106
Take profit 1: 7.548 (+6.4%)
Take profit 2: 7.913 (+11.6%)
Take profit 3: 8.460 (+19.3%)
Stop loss: 6.636 (-6.4%)
📊 UNI TECHNICAL ANALYSIS (4H CHART)
The EMA20 (7.066) is curling up and about to cross the EMA50 (7.096). RSI sits at a neutral 52. Lows have stepped up from 6.52 to 6.65 to 6.95. The ceiling is 7.27; a breakout there would confirm the trend change toward the 7.54 high from Oct 21.
🔑 KEY LEVELS
Support: 6.95, then 6.645
Resistance: 7.274, then 7.54
📈 Bullish scenario: a 4H close above 7.274 confirms the higher-low structure and targets TP1 and TP2.
📉 Bearish scenario: losing 6.95 puts the bottom back in question. A close under 6.636 cancels this signal.
💡 Bottom line: this setup is still early. Wait for the 7.27 break if you want confirmation.
👉 Tap $UNI
to open the live chart. NFA
🔥 TRADE WITH LOWER FEES
✅ Get a 20% kickback on your Binance trading fees, for life
👇👇👇
Claim your 20% Binance fee kickback here
━━━━━━━━━━
Is DeFi about to make a comeback? Uniswap could lead it 👇
Follow Crypto Signals and Analysis for daily signals.
#cryptosignals #UNI #CanGoogleDefendItsCore
⚠️ Crypto is volatile: risk only what you can afford to lose.
2
·
--
Bearish
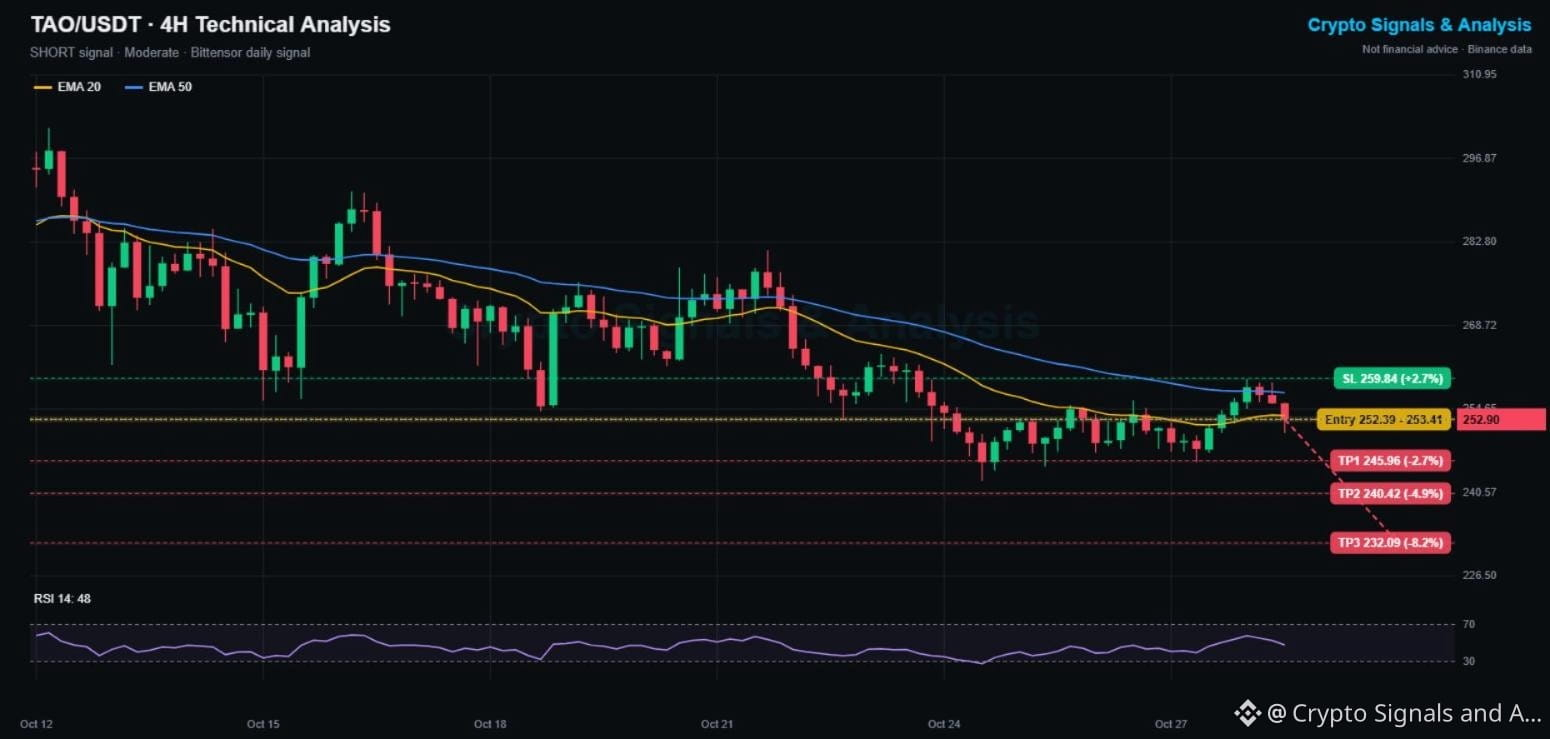
$TAO Price Prediction Today: Bittensor Crypto Signal & Technical Analysis 📊
🔴 SHORT | Entry 252.4 - 253.4 | TP1 246.0 | SL 259.8
👉 Tap $TAO to place your trade fast
Bittensor, the top AI crypto, is down 9% this week. Its bounce ran straight into the falling 4H EMA50 at 259.7 and got rejected, and now TAO is slipping back under the EMA20.
📌 BITTENSOR TRADING SIGNAL (Moderate, 3/5 signals agree)
Entry: 252.4 - 253.4
Take profit 1: 246.0 (-2.7%)
Take profit 2: 240.4 (-4.9%)
Take profit 3: 232.1 (-8.2%)
Stop loss: 259.8 (+2.7%)
📊 TAO TECHNICAL ANALYSIS (4H CHART)
TAO dropped from 302 to 242.6 since Oct 12, making lower highs at 291, 280 and now 259.7. The EMA50 (257.4) is the trend line that sellers keep defending. RSI at 48 is neutral. The 245 to 242.6 zone is the floor, and below it there is little support until the low 230s.
🔑 KEY LEVELS
Support: 245, then 242.6
Resistance: 257.4 (EMA50), then 259.7
📈 Bullish scenario: a 4H close above 259.8 breaks the lower-high pattern and cancels the short.
📉 Bearish scenario: losing 242.6 opens TP2 and TP3.
💡 Bottom line: AI coins are lagging this week, and Bittensor's chart shows it. Sell the rallies into the EMA50.
👉 Tap $TAO
to open the live chart. NFA
🔥 TRADE WITH LOWER FEES
✅ Get a 20% kickback on your Binance trading fees, for life
👇👇👇
{spot}(TAOUSDT)
[Claim your 20% Binance fee kickback here](https://www.binance.com/register?ref=X0NQWZ4N)
━━━━━━━━━━
AI coins: buying the dip, or waiting for a bottom? 👇
Follow Crypto Signals and Analysis for daily signals.
#cryptosignals #TAO #CanMicrosoftDeliverOnAI
⚠️ Crypto is volatile: risk only what you can afford to lose.
$TAO Price Prediction Today: Bittensor Crypto Signal & Technical Analysis 📊
🔴 SHORT | Entry 252.4 - 253.4 | TP1 246.0 | SL 259.8
👉 Tap $TAO to place your trade fast
Bittensor, the top AI crypto, is down 9% this week. Its bounce ran straight into the falling 4H EMA50 at 259.7 and got rejected, and now TAO is slipping back under the EMA20.
📌 BITTENSOR TRADING SIGNAL (Moderate, 3/5 signals agree)
Entry: 252.4 - 253.4
Take profit 1: 246.0 (-2.7%)
Take profit 2: 240.4 (-4.9%)
Take profit 3: 232.1 (-8.2%)
Stop loss: 259.8 (+2.7%)
📊 TAO TECHNICAL ANALYSIS (4H CHART)
TAO dropped from 302 to 242.6 since Oct 12, making lower highs at 291, 280 and now 259.7. The EMA50 (257.4) is the trend line that sellers keep defending. RSI at 48 is neutral. The 245 to 242.6 zone is the floor, and below it there is little support until the low 230s.
🔑 KEY LEVELS
Support: 245, then 242.6
Resistance: 257.4 (EMA50), then 259.7
📈 Bullish scenario: a 4H close above 259.8 breaks the lower-high pattern and cancels the short.
📉 Bearish scenario: losing 242.6 opens TP2 and TP3.
💡 Bottom line: AI coins are lagging this week, and Bittensor's chart shows it. Sell the rallies into the EMA50.
👉 Tap $TAO
to open the live chart. NFA
🔥 TRADE WITH LOWER FEES
✅ Get a 20% kickback on your Binance trading fees, for life
👇👇👇
Claim your 20% Binance fee kickback here
━━━━━━━━━━
AI coins: buying the dip, or waiting for a bottom? 👇
Follow Crypto Signals and Analysis for daily signals.
#cryptosignals #TAO #CanMicrosoftDeliverOnAI
⚠️ Crypto is volatile: risk only what you can afford to lose.
5
·
--
Bullish
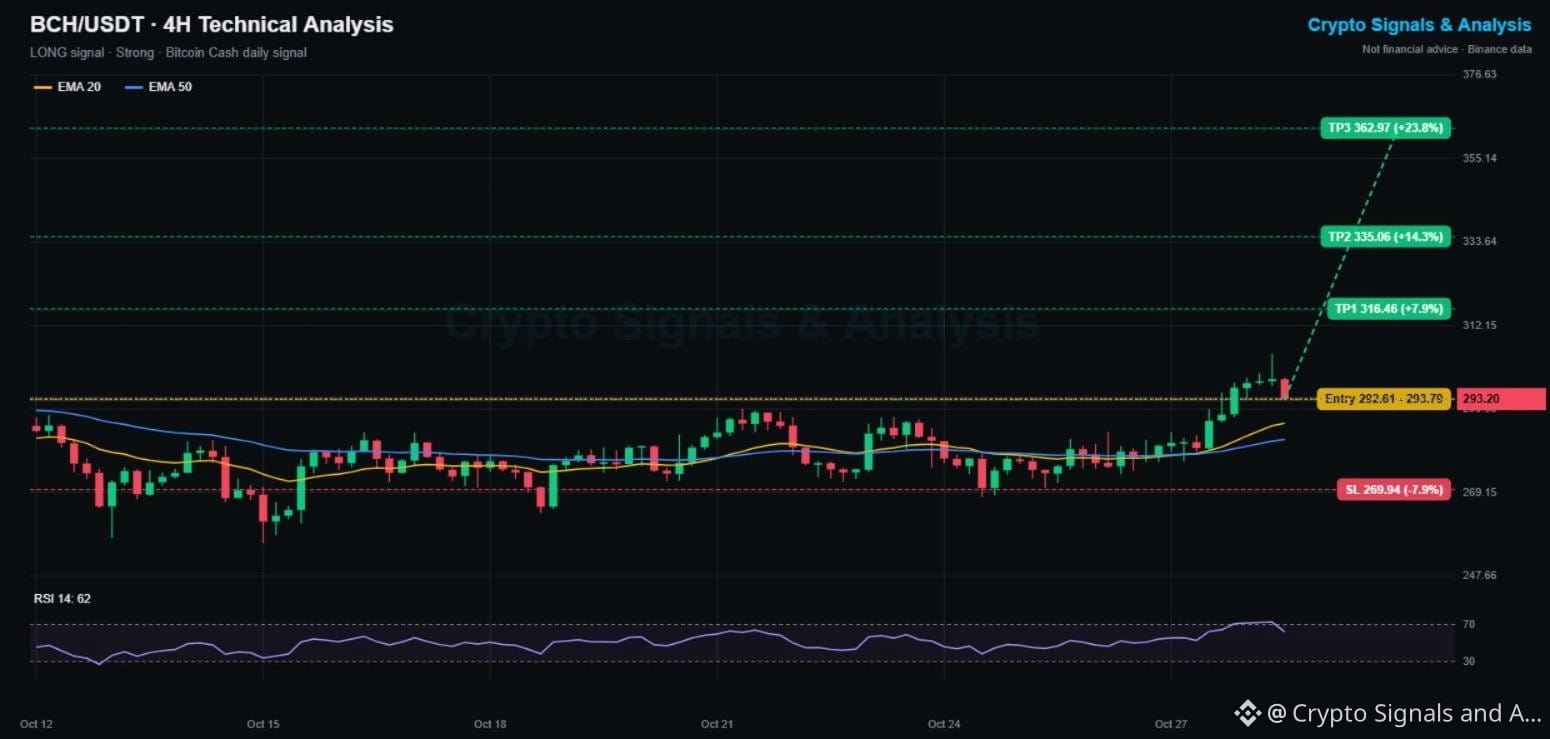
$BCH Price Prediction Today: Bitcoin Cash Crypto Signal & Technical Analysis 📊
🟢 LONG | Entry 292.6 - 293.8 | TP1 316.5 | SL 269.9
👉 Tap $BCH to place your trade fast
Bitcoin Cash just broke out of a 2-week range to a new monthly high at 304.8, while Bitcoin itself is down on the week. Now BCH is pulling back toward the breakout zone around 290, which is the spot buyers want to defend.
📌 BITCOIN CASH TRADING SIGNAL (Strong, 5/5 signals agree)
Entry: 292.6 - 293.8
Take profit 1: 316.5 (+7.9%)
Take profit 2: 335.1 (+14.3%)
Take profit 3: 363.0 (+23.8%)
Stop loss: 269.9 (-7.9%)
📊 BCH TECHNICAL ANALYSIS (4H CHART)
For 2 weeks BCH ranged from 270 to 290. The breakout candle cleared 290 with conviction, and both EMAs (EMA20 287.0, EMA50 282.8) are now rising under price. RSI cooled from 70 to 62 on the pullback, which is healthy. As long as 287 holds, the breakout is valid.
🔑 KEY LEVELS
Support: 287 (EMA20), then 282.8 (EMA50)
Resistance: 304.8, then 316
📈 Bullish scenario: a 4H close above 304.8 resumes the breakout toward 316 and 335.
📉 Bearish scenario: a close back inside the old range (under 282) is a failed breakout. A close under 269.9 cancels this signal.
💡 Bottom line: the classic play is to buy the retest of a range breakout, and that is exactly where BCH is now.
👉 Tap $BCH
to open the live chart. NFA
🔥 TRADE WITH LOWER FEES
✅ Get a 20% kickback on your Binance trading fees, for life
👇👇👇
{spot}(BCHUSDT)
[Claim your 20% Binance fee kickback here](https://www.binance.com/register?ref=X0NQWZ4N)
━━━━━━━━━━
Bitcoin Cash outperforming Bitcoin: will it last? 👇
Follow Crypto Signals and Analysis for daily signals.
#cryptosignals #BCH #EarningsSeason
⚠️ Crypto is volatile: risk only what you can afford to lose.
$BCH Price Prediction Today: Bitcoin Cash Crypto Signal & Technical Analysis 📊
🟢 LONG | Entry 292.6 - 293.8 | TP1 316.5 | SL 269.9
👉 Tap $BCH to place your trade fast
Bitcoin Cash just broke out of a 2-week range to a new monthly high at 304.8, while Bitcoin itself is down on the week. Now BCH is pulling back toward the breakout zone around 290, which is the spot buyers want to defend.
📌 BITCOIN CASH TRADING SIGNAL (Strong, 5/5 signals agree)
Entry: 292.6 - 293.8
Take profit 1: 316.5 (+7.9%)
Take profit 2: 335.1 (+14.3%)
Take profit 3: 363.0 (+23.8%)
Stop loss: 269.9 (-7.9%)
📊 BCH TECHNICAL ANALYSIS (4H CHART)
For 2 weeks BCH ranged from 270 to 290. The breakout candle cleared 290 with conviction, and both EMAs (EMA20 287.0, EMA50 282.8) are now rising under price. RSI cooled from 70 to 62 on the pullback, which is healthy. As long as 287 holds, the breakout is valid.
🔑 KEY LEVELS
Support: 287 (EMA20), then 282.8 (EMA50)
Resistance: 304.8, then 316
📈 Bullish scenario: a 4H close above 304.8 resumes the breakout toward 316 and 335.
📉 Bearish scenario: a close back inside the old range (under 282) is a failed breakout. A close under 269.9 cancels this signal.
💡 Bottom line: the classic play is to buy the retest of a range breakout, and that is exactly where BCH is now.
👉 Tap $BCH
to open the live chart. NFA
🔥 TRADE WITH LOWER FEES
✅ Get a 20% kickback on your Binance trading fees, for life
👇👇👇
Claim your 20% Binance fee kickback here
━━━━━━━━━━
Bitcoin Cash outperforming Bitcoin: will it last? 👇
Follow Crypto Signals and Analysis for daily signals.
#cryptosignals #BCH #EarningsSeason
⚠️ Crypto is volatile: risk only what you can afford to lose.
·
--
Bullish
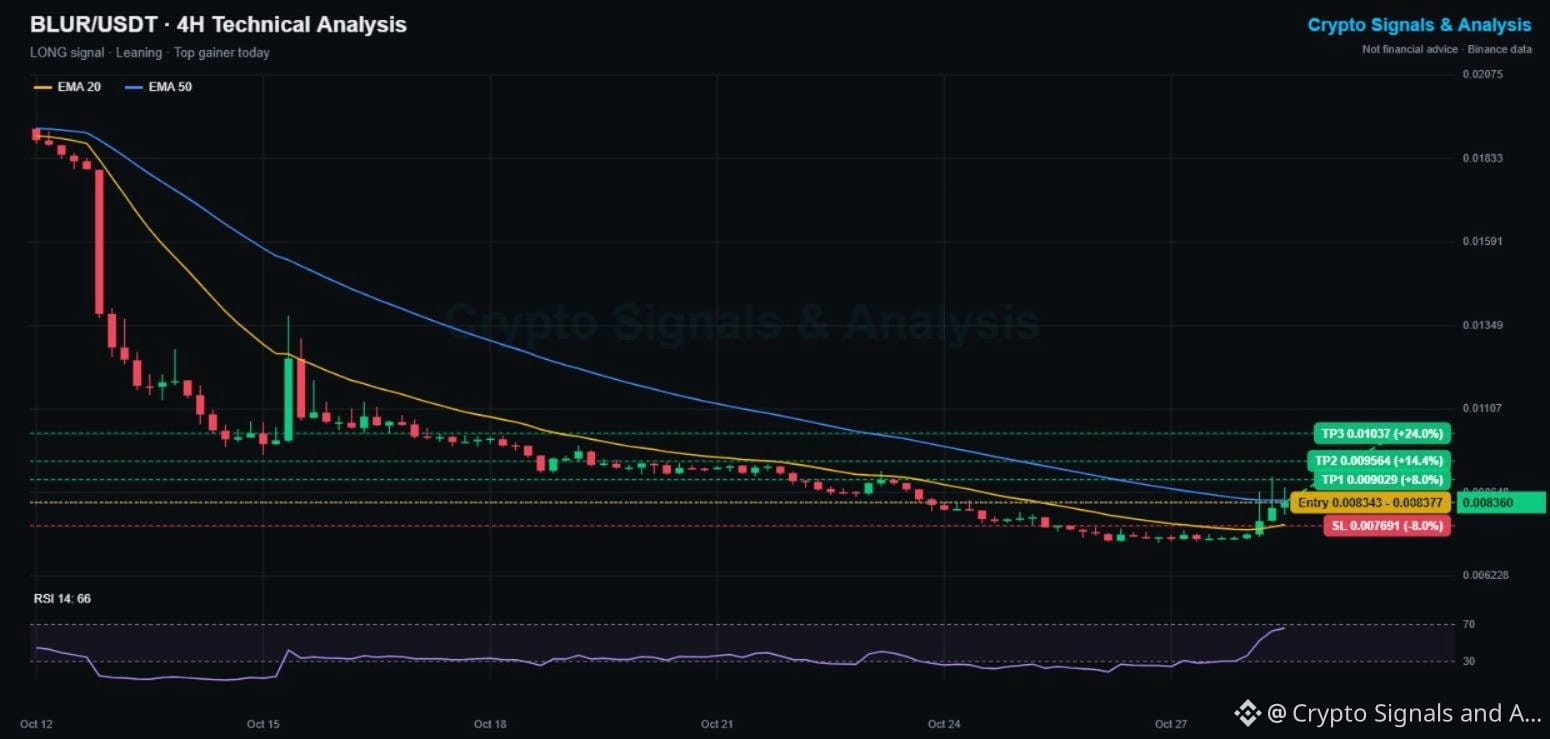
$BLUR Price Prediction Today: Blur Crypto Signal & Technical Analysis 📊
🟢 LONG | Entry 0.008343 - 0.008377 | TP1 0.009029 | SL 0.007691
👉 Tap $BLUR to place your trade fast
Blur is up 14% today, one of the top gainers on Binance. After crashing 60% this month (from 0.019 to 0.0072), it has finally put in a bottom, and buyers just pushed it back above its 4H EMA20.
📌 BLUR TRADING SIGNAL (Leaning, oversold bounce)
Entry: 0.008343 - 0.008377
Take profit 1: 0.009029 (+8%)
Take profit 2: 0.009564 (+14%)
Take profit 3: 0.010370 (+24%)
Stop loss: 0.007691 (-8%)
📊 BLUR TECHNICAL ANALYSIS (4H CHART)
After 2 weeks of slow bleeding, BLUR printed its first strong green candles since Oct 15. RSI shot from 30 to 66. Price is above the EMA20 (0.00772) and now pressing the EMA50 (0.00842), the line that has capped every bounce this month. This is the key test.
🔑 KEY LEVELS
Support: 0.00772 (EMA20), then 0.00719
Resistance: 0.00842 (EMA50), then 0.00910
📈 Bullish scenario: a 4H close above the EMA50 (0.00842) confirms the reversal and opens TP2.
📉 Bearish scenario: a rejection here sends BLUR back to the 0.0072 low. A close under 0.007691 cancels this signal.
💡 Bottom line: this is a bounce trade against a big downtrend. Keep the size small and take TP1 quickly.
👉 Tap $BLUR
to open the live chart. NFA
🔥 TRADE WITH LOWER FEES
✅ Get a 20% kickback on your Binance trading fees, for life
👇👇👇
{spot}(BLURUSDT)
[Claim your 20% Binance fee kickback here](https://www.binance.com/register?ref=X0NQWZ4N)
━━━━━━━━━━
Blur bottom is in, or a dead cat bounce? 👇
Follow Crypto Signals and Analysis for daily signals.
#cryptosignals #BLUR #CanGoogleDefendItsCore
⚠️ Crypto is volatile: risk only what you can afford to lose.
$BLUR Price Prediction Today: Blur Crypto Signal & Technical Analysis 📊
🟢 LONG | Entry 0.008343 - 0.008377 | TP1 0.009029 | SL 0.007691
👉 Tap $BLUR to place your trade fast
Blur is up 14% today, one of the top gainers on Binance. After crashing 60% this month (from 0.019 to 0.0072), it has finally put in a bottom, and buyers just pushed it back above its 4H EMA20.
📌 BLUR TRADING SIGNAL (Leaning, oversold bounce)
Entry: 0.008343 - 0.008377
Take profit 1: 0.009029 (+8%)
Take profit 2: 0.009564 (+14%)
Take profit 3: 0.010370 (+24%)
Stop loss: 0.007691 (-8%)
📊 BLUR TECHNICAL ANALYSIS (4H CHART)
After 2 weeks of slow bleeding, BLUR printed its first strong green candles since Oct 15. RSI shot from 30 to 66. Price is above the EMA20 (0.00772) and now pressing the EMA50 (0.00842), the line that has capped every bounce this month. This is the key test.
🔑 KEY LEVELS
Support: 0.00772 (EMA20), then 0.00719
Resistance: 0.00842 (EMA50), then 0.00910
📈 Bullish scenario: a 4H close above the EMA50 (0.00842) confirms the reversal and opens TP2.
📉 Bearish scenario: a rejection here sends BLUR back to the 0.0072 low. A close under 0.007691 cancels this signal.
💡 Bottom line: this is a bounce trade against a big downtrend. Keep the size small and take TP1 quickly.
👉 Tap $BLUR
to open the live chart. NFA
🔥 TRADE WITH LOWER FEES
✅ Get a 20% kickback on your Binance trading fees, for life
👇👇👇
Claim your 20% Binance fee kickback here
━━━━━━━━━━
Blur bottom is in, or a dead cat bounce? 👇
Follow Crypto Signals and Analysis for daily signals.
#cryptosignals #BLUR #CanGoogleDefendItsCore
⚠️ Crypto is volatile: risk only what you can afford to lose.
51
·
--
Bullish
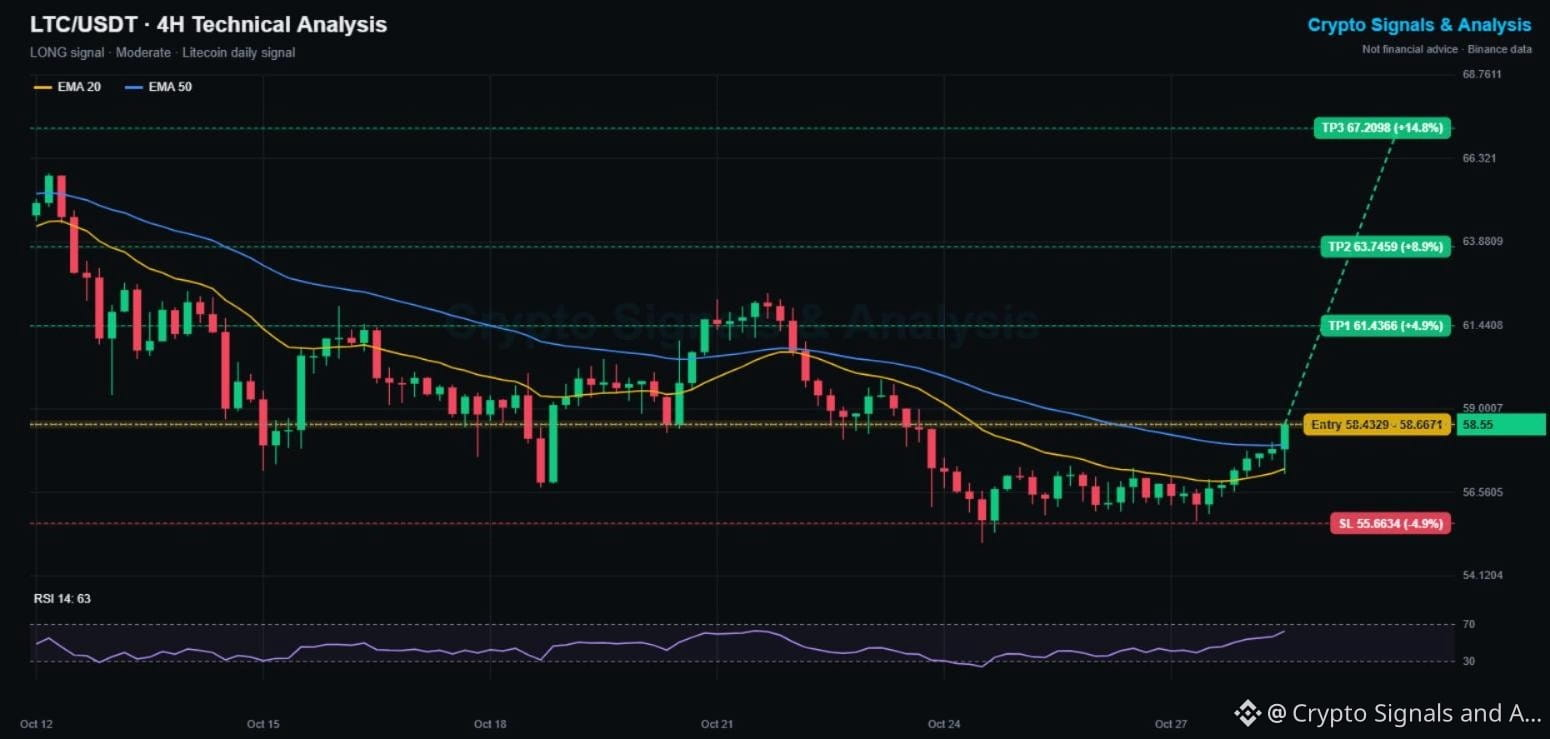
$LTC Price Prediction Today: Litecoin Crypto Signal & Technical Analysis 📊
🟢 LONG | Entry 58.43 - 58.67 | TP1 61.44 | SL 55.66
👉 Tap $LTC to place your trade fast
Litecoin is up 3.3% today and just broke above its 4H EMA50 for the first time since Oct 22. A strong green candle cleared 58.6, and the EMA20 is now turning up under price.
📌 LITECOIN TRADING SIGNAL (Moderate, 4/5 signals agree)
Entry: 58.43 - 58.67
Take profit 1: 61.44 (+4.9%)
Take profit 2: 63.75 (+8.9%)
Take profit 3: 67.21 (+14.8%)
Stop loss: 55.66 (-4.9%)
📊 LTC TECHNICAL ANALYSIS (4H CHART)
LTC built a 5-day base at 55.1 to 56.5 and is now breaking out of it. Price is above the EMA20 (57.26) and EMA50 (57.96), and RSI jumped to 63. The Oct 22 high at 61.4 lines up with TP1, and above it the 63.9 zone is next.
🔑 KEY LEVELS
Support: 57.96 (EMA50), then 55.72
Resistance: 61.4, then 63.9
📈 Bullish scenario: holding above the EMA50 keeps the breakout alive toward 61.4 and 63.9.
📉 Bearish scenario: a close back under 57.9 makes this a fakeout. A close under 55.66 cancels this signal.
💡 Bottom line: a base breakout on the old-school coin. A retest of 58 is the ideal entry.
👉 Tap $LTC
to open the live chart. NFA
🔥 TRADE WITH LOWER FEES
✅ Get a 20% kickback on your Binance trading fees, for life
👇👇👇
{spot}(LTCUSDT)
[Claim your 20% Binance fee kickback here](https://www.binance.com/register?ref=X0NQWZ4N)
━━━━━━━━━━
Litecoin breakout: real move or one more fakeout? 👇
Follow Crypto Signals and Analysis for daily signals.
#cryptosignals #LTC #CanMicrosoftDeliverOnAI
⚠️ Crypto is volatile: risk only what you can afford to lose.
$LTC Price Prediction Today: Litecoin Crypto Signal & Technical Analysis 📊
🟢 LONG | Entry 58.43 - 58.67 | TP1 61.44 | SL 55.66
👉 Tap $LTC to place your trade fast
Litecoin is up 3.3% today and just broke above its 4H EMA50 for the first time since Oct 22. A strong green candle cleared 58.6, and the EMA20 is now turning up under price.
📌 LITECOIN TRADING SIGNAL (Moderate, 4/5 signals agree)
Entry: 58.43 - 58.67
Take profit 1: 61.44 (+4.9%)
Take profit 2: 63.75 (+8.9%)
Take profit 3: 67.21 (+14.8%)
Stop loss: 55.66 (-4.9%)
📊 LTC TECHNICAL ANALYSIS (4H CHART)
LTC built a 5-day base at 55.1 to 56.5 and is now breaking out of it. Price is above the EMA20 (57.26) and EMA50 (57.96), and RSI jumped to 63. The Oct 22 high at 61.4 lines up with TP1, and above it the 63.9 zone is next.
🔑 KEY LEVELS
Support: 57.96 (EMA50), then 55.72
Resistance: 61.4, then 63.9
📈 Bullish scenario: holding above the EMA50 keeps the breakout alive toward 61.4 and 63.9.
📉 Bearish scenario: a close back under 57.9 makes this a fakeout. A close under 55.66 cancels this signal.
💡 Bottom line: a base breakout on the old-school coin. A retest of 58 is the ideal entry.
👉 Tap $LTC
to open the live chart. NFA
🔥 TRADE WITH LOWER FEES
✅ Get a 20% kickback on your Binance trading fees, for life
👇👇👇
Claim your 20% Binance fee kickback here
━━━━━━━━━━
Litecoin breakout: real move or one more fakeout? 👇
Follow Crypto Signals and Analysis for daily signals.
#cryptosignals #LTC #CanMicrosoftDeliverOnAI
⚠️ Crypto is volatile: risk only what you can afford to lose.
22
·
--
Bullish
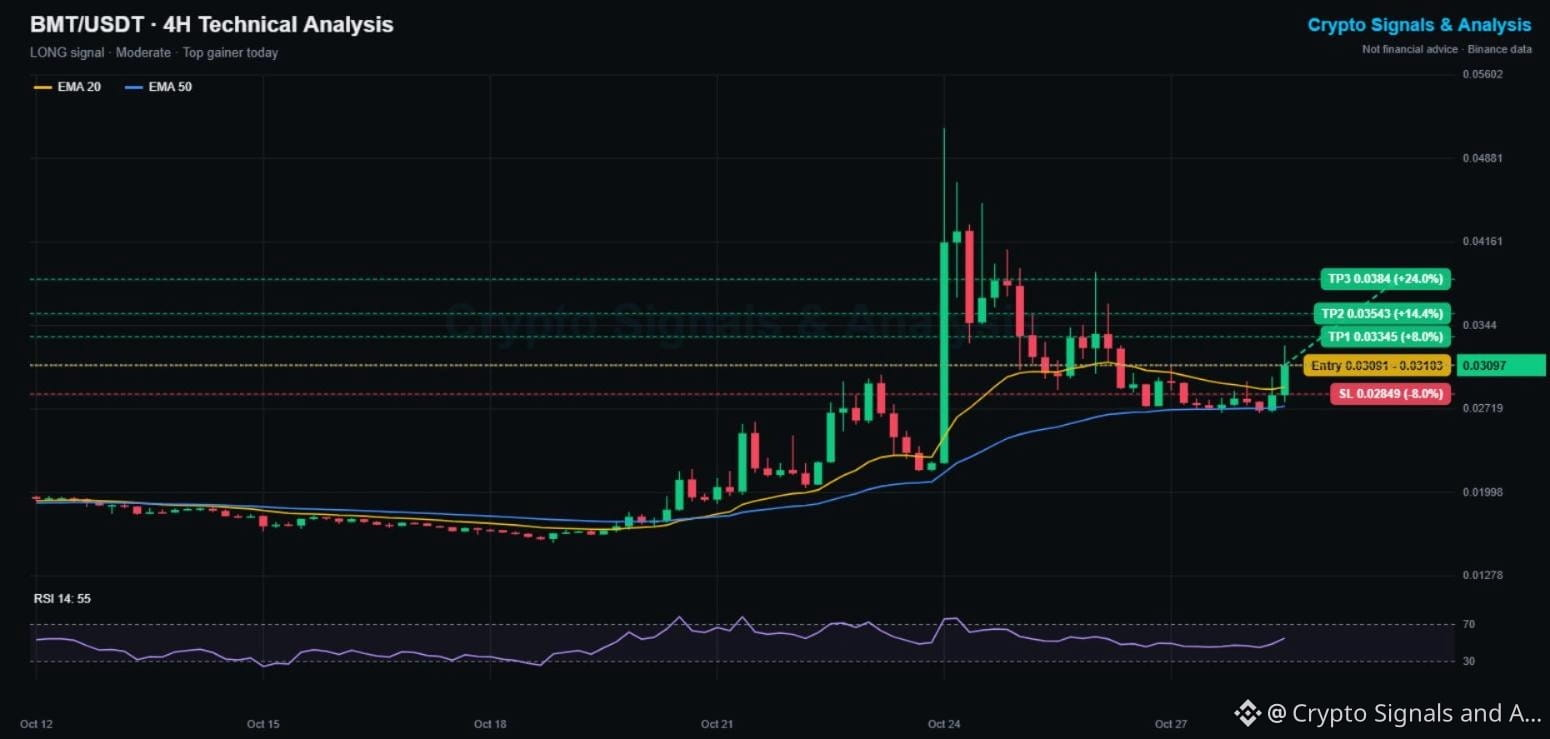
$BMT Price Prediction Today: Bubblemaps Crypto Signal & Technical Analysis 📊
🟢 LONG | Entry 0.03091 - 0.03103 | TP1 0.03345 | SL 0.02849
👉 Tap $BMT to place your trade fast
Bubblemaps is one of today's top gainers, up 14% in 24 hours and 40% in a week. After a wild spike to 0.051 on Oct 24, it cooled off for 4 days, held its rising 4H EMA50, and is now breaking higher again.
📌 BUBBLEMAPS TRADING SIGNAL (Moderate, high volatility)
Entry: 0.03091 - 0.03103
Take profit 1: 0.03345 (+8%)
Take profit 2: 0.03543 (+14%)
Take profit 3: 0.03840 (+24%)
Stop loss: 0.02849 (-8%)
📊 BMT TECHNICAL ANALYSIS (4H CHART)
The pullback ended exactly on the EMA50 (0.0274), and the latest big green candle has reclaimed the EMA20 (0.0291). RSI turned up from 45 to 55. The 0.033 to 0.034 zone was the post-spike range, and above it the next stop is the 0.039 high.
🔑 KEY LEVELS
Support: 0.0291 (EMA20), then 0.0274 (EMA50)
Resistance: 0.0335, then 0.0390
📈 Bullish scenario: a 4H close above 0.0335 opens TP2 and TP3.
📉 Bearish scenario: losing the EMA50 again means the momentum is gone. A close under 0.02849 cancels this signal.
💡 Bottom line: this is a small-cap coin with big swings. Trade small and take profit fast.
👉 Tap $BMT
to open the live chart. NFA
🔥 TRADE WITH LOWER FEES
✅ Get a 20% kickback on your Binance trading fees, for life
👇👇👇
{spot}(BMTUSDT)
[Claim your 20% Binance fee kickback here](https://www.binance.com/register?ref=X0NQWZ4N)
━━━━━━━━━━
Is Bubblemaps heading back to the 0.05 spike high? 👇
Follow Crypto Signals and Analysis for daily signals.
#cryptosignals #BMT #EarningsSeason
⚠️ Crypto is volatile: risk only what you can afford to lose.
$BMT Price Prediction Today: Bubblemaps Crypto Signal & Technical Analysis 📊
🟢 LONG | Entry 0.03091 - 0.03103 | TP1 0.03345 | SL 0.02849
👉 Tap $BMT to place your trade fast
Bubblemaps is one of today's top gainers, up 14% in 24 hours and 40% in a week. After a wild spike to 0.051 on Oct 24, it cooled off for 4 days, held its rising 4H EMA50, and is now breaking higher again.
📌 BUBBLEMAPS TRADING SIGNAL (Moderate, high volatility)
Entry: 0.03091 - 0.03103
Take profit 1: 0.03345 (+8%)
Take profit 2: 0.03543 (+14%)
Take profit 3: 0.03840 (+24%)
Stop loss: 0.02849 (-8%)
📊 BMT TECHNICAL ANALYSIS (4H CHART)
The pullback ended exactly on the EMA50 (0.0274), and the latest big green candle has reclaimed the EMA20 (0.0291). RSI turned up from 45 to 55. The 0.033 to 0.034 zone was the post-spike range, and above it the next stop is the 0.039 high.
🔑 KEY LEVELS
Support: 0.0291 (EMA20), then 0.0274 (EMA50)
Resistance: 0.0335, then 0.0390
📈 Bullish scenario: a 4H close above 0.0335 opens TP2 and TP3.
📉 Bearish scenario: losing the EMA50 again means the momentum is gone. A close under 0.02849 cancels this signal.
💡 Bottom line: this is a small-cap coin with big swings. Trade small and take profit fast.
👉 Tap $BMT
to open the live chart. NFA
🔥 TRADE WITH LOWER FEES
✅ Get a 20% kickback on your Binance trading fees, for life
👇👇👇
Claim your 20% Binance fee kickback here
━━━━━━━━━━
Is Bubblemaps heading back to the 0.05 spike high? 👇
Follow Crypto Signals and Analysis for daily signals.
#cryptosignals #BMT #EarningsSeason
⚠️ Crypto is volatile: risk only what you can afford to lose.
81
·
--
Bearish
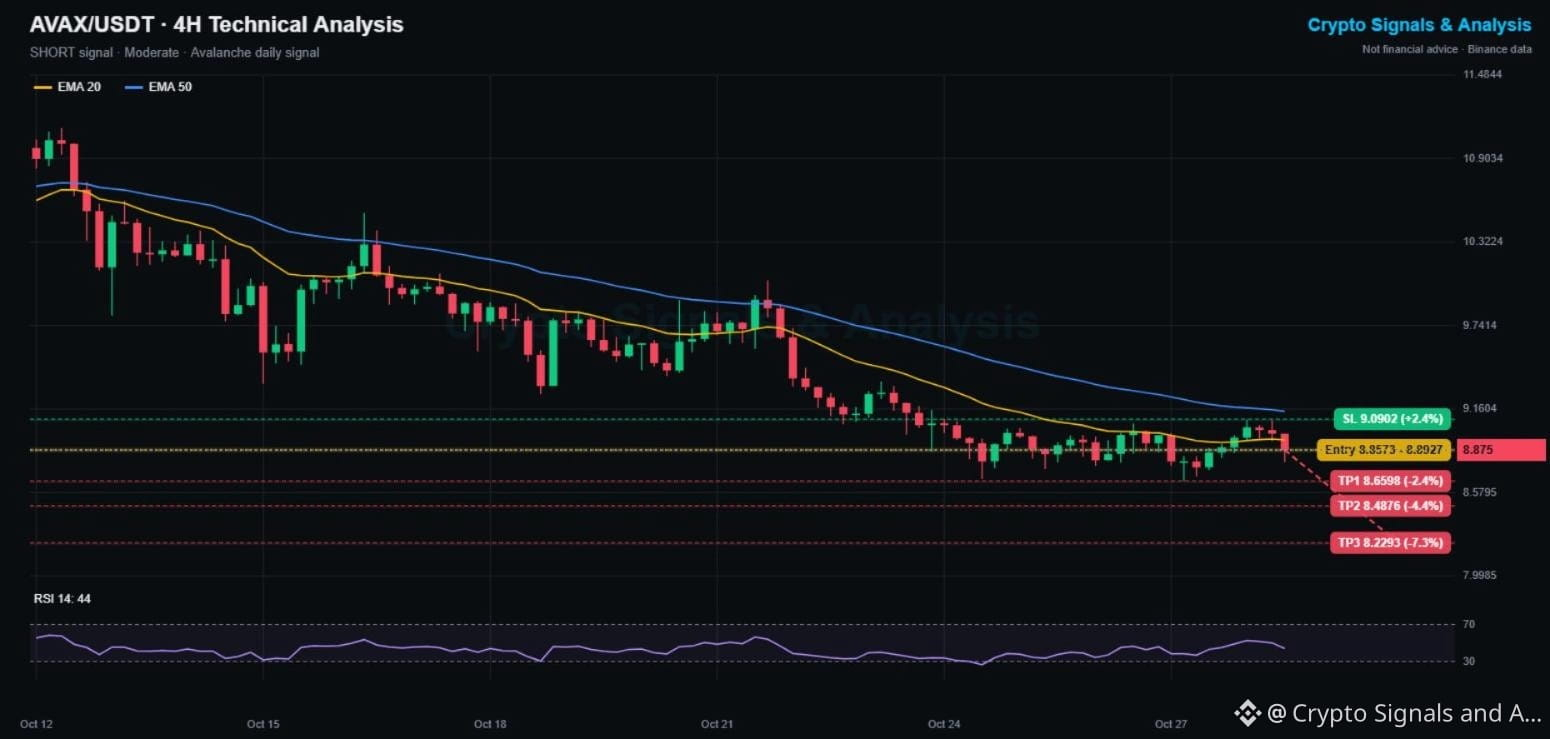
$AVAX Price Prediction Today: Avalanche Crypto Signal & Technical Analysis 📊
🔴 SHORT | Entry 8.857 - 8.893 | TP1 8.660 | SL 9.090
👉 Tap $AVAX to place your trade fast
Avalanche has lost 20% since Oct 12, falling from 11.1 to 8.66. The latest bounce died at 9.09, under the falling 4H EMA50, and the new red candle has pushed AVAX back below its EMA20.
📌 AVALANCHE TRADING SIGNAL (Moderate, 4/5 signals agree)
Entry: 8.857 - 8.893
Take profit 1: 8.660 (-2.4%)
Take profit 2: 8.488 (-4.4%)
Take profit 3: 8.229 (-7.3%)
Stop loss: 9.090 (+2.4%)
📊 AVAX TECHNICAL ANALYSIS (4H CHART)
The structure is a textbook downtrend: lower highs at 10.4, 9.9 and 9.09, and lower lows down to 8.66. Price sits under the EMA20 (8.944) and EMA50 (9.144), and RSI at 44 favors sellers. TP1 sits right at the 8.66 low, and a break there likely brings a fast flush.
🔑 KEY LEVELS
Support: 8.662, then 8.488
Resistance: 8.944 (EMA20), then 9.144 (EMA50)
📈 Bullish scenario: a 4H close above 9.09 and the EMA50 breaks the lower-high pattern and cancels the short.
📉 Bearish scenario: losing 8.66 opens 8.49 and then 8.23.
💡 Bottom line: Avalanche keeps making lower highs. Until that changes, every bounce is a selling opportunity.
👉 Tap $AVAX
to open the live chart. NFA
🔥 TRADE WITH LOWER FEES
✅ Get a 20% kickback on your Binance trading fees, for life
👇👇👇
{spot}(AVAXUSDT)
[Claim your 20% Binance fee kickback here](https://www.binance.com/register?ref=X0NQWZ4N)
━━━━━━━━━━
Where does Avalanche finally find a bottom? Drop your level 👇
Follow Crypto Signals and Analysis for daily signals.
#cryptosignals #AVAX #CanGoogleDefendItsCore
⚠️ Crypto is volatile: risk only what you can afford to lose.
$AVAX Price Prediction Today: Avalanche Crypto Signal & Technical Analysis 📊
🔴 SHORT | Entry 8.857 - 8.893 | TP1 8.660 | SL 9.090
👉 Tap $AVAX to place your trade fast
Avalanche has lost 20% since Oct 12, falling from 11.1 to 8.66. The latest bounce died at 9.09, under the falling 4H EMA50, and the new red candle has pushed AVAX back below its EMA20.
📌 AVALANCHE TRADING SIGNAL (Moderate, 4/5 signals agree)
Entry: 8.857 - 8.893
Take profit 1: 8.660 (-2.4%)
Take profit 2: 8.488 (-4.4%)
Take profit 3: 8.229 (-7.3%)
Stop loss: 9.090 (+2.4%)
📊 AVAX TECHNICAL ANALYSIS (4H CHART)
The structure is a textbook downtrend: lower highs at 10.4, 9.9 and 9.09, and lower lows down to 8.66. Price sits under the EMA20 (8.944) and EMA50 (9.144), and RSI at 44 favors sellers. TP1 sits right at the 8.66 low, and a break there likely brings a fast flush.
🔑 KEY LEVELS
Support: 8.662, then 8.488
Resistance: 8.944 (EMA20), then 9.144 (EMA50)
📈 Bullish scenario: a 4H close above 9.09 and the EMA50 breaks the lower-high pattern and cancels the short.
📉 Bearish scenario: losing 8.66 opens 8.49 and then 8.23.
💡 Bottom line: Avalanche keeps making lower highs. Until that changes, every bounce is a selling opportunity.
👉 Tap $AVAX
to open the live chart. NFA
🔥 TRADE WITH LOWER FEES
✅ Get a 20% kickback on your Binance trading fees, for life
👇👇👇
Claim your 20% Binance fee kickback here
━━━━━━━━━━
Where does Avalanche finally find a bottom? Drop your level 👇
Follow Crypto Signals and Analysis for daily signals.
#cryptosignals #AVAX #CanGoogleDefendItsCore
⚠️ Crypto is volatile: risk only what you can afford to lose.
8
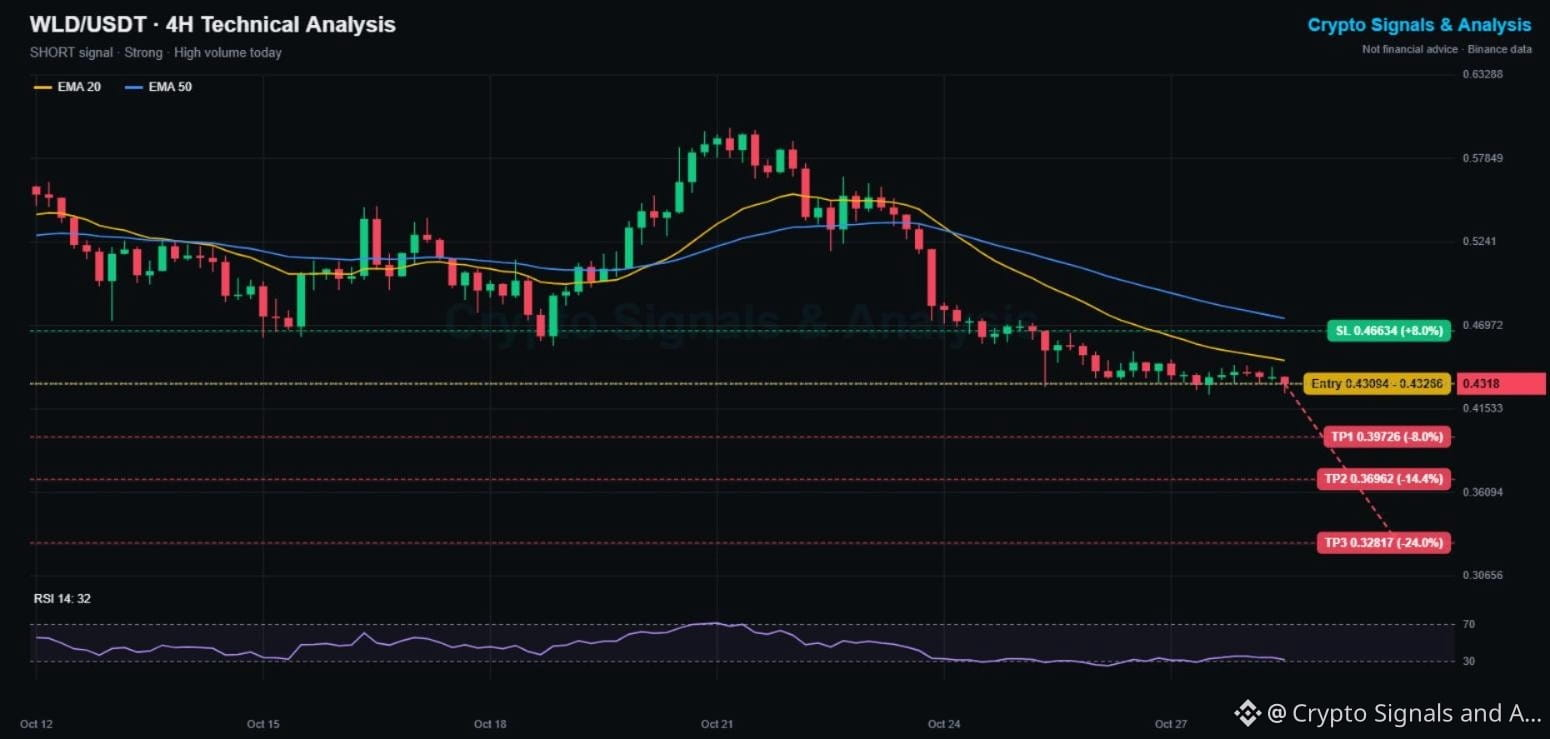
$WLD Price Prediction Today: Worldcoin Crypto Signal & Technical Analysis 📊
🔴 SHORT | Entry 0.4309 - 0.4327 | TP1 0.3973 | SL 0.4663
👉 Tap $WLD to place your trade fast
Worldcoin is one of the most traded coins on Binance today, and also one of the weakest: down 25% in a week, from 0.598 to 0.425. After 4 days of sideways candles, it is starting to slip under the 0.4249 floor.
📌 WORLDCOIN TRADING SIGNAL (Strong, 5/5 signals agree)
Entry: 0.4309 - 0.4327
Take profit 1: 0.3973 (-8%)
Take profit 2: 0.3696 (-14%)
Take profit 3: 0.3282 (-24%)
Stop loss: 0.4663 (+8%)
📊 WLD TECHNICAL ANALYSIS (4H CHART)
The chart shows a bear flag: a sharp drop from 0.55, then a tight, slightly rising range at 0.425 to 0.44. Both EMAs are falling (EMA20 0.4469, EMA50 0.4743) and pressing down on price. One caution: RSI is at 32, close to oversold, so expect short squeezes along the way.
🔑 KEY LEVELS
Support: 0.4249, then 0.397
Resistance: 0.4469 (EMA20), then 0.4662
📈 Bullish scenario: a 4H close above 0.4663 kills the bear flag and cancels the short.
📉 Bearish scenario: a clean break of 0.4249 completes the flag and targets the high 0.30s.
💡 Bottom line: the trend is clearly down, but RSI is low. Waiting for a bounce toward 0.44 gives a better short entry.
👉 Tap $WLD
to open the live chart. NFA
🔥 TRADE WITH LOWER FEES
✅ Get a 20% kickback on your Binance trading fees, for life
👇👇👇
{spot}(WLDUSDT)
[Claim your 20% Binance fee kickback here](https://www.binance.com/register?ref=X0NQWZ4N)
━━━━━━━━━━
Worldcoin: capitulation soon or more pain ahead? 👇
Follow Crypto Signals and Analysis for daily signals.
#cryptosignals #WLD #CanMicrosoftDeliverOnAI
⚠️ Crypto is volatile: risk only what you can afford to lose.
$WLD Price Prediction Today: Worldcoin Crypto Signal & Technical Analysis 📊
🔴 SHORT | Entry 0.4309 - 0.4327 | TP1 0.3973 | SL 0.4663
👉 Tap $WLD to place your trade fast
Worldcoin is one of the most traded coins on Binance today, and also one of the weakest: down 25% in a week, from 0.598 to 0.425. After 4 days of sideways candles, it is starting to slip under the 0.4249 floor.
📌 WORLDCOIN TRADING SIGNAL (Strong, 5/5 signals agree)
Entry: 0.4309 - 0.4327
Take profit 1: 0.3973 (-8%)
Take profit 2: 0.3696 (-14%)
Take profit 3: 0.3282 (-24%)
Stop loss: 0.4663 (+8%)
📊 WLD TECHNICAL ANALYSIS (4H CHART)
The chart shows a bear flag: a sharp drop from 0.55, then a tight, slightly rising range at 0.425 to 0.44. Both EMAs are falling (EMA20 0.4469, EMA50 0.4743) and pressing down on price. One caution: RSI is at 32, close to oversold, so expect short squeezes along the way.
🔑 KEY LEVELS
Support: 0.4249, then 0.397
Resistance: 0.4469 (EMA20), then 0.4662
📈 Bullish scenario: a 4H close above 0.4663 kills the bear flag and cancels the short.
📉 Bearish scenario: a clean break of 0.4249 completes the flag and targets the high 0.30s.
💡 Bottom line: the trend is clearly down, but RSI is low. Waiting for a bounce toward 0.44 gives a better short entry.
👉 Tap $WLD
to open the live chart. NFA
🔥 TRADE WITH LOWER FEES
✅ Get a 20% kickback on your Binance trading fees, for life
👇👇👇
Claim your 20% Binance fee kickback here
━━━━━━━━━━
Worldcoin: capitulation soon or more pain ahead? 👇
Follow Crypto Signals and Analysis for daily signals.
#cryptosignals #WLD #CanMicrosoftDeliverOnAI
⚠️ Crypto is volatile: risk only what you can afford to lose.
69
·
--
Bearish
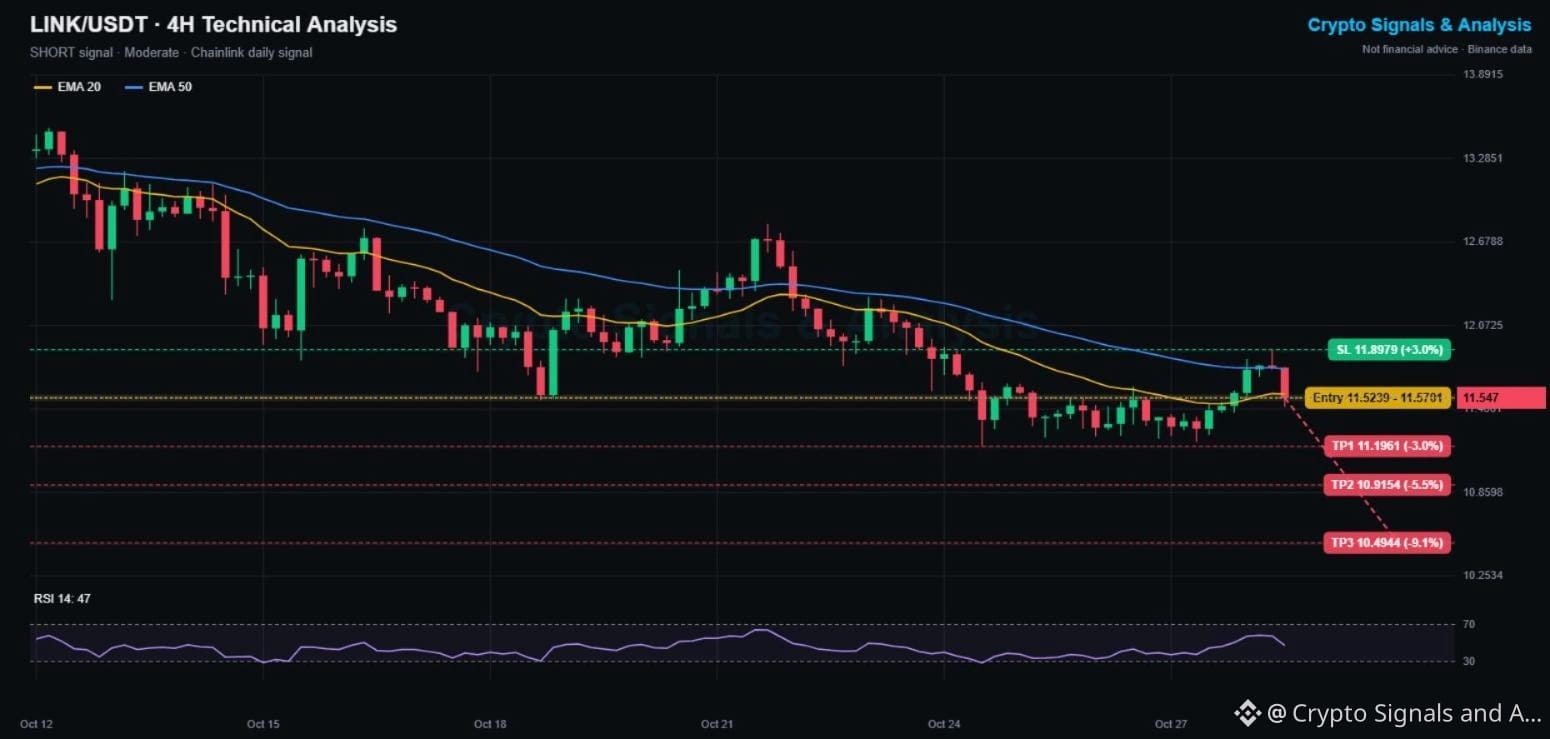
$LINK Price Prediction Today: Chainlink Crypto Signal & Technical Analysis 📊
🔴 SHORT | Entry 11.52 - 11.57 | TP1 11.20 | SL 11.90
👉 Tap $LINK to place your trade fast
Chainlink spiked to 11.89, tagged its falling 4H EMA50, and got rejected for the fourth time since Oct 12. Price is now back under the EMA20, and the 9% weekly loss tells you who is in control.
📌 CHAINLINK TRADING SIGNAL (Moderate, 3/5 signals agree)
Entry: 11.52 - 11.57
Take profit 1: 11.20 (-3.0%)
Take profit 2: 10.92 (-5.5%)
Take profit 3: 10.49 (-9.1%)
Stop loss: 11.90 (+3.0%)
📊 LINK TECHNICAL ANALYSIS (4H CHART)
LINK dropped from 13.5 to 11.2 in two weeks. The EMA50 (11.76) is the line sellers keep defending, and the EMA20 (11.58) has just flipped back into resistance. RSI at 47 is neutral but rolling over. The 11.20 to 11.23 base is the key floor, tested twice already.
🔑 KEY LEVELS
Support: 11.23, then 10.92
Resistance: 11.76 (EMA50), then 11.89
📈 Bullish scenario: a 4H close above 11.90 finally breaks the EMA50 and cancels the short.
📉 Bearish scenario: a break under 11.20 opens a fast move to 10.9 and then 10.5.
💡 Bottom line: four rejections at the same moving average is a pattern. Short the rally, not the floor.
👉 Tap $LINK
to open the live chart. NFA
🔥 TRADE WITH LOWER FEES
✅ Get a 20% kickback on your Binance trading fees, for life
👇👇👇
{spot}(LINKUSDT)
[Claim your 20% Binance fee kickback here](https://www.binance.com/register?ref=X0NQWZ4N)
━━━━━━━━━━
Will Chainlink break the EMA50 on attempt five? 👇
Follow Crypto Signals and Analysis for daily signals.
#cryptosignals #LINK #RobinhoodFalls8.4%AfterItsResults
⚠️ Crypto is volatile: risk only what you can afford to lose.
$LINK Price Prediction Today: Chainlink Crypto Signal & Technical Analysis 📊
🔴 SHORT | Entry 11.52 - 11.57 | TP1 11.20 | SL 11.90
👉 Tap $LINK to place your trade fast
Chainlink spiked to 11.89, tagged its falling 4H EMA50, and got rejected for the fourth time since Oct 12. Price is now back under the EMA20, and the 9% weekly loss tells you who is in control.
📌 CHAINLINK TRADING SIGNAL (Moderate, 3/5 signals agree)
Entry: 11.52 - 11.57
Take profit 1: 11.20 (-3.0%)
Take profit 2: 10.92 (-5.5%)
Take profit 3: 10.49 (-9.1%)
Stop loss: 11.90 (+3.0%)
📊 LINK TECHNICAL ANALYSIS (4H CHART)
LINK dropped from 13.5 to 11.2 in two weeks. The EMA50 (11.76) is the line sellers keep defending, and the EMA20 (11.58) has just flipped back into resistance. RSI at 47 is neutral but rolling over. The 11.20 to 11.23 base is the key floor, tested twice already.
🔑 KEY LEVELS
Support: 11.23, then 10.92
Resistance: 11.76 (EMA50), then 11.89
📈 Bullish scenario: a 4H close above 11.90 finally breaks the EMA50 and cancels the short.
📉 Bearish scenario: a break under 11.20 opens a fast move to 10.9 and then 10.5.
💡 Bottom line: four rejections at the same moving average is a pattern. Short the rally, not the floor.
👉 Tap $LINK
to open the live chart. NFA
🔥 TRADE WITH LOWER FEES
✅ Get a 20% kickback on your Binance trading fees, for life
👇👇👇
Claim your 20% Binance fee kickback here
━━━━━━━━━━
Will Chainlink break the EMA50 on attempt five? 👇
Follow Crypto Signals and Analysis for daily signals.
#cryptosignals #LINK #RobinhoodFalls8.4%AfterItsResults
⚠️ Crypto is volatile: risk only what you can afford to lose.
3
·
--
Bearish
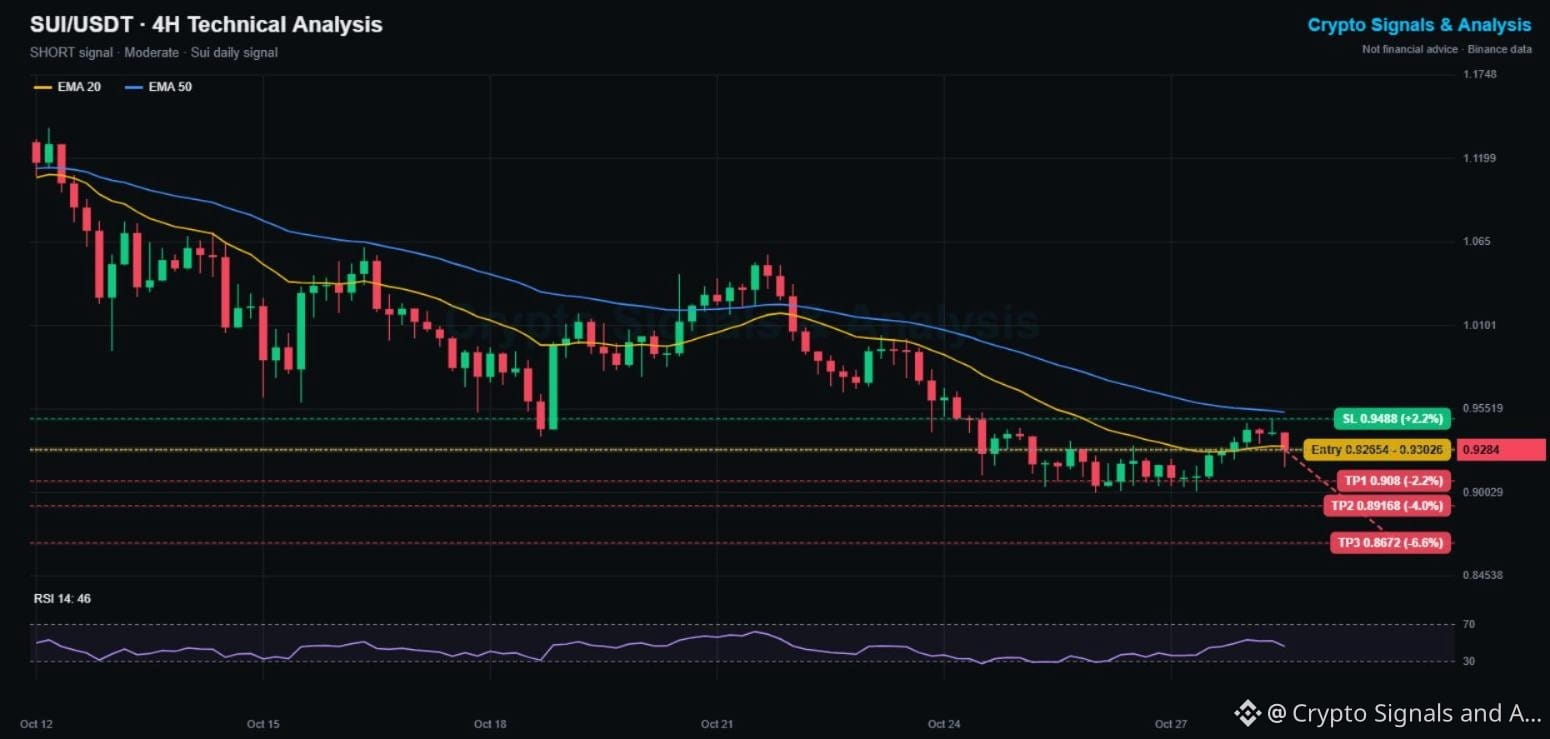
$SUI Price Prediction Today: Sui Crypto Signal & Technical Analysis 📊
🔴 SHORT | Entry 0.9265 - 0.9303 | TP1 0.9080 | SL 0.9488
👉 Tap $SUI to place your trade fast
Sui is down almost 12% this week and trades under 1.00 for the first time in months. Its relief bounce stalled at 0.948, just under the falling 4H EMA50, and a red candle is now pushing it back down.
📌 SUI TRADING SIGNAL (Moderate, 3/5 signals agree)
Entry: 0.9265 - 0.9303
Take profit 1: 0.9080 (-2.2%)
Take profit 2: 0.8917 (-4.0%)
Take profit 3: 0.8672 (-6.6%)
Stop loss: 0.9488 (+2.2%)
📊 SUI TECHNICAL ANALYSIS (4H CHART)
SUI fell from 1.14 to 0.90 since Oct 12 in a clean staircase of lower highs. Price is back under the EMA20 (0.9307), and the EMA50 (0.9530) caps everything above. RSI at 46 is neutral, tilting down. The 0.90 floor has held 3 times, and a 4th test could break it.
🔑 KEY LEVELS
Support: 0.9001, then 0.8672
Resistance: 0.9307 (EMA20), then 0.9484 to 0.9530
📈 Bullish scenario: a 4H close above 0.9488 and the EMA50 would end the downtrend and cancel the short.
📉 Bearish scenario: a break under 0.90 opens TP2 and TP3.
💡 Bottom line: Sui is still in a downtrend until 0.95 breaks. Take profit near the 0.90 floor in case it holds again.
👉 Tap $SUI
to open the live chart. NFA
🔥 TRADE WITH LOWER FEES
✅ Get a 20% kickback on your Binance trading fees, for life
👇👇👇
{spot}(SUIUSDT)
[Claim your 20% Binance fee kickback here](https://www.binance.com/register?ref=X0NQWZ4N)
━━━━━━━━━━
Sui under 0.90 or back above 1.00 first? 👇
Follow Crypto Signals and Analysis for daily signals.
#cryptosignals #SUI #CanGoogleDefendItsCore
⚠️ Crypto is volatile: risk only what you can afford to lose.
$SUI Price Prediction Today: Sui Crypto Signal & Technical Analysis 📊
🔴 SHORT | Entry 0.9265 - 0.9303 | TP1 0.9080 | SL 0.9488
👉 Tap $SUI to place your trade fast
Sui is down almost 12% this week and trades under 1.00 for the first time in months. Its relief bounce stalled at 0.948, just under the falling 4H EMA50, and a red candle is now pushing it back down.
📌 SUI TRADING SIGNAL (Moderate, 3/5 signals agree)
Entry: 0.9265 - 0.9303
Take profit 1: 0.9080 (-2.2%)
Take profit 2: 0.8917 (-4.0%)
Take profit 3: 0.8672 (-6.6%)
Stop loss: 0.9488 (+2.2%)
📊 SUI TECHNICAL ANALYSIS (4H CHART)
SUI fell from 1.14 to 0.90 since Oct 12 in a clean staircase of lower highs. Price is back under the EMA20 (0.9307), and the EMA50 (0.9530) caps everything above. RSI at 46 is neutral, tilting down. The 0.90 floor has held 3 times, and a 4th test could break it.
🔑 KEY LEVELS
Support: 0.9001, then 0.8672
Resistance: 0.9307 (EMA20), then 0.9484 to 0.9530
📈 Bullish scenario: a 4H close above 0.9488 and the EMA50 would end the downtrend and cancel the short.
📉 Bearish scenario: a break under 0.90 opens TP2 and TP3.
💡 Bottom line: Sui is still in a downtrend until 0.95 breaks. Take profit near the 0.90 floor in case it holds again.
👉 Tap $SUI
to open the live chart. NFA
🔥 TRADE WITH LOWER FEES
✅ Get a 20% kickback on your Binance trading fees, for life
👇👇👇
Claim your 20% Binance fee kickback here
━━━━━━━━━━
Sui under 0.90 or back above 1.00 first? 👇
Follow Crypto Signals and Analysis for daily signals.
#cryptosignals #SUI #CanGoogleDefendItsCore
⚠️ Crypto is volatile: risk only what you can afford to lose.
17
·
--
Bullish
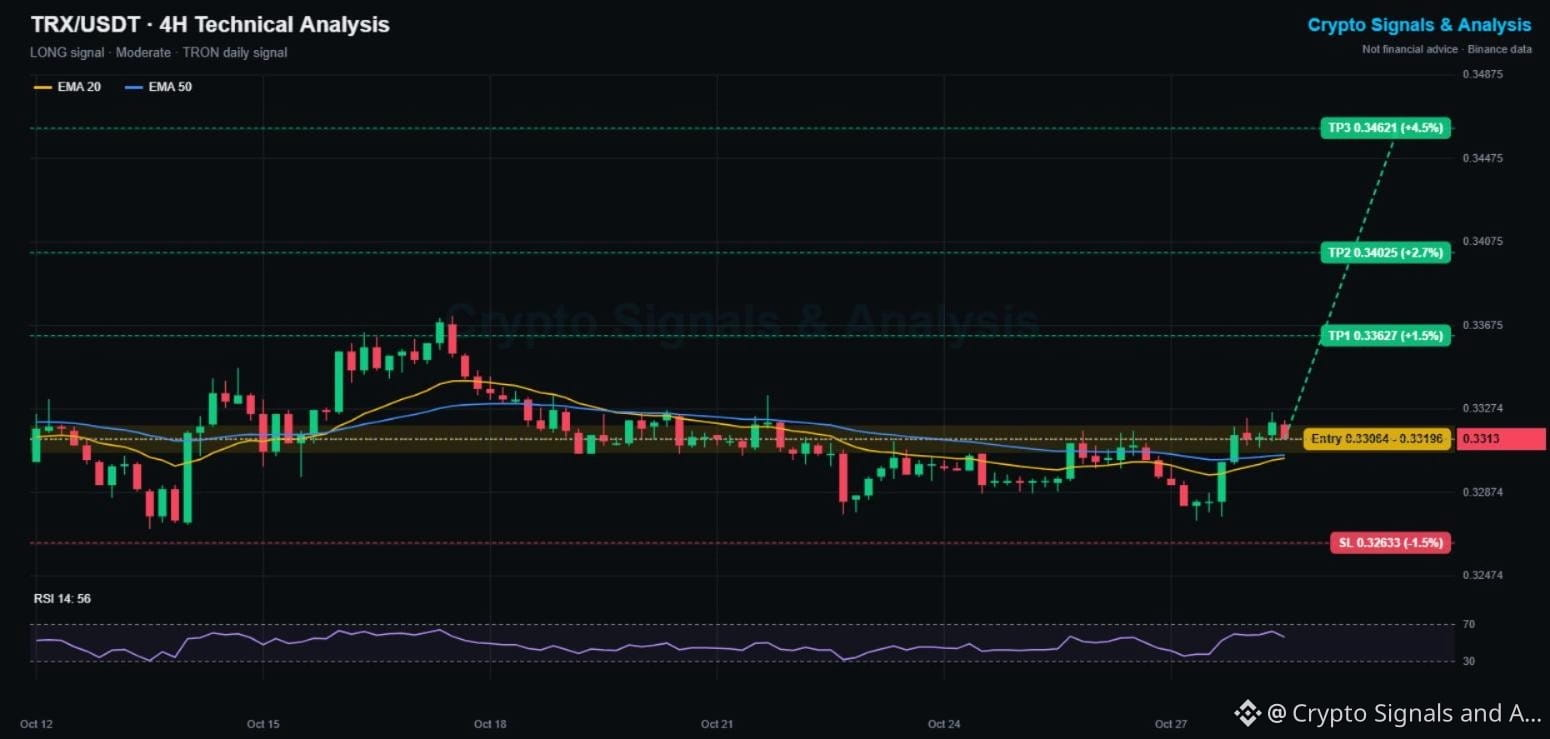
$TRX Price Prediction Today: TRON Crypto Signal & Technical Analysis 📊
🟢 LONG | Entry 0.3306 - 0.3320 | TP1 0.3363 | SL 0.3263
👉 Tap $TRX to place your trade fast
TRON is one of the calmest large caps in the market: flat on the week while Bitcoin lost almost 5%. It just bounced off 0.327 and reclaimed both 4H EMAs. This is a low-volatility setup, so the stop and targets are tight.
📌 TRON TRADING SIGNAL (Moderate, 4/5 signals agree)
Entry: 0.3306 - 0.3320
Take profit 1: 0.3363 (+1.5%)
Take profit 2: 0.3403 (+2.7%)
Take profit 3: 0.3462 (+4.5%)
Stop loss: 0.3263 (-1.5%)
📊 TRX TECHNICAL ANALYSIS (4H CHART)
Price holds above the EMA20 (0.3304) and EMA50 (0.3305), and the EMA20 is curling up. RSI at 56 favors buyers. TRX has spent 10 days in a tight range from 0.327 to 0.3326, and a break above 0.3326 would target the 0.3372 high from Oct 17.
🔑 KEY LEVELS
Support: 0.3304 (EMAs), then 0.3270
Resistance: 0.3326, then 0.3372
📈 Bullish scenario: a 4H close above 0.3326 breaks the range and targets TP2 and TP3.
📉 Bearish scenario: falling back under the EMAs keeps TRON stuck in its range. A close under 0.3263 cancels this signal.
💡 Bottom line: TRON is a slow, steady trade for a choppy market. Small moves, but a clean risk/reward.
👉 Tap $TRX
to open the live chart. NFA
🔥 TRADE WITH LOWER FEES
✅ Get a 20% kickback on your Binance trading fees, for life
👇👇👇
{spot}(TRXUSDT)
[Claim your 20% Binance fee kickback here](https://www.binance.com/register?ref=X0NQWZ4N)
━━━━━━━━━━
Is TRON the safest coin to hold in a red market? 👇
Follow Crypto Signals and Analysis for daily signals.
#cryptosignals #TRX #CanMicrosoftDeliverOnAI
⚠️ Crypto is volatile: risk only what you can afford to lose.
$TRX Price Prediction Today: TRON Crypto Signal & Technical Analysis 📊
🟢 LONG | Entry 0.3306 - 0.3320 | TP1 0.3363 | SL 0.3263
👉 Tap $TRX to place your trade fast
TRON is one of the calmest large caps in the market: flat on the week while Bitcoin lost almost 5%. It just bounced off 0.327 and reclaimed both 4H EMAs. This is a low-volatility setup, so the stop and targets are tight.
📌 TRON TRADING SIGNAL (Moderate, 4/5 signals agree)
Entry: 0.3306 - 0.3320
Take profit 1: 0.3363 (+1.5%)
Take profit 2: 0.3403 (+2.7%)
Take profit 3: 0.3462 (+4.5%)
Stop loss: 0.3263 (-1.5%)
📊 TRX TECHNICAL ANALYSIS (4H CHART)
Price holds above the EMA20 (0.3304) and EMA50 (0.3305), and the EMA20 is curling up. RSI at 56 favors buyers. TRX has spent 10 days in a tight range from 0.327 to 0.3326, and a break above 0.3326 would target the 0.3372 high from Oct 17.
🔑 KEY LEVELS
Support: 0.3304 (EMAs), then 0.3270
Resistance: 0.3326, then 0.3372
📈 Bullish scenario: a 4H close above 0.3326 breaks the range and targets TP2 and TP3.
📉 Bearish scenario: falling back under the EMAs keeps TRON stuck in its range. A close under 0.3263 cancels this signal.
💡 Bottom line: TRON is a slow, steady trade for a choppy market. Small moves, but a clean risk/reward.
👉 Tap $TRX
to open the live chart. NFA
🔥 TRADE WITH LOWER FEES
✅ Get a 20% kickback on your Binance trading fees, for life
👇👇👇
Claim your 20% Binance fee kickback here
━━━━━━━━━━
Is TRON the safest coin to hold in a red market? 👇
Follow Crypto Signals and Analysis for daily signals.
#cryptosignals #TRX #CanMicrosoftDeliverOnAI
⚠️ Crypto is volatile: risk only what you can afford to lose.
·
--
Bullish
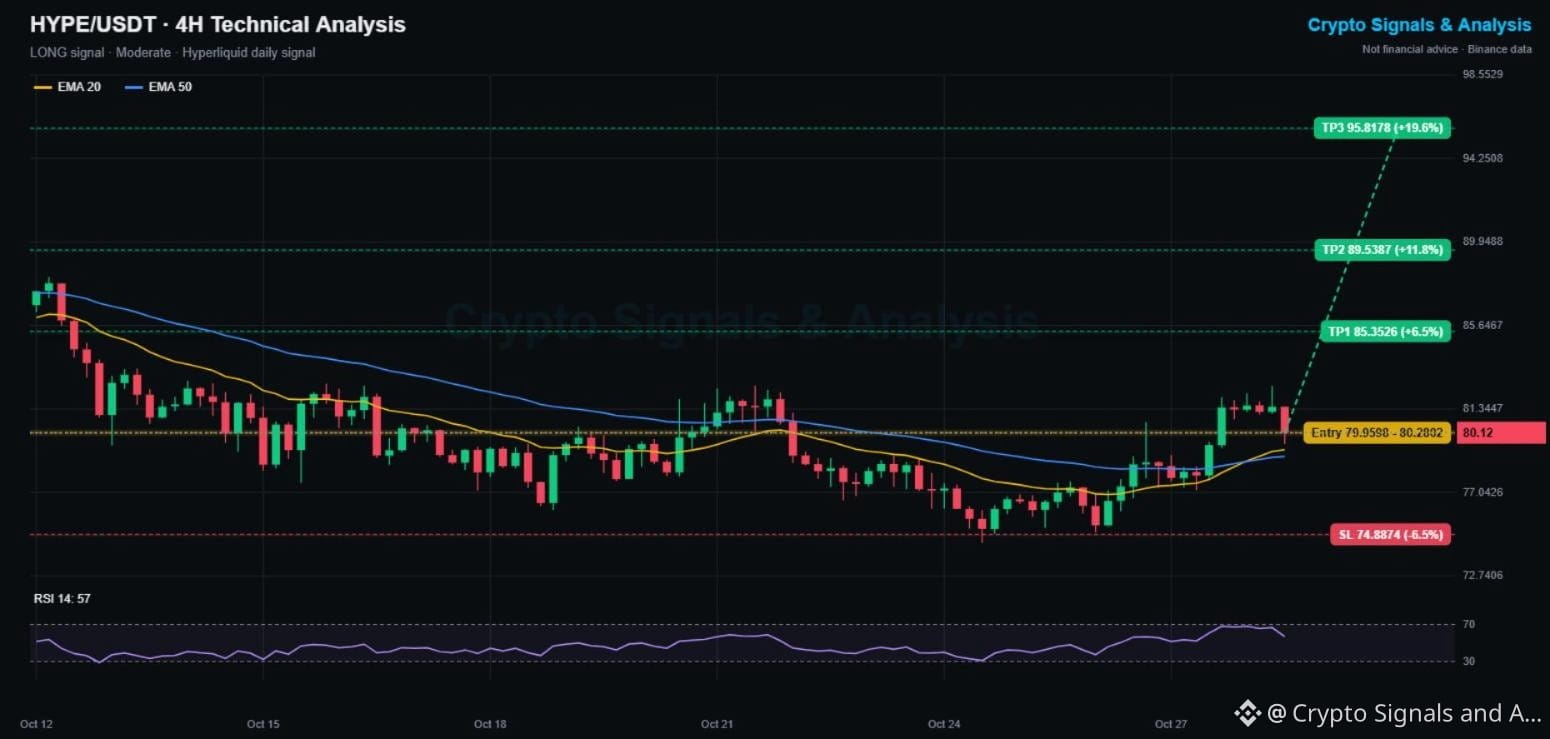
$HYPE Price Prediction Today: Hyperliquid Crypto Signal & Technical Analysis 📊
🟢 LONG | Entry 79.96 - 80.28 | TP1 85.35 | SL 74.89
👉 Tap $HYPE to place your trade fast
Hyperliquid just completed a double bottom at 74.5 to 75.0 and broke above both 4H EMAs. The EMA20 has crossed above the EMA50 for the first time since Oct 12, which is a fresh bullish signal.
📌 HYPERLIQUID TRADING SIGNAL (Moderate, 4/5 signals agree)
Entry: 79.96 - 80.28
Take profit 1: 85.35 (+6.5%)
Take profit 2: 89.54 (+11.8%)
Take profit 3: 95.82 (+19.6%)
Stop loss: 74.89 (-6.5%)
📊 HYPE TECHNICAL ANALYSIS (4H CHART)
Price is holding above the EMA20 (79.25) and EMA50 (78.90). RSI cooled from 68 to 57 after the breakout, which is a healthy pullback, not a reversal. The 82.5 high is the first hurdle. Above it, the 88 zone from Oct 12 is the next big level.
🔑 KEY LEVELS
Support: 79.25 (EMA20), then 75.0
Resistance: 82.5, then 88.1
📈 Bullish scenario: a 4H close above 82.5 confirms the breakout and opens TP1 and TP2.
📉 Bearish scenario: losing the EMA50 (78.9) puts the double bottom back in play. A close under 74.89 cancels this signal.
💡 Bottom line: a double bottom plus a bullish EMA cross is a textbook setup. Let the 79 support prove itself.
👉 Tap $HYPE
to open the live chart. NFA
🔥 TRADE WITH LOWER FEES
✅ Get a 20% kickback on your Binance trading fees, for life
👇👇👇
{spot}(HYPEUSDT)
[Claim your 20% Binance fee kickback here](https://www.binance.com/register?ref=X0NQWZ4N)
━━━━━━━━━━
Hyperliquid back to 90 before the end of the month? 👇
Follow Crypto Signals and Analysis for daily signals.
#cryptosignals #HYPE #EarningsSeason
⚠️ Crypto is volatile: risk only what you can afford to lose.
$HYPE Price Prediction Today: Hyperliquid Crypto Signal & Technical Analysis 📊
🟢 LONG | Entry 79.96 - 80.28 | TP1 85.35 | SL 74.89
👉 Tap $HYPE to place your trade fast
Hyperliquid just completed a double bottom at 74.5 to 75.0 and broke above both 4H EMAs. The EMA20 has crossed above the EMA50 for the first time since Oct 12, which is a fresh bullish signal.
📌 HYPERLIQUID TRADING SIGNAL (Moderate, 4/5 signals agree)
Entry: 79.96 - 80.28
Take profit 1: 85.35 (+6.5%)
Take profit 2: 89.54 (+11.8%)
Take profit 3: 95.82 (+19.6%)
Stop loss: 74.89 (-6.5%)
📊 HYPE TECHNICAL ANALYSIS (4H CHART)
Price is holding above the EMA20 (79.25) and EMA50 (78.90). RSI cooled from 68 to 57 after the breakout, which is a healthy pullback, not a reversal. The 82.5 high is the first hurdle. Above it, the 88 zone from Oct 12 is the next big level.
🔑 KEY LEVELS
Support: 79.25 (EMA20), then 75.0
Resistance: 82.5, then 88.1
📈 Bullish scenario: a 4H close above 82.5 confirms the breakout and opens TP1 and TP2.
📉 Bearish scenario: losing the EMA50 (78.9) puts the double bottom back in play. A close under 74.89 cancels this signal.
💡 Bottom line: a double bottom plus a bullish EMA cross is a textbook setup. Let the 79 support prove itself.
👉 Tap $HYPE
to open the live chart. NFA
🔥 TRADE WITH LOWER FEES
✅ Get a 20% kickback on your Binance trading fees, for life
👇👇👇
Claim your 20% Binance fee kickback here
━━━━━━━━━━
Hyperliquid back to 90 before the end of the month? 👇
Follow Crypto Signals and Analysis for daily signals.
#cryptosignals #HYPE #EarningsSeason
⚠️ Crypto is volatile: risk only what you can afford to lose.
30
·
--
Bearish
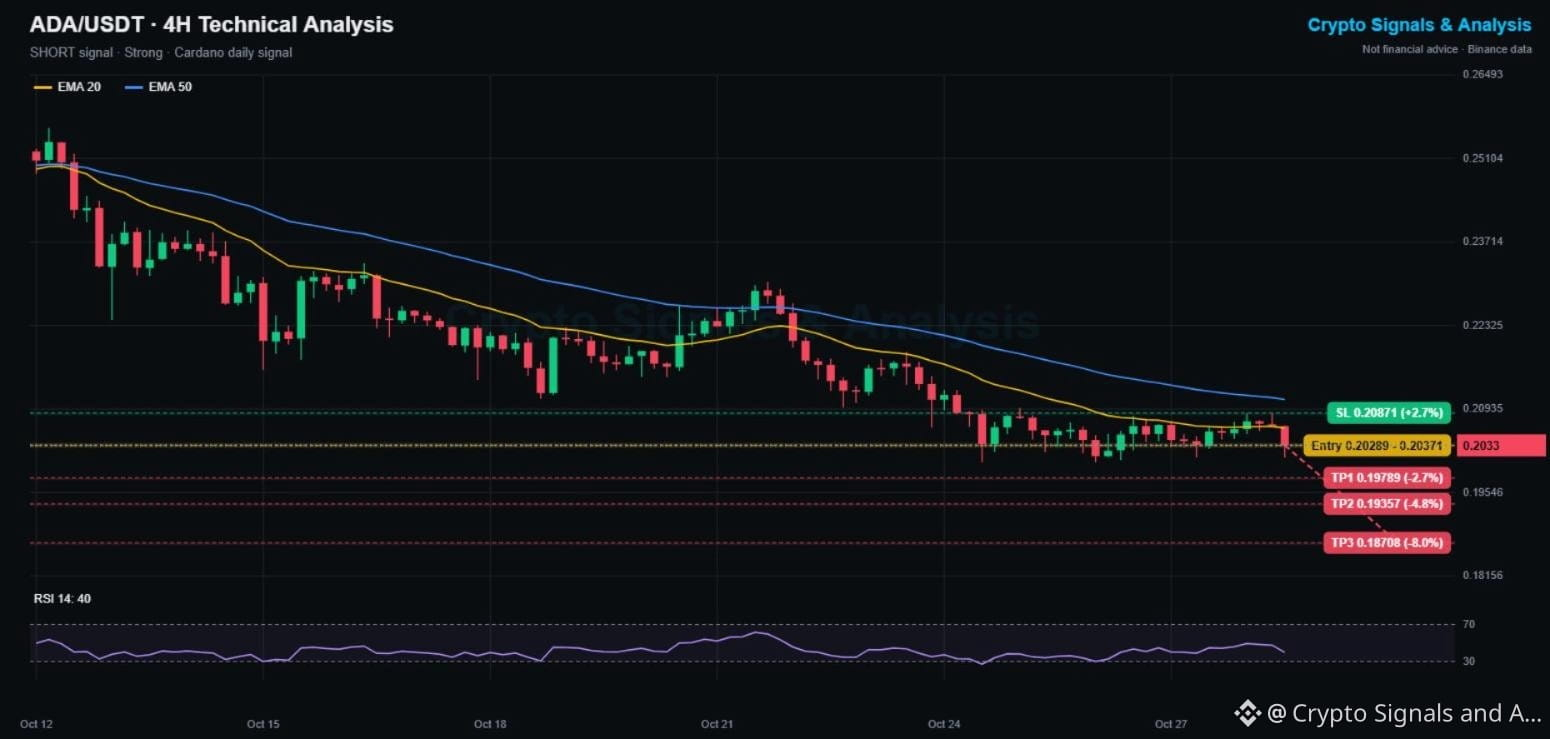
$ADA Price Prediction Today: Cardano Crypto Signal & Technical Analysis 📊
🔴 SHORT | Entry 0.2029 - 0.2037 | TP1 0.1979 | SL 0.2087
👉 Tap $ADA to place your trade fast
Cardano is down 11% this week and has made lower highs for 16 days straight. Its latest bounce stalled under the falling 4H EMA20, and price is now pressing the 0.2005 floor again.
📌 CARDANO TRADING SIGNAL (Strong, 5/5 signals agree)
Entry: 0.2029 - 0.2037
Take profit 1: 0.1979 (-2.7%)
Take profit 2: 0.1936 (-4.8%)
Take profit 3: 0.1871 (-8.0%)
Stop loss: 0.2087 (+2.7%)
📊 ADA TECHNICAL ANALYSIS (4H CHART)
ADA has slid from 0.2561 to 0.2005 since Oct 12. The EMA20 (0.2062) and EMA50 (0.2109) are both falling and sit right above price. RSI at 40 shows sellers in charge. The 0.20 round number is the last line of defense, and a break would likely trigger stop losses below it.
🔑 KEY LEVELS
Support: 0.2005, then 0.1936
Resistance: 0.2062 (EMA20), then 0.2109 (EMA50)
📈 Bullish scenario: a 4H close above 0.2087 breaks the lower-high pattern and cancels the short.
📉 Bearish scenario: a break under 0.20 opens TP2 and TP3 quickly.
💡 Bottom line: all 5 trend signals agree on Cardano. Respect the 0.20 floor until it actually breaks.
👉 Tap $ADA
to open the live chart. NFA
🔥 TRADE WITH LOWER FEES
✅ Get a 20% kickback on your Binance trading fees, for life
👇👇👇
{spot}(ADAUSDT)
[Claim your 20% Binance fee kickback here](https://www.binance.com/register?ref=X0NQWZ4N)
━━━━━━━━━━
Cardano holders: buying the 0.20 dip or waiting for lower? 👇
Follow Crypto Signals and Analysis for daily signals.
#cryptosignals #ADA #CanGoogleDefendItsCore
⚠️ Crypto is volatile: risk only what you can afford to lose.
$ADA Price Prediction Today: Cardano Crypto Signal & Technical Analysis 📊
🔴 SHORT | Entry 0.2029 - 0.2037 | TP1 0.1979 | SL 0.2087
👉 Tap $ADA to place your trade fast
Cardano is down 11% this week and has made lower highs for 16 days straight. Its latest bounce stalled under the falling 4H EMA20, and price is now pressing the 0.2005 floor again.
📌 CARDANO TRADING SIGNAL (Strong, 5/5 signals agree)
Entry: 0.2029 - 0.2037
Take profit 1: 0.1979 (-2.7%)
Take profit 2: 0.1936 (-4.8%)
Take profit 3: 0.1871 (-8.0%)
Stop loss: 0.2087 (+2.7%)
📊 ADA TECHNICAL ANALYSIS (4H CHART)
ADA has slid from 0.2561 to 0.2005 since Oct 12. The EMA20 (0.2062) and EMA50 (0.2109) are both falling and sit right above price. RSI at 40 shows sellers in charge. The 0.20 round number is the last line of defense, and a break would likely trigger stop losses below it.
🔑 KEY LEVELS
Support: 0.2005, then 0.1936
Resistance: 0.2062 (EMA20), then 0.2109 (EMA50)
📈 Bullish scenario: a 4H close above 0.2087 breaks the lower-high pattern and cancels the short.
📉 Bearish scenario: a break under 0.20 opens TP2 and TP3 quickly.
💡 Bottom line: all 5 trend signals agree on Cardano. Respect the 0.20 floor until it actually breaks.
👉 Tap $ADA
to open the live chart. NFA
🔥 TRADE WITH LOWER FEES
✅ Get a 20% kickback on your Binance trading fees, for life
👇👇👇
Claim your 20% Binance fee kickback here
━━━━━━━━━━
Cardano holders: buying the 0.20 dip or waiting for lower? 👇
Follow Crypto Signals and Analysis for daily signals.
#cryptosignals #ADA #CanGoogleDefendItsCore
⚠️ Crypto is volatile: risk only what you can afford to lose.
10
·
--
Bullish
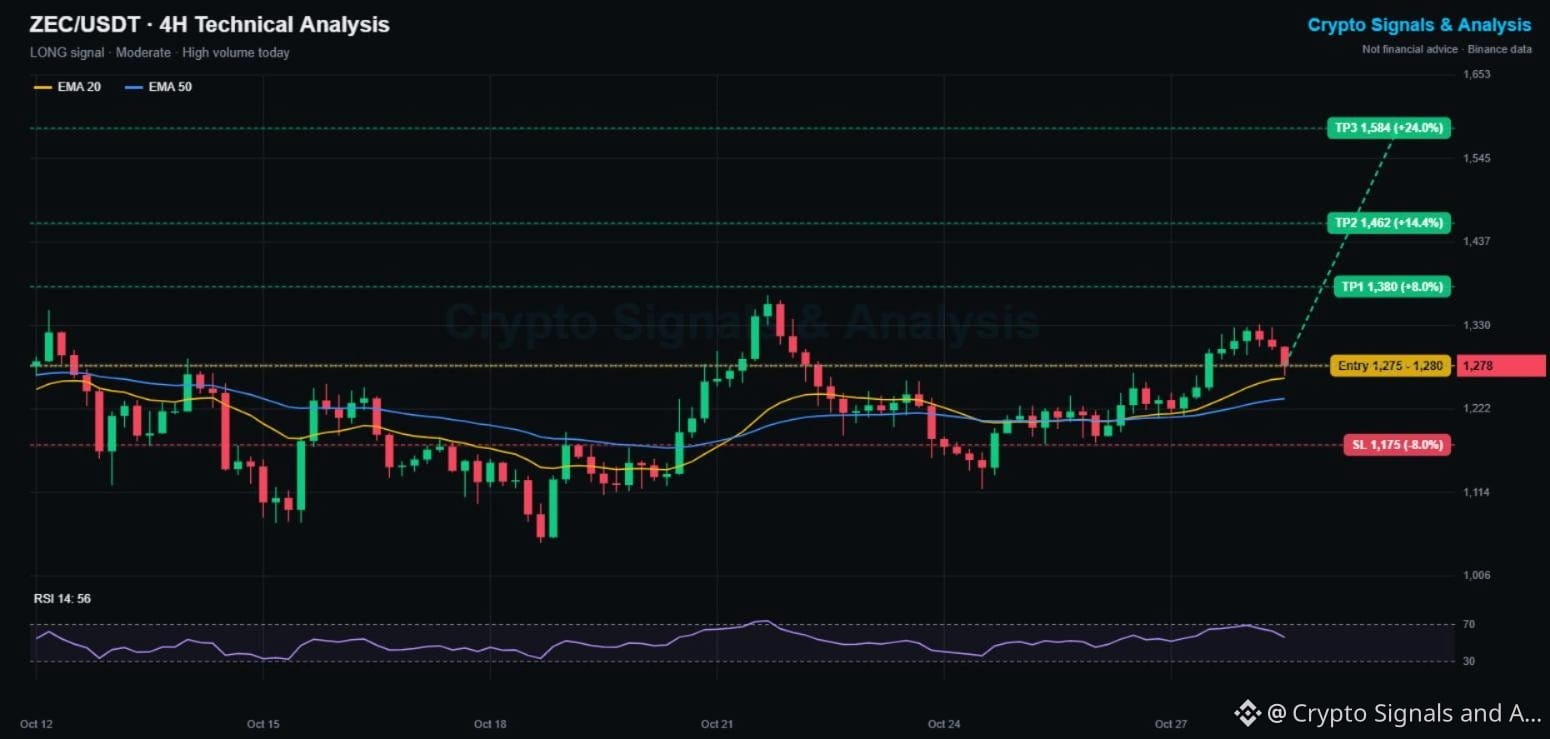
$ZEC Price Prediction Today: Zcash Crypto Signal & Technical Analysis 📊
🟢 LONG | Entry 1,275 - 1,280 | TP1 1,380 | SL 1,175
👉 Tap $ZEC to place your trade fast
Zcash is the third most traded coin on Binance spot today, behind only Bitcoin and Ethereum. The privacy coin has stayed in an uptrend while most of the market fell, and it is now pulling back to its rising 4H EMA20.
📌 ZCASH TRADING SIGNAL (Moderate, 4/5 signals agree)
Entry: 1,275 - 1,280
Take profit 1: 1,380 (+8%)
Take profit 2: 1,462 (+14%)
Take profit 3: 1,584 (+24%)
Stop loss: 1,175 (-8%)
📊 ZEC TECHNICAL ANALYSIS (4H CHART)
ZEC has made higher lows since Oct 19 (1,049, then 1,140, then 1,176). Price holds above the EMA20 (1,261) and EMA50 (1,235), and both EMAs are rising. RSI cooled from 68 to 56, so the overheat is gone. The 1,331 to 1,368 zone is the ceiling to break.
🔑 KEY LEVELS
Support: 1,261 (EMA20), then 1,235 (EMA50)
Resistance: 1,331, then 1,368
📈 Bullish scenario: a 4H close above 1,368 is a fresh breakout toward TP2 and TP3.
📉 Bearish scenario: losing the EMA50 (1,235) sends ZEC back to the 1,176 base. A close under 1,175 cancels this signal.
💡 Bottom line: Zcash is a strong coin in a weak market. Buying pullbacks to the EMAs has worked all month.
👉 Tap $ZEC
to open the live chart. NFA
🔥 TRADE WITH LOWER FEES
✅ Get a 20% kickback on your Binance trading fees, for life
👇👇👇
{spot}(ZECUSDT)
[Claim your 20% Binance fee kickback here](https://www.binance.com/register?ref=X0NQWZ4N)
━━━━━━━━━━
Privacy coins: the next big narrative or just a short-term pump? 👇
Follow Crypto Signals and Analysis for daily signals.
#cryptosignals #ZEC #CanMicrosoftDeliverOnAI
⚠️ Crypto is volatile: risk only what you can afford to lose.
$ZEC Price Prediction Today: Zcash Crypto Signal & Technical Analysis 📊
🟢 LONG | Entry 1,275 - 1,280 | TP1 1,380 | SL 1,175
👉 Tap $ZEC to place your trade fast
Zcash is the third most traded coin on Binance spot today, behind only Bitcoin and Ethereum. The privacy coin has stayed in an uptrend while most of the market fell, and it is now pulling back to its rising 4H EMA20.
📌 ZCASH TRADING SIGNAL (Moderate, 4/5 signals agree)
Entry: 1,275 - 1,280
Take profit 1: 1,380 (+8%)
Take profit 2: 1,462 (+14%)
Take profit 3: 1,584 (+24%)
Stop loss: 1,175 (-8%)
📊 ZEC TECHNICAL ANALYSIS (4H CHART)
ZEC has made higher lows since Oct 19 (1,049, then 1,140, then 1,176). Price holds above the EMA20 (1,261) and EMA50 (1,235), and both EMAs are rising. RSI cooled from 68 to 56, so the overheat is gone. The 1,331 to 1,368 zone is the ceiling to break.
🔑 KEY LEVELS
Support: 1,261 (EMA20), then 1,235 (EMA50)
Resistance: 1,331, then 1,368
📈 Bullish scenario: a 4H close above 1,368 is a fresh breakout toward TP2 and TP3.
📉 Bearish scenario: losing the EMA50 (1,235) sends ZEC back to the 1,176 base. A close under 1,175 cancels this signal.
💡 Bottom line: Zcash is a strong coin in a weak market. Buying pullbacks to the EMAs has worked all month.
👉 Tap $ZEC
to open the live chart. NFA
🔥 TRADE WITH LOWER FEES
✅ Get a 20% kickback on your Binance trading fees, for life
👇👇👇
Claim your 20% Binance fee kickback here
━━━━━━━━━━
Privacy coins: the next big narrative or just a short-term pump? 👇
Follow Crypto Signals and Analysis for daily signals.
#cryptosignals #ZEC #CanMicrosoftDeliverOnAI
⚠️ Crypto is volatile: risk only what you can afford to lose.
94
·
--
Bullish
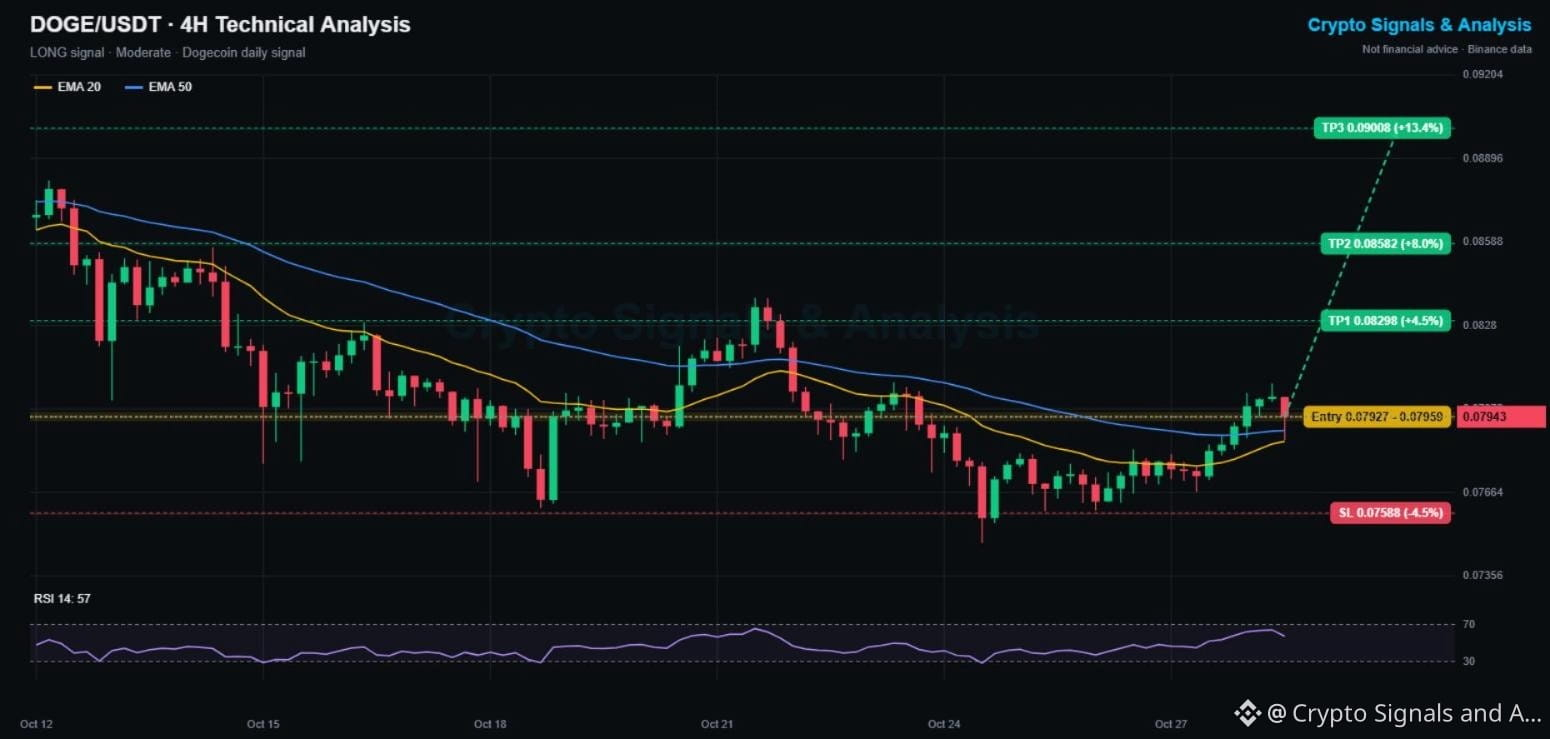
$DOGE Price Prediction Today: Dogecoin Crypto Signal & Technical Analysis 📊
🟢 LONG | Entry 0.07927 - 0.07959 | TP1 0.08298 | SL 0.07588
👉 Tap $DOGE to place your trade fast
Meme coins are waking up today (PEPE +10%), and Dogecoin is following. It broke above both 4H EMAs for the first time in a week, and the dip to the EMAs was bought instantly.
📌 DOGECOIN TRADING SIGNAL (Moderate, 4/5 signals agree)
Entry: 0.07927 - 0.07959
Take profit 1: 0.08298 (+4.5%)
Take profit 2: 0.08582 (+8.0%)
Take profit 3: 0.09008 (+13.4%)
Stop loss: 0.07588 (-4.5%)
📊 DOGE TECHNICAL ANALYSIS (4H CHART)
DOGE has made a higher low at 0.0760 after the 0.0748 bottom and has now reclaimed the EMA20 (0.0785) and EMA50 (0.0789). The EMA20 is turning up toward a bullish cross. RSI at 57 confirms that buyers are back in control. The last big rejection came at 0.0828 on Oct 21, which is right next to TP1.
🔑 KEY LEVELS
Support: 0.0789 (EMA50), then 0.0760
Resistance: 0.0807, then 0.0828
📈 Bullish scenario: a 4H close above 0.0807 clears the way to 0.083 and then TP2.
📉 Bearish scenario: a close back under the EMA50 turns this into a fakeout. A close under 0.07588 cancels this signal.
💡 Bottom line: Dogecoin finally has trend and momentum on the same side. Take profit into the 0.083 resistance.
👉 Tap $DOGE
to open the live chart. NFA
🔥 TRADE WITH LOWER FEES
✅ Get a 20% kickback on your Binance trading fees, for life
👇👇👇
{spot}(DOGEUSDT)
[Claim your 20% Binance fee kickback here](https://www.binance.com/register?ref=X0NQWZ4N)
━━━━━━━━━━
Dogecoin to 0.09 this week: realistic or hopium? 👇
Follow Crypto Signals and Analysis for daily signals.
#cryptosignals #DOGE #EarningsSeason
⚠️ Crypto is volatile: risk only what you can afford to lose.
$DOGE Price Prediction Today: Dogecoin Crypto Signal & Technical Analysis 📊
🟢 LONG | Entry 0.07927 - 0.07959 | TP1 0.08298 | SL 0.07588
👉 Tap $DOGE to place your trade fast
Meme coins are waking up today (PEPE +10%), and Dogecoin is following. It broke above both 4H EMAs for the first time in a week, and the dip to the EMAs was bought instantly.
📌 DOGECOIN TRADING SIGNAL (Moderate, 4/5 signals agree)
Entry: 0.07927 - 0.07959
Take profit 1: 0.08298 (+4.5%)
Take profit 2: 0.08582 (+8.0%)
Take profit 3: 0.09008 (+13.4%)
Stop loss: 0.07588 (-4.5%)
📊 DOGE TECHNICAL ANALYSIS (4H CHART)
DOGE has made a higher low at 0.0760 after the 0.0748 bottom and has now reclaimed the EMA20 (0.0785) and EMA50 (0.0789). The EMA20 is turning up toward a bullish cross. RSI at 57 confirms that buyers are back in control. The last big rejection came at 0.0828 on Oct 21, which is right next to TP1.
🔑 KEY LEVELS
Support: 0.0789 (EMA50), then 0.0760
Resistance: 0.0807, then 0.0828
📈 Bullish scenario: a 4H close above 0.0807 clears the way to 0.083 and then TP2.
📉 Bearish scenario: a close back under the EMA50 turns this into a fakeout. A close under 0.07588 cancels this signal.
💡 Bottom line: Dogecoin finally has trend and momentum on the same side. Take profit into the 0.083 resistance.
👉 Tap $DOGE
to open the live chart. NFA
🔥 TRADE WITH LOWER FEES
✅ Get a 20% kickback on your Binance trading fees, for life
👇👇👇
Claim your 20% Binance fee kickback here
━━━━━━━━━━
Dogecoin to 0.09 this week: realistic or hopium? 👇
Follow Crypto Signals and Analysis for daily signals.
#cryptosignals #DOGE #EarningsSeason
⚠️ Crypto is volatile: risk only what you can afford to lose.
12
Log in to explore more content
Join global crypto users on Binance Square
⚡️ Get latest and useful information about crypto.
💬 Trusted by the world’s largest crypto exchange.
👍 Discover real insights from verified creators.
Email / Phone number