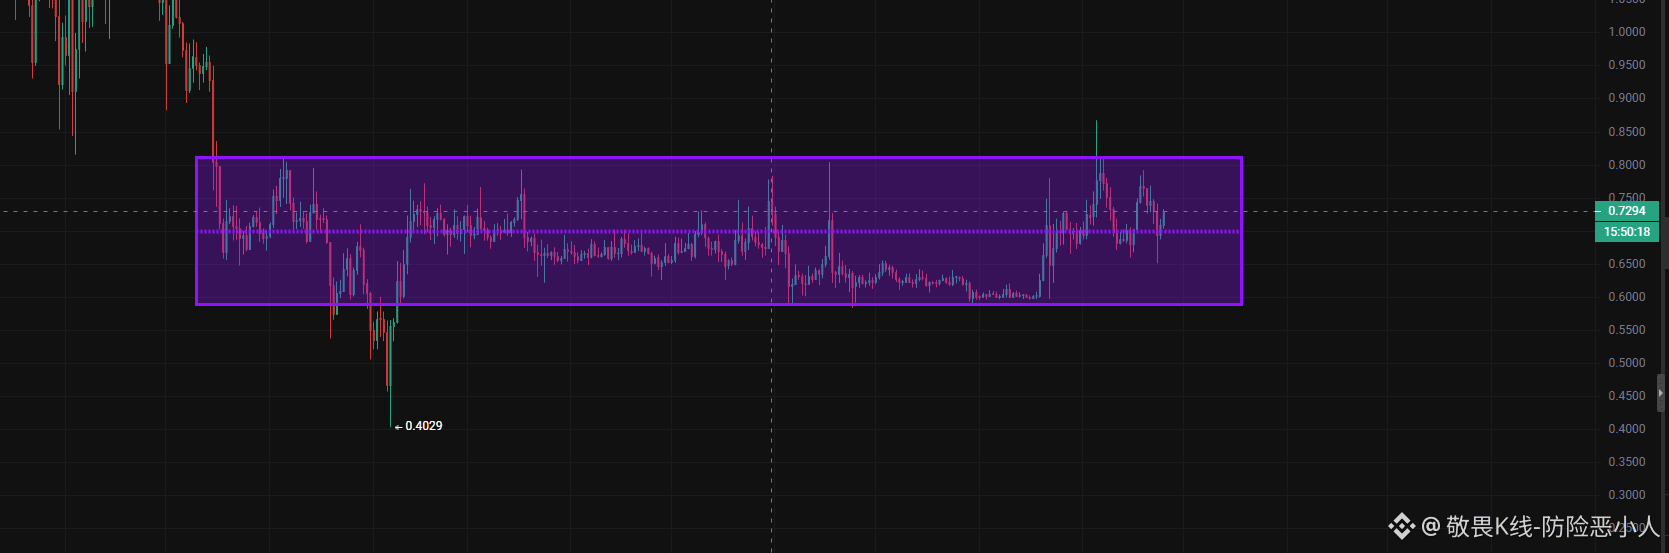
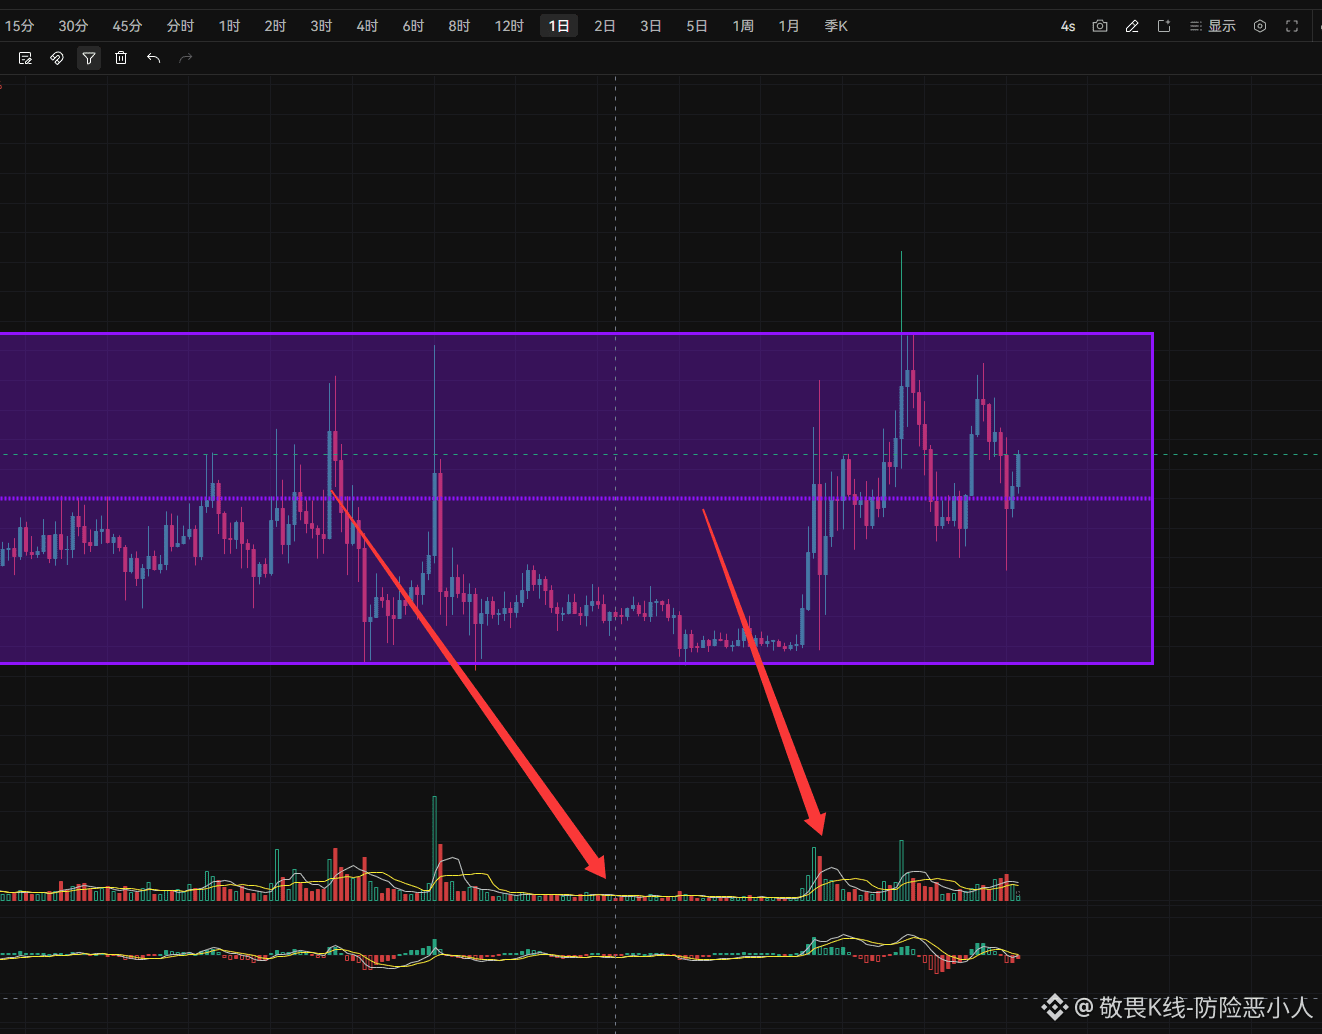
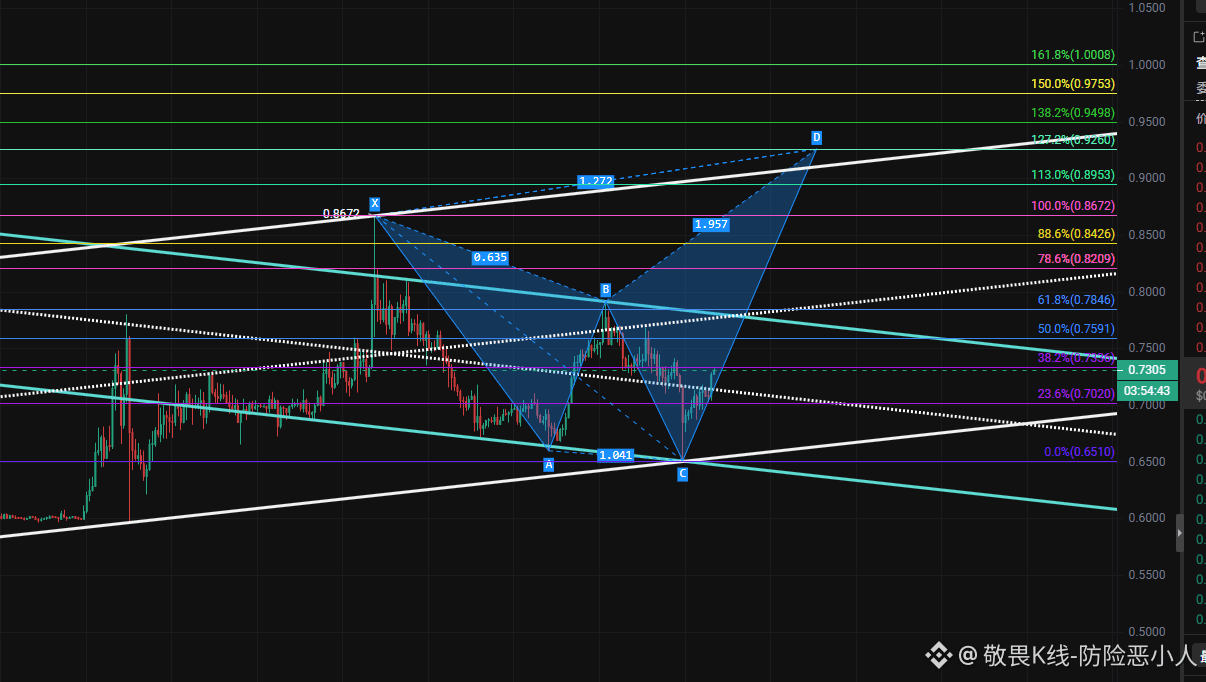
$ASTER A bottom box that has lasted for ten months, with extreme volume contraction and exhausted selling pressure. In the past two months, trading volume has started to show unusual surges; the main funds have entered the market in batches to build positions. After funds surged and broke above the upper rail of the range, they didn’t immediately push the price higher—instead, a round of large volatility followed. Wide-range volatility is the main fund’s method of shakeout: by driving the price up and down repeatedly, it shakes out short-term profit-takers and any holders who are not firmly committed. During the consolidation, trading volume gradually declines, floating supply keeps shrinking, and then the price pulls back to the middle rail of the box to gather strength. Long-term bottom extreme volume contraction forming a base → Volume activity surges in the past two months to build positions → Breakout with volume above the range → Big-volatile shakeout after the breakout → Low-volume pullback to the middle rail to gather strength. 📈 Daily chart: a long-term bottom range. After piercing above the upper rail, the price pulls back to the middle rail and uses it to consolidate for a washout. Switch to the 4-hour timeframe: the standard Bat harmonic pattern is currently in progress. Price is oscillating upward along an ascending channel, gradually approaching the D target zone. Point D is precisely the channel upper-rail resonance resistance.
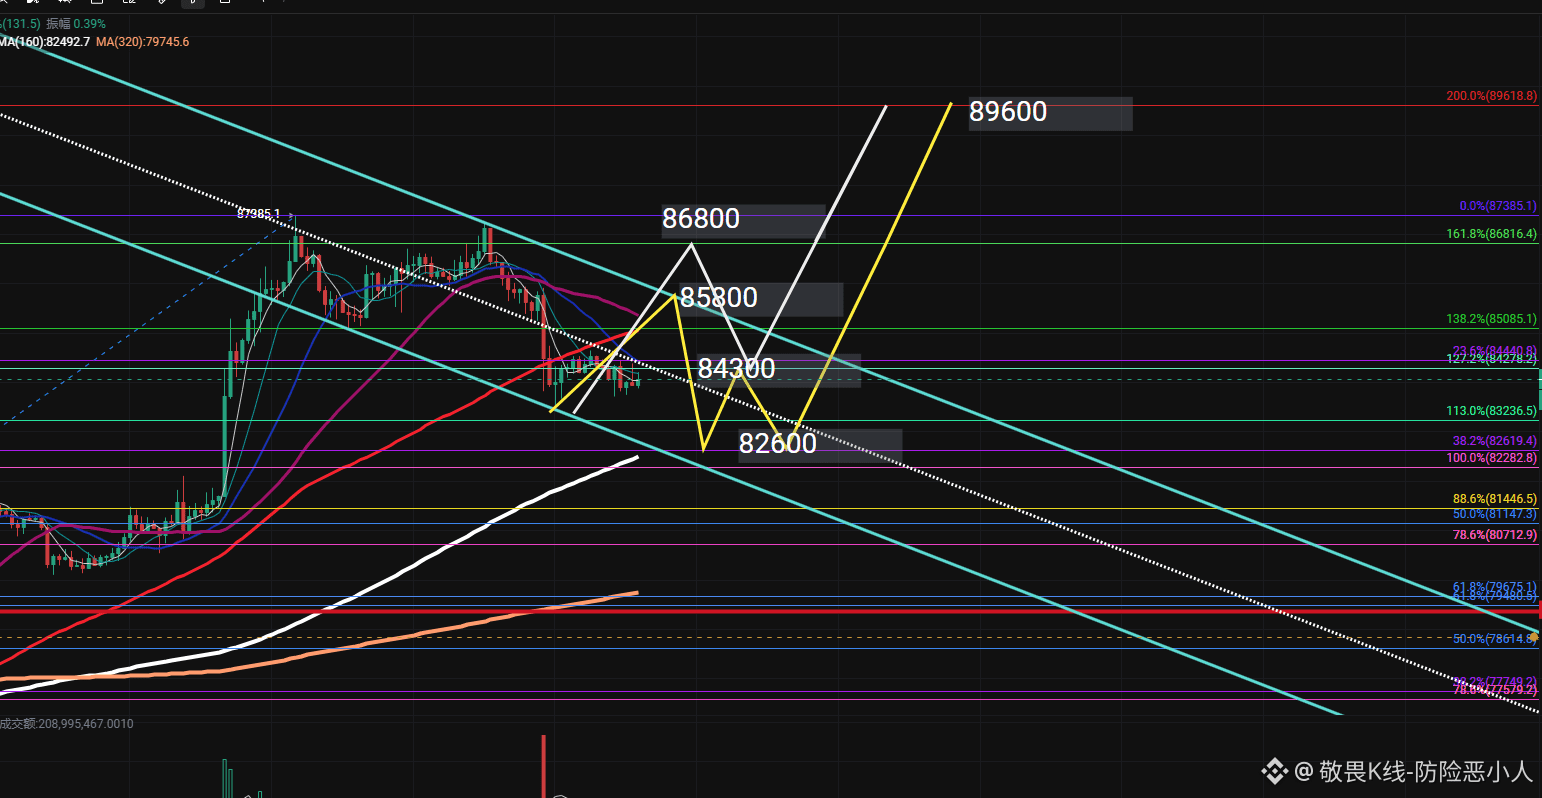
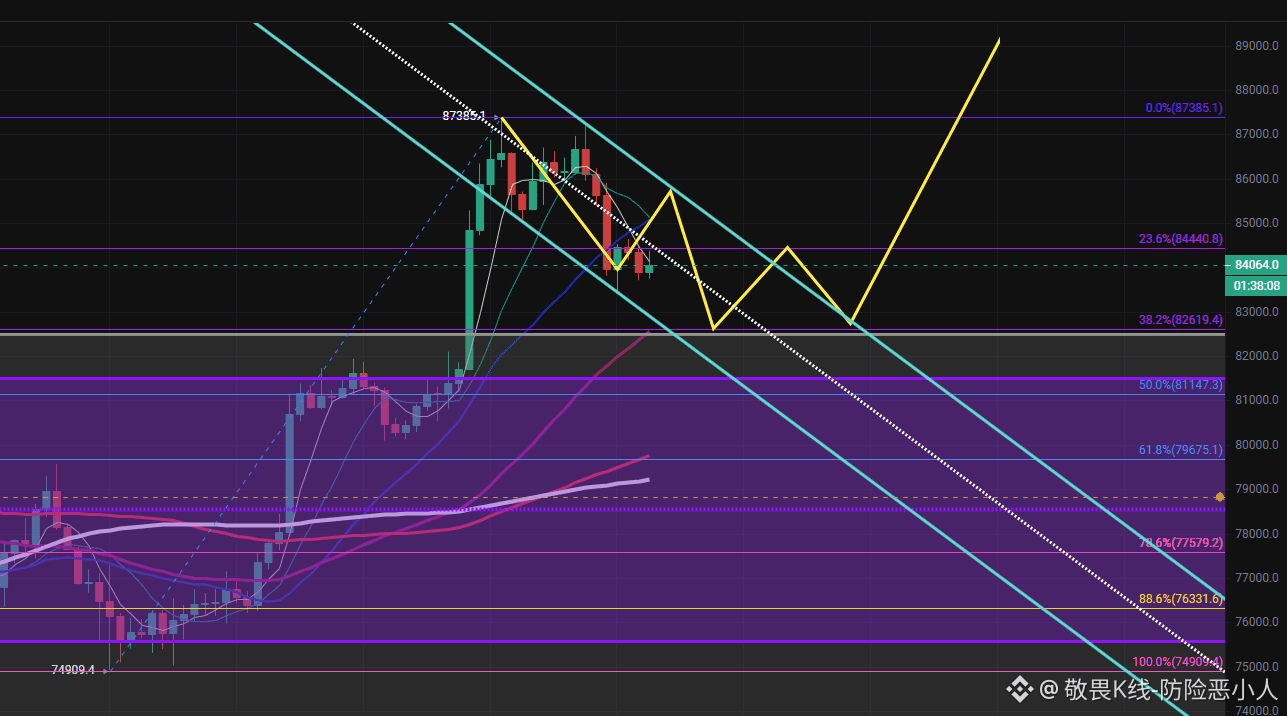
4-hour cycle, the classic bull flag pattern is taking shape. Bull markets often see sharp sell-offs; this round of rapid pullback hasn’t broken the trend. This isn’t the market topping—it's a flag-side shakeout during the bull market’s advance. Price is trapped in a descending channel, consolidating to work through floating supply while waiting for a directional choice. Once the upper flag line is broken to the upside on increased volume, this correction will be over and the bulls will resume their upward move. #BTC
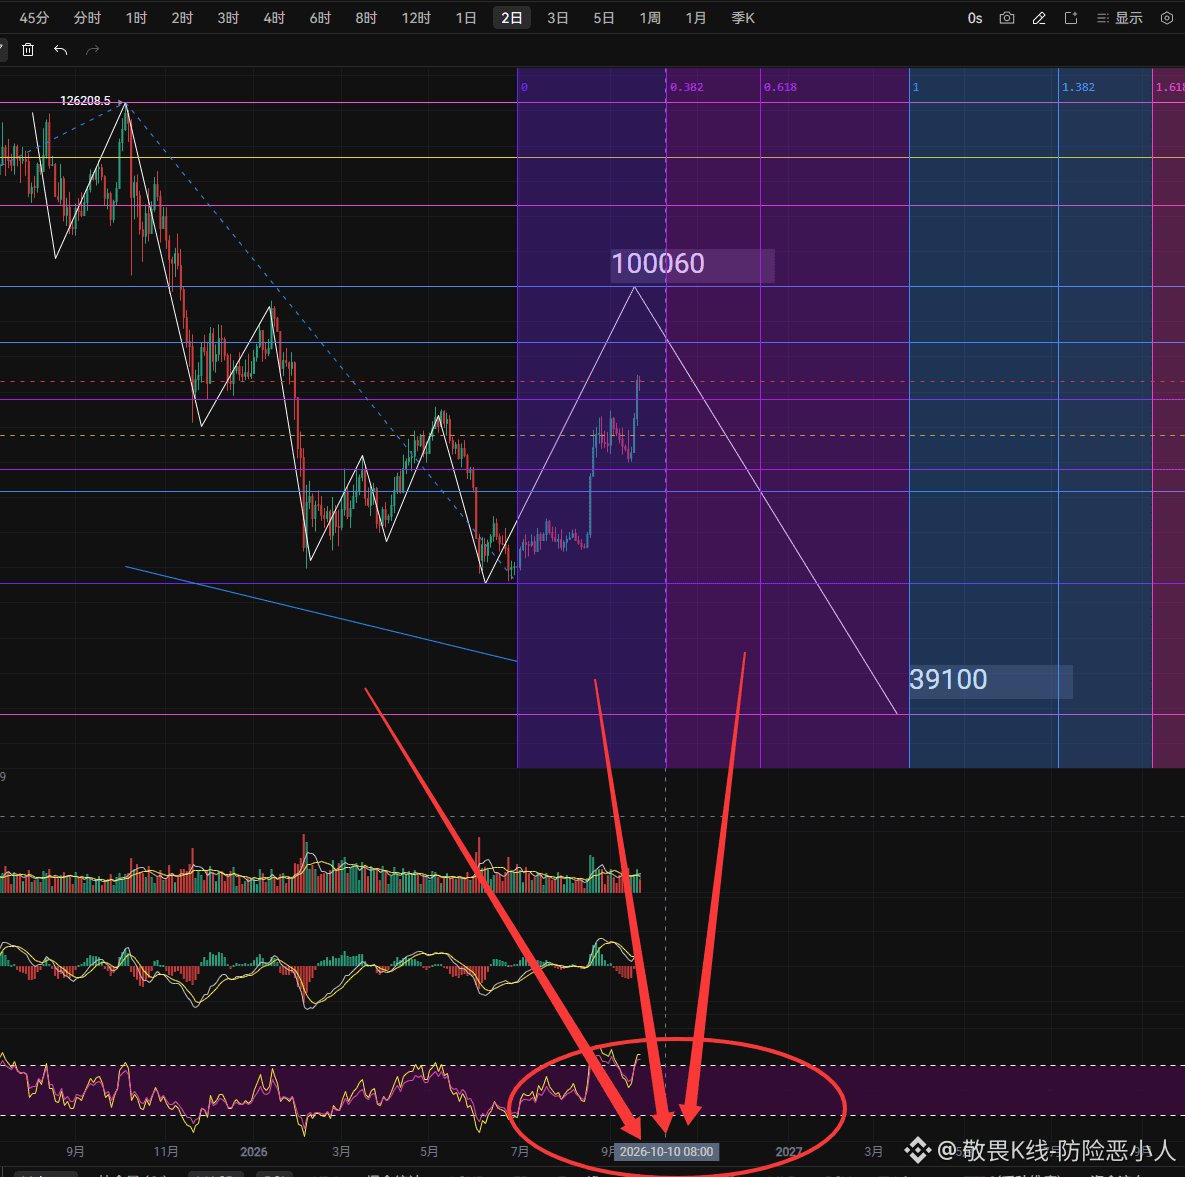
Dissecting the long-term timeline reveals a spatiotemporal resonance point surfacing. Conclusion from the Fibonacci time-cycle projection: Bitcoin will touch the $100,000 mark on October 10. History always rhymes—will this round of plot be replayed again?? Are black swan events on the way?!! Most people can only passively endure market fluctuations, while the rhythm of the cycle has already been forecast in advance!#BTC
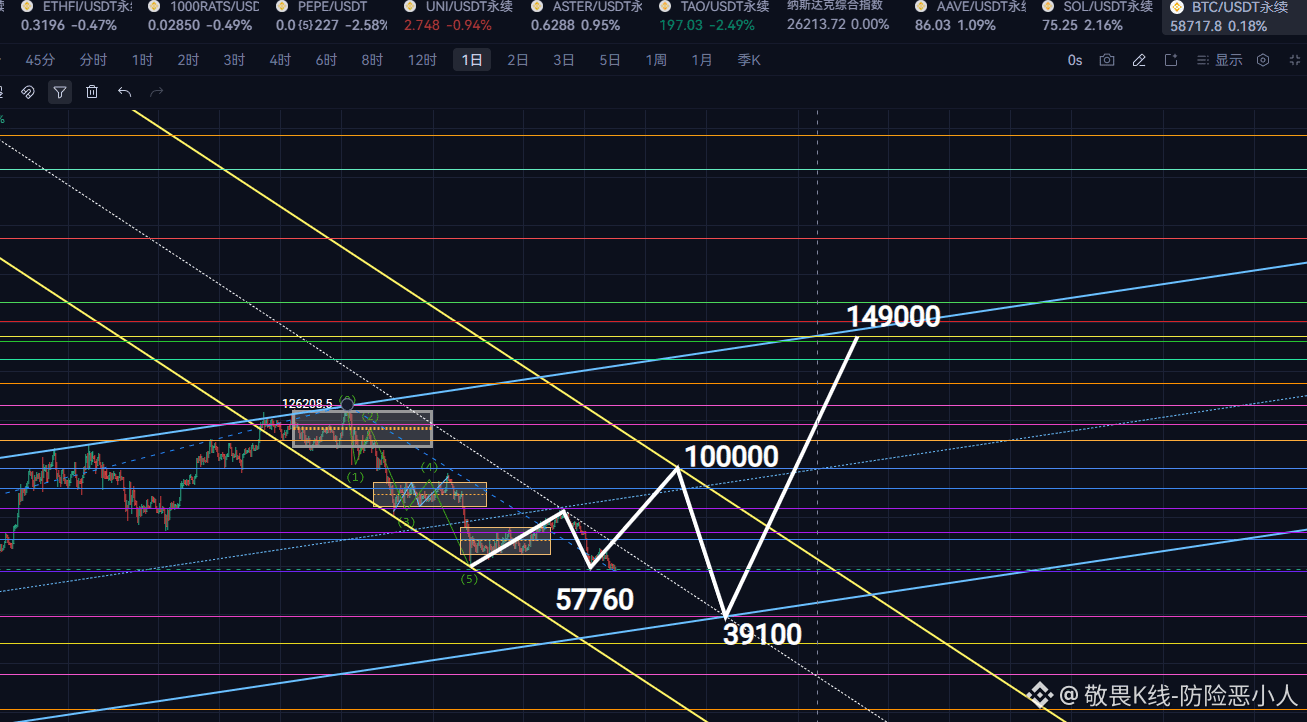
The script for this current long-cycle period was written as early as June. We accurately predicted the bottom would land precisely, and the market unfolded without deviating from the planned path. We’re now approaching the preset take-profit level. The market’s ups and downs are just part of the predetermined storyline—most people are still struggling and fighting over positions during the trading session, while the direction of the trend was already seen through in advance. Wait for the harvest #BTC #ETH
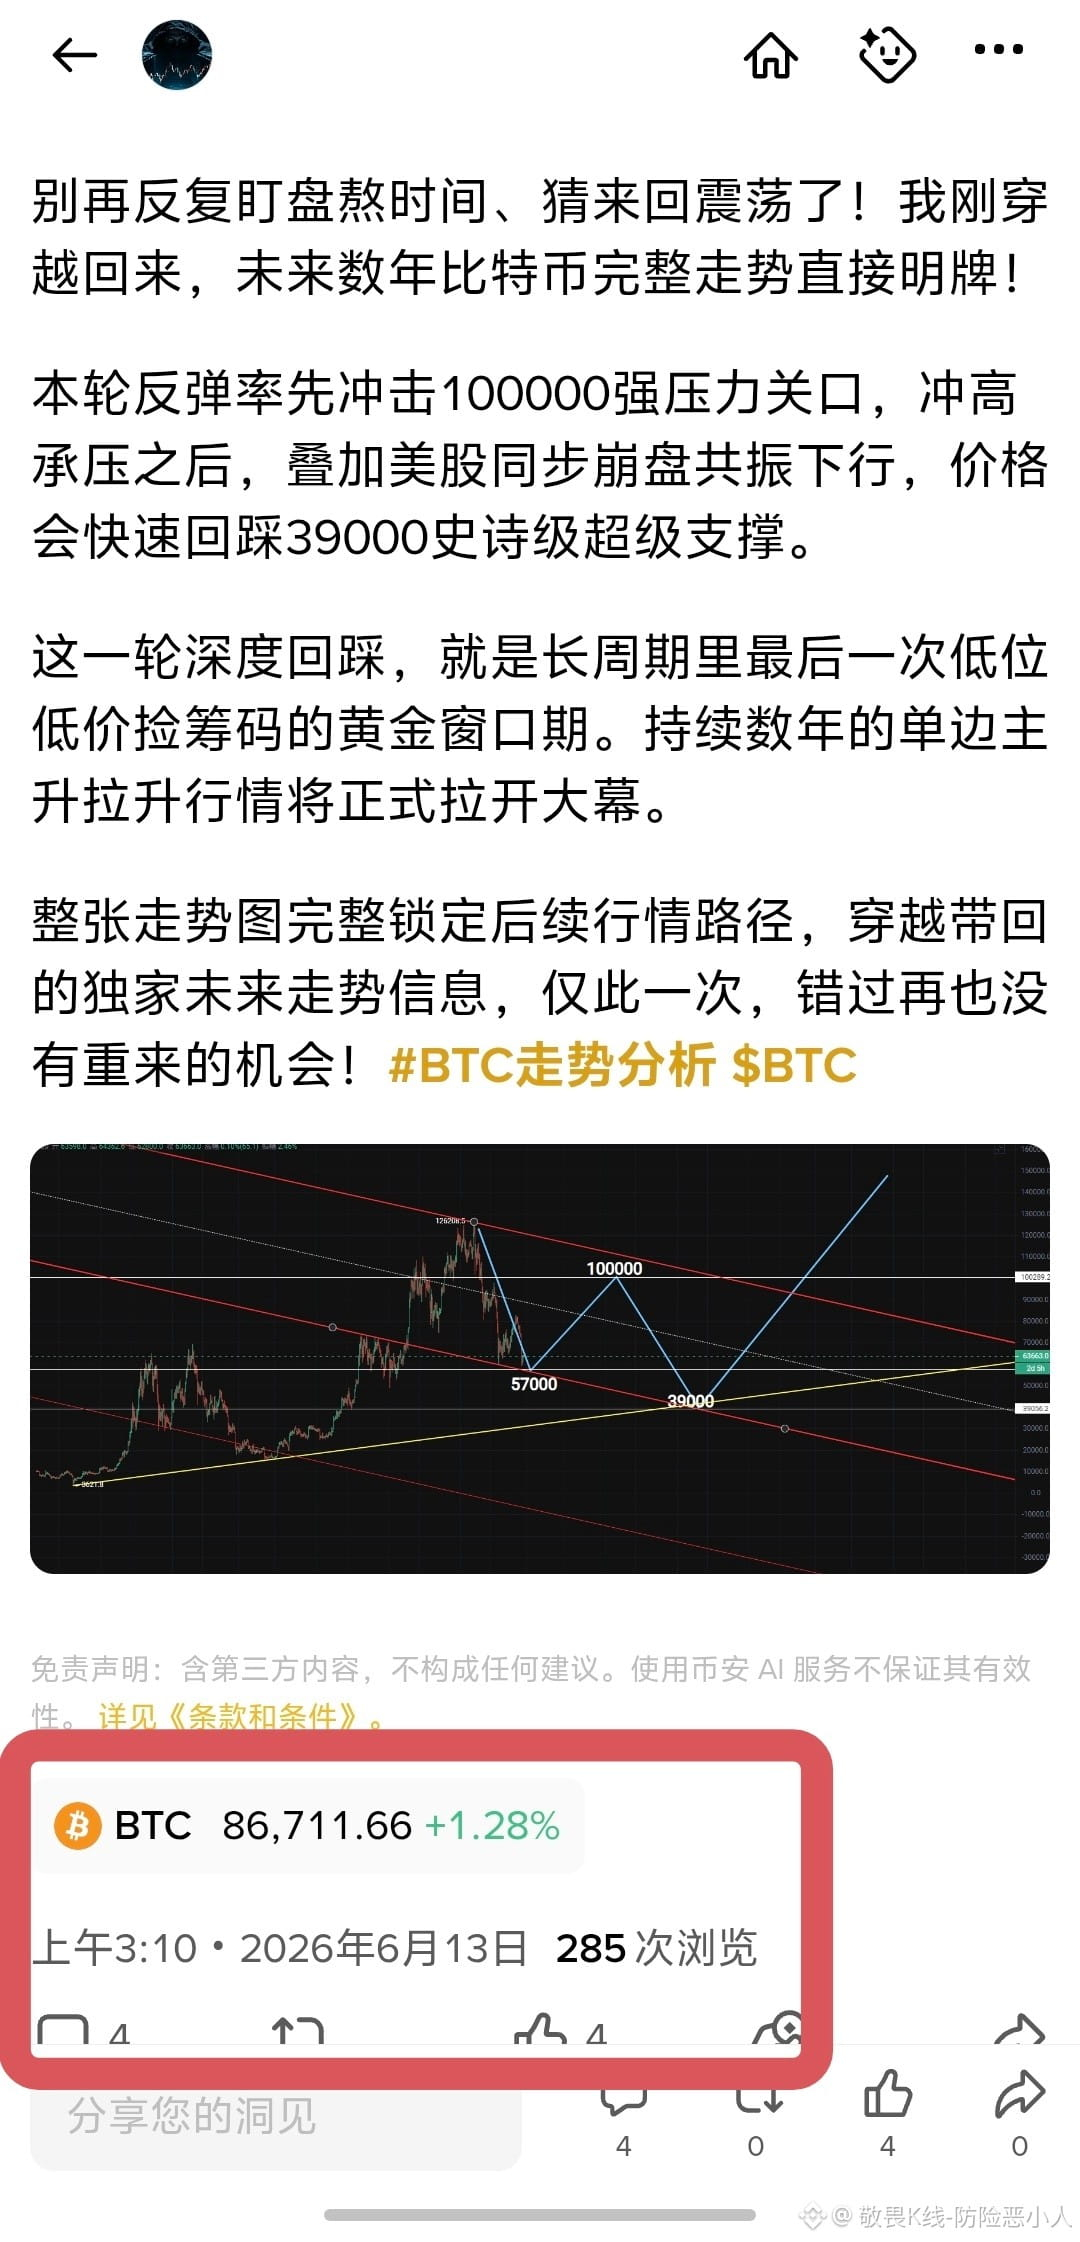
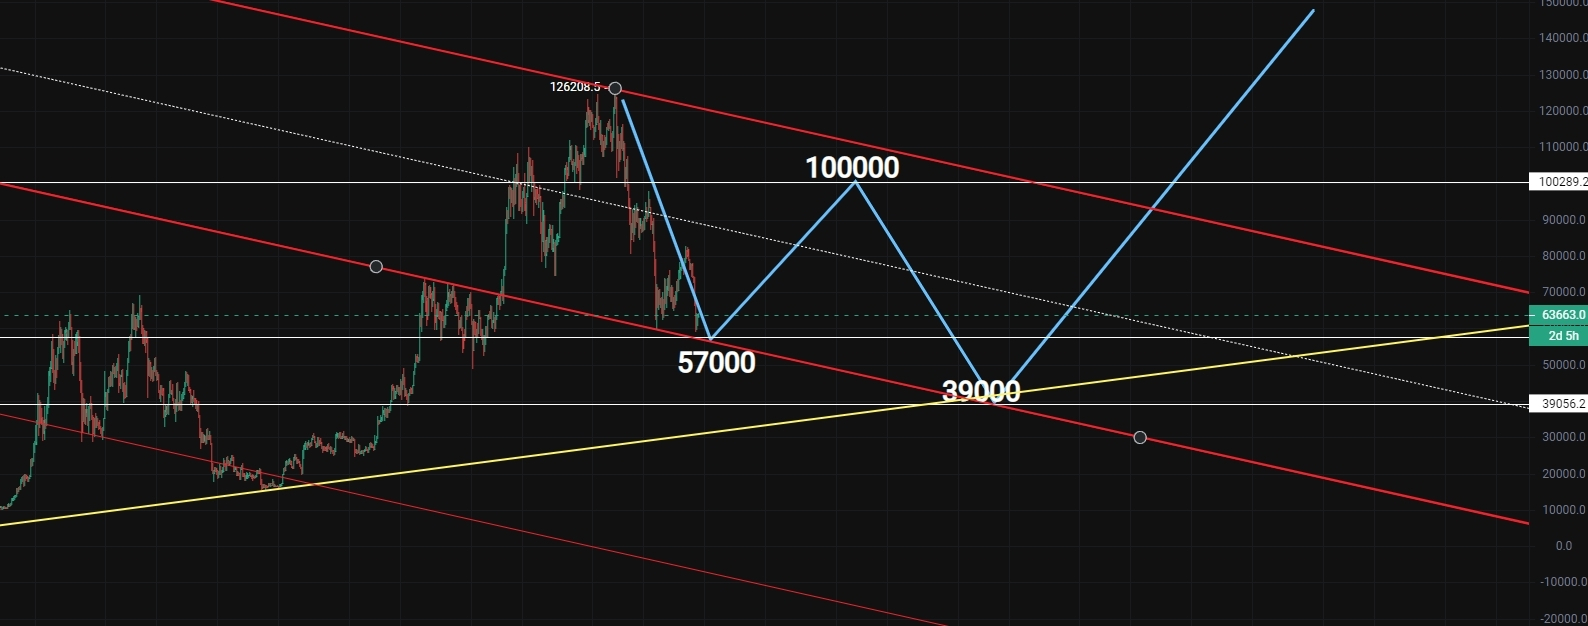
Stop staring at the charts and wasting time guessing the ups and downs! I just came back from the future, and I have the complete Bitcoin trajectory laid out for the next few years! This rebound is first hitting the strong resistance level at 100000. After a spike, with the U.S. stock market crashing in sync, we can expect a quick pullback to the epic super support at 39000. This round of deep pullback is the last golden window for scooping up low-priced coins in the long cycle. A sustained bull run that lasts for years is about to kick off. Once the entire candlestick chart is locked in, we'll have exclusive insights on the future market path. This is a one-time chance; miss it, and there's no going back!
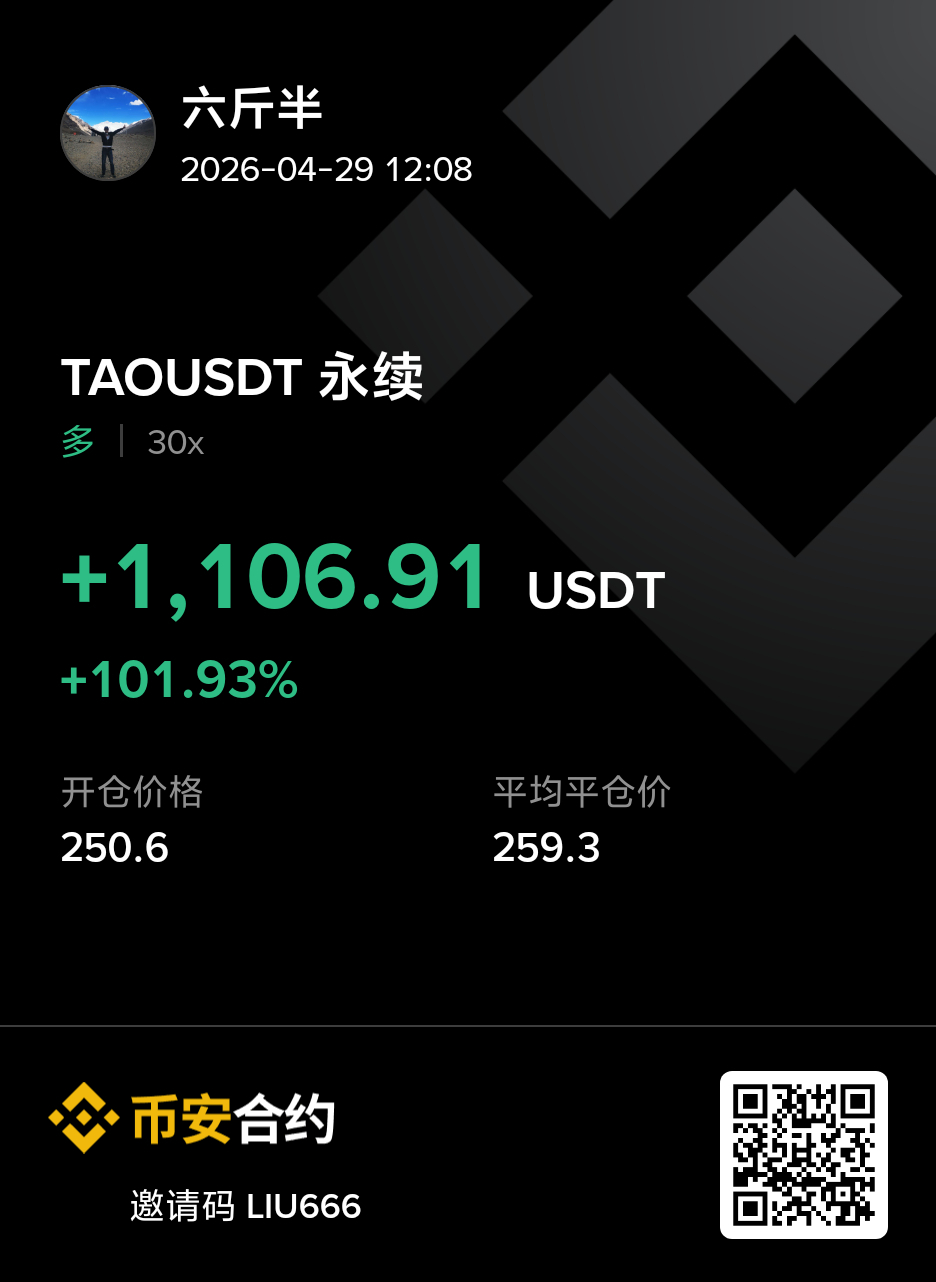
Stacking enough gas money for the holiday, time to roam around 🌿 Saying goodbye to the candlestick swings for now, taking a break from the trading grind. During the May Day holiday, no positions, no watching the charts, Giving time back to life, slowly enjoying the good moments, Resting and recharging, ready to strategize in the market post-holiday! #ETH