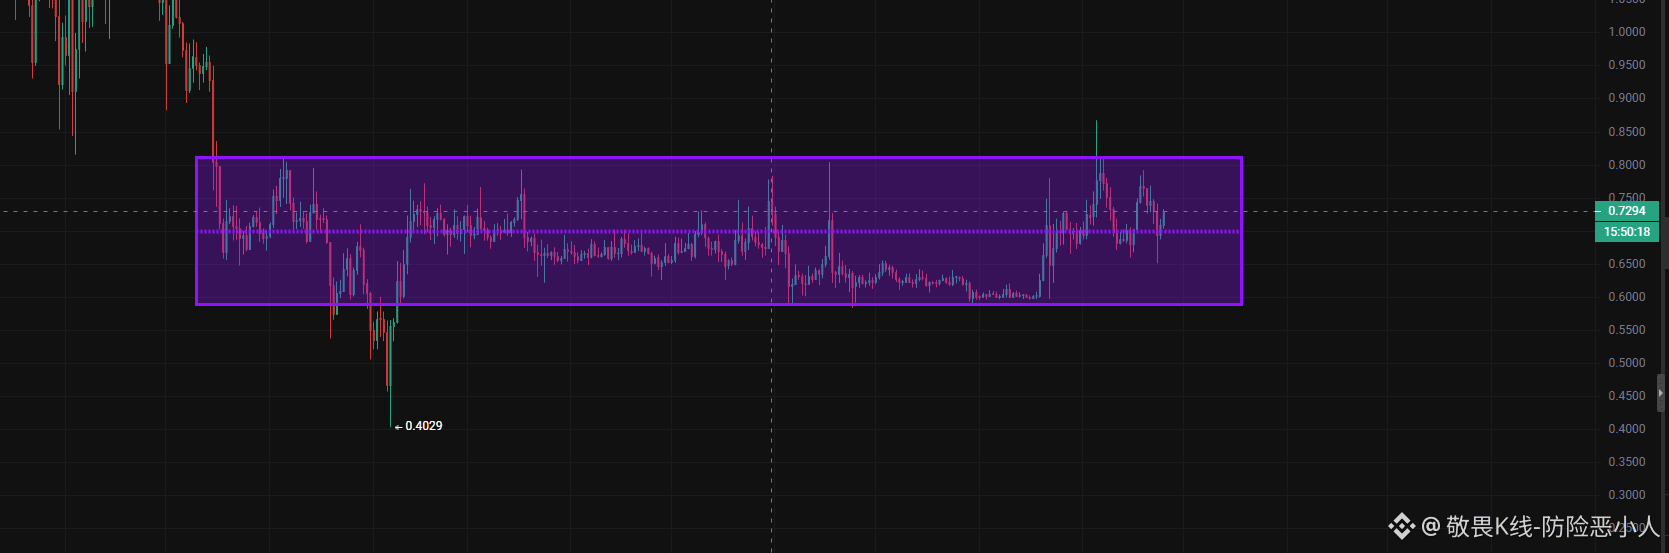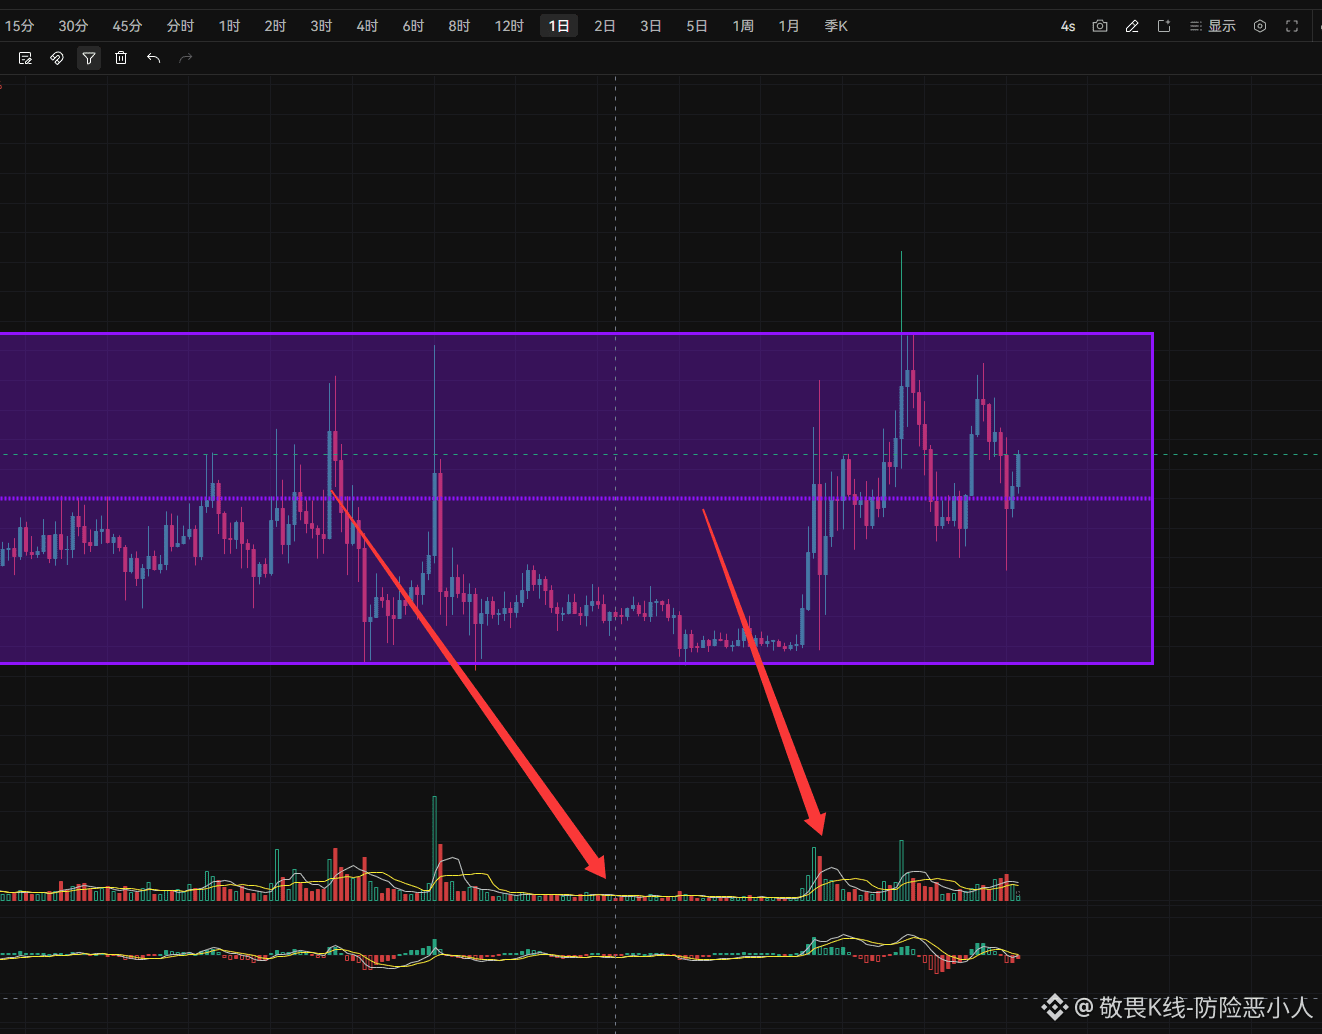
$ASTER A bottom box that has lasted for ten months, with extreme volume contraction and exhausted selling pressure. In the past two months, trading volume has started to show unusual surges; the main funds have entered the market in batches to build positions.
After funds surged and broke above the upper rail of the range, they didn’t immediately push the price higher—instead, a round of large volatility followed. Wide-range volatility is the main fund’s method of shakeout: by driving the price up and down repeatedly, it shakes out short-term profit-takers and any holders who are not firmly committed. During the consolidation, trading volume gradually declines, floating supply keeps shrinking, and then the price pulls back to the middle rail of the box to gather strength.
Long-term bottom extreme volume contraction forming a base → Volume activity surges in the past two months to build positions → Breakout with volume above the range → Big-volatile shakeout after the breakout → Low-volume pullback to the middle rail to gather strength.
📈 Daily chart: a long-term bottom range. After piercing above the upper rail, the price pulls back to the middle rail and uses it to consolidate for a washout.
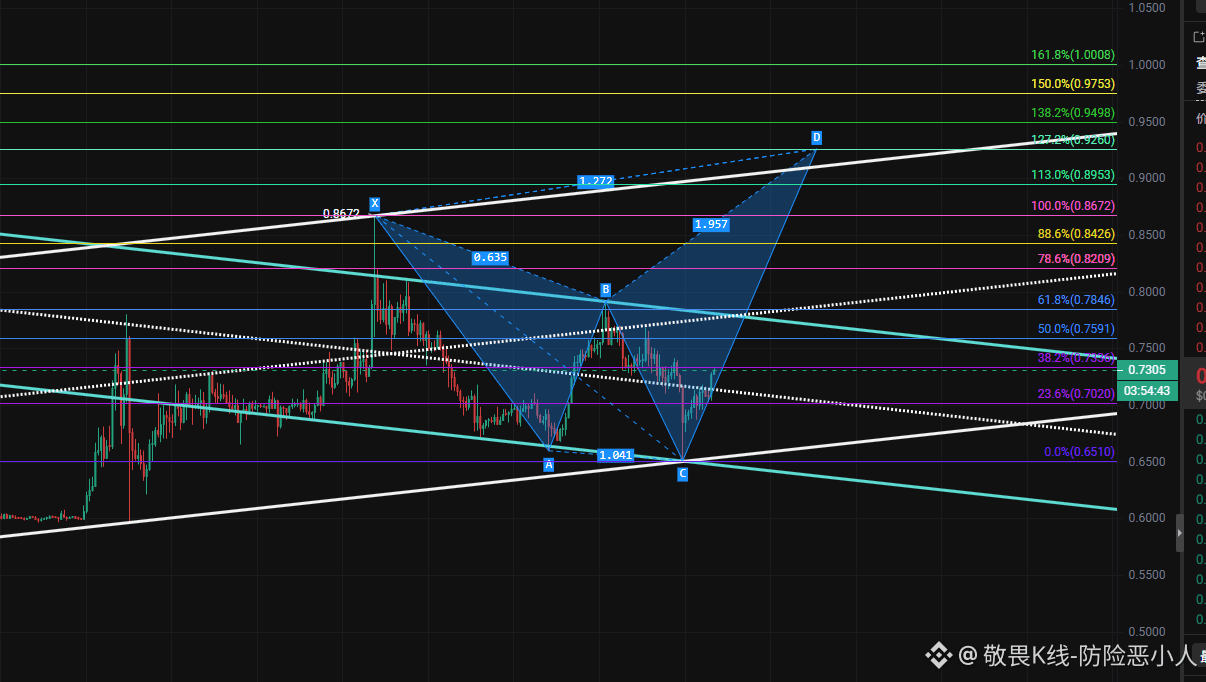
Switch to the 4-hour timeframe: the standard Bat harmonic pattern is currently in progress. Price is oscillating upward along an ascending channel, gradually approaching the D target zone. Point D is precisely the channel upper-rail resonance resistance.
After funds surged and broke above the upper rail of the range, they didn’t immediately push the price higher—instead, a round of large volatility followed. Wide-range volatility is the main fund’s method of shakeout: by driving the price up and down repeatedly, it shakes out short-term profit-takers and any holders who are not firmly committed. During the consolidation, trading volume gradually declines, floating supply keeps shrinking, and then the price pulls back to the middle rail of the box to gather strength.
Long-term bottom extreme volume contraction forming a base → Volume activity surges in the past two months to build positions → Breakout with volume above the range → Big-volatile shakeout after the breakout → Low-volume pullback to the middle rail to gather strength.
📈 Daily chart: a long-term bottom range. After piercing above the upper rail, the price pulls back to the middle rail and uses it to consolidate for a washout.
Switch to the 4-hour timeframe: the standard Bat harmonic pattern is currently in progress. Price is oscillating upward along an ascending channel, gradually approaching the D target zone. Point D is precisely the channel upper-rail resonance resistance.