

Qaiser Mehmood Sheikh
6 Posts

Qaiser Mehmood Sheikh
Report
Block User
Open Trade
2.2 Months
2 Following
0 Followers
0 Liked
Posts
Portfolio
#dusk $DUSK @Dusk_Foundation
The core focus of @Dusk_Foundation is building a powerful financial execution layer that seamlessly blends institutional-grade compliance with zero-knowledge privacy. By enabling confidential smart contracts, $DUSK provides the vital infrastructure needed for regulated financial assets and secure on-chain settlements. A massive leap forward for privacy-first finance! #dusk
#dusk $DUSK @Dusk
The core focus of @Dusk is building a powerful financial execution layer that seamlessly blends institutional-grade compliance with zero-knowledge privacy. By enabling confidential smart contracts, $DUSK provides the vital infrastructure needed for regulated financial assets and secure on-chain settlements. A massive leap forward for privacy-first finance! #dusk
The core focus of @Dusk is building a powerful financial execution layer that seamlessly blends institutional-grade compliance with zero-knowledge privacy. By enabling confidential smart contracts, $DUSK provides the vital infrastructure needed for regulated financial assets and secure on-chain settlements. A massive leap forward for privacy-first finance! #dusk
63

Article
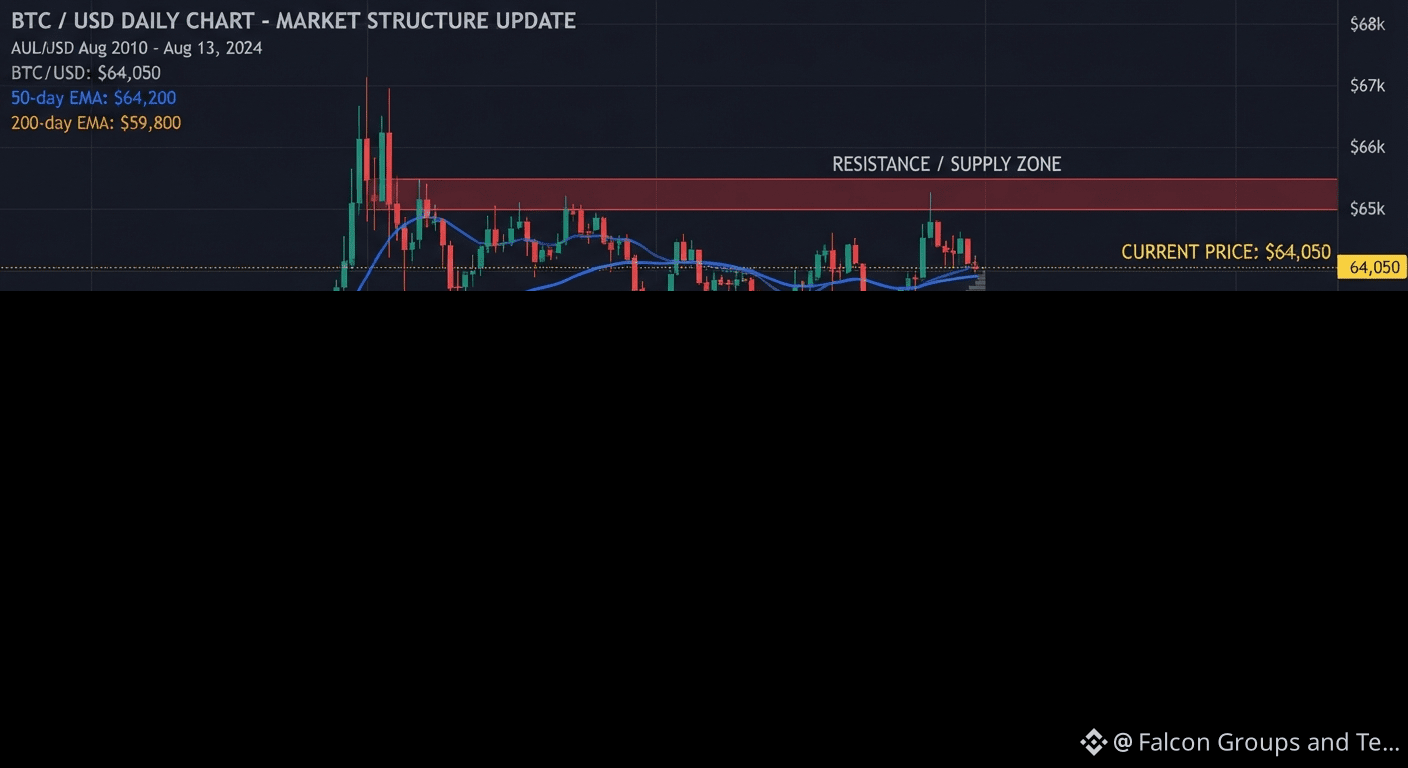
The Weekend Trap: Is $BTC About to Break Out or Fake Us Out? 📉 📈Hey Binance Square Family! As we settle into the weekend, volatility is tightening up across the board, and $BITCOIN is sitting right at a major decision point near $64,050.
Volume is cooling down, which usually means one thing: a sharp move is coming. Here is how I am playing the current market structure:
The Bull Case: If bulls can defend the $63,500 – $64,000 support zone and push a high-volume candle past $65,000, we are looking at a fast run up to the $66,700 – $67,500 resistance area.
The Bear Risk: A loss of the immediate support floor risks a sweep down toward the macro range lows near $62,500.
My Game Plan: I'm staying patient and waiting for a confirmed breakout or a clean retest at support before opening any new positions. No need to force trades in a compressed range!
What is your move this weekend? Are you buying the dip or waiting for a breakout? Let me know below! 👇
$BTC #btcweek #BitcoinMarketAnalysis
{spot}(BTCUSDT)
The Weekend Trap: Is $BTC About to Break Out or Fake Us Out? 📉 📈
Hey Binance Square Family! As we settle into the weekend, volatility is tightening up across the board, and $BITCOIN is sitting right at a major decision point near $64,050.
Volume is cooling down, which usually means one thing: a sharp move is coming. Here is how I am playing the current market structure:
The Bull Case: If bulls can defend the $63,500 – $64,000 support zone and push a high-volume candle past $65,000, we are looking at a fast run up to the $66,700 – $67,500 resistance area.
The Bear Risk: A loss of the immediate support floor risks a sweep down toward the macro range lows near $62,500.
My Game Plan: I'm staying patient and waiting for a confirmed breakout or a clean retest at support before opening any new positions. No need to force trades in a compressed range!
What is your move this weekend? Are you buying the dip or waiting for a breakout? Let me know below! 👇
$BTC #btcweek #BitcoinMarketAnalysis
Volume is cooling down, which usually means one thing: a sharp move is coming. Here is how I am playing the current market structure:
The Bull Case: If bulls can defend the $63,500 – $64,000 support zone and push a high-volume candle past $65,000, we are looking at a fast run up to the $66,700 – $67,500 resistance area.
The Bear Risk: A loss of the immediate support floor risks a sweep down toward the macro range lows near $62,500.
My Game Plan: I'm staying patient and waiting for a confirmed breakout or a clean retest at support before opening any new positions. No need to force trades in a compressed range!
What is your move this weekend? Are you buying the dip or waiting for a breakout? Let me know below! 👇
$BTC #btcweek #BitcoinMarketAnalysis
99
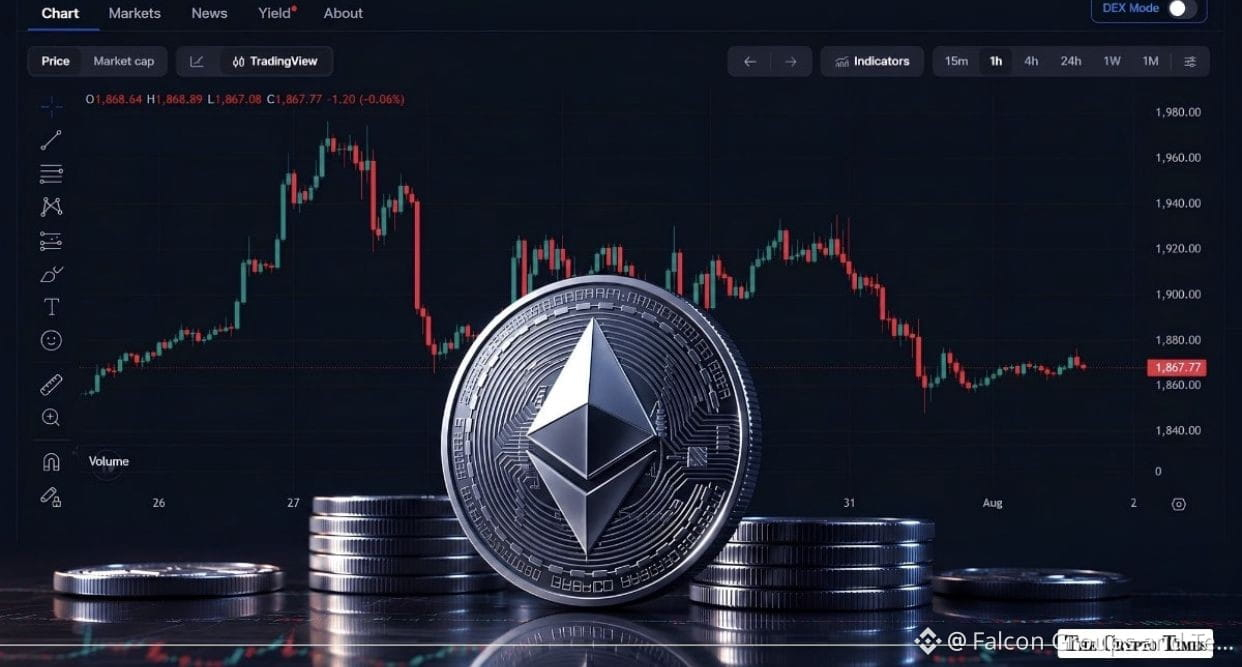
Ethereum $ETH Market Analysis
* Current Price: ~$1,890 – $1,900
* Market Context: $ETH is attempting a steady recovery after testing support near the $1,850 zone, moving in tandem with broader crypto market movements as traders digest macroeconomic updates and U.S. inflation data.
Key Technical Levels
| Level Type | Price Range | Significance |
|---|---|---|
| Immediate Support | $1,850 – $1,865 | Confluence of the 20-day and 50-day EMAs; serves as a vital safety floor for short-term dips. |
| Pivot / Breakout Hurdle | $1,895 – $1,920 | Short-term inflection point, aligning with the 100-day EMA ($1,922). Reclaiming this zone is essential for building upward momentum. |
| Major Supply / Resistance | $1,960 – $2,000 | Heavy overhead resistance area. A confirmed daily close above this level clears the path toward higher mid-term targets ($2,170+). |
When Is the Best Time to Trade?
Timing your entries correctly depends on whether you prefer safe range plays or confirmed breakouts:
* Best Time for Long Entries (Support Bounce):
Look for entries when the price successfully tests and defends the $1,850 – $1,865 support zone with decreasing selling volume. Buying near support while keeping a tight stop-loss below $1,830 offers a favorable risk-to-reward ratio.
* Best Time for Momentum / Breakout Entries:
Avoid chasing mid-range prices. Instead, wait for a high-volume daily close above the $1,920 – $1,960 resistance zone. Entering after confirmation reduces the risk of facing a fakeout or rejection back to range lows.
* Risk Management Warning:
With overall market sentiment leaning cautious and summer volume trends remaining flat, avoid high leverage. Stagger your orders and maintain strict stop-losses to protect against macro volatility.
#ETH #EthereumMarket $ETH
{spot}(ETHUSDT)
Ethereum $ETH Market Analysis
* Current Price: ~$1,890 – $1,900
* Market Context: $ETH is attempting a steady recovery after testing support near the $1,850 zone, moving in tandem with broader crypto market movements as traders digest macroeconomic updates and U.S. inflation data.
Key Technical Levels
| Level Type | Price Range | Significance |
|---|---|---|
| Immediate Support | $1,850 – $1,865 | Confluence of the 20-day and 50-day EMAs; serves as a vital safety floor for short-term dips. |
| Pivot / Breakout Hurdle | $1,895 – $1,920 | Short-term inflection point, aligning with the 100-day EMA ($1,922). Reclaiming this zone is essential for building upward momentum. |
| Major Supply / Resistance | $1,960 – $2,000 | Heavy overhead resistance area. A confirmed daily close above this level clears the path toward higher mid-term targets ($2,170+). |
When Is the Best Time to Trade?
Timing your entries correctly depends on whether you prefer safe range plays or confirmed breakouts:
* Best Time for Long Entries (Support Bounce):
Look for entries when the price successfully tests and defends the $1,850 – $1,865 support zone with decreasing selling volume. Buying near support while keeping a tight stop-loss below $1,830 offers a favorable risk-to-reward ratio.
* Best Time for Momentum / Breakout Entries:
Avoid chasing mid-range prices. Instead, wait for a high-volume daily close above the $1,920 – $1,960 resistance zone. Entering after confirmation reduces the risk of facing a fakeout or rejection back to range lows.
* Risk Management Warning:
With overall market sentiment leaning cautious and summer volume trends remaining flat, avoid high leverage. Stagger your orders and maintain strict stop-losses to protect against macro volatility.
#ETH #EthereumMarket $ETH
* Current Price: ~$1,890 – $1,900
* Market Context: $ETH is attempting a steady recovery after testing support near the $1,850 zone, moving in tandem with broader crypto market movements as traders digest macroeconomic updates and U.S. inflation data.
Key Technical Levels
| Level Type | Price Range | Significance |
|---|---|---|
| Immediate Support | $1,850 – $1,865 | Confluence of the 20-day and 50-day EMAs; serves as a vital safety floor for short-term dips. |
| Pivot / Breakout Hurdle | $1,895 – $1,920 | Short-term inflection point, aligning with the 100-day EMA ($1,922). Reclaiming this zone is essential for building upward momentum. |
| Major Supply / Resistance | $1,960 – $2,000 | Heavy overhead resistance area. A confirmed daily close above this level clears the path toward higher mid-term targets ($2,170+). |
When Is the Best Time to Trade?
Timing your entries correctly depends on whether you prefer safe range plays or confirmed breakouts:
* Best Time for Long Entries (Support Bounce):
Look for entries when the price successfully tests and defends the $1,850 – $1,865 support zone with decreasing selling volume. Buying near support while keeping a tight stop-loss below $1,830 offers a favorable risk-to-reward ratio.
* Best Time for Momentum / Breakout Entries:
Avoid chasing mid-range prices. Instead, wait for a high-volume daily close above the $1,920 – $1,960 resistance zone. Entering after confirmation reduces the risk of facing a fakeout or rejection back to range lows.
* Risk Management Warning:
With overall market sentiment leaning cautious and summer volume trends remaining flat, avoid high leverage. Stagger your orders and maintain strict stop-losses to protect against macro volatility.
#ETH #EthereumMarket $ETH
80
Article
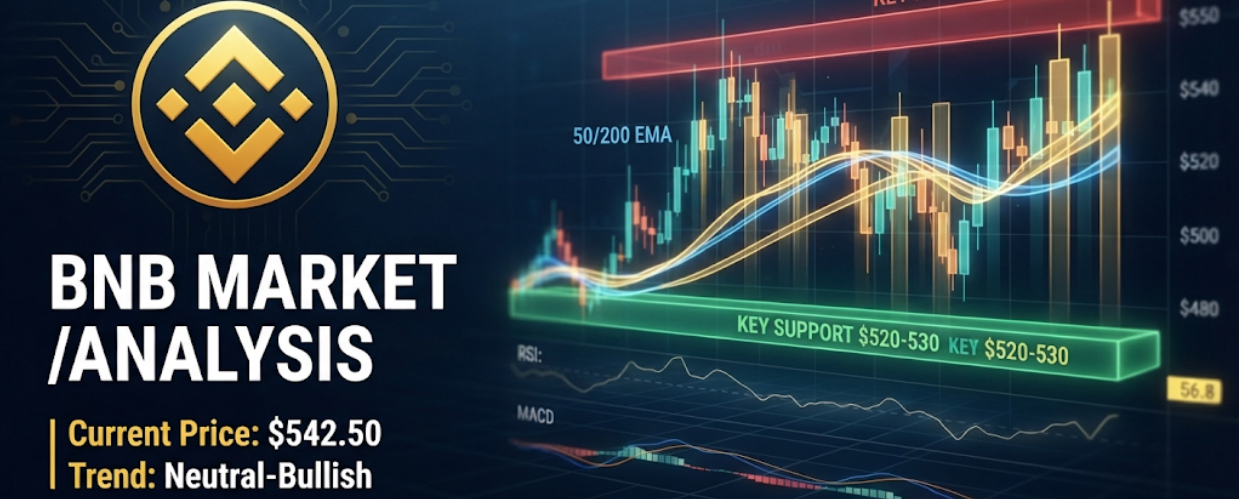
BNB / USD Detailed Technical AnalysisCurrent Market Price: ~$BNB 542.50
Technical Indicators: 50-day EMA: $530.00 (Acting as immediate dynamic support)
200-day EMA: $498.00 (Long-term structural baseline)
RSI (Relative Strength Index): 56.8 (Neutral-to-bullish momentum, pointing upward without being overbought)MACD: Mild bullish convergence forming on daily charts following recent support tests.
Key Technical Zones
Zone Type
Price Range
Analysis & Significance
Supply / Resistance Zone
$555.00 - $565.00
Heavy liquidity block. Previous rally attempts faced severe selling pressure here. A daily close above $565 is required for a major breakout.
Point of Control (POC)
~$540.00 - $543.00
High volume node where the majority of recent trading activity has concentrated. Current price is hovering right on this pivot.
Demand / Support Zone
$520.00 - $530.00
Confluence of the 50-day EMA and historical buyer interest. This area acts as a strong safety net for short-term dips.
Will It Be Worth It to Trade In Right Now?
Trading BNB in the current market environment offers moderate opportunities, but it requires careful risk management due to broader crypto market caution:
Short-Term Range Trading (Favorable): Because BNB is consolidating tightly around the POC ($540 to $542) between the $525 support and $555 resistance, it is a great candidate for range trading. Buying near support with tight stop-losses below $520 or shorting minor rejections near $555 can yield structured, high-probability setups.
Breakout Trading (Wait for Confirmation): If you prefer momentum trading, it is best to wait rather than chasing entry right now. Entering a long position before a confirmed daily close above $565 carries the risk of another rejection back to range lows.
Macro Environment Factor: With broader markets reacting sensitively to macroeconomic indicators and flat summer volume trends, avoid using excessive leverage. Staggered entries and clear risk parameters are essential if you decide to execute a trade.#BNB_Market_Update {spot}(BNBUSDT)
BNB / USD Detailed Technical Analysis
Current Market Price: ~$BNB 542.50
Technical Indicators: 50-day EMA: $530.00 (Acting as immediate dynamic support)
200-day EMA: $498.00 (Long-term structural baseline)
RSI (Relative Strength Index): 56.8 (Neutral-to-bullish momentum, pointing upward without being overbought)MACD: Mild bullish convergence forming on daily charts following recent support tests.
Key Technical Zones
Zone Type
Price Range
Analysis & Significance
Supply / Resistance Zone
$555.00 - $565.00
Heavy liquidity block. Previous rally attempts faced severe selling pressure here. A daily close above $565 is required for a major breakout.
Point of Control (POC)
~$540.00 - $543.00
High volume node where the majority of recent trading activity has concentrated. Current price is hovering right on this pivot.
Demand / Support Zone
$520.00 - $530.00
Confluence of the 50-day EMA and historical buyer interest. This area acts as a strong safety net for short-term dips.
Will It Be Worth It to Trade In Right Now?
Trading BNB in the current market environment offers moderate opportunities, but it requires careful risk management due to broader crypto market caution:
Short-Term Range Trading (Favorable): Because BNB is consolidating tightly around the POC ($540 to $542) between the $525 support and $555 resistance, it is a great candidate for range trading. Buying near support with tight stop-losses below $520 or shorting minor rejections near $555 can yield structured, high-probability setups.
Breakout Trading (Wait for Confirmation): If you prefer momentum trading, it is best to wait rather than chasing entry right now. Entering a long position before a confirmed daily close above $565 carries the risk of another rejection back to range lows.
Macro Environment Factor: With broader markets reacting sensitively to macroeconomic indicators and flat summer volume trends, avoid using excessive leverage. Staggered entries and clear risk parameters are essential if you decide to execute a trade.#BNB_Market_Update
Technical Indicators: 50-day EMA: $530.00 (Acting as immediate dynamic support)
200-day EMA: $498.00 (Long-term structural baseline)
RSI (Relative Strength Index): 56.8 (Neutral-to-bullish momentum, pointing upward without being overbought)MACD: Mild bullish convergence forming on daily charts following recent support tests.
Key Technical Zones
Zone Type
Price Range
Analysis & Significance
Supply / Resistance Zone
$555.00 - $565.00
Heavy liquidity block. Previous rally attempts faced severe selling pressure here. A daily close above $565 is required for a major breakout.
Point of Control (POC)
~$540.00 - $543.00
High volume node where the majority of recent trading activity has concentrated. Current price is hovering right on this pivot.
Demand / Support Zone
$520.00 - $530.00
Confluence of the 50-day EMA and historical buyer interest. This area acts as a strong safety net for short-term dips.
Will It Be Worth It to Trade In Right Now?
Trading BNB in the current market environment offers moderate opportunities, but it requires careful risk management due to broader crypto market caution:
Short-Term Range Trading (Favorable): Because BNB is consolidating tightly around the POC ($540 to $542) between the $525 support and $555 resistance, it is a great candidate for range trading. Buying near support with tight stop-losses below $520 or shorting minor rejections near $555 can yield structured, high-probability setups.
Breakout Trading (Wait for Confirmation): If you prefer momentum trading, it is best to wait rather than chasing entry right now. Entering a long position before a confirmed daily close above $565 carries the risk of another rejection back to range lows.
Macro Environment Factor: With broader markets reacting sensitively to macroeconomic indicators and flat summer volume trends, avoid using excessive leverage. Staggered entries and clear risk parameters are essential if you decide to execute a trade.#BNB_Market_Update
86
Bitcoin $BTC Trade Analysis
* Current Price: ~$63,800 – $64,000
* Market Context: $BTC is consolidating in a tight range between $62,500 and $65,000, reacting closely to recent U.S. inflation (CPI) data and awaiting upcoming macroeconomic triggers.
Key Technical Levels
| Level Type | Price Zone / Range | Significance |
|---|---|---|
| Immediate Support | $62,500 – $63,500 | Crucial demand zone holding short-term higher lows; a breakdown risks a slide toward $61,300. |
| Pivot / Breakout Area | $64,000 – $64,500 | Short-term inflection point; interacting with the 50-day EMA ($64,583). |
| Immediate Resistance | $64,900 – $65,300 | Heavy supply/liquidity zone. Rejection here could prolong range-bound movement. |
| Upside Target / Breakout | $66,700 – $67,500 | A confirmed daily close above resistance targets the 100-day EMA and local weak highs. |
Trade Scenarios
* Bullish Continuation Setup (Long):
* Trigger: Look for a strong 1H–4H candle close above $65,000 backed by volume, or a clean retest and defense of the $63,800 – $64,200 support block.
* Targets: $65,500, then $66,750.
* Risk Management: Stop-loss tightly managed below $63,500.
* Bearish / Range Rejection Setup (Short):
* Trigger: Rejection and fading momentum around the $64,900 – $65,300 supply area.
* Targets: Return to range lows at $62,500.
* Risk Management: Stop-loss placed above $65,600.
* Invalidation: A high-volume daily close below $62,000 invalidates the current short-term recovery structure, exposing deeper macro support.
#BTC #Market_Update
{spot}(BTCUSDT)
Bitcoin $BTC Trade Analysis
* Current Price: ~$63,800 – $64,000
* Market Context: $BTC is consolidating in a tight range between $62,500 and $65,000, reacting closely to recent U.S. inflation (CPI) data and awaiting upcoming macroeconomic triggers.
Key Technical Levels
| Level Type | Price Zone / Range | Significance |
|---|---|---|
| Immediate Support | $62,500 – $63,500 | Crucial demand zone holding short-term higher lows; a breakdown risks a slide toward $61,300. |
| Pivot / Breakout Area | $64,000 – $64,500 | Short-term inflection point; interacting with the 50-day EMA ($64,583). |
| Immediate Resistance | $64,900 – $65,300 | Heavy supply/liquidity zone. Rejection here could prolong range-bound movement. |
| Upside Target / Breakout | $66,700 – $67,500 | A confirmed daily close above resistance targets the 100-day EMA and local weak highs. |
Trade Scenarios
* Bullish Continuation Setup (Long):
* Trigger: Look for a strong 1H–4H candle close above $65,000 backed by volume, or a clean retest and defense of the $63,800 – $64,200 support block.
* Targets: $65,500, then $66,750.
* Risk Management: Stop-loss tightly managed below $63,500.
* Bearish / Range Rejection Setup (Short):
* Trigger: Rejection and fading momentum around the $64,900 – $65,300 supply area.
* Targets: Return to range lows at $62,500.
* Risk Management: Stop-loss placed above $65,600.
* Invalidation: A high-volume daily close below $62,000 invalidates the current short-term recovery structure, exposing deeper macro support.
#BTC #Market_Update
* Current Price: ~$63,800 – $64,000
* Market Context: $BTC is consolidating in a tight range between $62,500 and $65,000, reacting closely to recent U.S. inflation (CPI) data and awaiting upcoming macroeconomic triggers.
Key Technical Levels
| Level Type | Price Zone / Range | Significance |
|---|---|---|
| Immediate Support | $62,500 – $63,500 | Crucial demand zone holding short-term higher lows; a breakdown risks a slide toward $61,300. |
| Pivot / Breakout Area | $64,000 – $64,500 | Short-term inflection point; interacting with the 50-day EMA ($64,583). |
| Immediate Resistance | $64,900 – $65,300 | Heavy supply/liquidity zone. Rejection here could prolong range-bound movement. |
| Upside Target / Breakout | $66,700 – $67,500 | A confirmed daily close above resistance targets the 100-day EMA and local weak highs. |
Trade Scenarios
* Bullish Continuation Setup (Long):
* Trigger: Look for a strong 1H–4H candle close above $65,000 backed by volume, or a clean retest and defense of the $63,800 – $64,200 support block.
* Targets: $65,500, then $66,750.
* Risk Management: Stop-loss tightly managed below $63,500.
* Bearish / Range Rejection Setup (Short):
* Trigger: Rejection and fading momentum around the $64,900 – $65,300 supply area.
* Targets: Return to range lows at $62,500.
* Risk Management: Stop-loss placed above $65,600.
* Invalidation: A high-volume daily close below $62,000 invalidates the current short-term recovery structure, exposing deeper macro support.
#BTC #Market_Update
75
Log in to explore more content
Join global crypto users on Binance Square
⚡️ Get latest and useful information about crypto.
💬 Trusted by the world’s largest crypto exchange.
👍 Discover real insights from verified creators.
Email / Phone number
Trending Topics
NvidiaApproves$150BBuyback
1,342 views
37 Discussing
#NvidiaApproves$150BBuyback
Nvidia’s $150 Billion Buyback Shockwave: Is AI Cash Flow Driving the Next Market Rally? 🚀
The AI supercycle just sent shockwaves across tradfi and crypto markets! NVIDIA's Board of Directors authorized a massive $150 Billion increase to its share repurchase program, expanding the company's total remaining buyback authorization to $235 Billion.
This marks the largest share buyback authorization in U.S. corporate history, surpassing Apple’s $110 billion benchmark.
📰 Key Headlines & Market Breakdown
Record-Breaking Capital Return: NVIDIA founder and CEO Jensen Huang cited "once-in-a-generation platform shift to AI" and strong corporate cash flow as the main drivers behind returning capital to shareholders.
Defying Market Downturns: Despite broader equity pressure and rising U.S. Treasury yields, $NVDA shares surged over 3% on the announcement, showing institutional confidence in tech assets.
Spillover into Decentralized AI: Historically, major bullish headlines for NVIDIA trigger positive sentiment for decentralized AI infrastructure protocols (such as NEAR, RENDER, and FET), as web3 AI projects track broader AI sector valuations.
❓ Discussion Point
Nvidia announces a massive $150B buyback! Will tech stock gains bleed over into Bitcoin and AI tokens?
$RENDER
📊 Related Crypto Trade Signal: RENDER/USDT
Trade Bias: Bullish
Entry Zone: $5.20 – $5.45
Target 1 (TP1): $6.10
Target 2 (TP2): $6.85
Stop Loss (SL): $4.85
Leverage (Futures): 3x – 5x (Isolated)
Technical Rationale: RENDER tends to react strongly to Nvidia hardware and AI capital developments. Price is consolidating near key moving average support with rising spot volume following the $NVDAB
news.
#HackersDrainOver12.4MXRPFromDCENTWallets #CryptoNews #AITokens #TradingSignals
Lily星星
·1 Likes
·135 views
OpenAIDelaysGPT6.1OverSafetyIssues
6,530 views
306 Discussing
AMDToAcquireWorldLabsFor$8.2B
847 views
34 Discussing