
AMRIA BIBI
8 Posts

AMRIA BIBI
Report
Block User
Open Trade
Occasional Trader
1.4 Years
4 Following
11 Followers
12 Liked
Posts
Portfolio
·
--
$ETH #BTCVSGOLD #WriteToEarnUpgrade #BinanceBlockchainWeek #USJobsData #CPIWatch
{spot}(ETHUSDT)
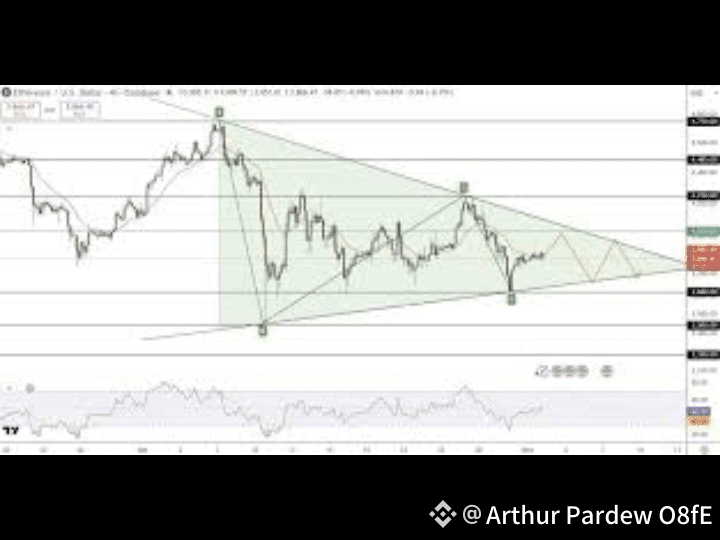
The current price is ~ $3,374 as reported.
Some analyses suggest that in the coming days, the price could reach $3,450–$3,750, if momentum is maintained.
---
🔎 Technical Signals & Market Sentiment
Some technical indicators (like moving averages on daily/weekly) currently show a bullish setup — both short-term trend (5D, 10D MA) and long-term MA (50D, 200D) have given buy signals.
Daily RSI is around neutral (~50-55) — meaning it is neither over-bought nor over-sold, and the market could be in consolidation mode.
If ETH crosses the $3,300–$3,400 resistance level, the bulls' next target could be the $3,700–$3,800 zone.
However, if support levels fail (around $2,800–$2,950), there is also downside risk — some analysts mention a potential dip to $2,600–$2,700.
---
🧭 Fundamentals & Broader Drivers
The ETH ecosystem is still robust; network upgrades and Layer-2 adoption have strong long-term fundamentals.
Institutional interest (whale longs, futures open interest) has recently supported the rally — this signals that large investors do not currently view ETH as under-valued.
There are some aggressive bullish forecasts suggesting targets of $5,000+ or even $7,000+ for year-end or the coming months — but these are quite speculative and depend on a strong breakout.
$ETH #BTCVSGOLD #WriteToEarnUpgrade #BinanceBlockchainWeek #USJobsData #CPIWatch
The current price is ~ $3,374 as reported.
Some analyses suggest that in the coming days, the price could reach $3,450–$3,750, if momentum is maintained.
---
🔎 Technical Signals & Market Sentiment
Some technical indicators (like moving averages on daily/weekly) currently show a bullish setup — both short-term trend (5D, 10D MA) and long-term MA (50D, 200D) have given buy signals.
Daily RSI is around neutral (~50-55) — meaning it is neither over-bought nor over-sold, and the market could be in consolidation mode.
If ETH crosses the $3,300–$3,400 resistance level, the bulls' next target could be the $3,700–$3,800 zone.
However, if support levels fail (around $2,800–$2,950), there is also downside risk — some analysts mention a potential dip to $2,600–$2,700.
---
🧭 Fundamentals & Broader Drivers
The ETH ecosystem is still robust; network upgrades and Layer-2 adoption have strong long-term fundamentals.
Institutional interest (whale longs, futures open interest) has recently supported the rally — this signals that large investors do not currently view ETH as under-valued.
There are some aggressive bullish forecasts suggesting targets of $5,000+ or even $7,000+ for year-end or the coming months — but these are quite speculative and depend on a strong breakout.
The current price is ~ $3,374 as reported.
Some analyses suggest that in the coming days, the price could reach $3,450–$3,750, if momentum is maintained.
---
🔎 Technical Signals & Market Sentiment
Some technical indicators (like moving averages on daily/weekly) currently show a bullish setup — both short-term trend (5D, 10D MA) and long-term MA (50D, 200D) have given buy signals.
Daily RSI is around neutral (~50-55) — meaning it is neither over-bought nor over-sold, and the market could be in consolidation mode.
If ETH crosses the $3,300–$3,400 resistance level, the bulls' next target could be the $3,700–$3,800 zone.
However, if support levels fail (around $2,800–$2,950), there is also downside risk — some analysts mention a potential dip to $2,600–$2,700.
---
🧭 Fundamentals & Broader Drivers
The ETH ecosystem is still robust; network upgrades and Layer-2 adoption have strong long-term fundamentals.
Institutional interest (whale longs, futures open interest) has recently supported the rally — this signals that large investors do not currently view ETH as under-valued.
There are some aggressive bullish forecasts suggesting targets of $5,000+ or even $7,000+ for year-end or the coming months — but these are quite speculative and depend on a strong breakout.
41
·
--
$BTC
{spot}(BTCUSDT)
#StrategyBTCPurchase #MarketPullback #ProjectCrypto #CPIWatch #CFTCCryptoSprint Bitcoin (BTC) Latest Analysis – November 2025
---
🔍 Current Technical Picture
1. Key Support & Resistance
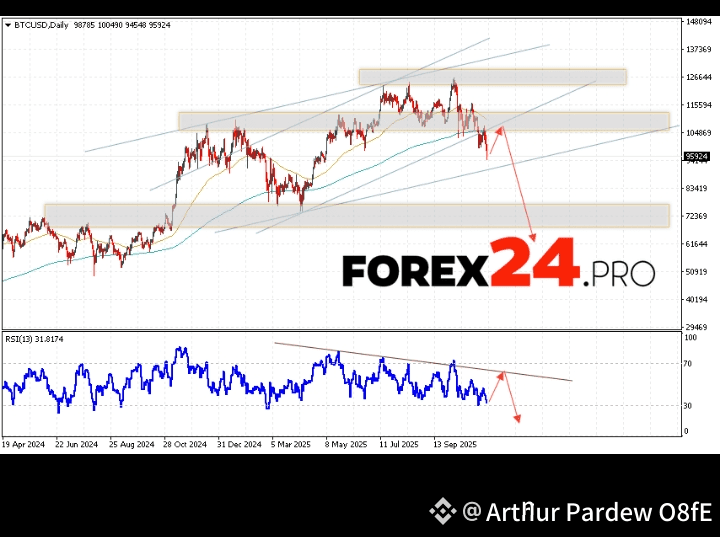
Support is forming around $107K–$110K, which is a critical zone.
On the upside, BTC is facing resistance near $120K–$125K.
2. Moving Averages & Momentum
According to LiteFinance, BTC is holding above the 200-day SMA (~$103,200) which is a long-term bullish signal.
MACD has turned upward, supporting a potential bullish continuation.
However, a breach below long-term levels could risk further downside; some analyses point to further weakness if BTC gets below its 200-day MA.
3. Pattern & Structure
There’s talk of a double-bottom around $106K–$108K, which could be setting BTC up for a bounce.
Alternatively, the current consolidation may be a mid-cycle rest rather than a major top or a reversal.
---
📈 Price Forecasts & Scenarios
Bullish Case:
According to Blockchain.News, BTC could rally to $138,183 in the near term if it breaks key resistance.
Moderate Bull Base:
Analysts cited by Coin Edition expect a breakout to ~$115K, driven by historically bullish November seasonality and increasing institutional accumulation.
Bearish Risks:
If BTC fails to hold its support zone, it could drop to ~$94,200, according to Katie Stockton (Fairlead Strategies).
CoinCodex’s model shows current sentiment is leaning bearish, with several indicators pointing to downside
$BTC
#StrategyBTCPurchase #MarketPullback #ProjectCrypto #CPIWatch #CFTCCryptoSprint Bitcoin (BTC) Latest Analysis – November 2025
---
🔍 Current Technical Picture
1. Key Support & Resistance
Support is forming around $107K–$110K, which is a critical zone.
On the upside, BTC is facing resistance near $120K–$125K.
2. Moving Averages & Momentum
According to LiteFinance, BTC is holding above the 200-day SMA (~$103,200) which is a long-term bullish signal.
MACD has turned upward, supporting a potential bullish continuation.
However, a breach below long-term levels could risk further downside; some analyses point to further weakness if BTC gets below its 200-day MA.
3. Pattern & Structure
There’s talk of a double-bottom around $106K–$108K, which could be setting BTC up for a bounce.
Alternatively, the current consolidation may be a mid-cycle rest rather than a major top or a reversal.
---
📈 Price Forecasts & Scenarios
Bullish Case:
According to Blockchain.News, BTC could rally to $138,183 in the near term if it breaks key resistance.
Moderate Bull Base:
Analysts cited by Coin Edition expect a breakout to ~$115K, driven by historically bullish November seasonality and increasing institutional accumulation.
Bearish Risks:
If BTC fails to hold its support zone, it could drop to ~$94,200, according to Katie Stockton (Fairlead Strategies).
CoinCodex’s model shows current sentiment is leaning bearish, with several indicators pointing to downside
#StrategyBTCPurchase #MarketPullback #ProjectCrypto #CPIWatch #CFTCCryptoSprint Bitcoin (BTC) Latest Analysis – November 2025
---
🔍 Current Technical Picture
1. Key Support & Resistance
Support is forming around $107K–$110K, which is a critical zone.
On the upside, BTC is facing resistance near $120K–$125K.
2. Moving Averages & Momentum
According to LiteFinance, BTC is holding above the 200-day SMA (~$103,200) which is a long-term bullish signal.
MACD has turned upward, supporting a potential bullish continuation.
However, a breach below long-term levels could risk further downside; some analyses point to further weakness if BTC gets below its 200-day MA.
3. Pattern & Structure
There’s talk of a double-bottom around $106K–$108K, which could be setting BTC up for a bounce.
Alternatively, the current consolidation may be a mid-cycle rest rather than a major top or a reversal.
---
📈 Price Forecasts & Scenarios
Bullish Case:
According to Blockchain.News, BTC could rally to $138,183 in the near term if it breaks key resistance.
Moderate Bull Base:
Analysts cited by Coin Edition expect a breakout to ~$115K, driven by historically bullish November seasonality and increasing institutional accumulation.
Bearish Risks:
If BTC fails to hold its support zone, it could drop to ~$94,200, according to Katie Stockton (Fairlead Strategies).
CoinCodex’s model shows current sentiment is leaning bearish, with several indicators pointing to downside
2
36
·
--
$XRP
{spot}(XRPUSDT)
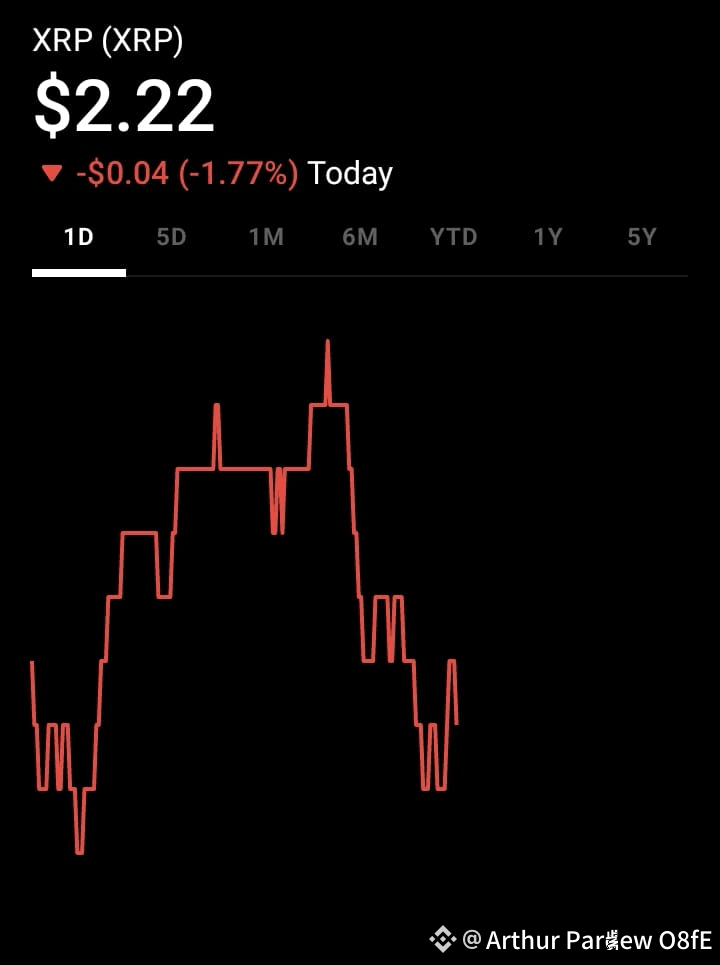
#StrategyBTCPurchase #MarketPullback #TrumpBitcoinEmpire #CryptoIn401k #TrumpTariffs has been trading in a tighter range, forming a triangle / consolidation pattern.
Key support is around $2.33, while resistance is around $2.44 currently.
Trading volumes are somewhat subdued, suggesting cautious accumulation rather than full-blown bullish conviction.
---
2. Technical / Pattern-Based Outlook
Bullish Scenarios:
Fractal Pattern: Some analysts using fractal analysis see a potential move up toward $6–$7 by mid-November 2025, assuming the current channel holds.
Fibonacci Extensions: There is a more aggressive projection by some traders suggesting a target as high as $8.50+, based on Fibonacci extension levels if a breakout continues.
ETF & Institutional Flows: Analysts believe ETF momentum and institutional adoption (especially now that regulatory pressure has eased) could drive significant demand.
Long-term Target: One analyst even projects a possible $15 by the end of 2025, if bullish momentum sustains and adoption continues.
More Conservative / Base Case:
Near-term target in next few weeks: $3.05–$3.25 is cited by several sources, assuming a breakout from consolidation.
If bearish pressure hits, some suggest support could break toward $2.27–$2.30.
---
3. Fundamental / Macro Drivers
Regulatory Clarity: Ripple has resolved major legal overhang with the SEC.
Strategic Acquisition: Ripple is acquiring Hidden Road (prime brokerage) for ~$1.25B, which could strengthen XRP’s role in institutional DeFi and settlements.
Stablecoin Use-Case: Ripple's stablecoin (RLUSD) could benefit from institutional adoption and be more deeply integrated into XRP’s ecosystem.
Whale Activity: There are reports / on-chain signals of large XRP movements, which could be accumulation or potential sell-side pressure.
$XRP
#StrategyBTCPurchase #MarketPullback #TrumpBitcoinEmpire #CryptoIn401k #TrumpTariffs has been trading in a tighter range, forming a triangle / consolidation pattern.
Key support is around $2.33, while resistance is around $2.44 currently.
Trading volumes are somewhat subdued, suggesting cautious accumulation rather than full-blown bullish conviction.
---
2. Technical / Pattern-Based Outlook
Bullish Scenarios:
Fractal Pattern: Some analysts using fractal analysis see a potential move up toward $6–$7 by mid-November 2025, assuming the current channel holds.
Fibonacci Extensions: There is a more aggressive projection by some traders suggesting a target as high as $8.50+, based on Fibonacci extension levels if a breakout continues.
ETF & Institutional Flows: Analysts believe ETF momentum and institutional adoption (especially now that regulatory pressure has eased) could drive significant demand.
Long-term Target: One analyst even projects a possible $15 by the end of 2025, if bullish momentum sustains and adoption continues.
More Conservative / Base Case:
Near-term target in next few weeks: $3.05–$3.25 is cited by several sources, assuming a breakout from consolidation.
If bearish pressure hits, some suggest support could break toward $2.27–$2.30.
---
3. Fundamental / Macro Drivers
Regulatory Clarity: Ripple has resolved major legal overhang with the SEC.
Strategic Acquisition: Ripple is acquiring Hidden Road (prime brokerage) for ~$1.25B, which could strengthen XRP’s role in institutional DeFi and settlements.
Stablecoin Use-Case: Ripple's stablecoin (RLUSD) could benefit from institutional adoption and be more deeply integrated into XRP’s ecosystem.
Whale Activity: There are reports / on-chain signals of large XRP movements, which could be accumulation or potential sell-side pressure.
#StrategyBTCPurchase #MarketPullback #TrumpBitcoinEmpire #CryptoIn401k #TrumpTariffs has been trading in a tighter range, forming a triangle / consolidation pattern.
Key support is around $2.33, while resistance is around $2.44 currently.
Trading volumes are somewhat subdued, suggesting cautious accumulation rather than full-blown bullish conviction.
---
2. Technical / Pattern-Based Outlook
Bullish Scenarios:
Fractal Pattern: Some analysts using fractal analysis see a potential move up toward $6–$7 by mid-November 2025, assuming the current channel holds.
Fibonacci Extensions: There is a more aggressive projection by some traders suggesting a target as high as $8.50+, based on Fibonacci extension levels if a breakout continues.
ETF & Institutional Flows: Analysts believe ETF momentum and institutional adoption (especially now that regulatory pressure has eased) could drive significant demand.
Long-term Target: One analyst even projects a possible $15 by the end of 2025, if bullish momentum sustains and adoption continues.
More Conservative / Base Case:
Near-term target in next few weeks: $3.05–$3.25 is cited by several sources, assuming a breakout from consolidation.
If bearish pressure hits, some suggest support could break toward $2.27–$2.30.
---
3. Fundamental / Macro Drivers
Regulatory Clarity: Ripple has resolved major legal overhang with the SEC.
Strategic Acquisition: Ripple is acquiring Hidden Road (prime brokerage) for ~$1.25B, which could strengthen XRP’s role in institutional DeFi and settlements.
Stablecoin Use-Case: Ripple's stablecoin (RLUSD) could benefit from institutional adoption and be more deeply integrated into XRP’s ecosystem.
Whale Activity: There are reports / on-chain signals of large XRP movements, which could be accumulation or potential sell-side pressure.
1
93
·
--
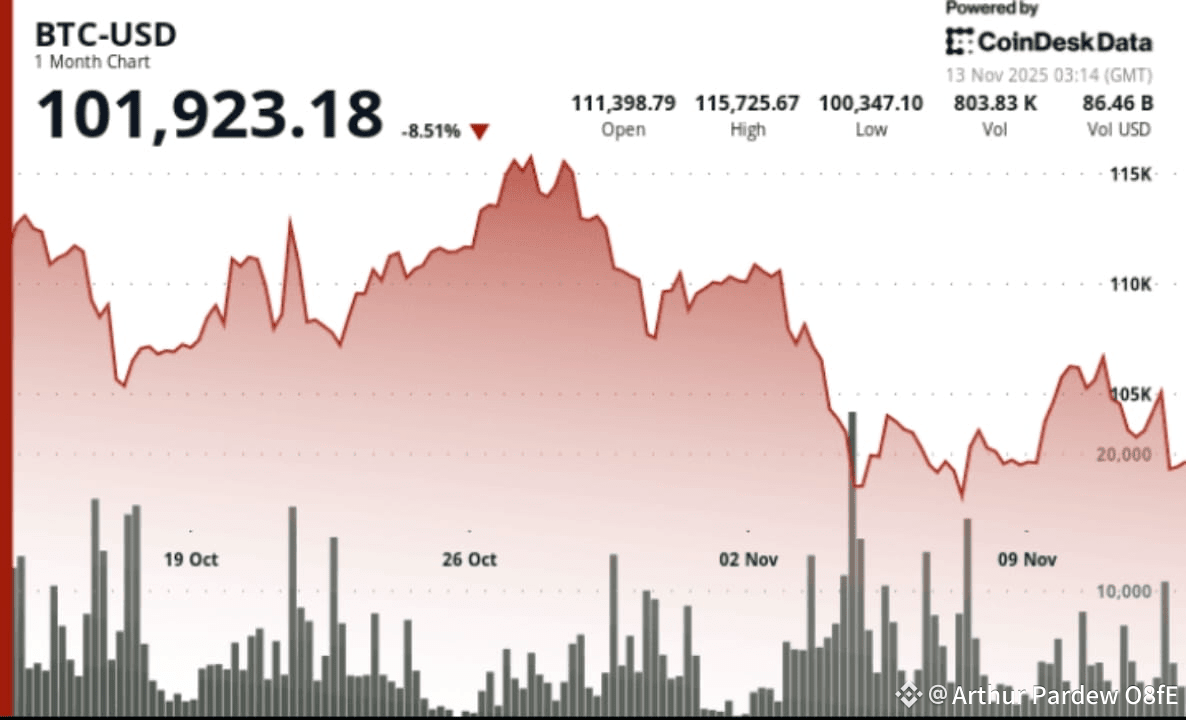
$BTC is holding a critical support around $102K. Analysts from Brave New Coin note that a rebound above $105K would be needed to sustain bullish momentum.
On the upside, resistance sits in the $120K–$125K range, according to aiTrendview.
According to technicals, if BTC breaks below $102K, downside risk could intensify.
2. Technical Signals
There was a breakdown below the 200-day moving average, which some view as a negative signal.
According to DropFinder, BTC saw a large wave of leveraged long liquidations after breaking key support around $110K.
A “death cross” (50-day MA crossing below 200-day MA) has been flagged as possible, a classic bearish signal.
3. Market Sentiment & Macro Risk
Sentiment is shaky: DropFinder’s confidence meter has dropped significantly, and many traders are less optimistic.
The U.S. Federal Reserve’s hawkish stance is weighing on BTC, reducing risk appetite.
Regulatory risk is still in play. There are growing worries about stricter crypto regulations and taxation.
4. On-Chain / Miner Dynamics
Miner selling is increasing: higher energy costs and rising difficulty are forcing some miners to liquidate.
However, there is still underlying demand: on-chain metrics (like active addresses, network hashrate) remain generally healthy.
5. Outlook & Scenarios
Bullish case: If BTC holds the $102K level and reclaims $105K+, we could see a run toward $120K+ — driven by on-chain strength, ETF flows, and macro easing.
Bearish case: A sustained break below $102K could trigger more liquidation, with potential downside toward ~$94K, especially if macro pressure continues.
Neutral / Consolidation: Some models suggest BTC is in a mid-cycle consolidation phase rather than forming a top or entering a fresh bear trend. #StrategyBTCPurchase #AmericaAIActionPlan #MarketPullback #CPIWatch #WriteToEarnUpgrade
{spot}(BTCUSDT)
$BTC is holding a critical support around $102K. Analysts from Brave New Coin note that a rebound above $105K would be needed to sustain bullish momentum.
On the upside, resistance sits in the $120K–$125K range, according to aiTrendview.
According to technicals, if BTC breaks below $102K, downside risk could intensify.
2. Technical Signals
There was a breakdown below the 200-day moving average, which some view as a negative signal.
According to DropFinder, BTC saw a large wave of leveraged long liquidations after breaking key support around $110K.
A “death cross” (50-day MA crossing below 200-day MA) has been flagged as possible, a classic bearish signal.
3. Market Sentiment & Macro Risk
Sentiment is shaky: DropFinder’s confidence meter has dropped significantly, and many traders are less optimistic.
The U.S. Federal Reserve’s hawkish stance is weighing on BTC, reducing risk appetite.
Regulatory risk is still in play. There are growing worries about stricter crypto regulations and taxation.
4. On-Chain / Miner Dynamics
Miner selling is increasing: higher energy costs and rising difficulty are forcing some miners to liquidate.
However, there is still underlying demand: on-chain metrics (like active addresses, network hashrate) remain generally healthy.
5. Outlook & Scenarios
Bullish case: If BTC holds the $102K level and reclaims $105K+, we could see a run toward $120K+ — driven by on-chain strength, ETF flows, and macro easing.
Bearish case: A sustained break below $102K could trigger more liquidation, with potential downside toward ~$94K, especially if macro pressure continues.
Neutral / Consolidation: Some models suggest BTC is in a mid-cycle consolidation phase rather than forming a top or entering a fresh bear trend. #StrategyBTCPurchase #AmericaAIActionPlan #MarketPullback #CPIWatch #WriteToEarnUpgrade
On the upside, resistance sits in the $120K–$125K range, according to aiTrendview.
According to technicals, if BTC breaks below $102K, downside risk could intensify.
2. Technical Signals
There was a breakdown below the 200-day moving average, which some view as a negative signal.
According to DropFinder, BTC saw a large wave of leveraged long liquidations after breaking key support around $110K.
A “death cross” (50-day MA crossing below 200-day MA) has been flagged as possible, a classic bearish signal.
3. Market Sentiment & Macro Risk
Sentiment is shaky: DropFinder’s confidence meter has dropped significantly, and many traders are less optimistic.
The U.S. Federal Reserve’s hawkish stance is weighing on BTC, reducing risk appetite.
Regulatory risk is still in play. There are growing worries about stricter crypto regulations and taxation.
4. On-Chain / Miner Dynamics
Miner selling is increasing: higher energy costs and rising difficulty are forcing some miners to liquidate.
However, there is still underlying demand: on-chain metrics (like active addresses, network hashrate) remain generally healthy.
5. Outlook & Scenarios
Bullish case: If BTC holds the $102K level and reclaims $105K+, we could see a run toward $120K+ — driven by on-chain strength, ETF flows, and macro easing.
Bearish case: A sustained break below $102K could trigger more liquidation, with potential downside toward ~$94K, especially if macro pressure continues.
Neutral / Consolidation: Some models suggest BTC is in a mid-cycle consolidation phase rather than forming a top or entering a fresh bear trend. #StrategyBTCPurchase #AmericaAIActionPlan #MarketPullback #CPIWatch #WriteToEarnUpgrade
4
·
--
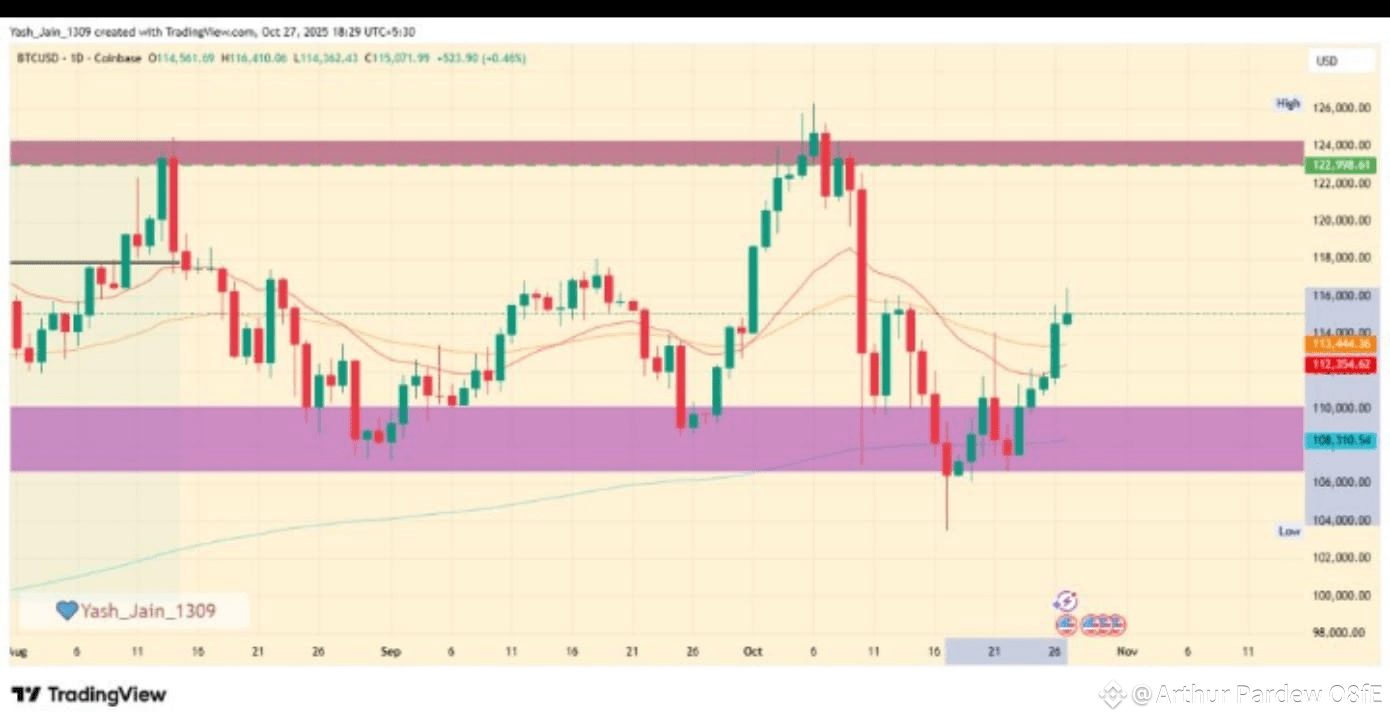
$BTC is trading in a somewhat tight range between support around $99K–$100K and resistance near $109K–$110K.
According to CoinCodex, sentiment is currently bearish, and many technical indicators lean toward downside risk.
Key support levels: around $101K per CoinCodex, with stronger zones near $99K.
On the upside, a break above $109K–$110K could trigger renewed bullish momentum.
---
2. Fundamental Drivers
ETF Inflows: Institutional demand remains a strong tailwind. Analysts note renewed confidence in spot Bitcoin ETFs.
Macro Risk: There’s tension around macro conditions and regulation, so BTC’s path isn’t without potential headwinds.
Leverage & Deleveraging: Some strategists (e.g., at JPMorgan) argue that recent deleveraging in futures markets has reduced risk, making BTC more attractive relative to gold.
Cycle Models: Some long-term models (like quantile regression) still point to very high cycle tops (e.g., $250K+ in a bullish extreme), though that’s speculative.
#StrategyBTCPurchase #MarketPullback #CPIWatch #StablecoinLaw #TrumpBitcoinEmpire
{spot}(BTCUSDT)
$BTC is trading in a somewhat tight range between support around $99K–$100K and resistance near $109K–$110K.
According to CoinCodex, sentiment is currently bearish, and many technical indicators lean toward downside risk.
Key support levels: around $101K per CoinCodex, with stronger zones near $99K.
On the upside, a break above $109K–$110K could trigger renewed bullish momentum.
---
2. Fundamental Drivers
ETF Inflows: Institutional demand remains a strong tailwind. Analysts note renewed confidence in spot Bitcoin ETFs.
Macro Risk: There’s tension around macro conditions and regulation, so BTC’s path isn’t without potential headwinds.
Leverage & Deleveraging: Some strategists (e.g., at JPMorgan) argue that recent deleveraging in futures markets has reduced risk, making BTC more attractive relative to gold.
Cycle Models: Some long-term models (like quantile regression) still point to very high cycle tops (e.g., $250K+ in a bullish extreme), though that’s speculative.
#StrategyBTCPurchase #MarketPullback #CPIWatch #StablecoinLaw #TrumpBitcoinEmpire
According to CoinCodex, sentiment is currently bearish, and many technical indicators lean toward downside risk.
Key support levels: around $101K per CoinCodex, with stronger zones near $99K.
On the upside, a break above $109K–$110K could trigger renewed bullish momentum.
---
2. Fundamental Drivers
ETF Inflows: Institutional demand remains a strong tailwind. Analysts note renewed confidence in spot Bitcoin ETFs.
Macro Risk: There’s tension around macro conditions and regulation, so BTC’s path isn’t without potential headwinds.
Leverage & Deleveraging: Some strategists (e.g., at JPMorgan) argue that recent deleveraging in futures markets has reduced risk, making BTC more attractive relative to gold.
Cycle Models: Some long-term models (like quantile regression) still point to very high cycle tops (e.g., $250K+ in a bullish extreme), though that’s speculative.
#StrategyBTCPurchase #MarketPullback #CPIWatch #StablecoinLaw #TrumpBitcoinEmpire
58
·
--
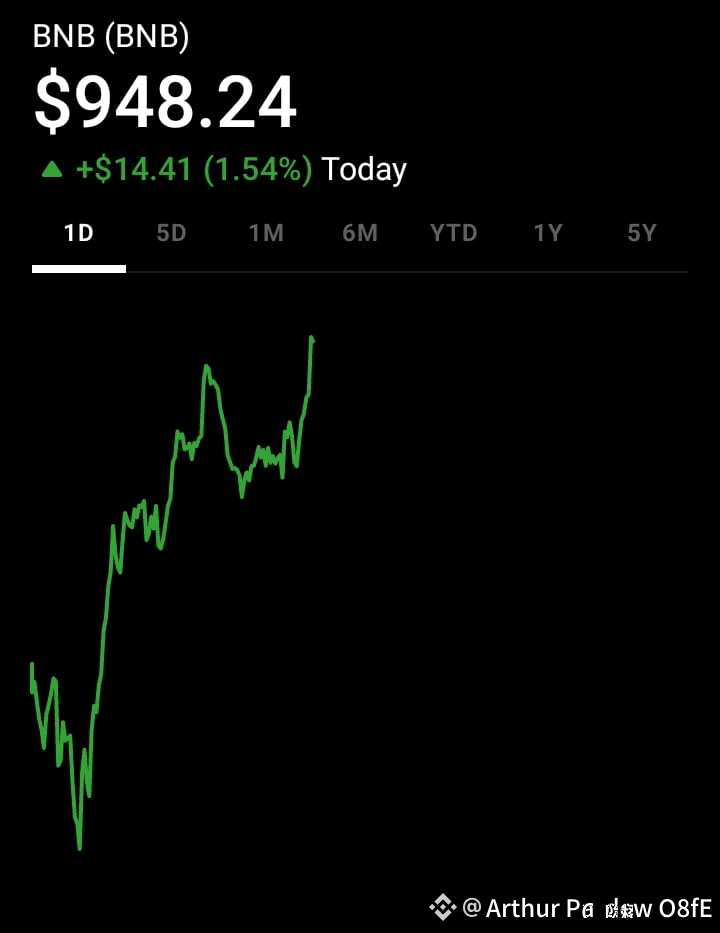
According to CoinCodex, $BNB is likely to trade in a channel around $1,039 – $1,237 through 2025.
Momentum is relatively neutral: RSI (from CoinCodex) is around the middle, suggesting no extreme overbought or oversold.
Short-term technicals (from AMB Crypto) suggest a possible rise: by mid-November 2025, average BNB price could reach ~$1,033, with a potential high near $1,105.
But there is also a risk of pullback: some analyses expect consolidation or even a dip toward $950–$1,000 in a medium-term scenario. #StrategyBTCPurchase #MarketPullback #PowellRemarks #TrumpBitcoinEmpire #AmericaAIActionPlan
{spot}(BNBUSDT)
According to CoinCodex, $BNB is likely to trade in a channel around $1,039 – $1,237 through 2025.
Momentum is relatively neutral: RSI (from CoinCodex) is around the middle, suggesting no extreme overbought or oversold.
Short-term technicals (from AMB Crypto) suggest a possible rise: by mid-November 2025, average BNB price could reach ~$1,033, with a potential high near $1,105.
But there is also a risk of pullback: some analyses expect consolidation or even a dip toward $950–$1,000 in a medium-term scenario. #StrategyBTCPurchase #MarketPullback #PowellRemarks #TrumpBitcoinEmpire #AmericaAIActionPlan
Momentum is relatively neutral: RSI (from CoinCodex) is around the middle, suggesting no extreme overbought or oversold.
Short-term technicals (from AMB Crypto) suggest a possible rise: by mid-November 2025, average BNB price could reach ~$1,033, with a potential high near $1,105.
But there is also a risk of pullback: some analyses expect consolidation or even a dip toward $950–$1,000 in a medium-term scenario. #StrategyBTCPurchase #MarketPullback #PowellRemarks #TrumpBitcoinEmpire #AmericaAIActionPlan
3
62
·
--
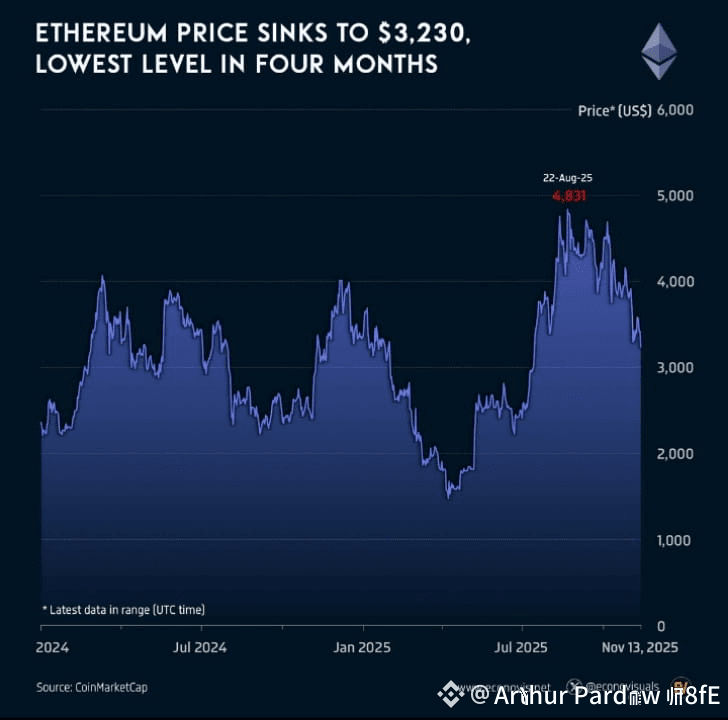
$ETH ETH recently dipped to around $3,230, marking its lowest level in four months, signaling short-term weakness.
2. Technical support is forming near $3,000–$3,500, with analysts warning that this zone is critical for bulls to defend.
3. There’s notable institutional accumulation: large “whales” have been buying ETH, suggesting long-term conviction.
4. On-chain activity is strong — Ethereum hit 24,192 transactions/sec, and burned $32M+ in fees, reinforcing its utility narrative.
5. Looking ahead, a rebound could aim for $4,300 if support holds and buying pressure returns.
6. But there are headwinds: ETF outflows recently weighed on sentiment, particularly from products like Fidelity’s FETH.
7. A major positive catalyst could arrive with the upcoming Fusaka upgrade, slated for December, which is expected to boost scalability via key EIPs. #StrategyBTCPurchase #MarketPullback #AmericaAIActionPlan #BuiltonSolayer #AITokensRally
{spot}(ETHUSDT)
$ETH ETH recently dipped to around $3,230, marking its lowest level in four months, signaling short-term weakness.
2. Technical support is forming near $3,000–$3,500, with analysts warning that this zone is critical for bulls to defend.
3. There’s notable institutional accumulation: large “whales” have been buying ETH, suggesting long-term conviction.
4. On-chain activity is strong — Ethereum hit 24,192 transactions/sec, and burned $32M+ in fees, reinforcing its utility narrative.
5. Looking ahead, a rebound could aim for $4,300 if support holds and buying pressure returns.
6. But there are headwinds: ETF outflows recently weighed on sentiment, particularly from products like Fidelity’s FETH.
7. A major positive catalyst could arrive with the upcoming Fusaka upgrade, slated for December, which is expected to boost scalability via key EIPs. #StrategyBTCPurchase #MarketPullback #AmericaAIActionPlan #BuiltonSolayer #AITokensRally
2. Technical support is forming near $3,000–$3,500, with analysts warning that this zone is critical for bulls to defend.
3. There’s notable institutional accumulation: large “whales” have been buying ETH, suggesting long-term conviction.
4. On-chain activity is strong — Ethereum hit 24,192 transactions/sec, and burned $32M+ in fees, reinforcing its utility narrative.
5. Looking ahead, a rebound could aim for $4,300 if support holds and buying pressure returns.
6. But there are headwinds: ETF outflows recently weighed on sentiment, particularly from products like Fidelity’s FETH.
7. A major positive catalyst could arrive with the upcoming Fusaka upgrade, slated for December, which is expected to boost scalability via key EIPs. #StrategyBTCPurchase #MarketPullback #AmericaAIActionPlan #BuiltonSolayer #AITokensRally
3
122
·
--
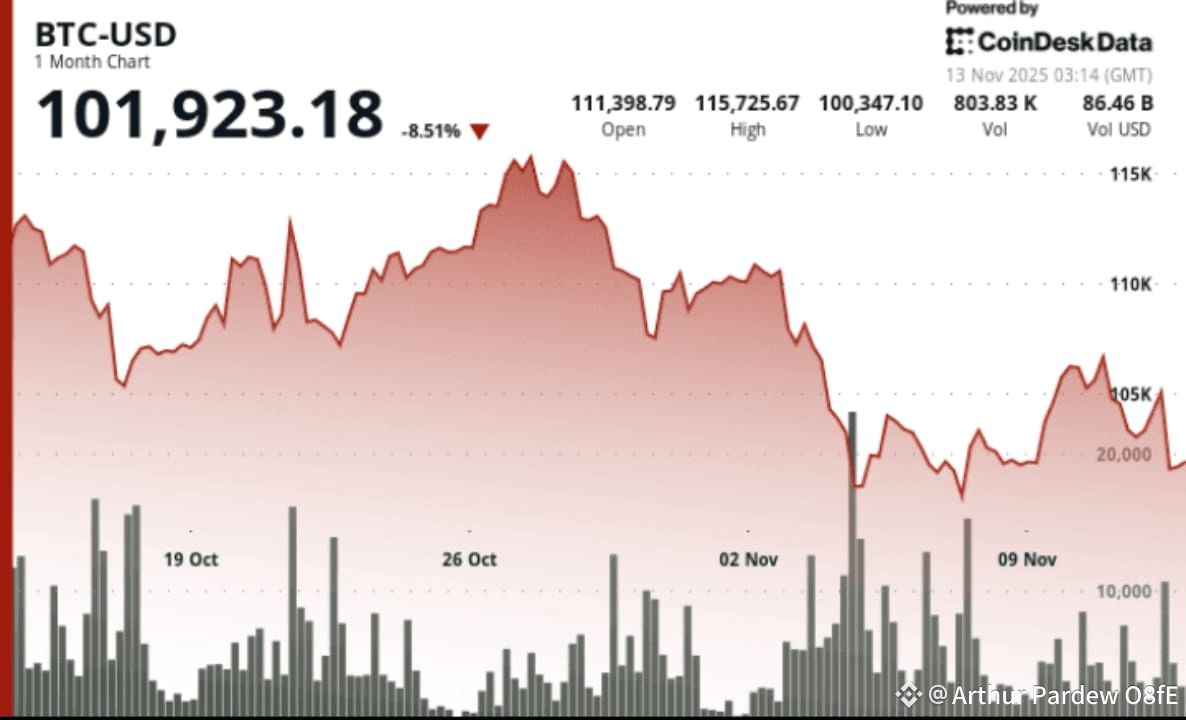
Current Price: Bitcoin is trading around $95,800–$96,000, after a recent dip.
Volatility: There’s been a breakdown on higher volume, testing key support in the $95K–$102K band.
Risk Zones:
Support: ~$95K — if broken, some analysts see risk of a drop toward $90K.
Upside Potential: On a rebound, models are eyeing targets between $BTC 125K–$134K. #StrategyBTCPurchase #MarketPullback #StablecoinLaw #IPOWave #US-EUTradeAgreement
{spot}(BTCUSDT)
Current Price: Bitcoin is trading around $95,800–$96,000, after a recent dip.
Volatility: There’s been a breakdown on higher volume, testing key support in the $95K–$102K band.
Risk Zones:
Support: ~$95K — if broken, some analysts see risk of a drop toward $90K.
Upside Potential: On a rebound, models are eyeing targets between $BTC 125K–$134K. #StrategyBTCPurchase #MarketPullback #StablecoinLaw #IPOWave #US-EUTradeAgreement
Volatility: There’s been a breakdown on higher volume, testing key support in the $95K–$102K band.
Risk Zones:
Support: ~$95K — if broken, some analysts see risk of a drop toward $90K.
Upside Potential: On a rebound, models are eyeing targets between $BTC 125K–$134K. #StrategyBTCPurchase #MarketPullback #StablecoinLaw #IPOWave #US-EUTradeAgreement
3
20
Log in to explore more content
Join global crypto users on Binance Square
⚡️ Get latest and useful information about crypto.
💬 Trusted by the world’s largest crypto exchange.
👍 Discover real insights from verified creators.
Email / Phone number