$BTC
#StrategyBTCPurchase #MarketPullback #ProjectCrypto #CPIWatch #CFTCCryptoSprint Bitcoin (BTC) Latest Analysis – November 2025
---
🔍 Current Technical Picture
1. Key Support & Resistance
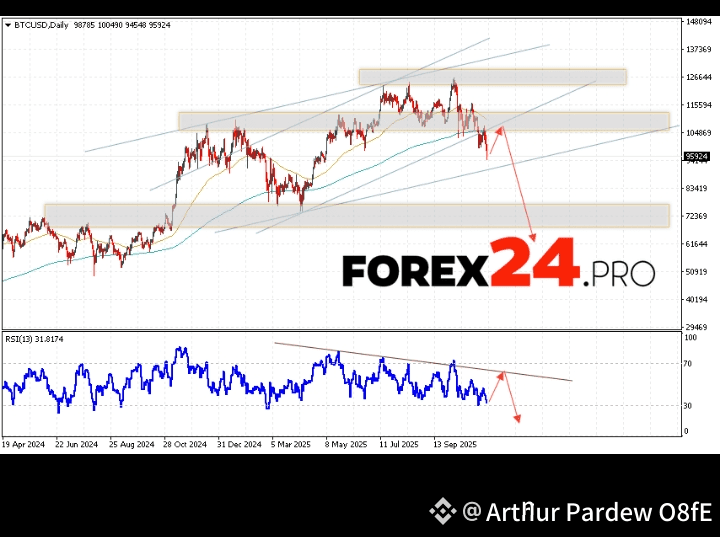
Support is forming around $107K–$110K, which is a critical zone.
On the upside, BTC is facing resistance near $120K–$125K.
2. Moving Averages & Momentum
According to LiteFinance, BTC is holding above the 200-day SMA (~$103,200) which is a long-term bullish signal.
MACD has turned upward, supporting a potential bullish continuation.
However, a breach below long-term levels could risk further downside; some analyses point to further weakness if BTC gets below its 200-day MA.
3. Pattern & Structure
There’s talk of a double-bottom around $106K–$108K, which could be setting BTC up for a bounce.
Alternatively, the current consolidation may be a mid-cycle rest rather than a major top or a reversal.
---
📈 Price Forecasts & Scenarios
Bullish Case:
According to Blockchain.News, BTC could rally to $138,183 in the near term if it breaks key resistance.
Moderate Bull Base:
Analysts cited by Coin Edition expect a breakout to ~$115K, driven by historically bullish November seasonality and increasing institutional accumulation.
Bearish Risks:
If BTC fails to hold its support zone, it could drop to ~$94,200, according to Katie Stockton (Fairlead Strategies).
CoinCodex’s model shows current sentiment is leaning bearish, with several indicators pointing to downside
#StrategyBTCPurchase #MarketPullback #ProjectCrypto #CPIWatch #CFTCCryptoSprint Bitcoin (BTC) Latest Analysis – November 2025
---
🔍 Current Technical Picture
1. Key Support & Resistance
Support is forming around $107K–$110K, which is a critical zone.
On the upside, BTC is facing resistance near $120K–$125K.
2. Moving Averages & Momentum
According to LiteFinance, BTC is holding above the 200-day SMA (~$103,200) which is a long-term bullish signal.
MACD has turned upward, supporting a potential bullish continuation.
However, a breach below long-term levels could risk further downside; some analyses point to further weakness if BTC gets below its 200-day MA.
3. Pattern & Structure
There’s talk of a double-bottom around $106K–$108K, which could be setting BTC up for a bounce.
Alternatively, the current consolidation may be a mid-cycle rest rather than a major top or a reversal.
---
📈 Price Forecasts & Scenarios
Bullish Case:
According to Blockchain.News, BTC could rally to $138,183 in the near term if it breaks key resistance.
Moderate Bull Base:
Analysts cited by Coin Edition expect a breakout to ~$115K, driven by historically bullish November seasonality and increasing institutional accumulation.
Bearish Risks:
If BTC fails to hold its support zone, it could drop to ~$94,200, according to Katie Stockton (Fairlead Strategies).
CoinCodex’s model shows current sentiment is leaning bearish, with several indicators pointing to downside