
卢建明
1.3k Posts

卢建明
Report
Block User
1 Following
36 Followers
35 Liked
Posts
·
--
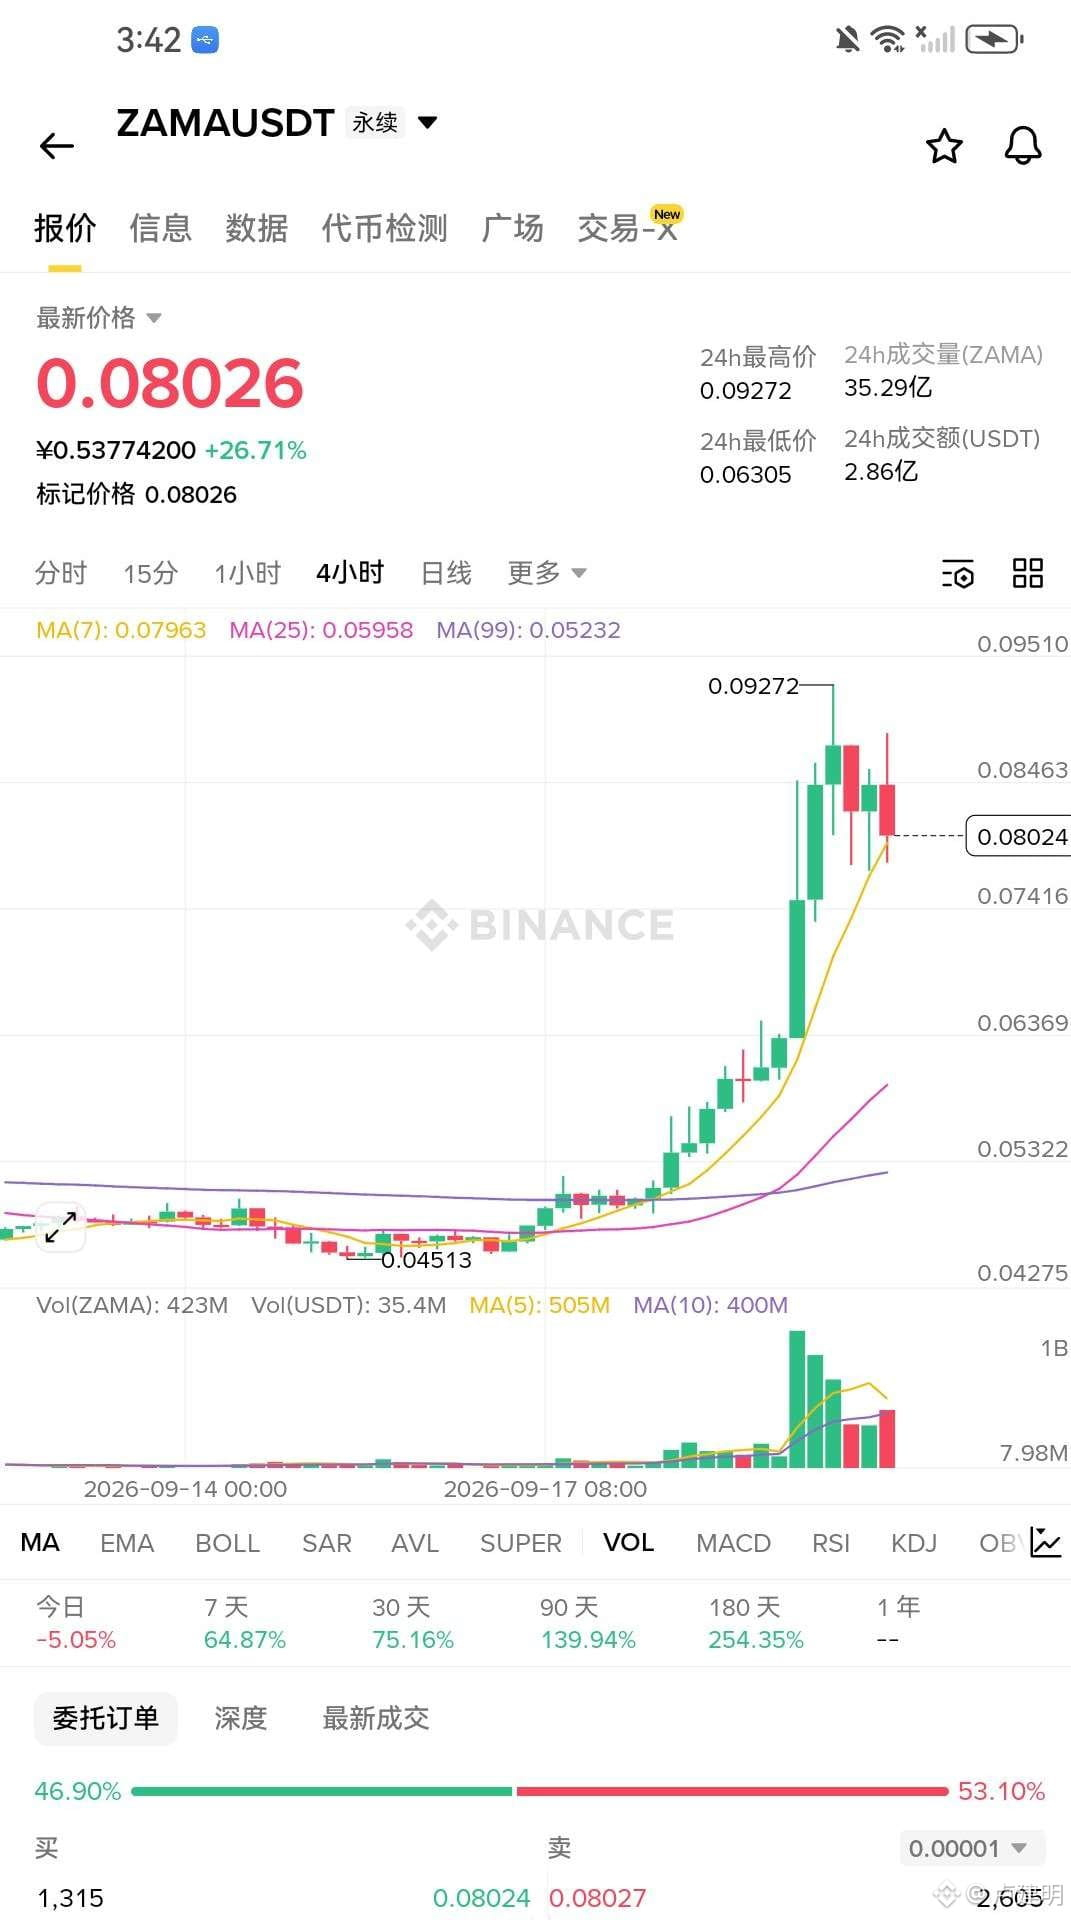
ZAMA’s price is riding new highs, with futures positions surging by nearly 80% in a single day. In the four-hour chart, candles stack up one after another with no letup—before this kind of acceleration, there are still people who dare to stand on the opposite side, basically treating themselves as a human shock-absorber. Spot capital has seen net inflows for twelve straight K-lines over the last three hours, and major orders have kept buying continuously across five consecutive K-lines without loosening their grip. This isn’t a pump-and-dump; it’s buy-more-as-it-rises. Honestly, the trend is already this obvious: it’s just one thin pane of window paper away from a new high. The shorts are still putting on a show around this price level, and when the price finally pierces that paper, they won’t even have time to regret it.
ZAMA’s price is riding new highs, with futures positions surging by nearly 80% in a single day. In the four-hour chart, candles stack up one after another with no letup—before this kind of acceleration, there are still people who dare to stand on the opposite side, basically treating themselves as a human shock-absorber. Spot capital has seen net inflows for twelve straight K-lines over the last three hours, and major orders have kept buying continuously across five consecutive K-lines without loosening their grip. This isn’t a pump-and-dump; it’s buy-more-as-it-rises. Honestly, the trend is already this obvious: it’s just one thin pane of window paper away from a new high. The shorts are still putting on a show around this price level, and when the price finally pierces that paper, they won’t even have time to regret it.
28
·
--
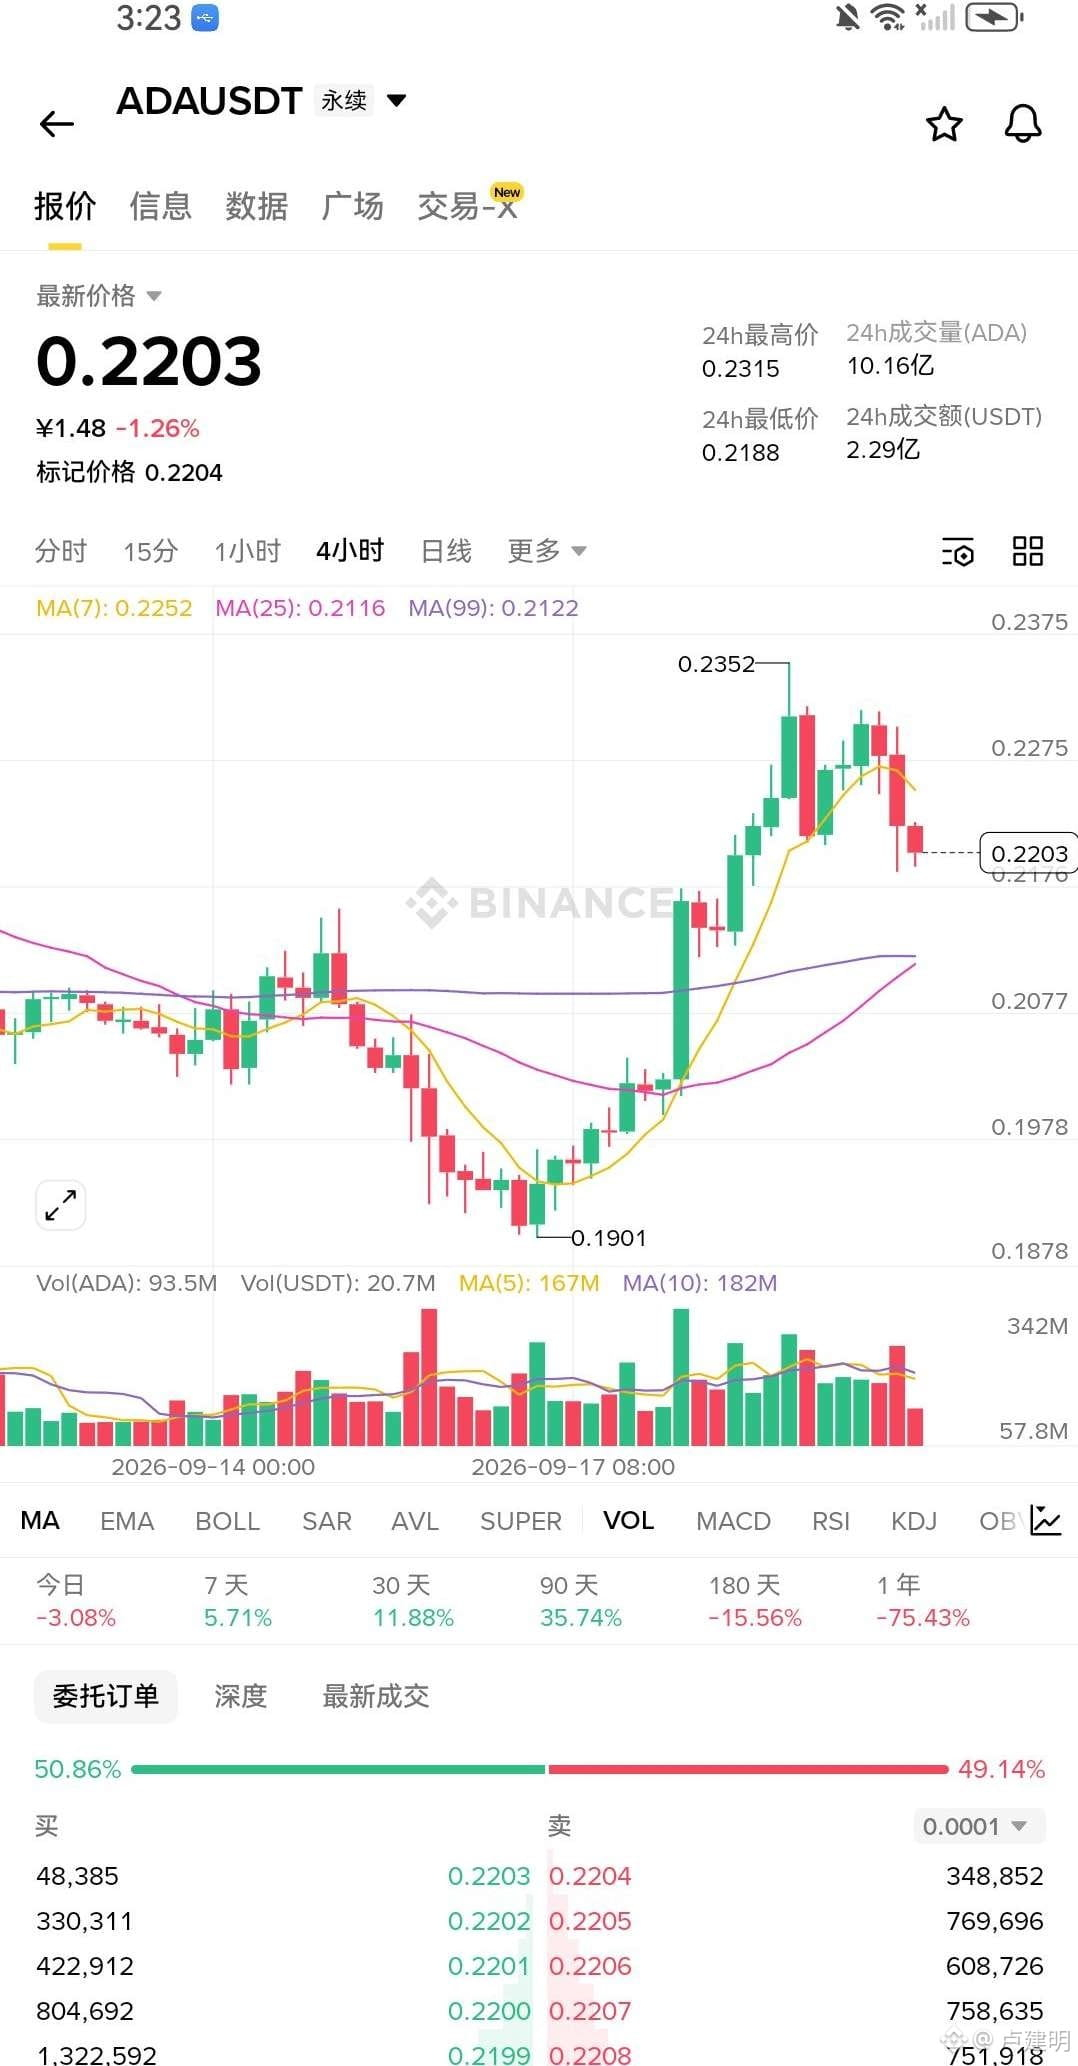
$ADA 🤣Brothers, borrowing costs are so low they’re down in the dust. The long-to-short ratio for leveraged spot has already shot up to 37x—an additional 20% climbed in just twelve hours. This kind of money isn’t something retail investors can scrape together—it's 🐶 the big player quietly scheming, adding leverage to hoard inventory. Low-priced borrowed coins, a huge bet on longs, and the supply of shares is still getting tighter. With this whole combo, if you still can’t see it, then what are you looking at? Pure hardcore hype is here—but the fuel is real. Hold your position and don’t sell—bigger moves are still coming.
$ADA 🤣Brothers, borrowing costs are so low they’re down in the dust. The long-to-short ratio for leveraged spot has already shot up to 37x—an additional 20% climbed in just twelve hours. This kind of money isn’t something retail investors can scrape together—it's 🐶 the big player quietly scheming, adding leverage to hoard inventory. Low-priced borrowed coins, a huge bet on longs, and the supply of shares is still getting tighter. With this whole combo, if you still can’t see it, then what are you looking at? Pure hardcore hype is here—but the fuel is real. Hold your position and don’t sell—bigger moves are still coming.
27
·
--
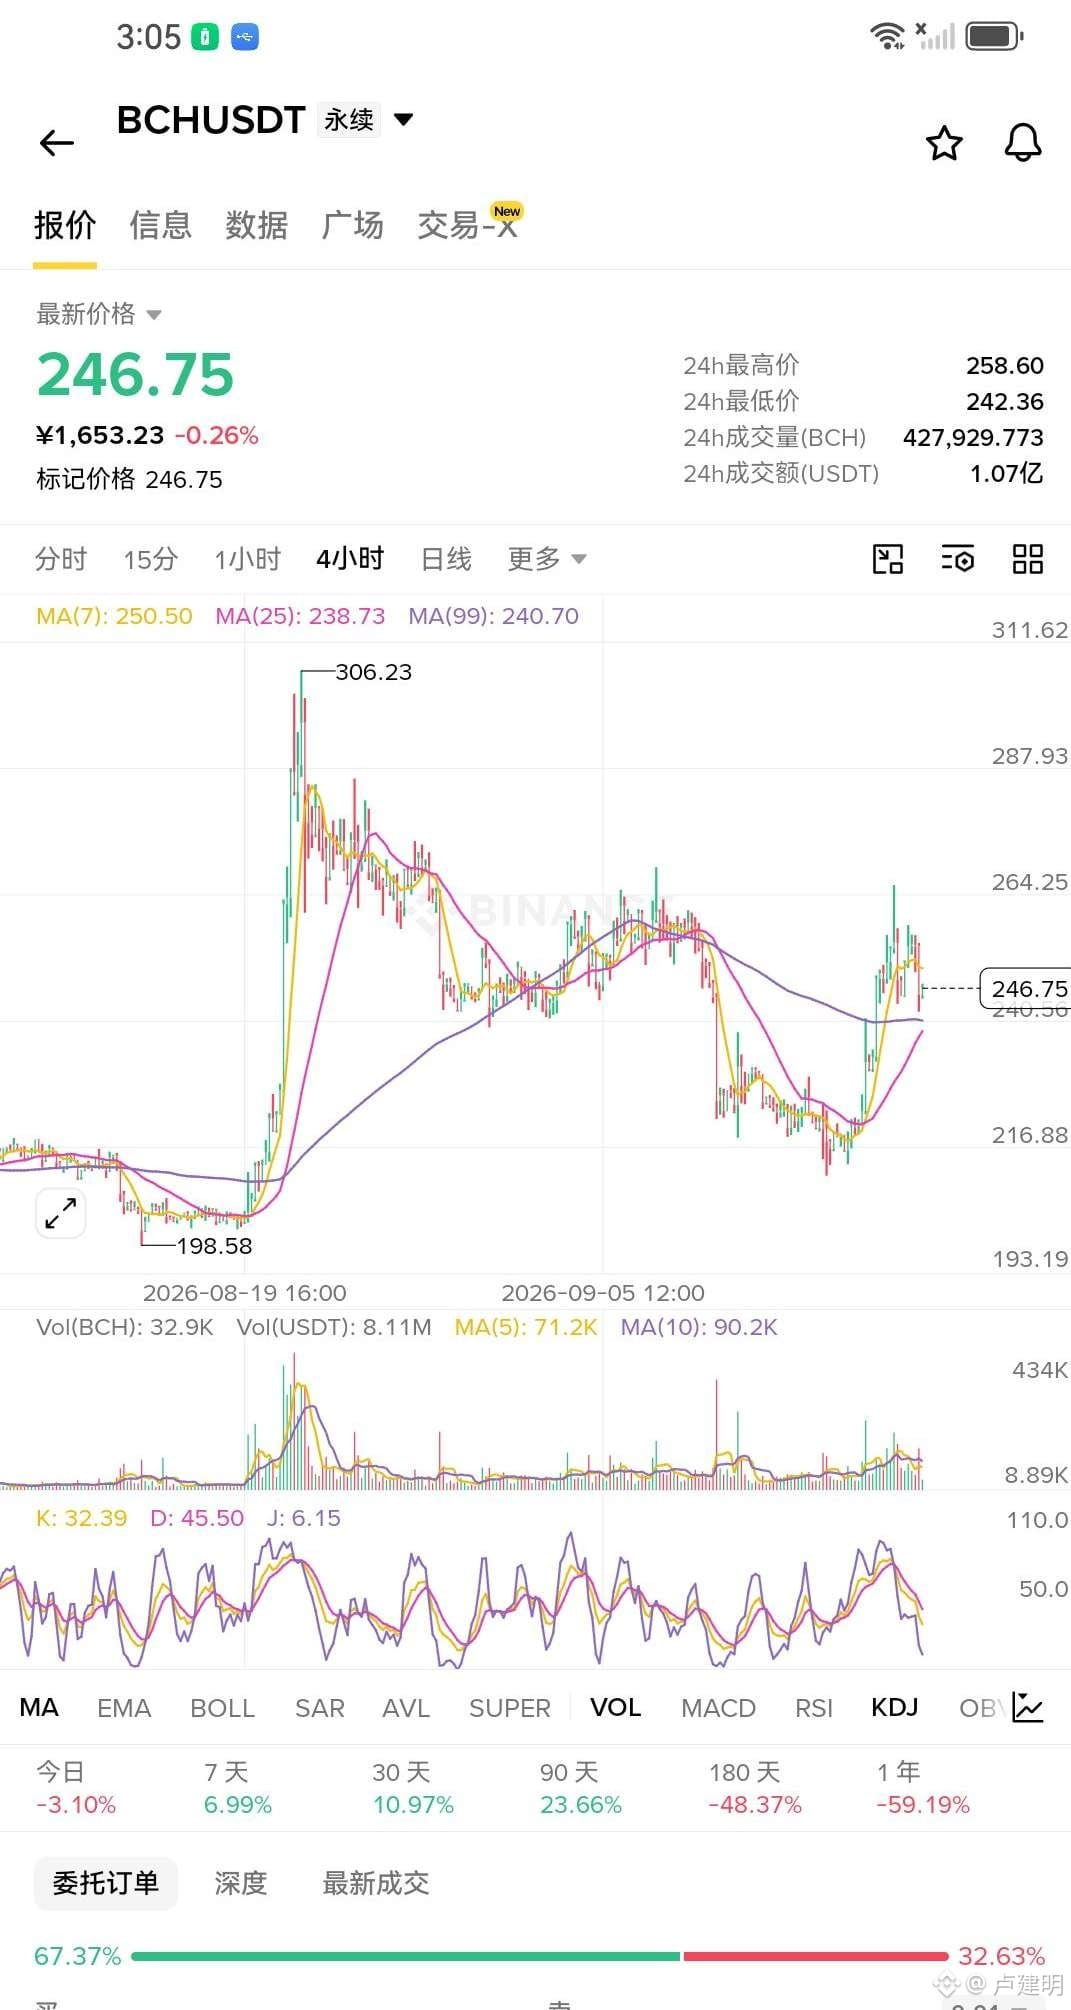
$BCH rebound is over——266 if you didn’t touch it, someone pressed you back 246; held for a day and cut 8.6%. Spot large orders flowed out 1775u with no hesitation. This isn’t a washout; this is distribution! 246.82 shorts straight in. First target 236—if it breaks, keep watching. Stop loss at 260. If it reclaims it, I’ll admit defeat.
$BCH rebound is over——266 if you didn’t touch it, someone pressed you back 246; held for a day and cut 8.6%. Spot large orders flowed out 1775u with no hesitation. This isn’t a washout; this is distribution! 246.82 shorts straight in. First target 236—if it breaks, keep watching. Stop loss at 260. If it reclaims it, I’ll admit defeat.
23
·
--
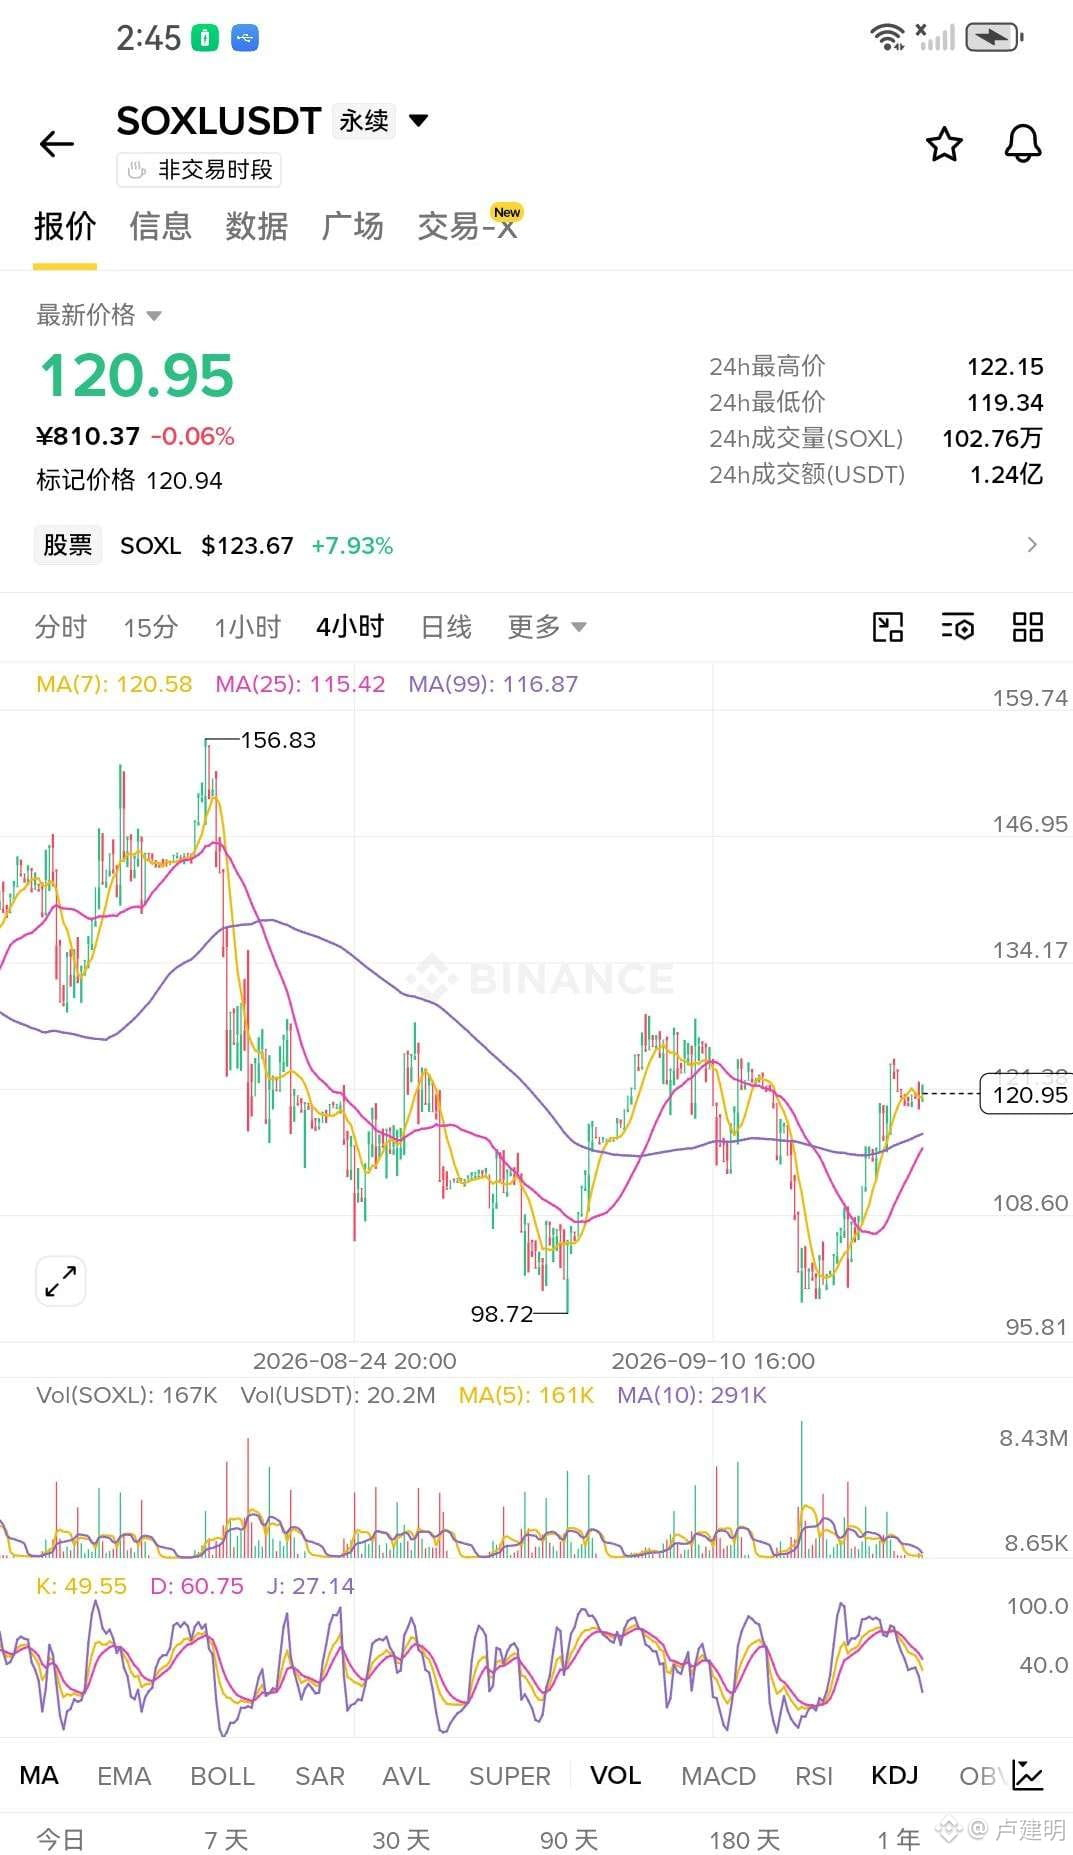
SOXL, brothers, wake up quickly—this board is being played too recklessly. The whale account’s value shrank by more than half within seven hours, and the long position share dropped in sync. This is the classic playbook of “pull up and retreat.” Retail longs are still above 70% smiling—once the ride gets lifted to this point, who lifts it, who ends up taking the bag? On the contract side, they actively sell volume to suppress buying volume and keep hitting bids with volume just as the fill ratio slips below 1:1. I truly admire the market maker’s control tactics—don’t let yourself end up standing guard at the high. Set your stop-loss properly and then enter again.
SOXL, brothers, wake up quickly—this board is being played too recklessly. The whale account’s value shrank by more than half within seven hours, and the long position share dropped in sync. This is the classic playbook of “pull up and retreat.” Retail longs are still above 70% smiling—once the ride gets lifted to this point, who lifts it, who ends up taking the bag? On the contract side, they actively sell volume to suppress buying volume and keep hitting bids with volume just as the fill ratio slips below 1:1. I truly admire the market maker’s control tactics—don’t let yourself end up standing guard at the high. Set your stop-loss properly and then enter again.
30
·
--
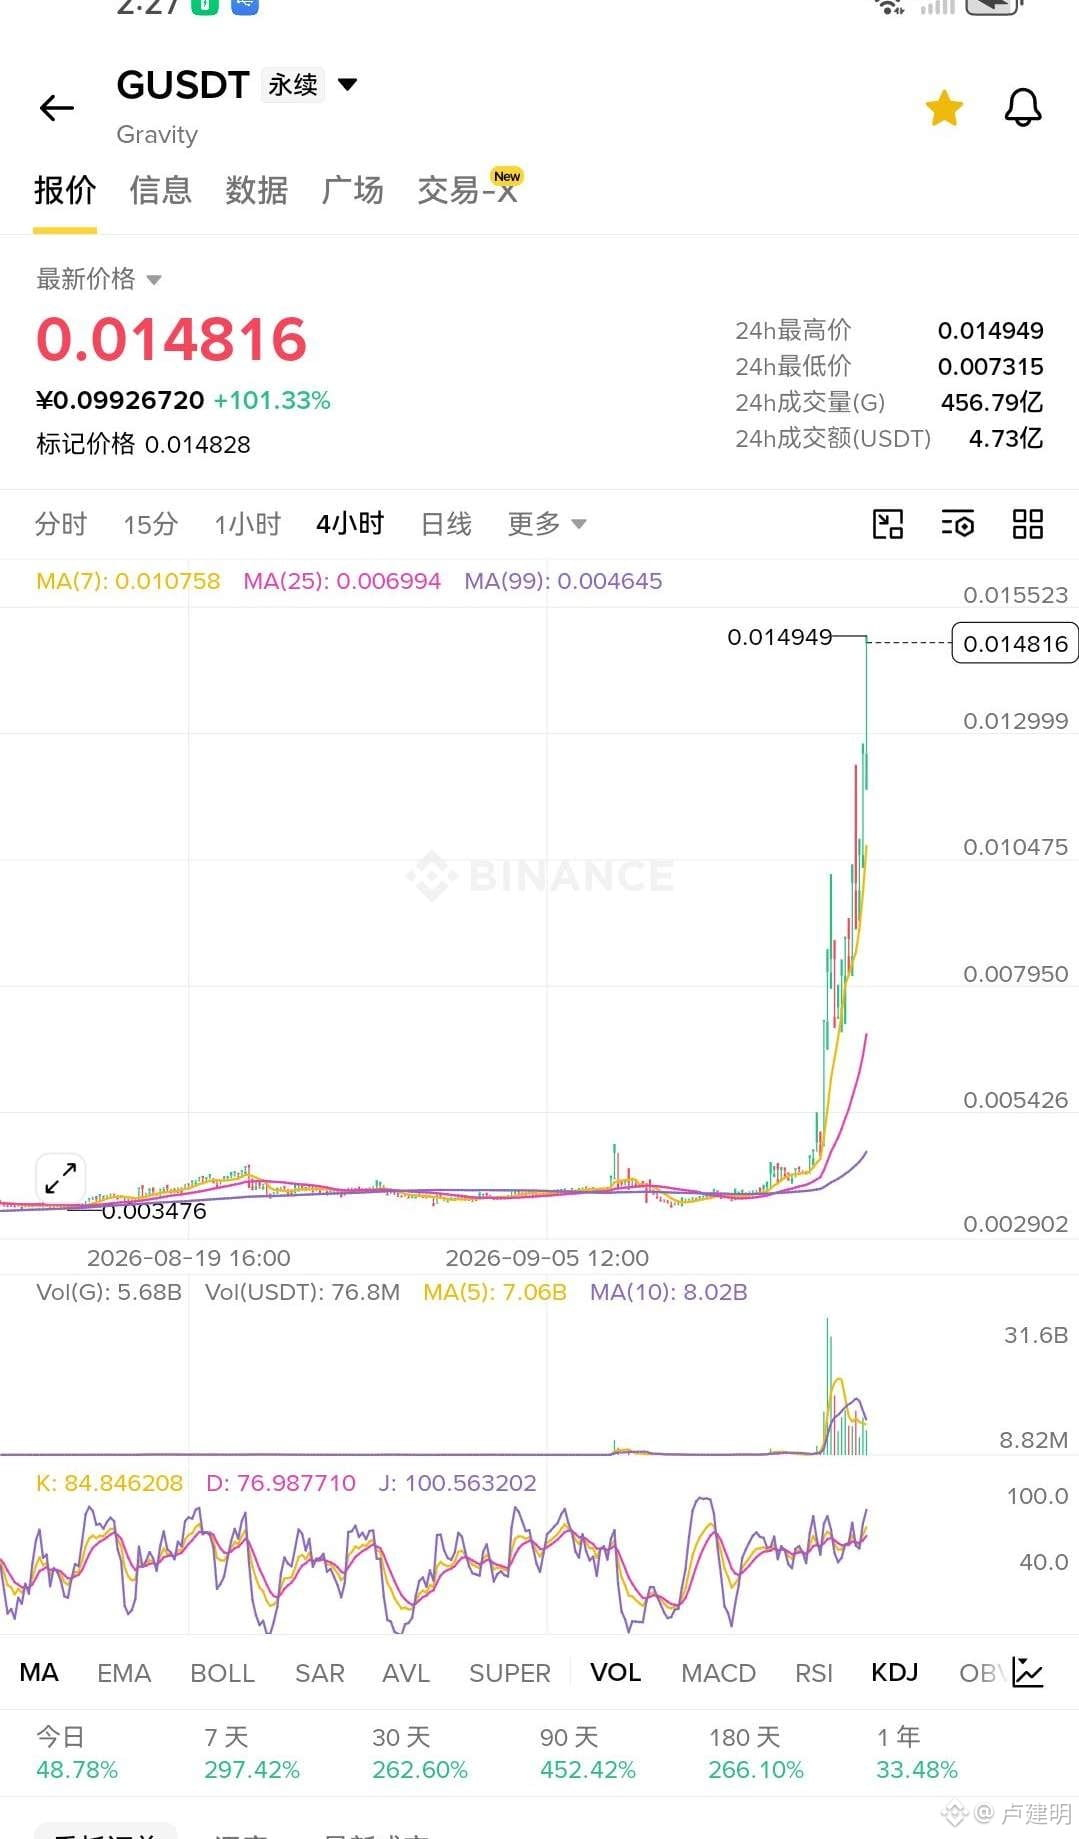
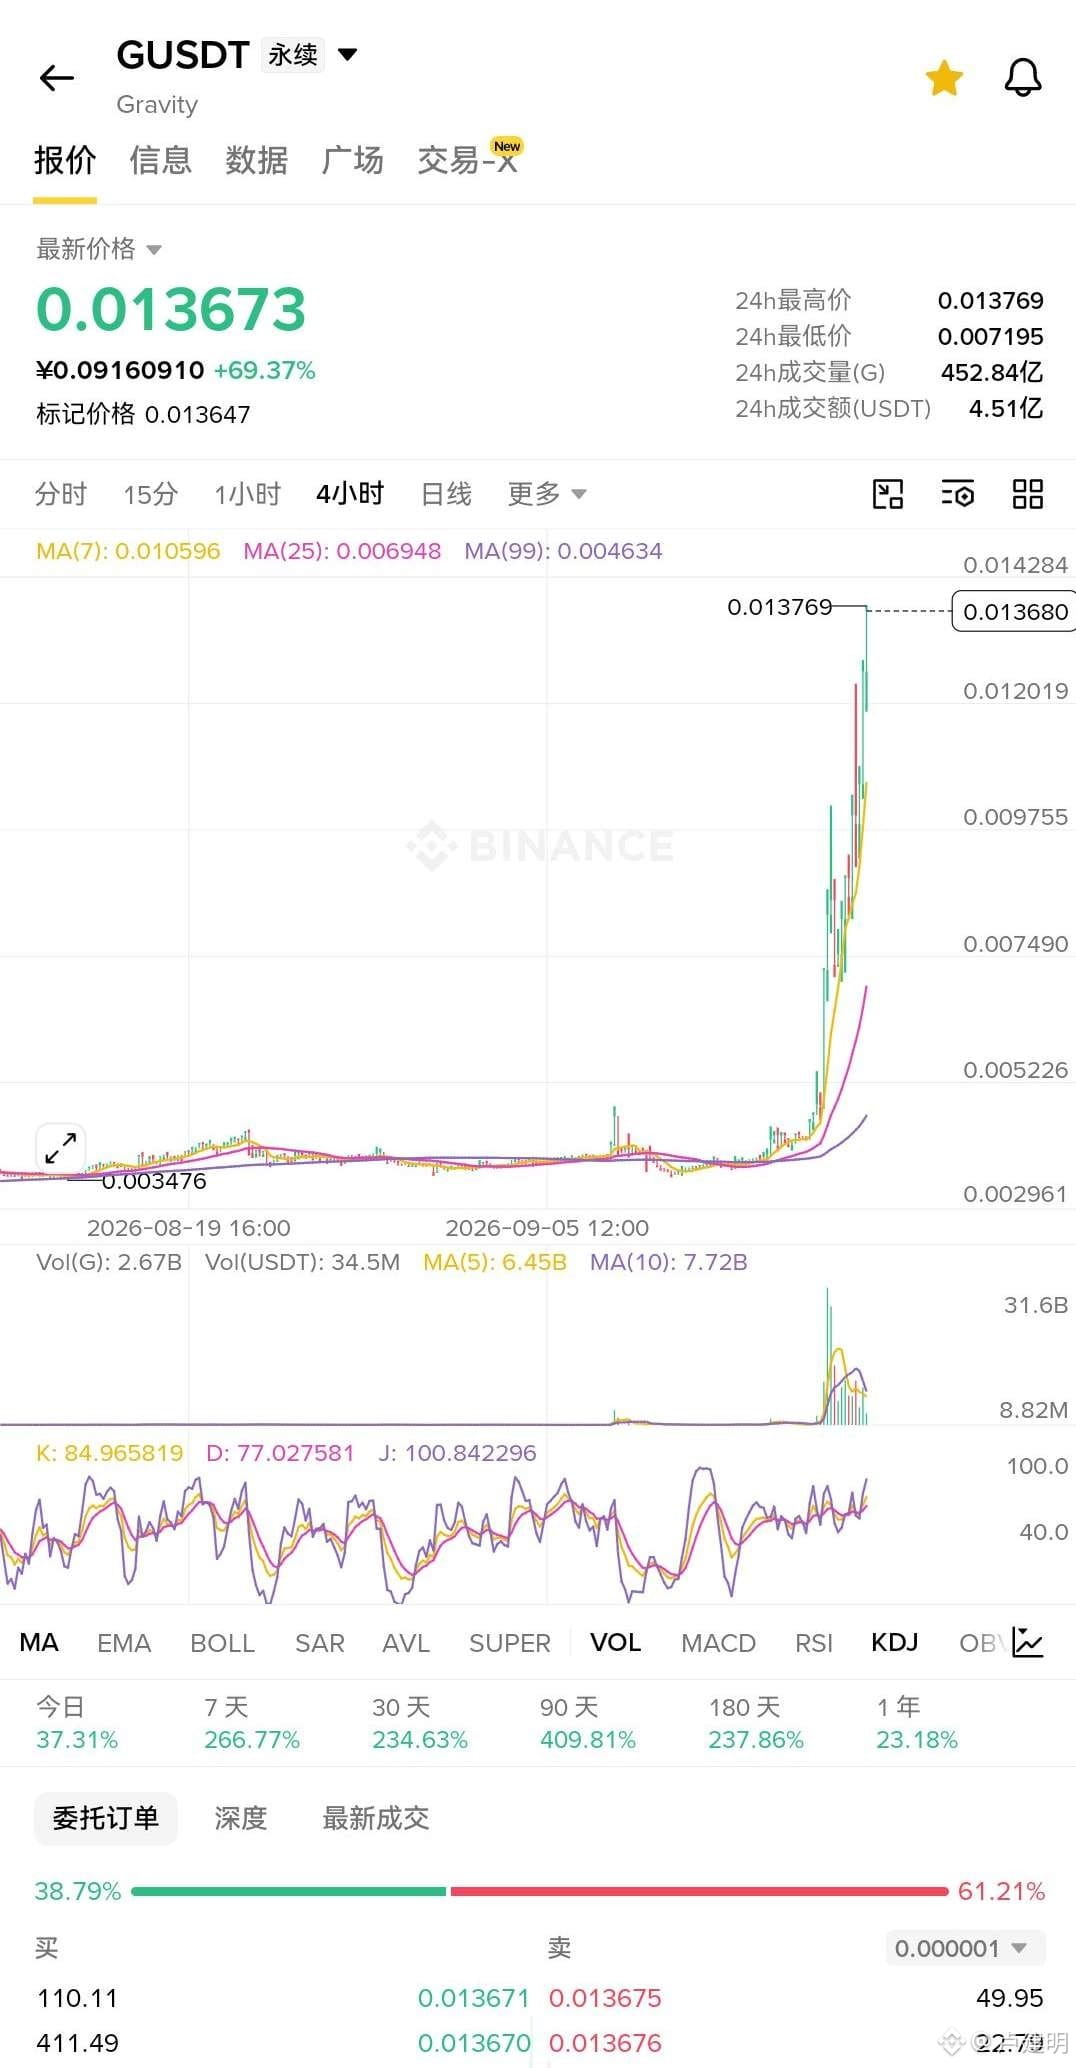
G The moving averages are all firmly underfoot; the price is just one thin layer of window paper away from the recent short-term high. On the four-hour chart, all six candlesticks have been without a single green one—what else is there to worry about with this trend? The bulls keep pushing higher by stepping up along the moving averages; the more they push, the higher it goes. The bears can’t even manage a decent counterattack. Don’t wait for a pullback—this momentum is still here. Just sit tight and wait for it to take off.
G The moving averages are all firmly underfoot; the price is just one thin layer of window paper away from the recent short-term high. On the four-hour chart, all six candlesticks have been without a single green one—what else is there to worry about with this trend? The bulls keep pushing higher by stepping up along the moving averages; the more they push, the higher it goes. The bears can’t even manage a decent counterattack. Don’t wait for a pullback—this momentum is still here. Just sit tight and wait for it to take off.
156
·
--
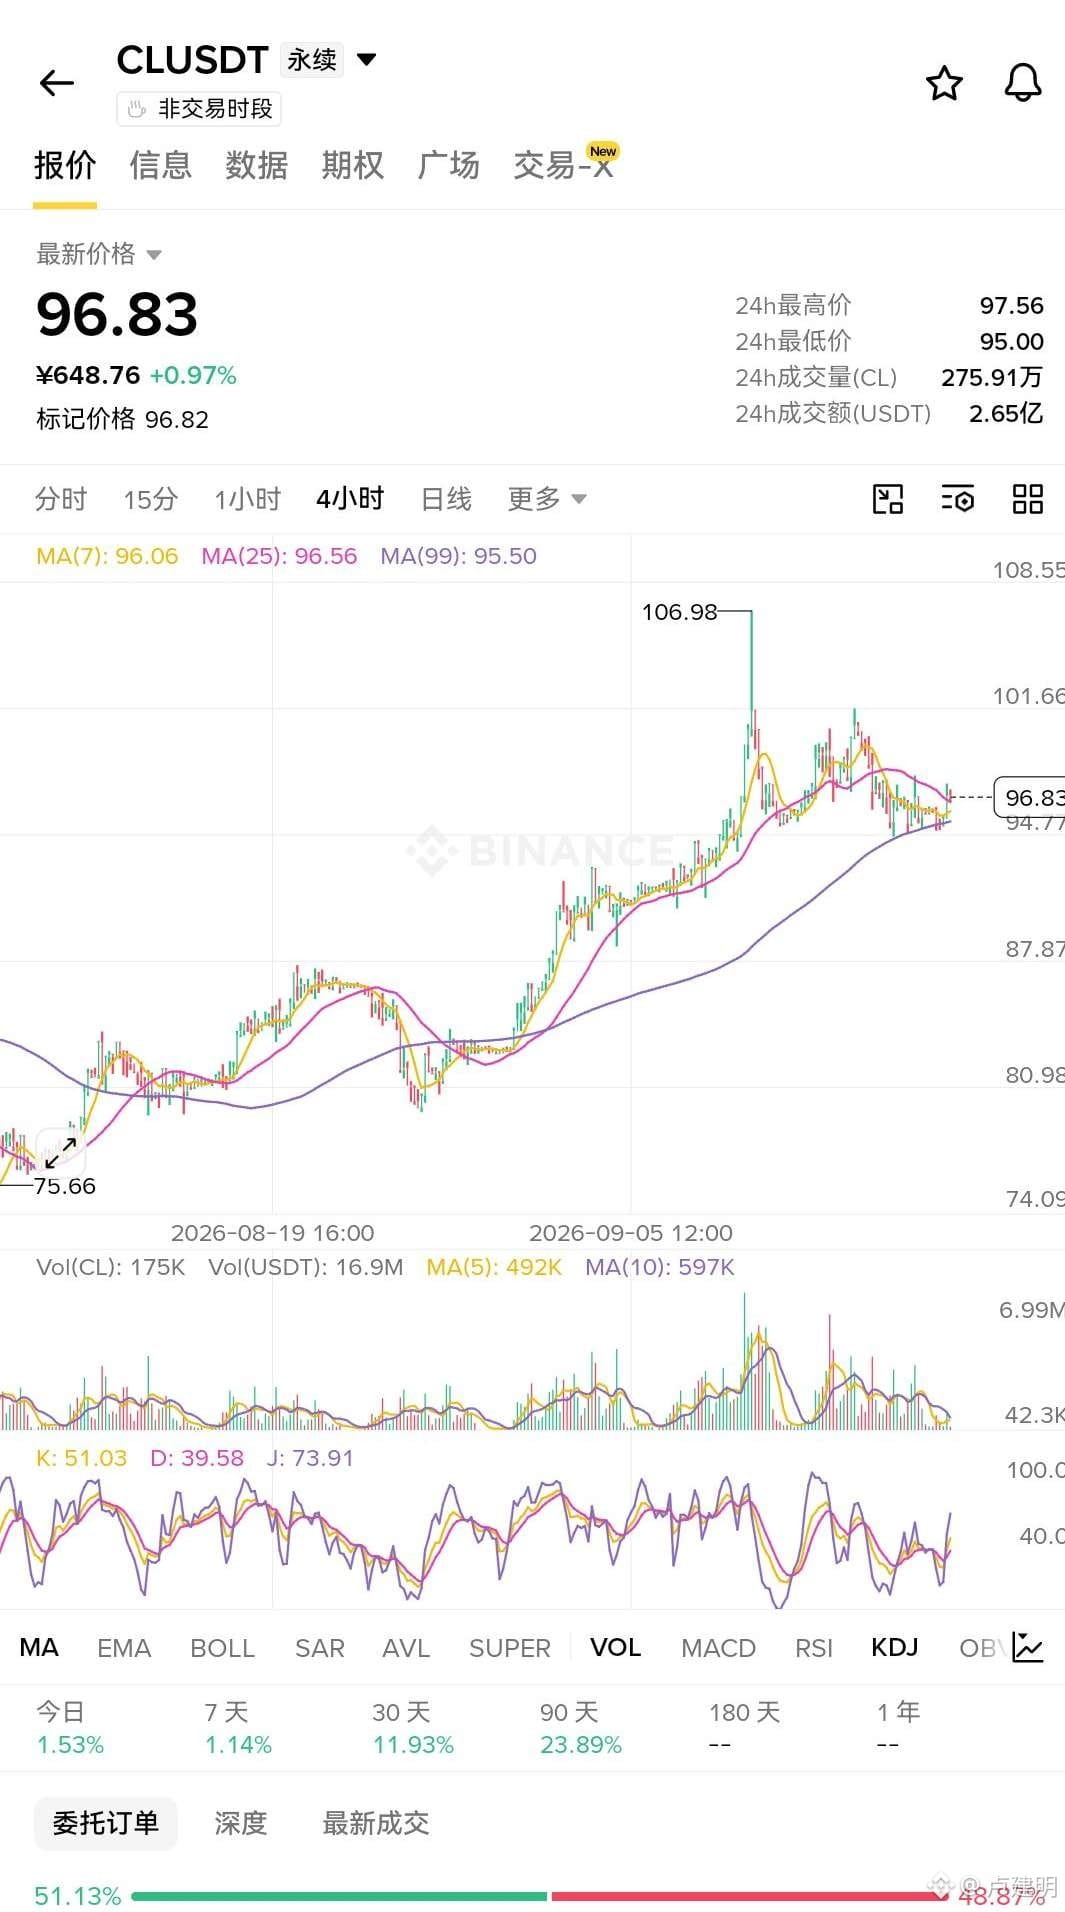
How can I look at this trend—price is still sitting above the moving average, not breaking down yet, but the actual buy volume that actively takes the entry has already shrunk to less than 40%. Sell orders are pressing against the buy side, and the trading value has dropped sharply from its earlier high. This kind of rise is being propped up by short-covering, not fresh capital. New “ammunition” hasn’t come in, and on the big players’ side the share of long positions has kept falling by more than three percentage points. If it can’t be pulled higher, what’s the point? Once the force for the short-covering stops, this price action becomes an air castle. For the brothers standing on top of it—take care of yourselves.
How can I look at this trend—price is still sitting above the moving average, not breaking down yet, but the actual buy volume that actively takes the entry has already shrunk to less than 40%. Sell orders are pressing against the buy side, and the trading value has dropped sharply from its earlier high. This kind of rise is being propped up by short-covering, not fresh capital. New “ammunition” hasn’t come in, and on the big players’ side the share of long positions has kept falling by more than three percentage points. If it can’t be pulled higher, what’s the point? Once the force for the short-covering stops, this price action becomes an air castle. For the brothers standing on top of it—take care of yourselves.
69
·
--
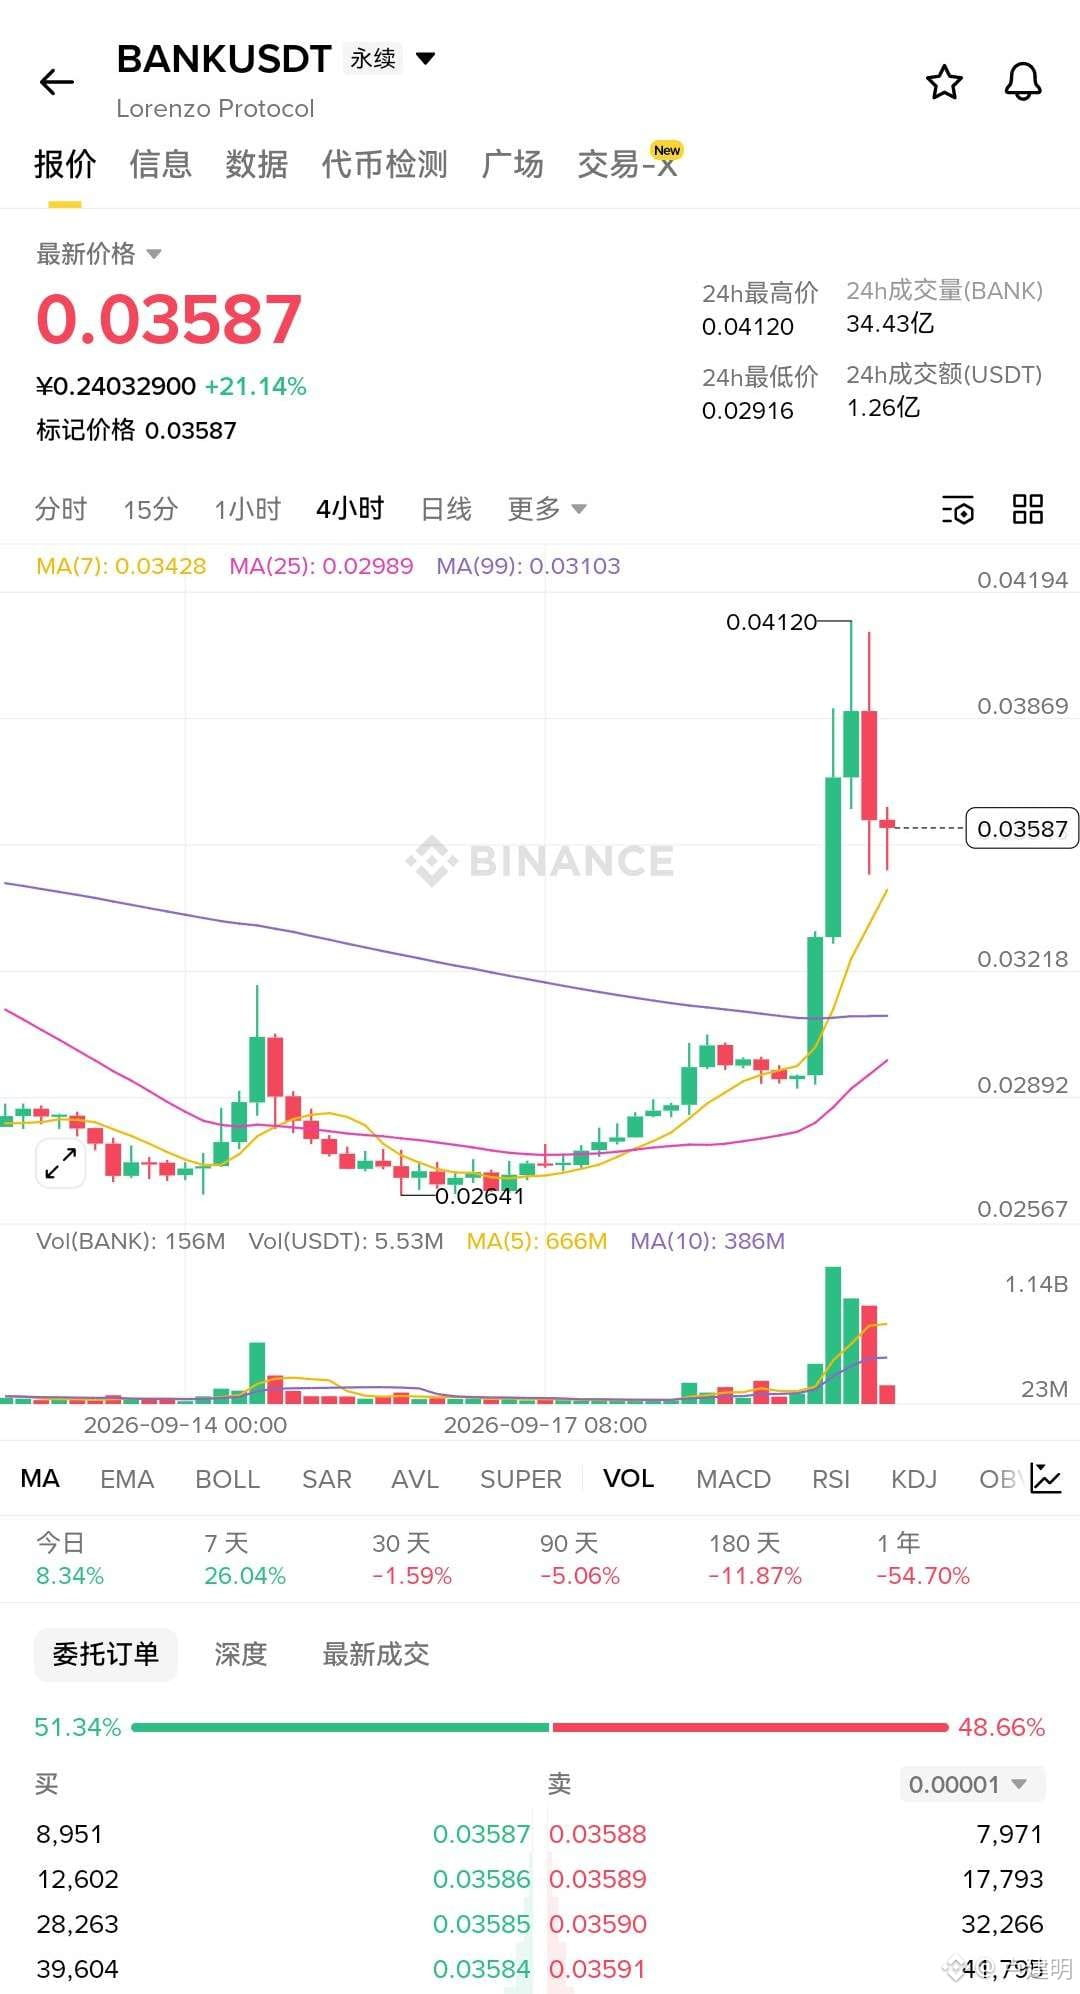
This slap-fight hits hard—within minutes the position size steps up one level after another. In the main accounts, the long side’s share is already nearing 70% and they’re still adding. You say this is distribution? Would someone distributing actually keep stacking positions higher and higher? A short-term pullback looks scary, but on the four-hour timeframe the trend hasn’t loosened at all—it's still pushing upward. The shorts are treating this little correction as a reversal signal; once price surges higher again, they won’t even get a chance to get on board.
This slap-fight hits hard—within minutes the position size steps up one level after another. In the main accounts, the long side’s share is already nearing 70% and they’re still adding. You say this is distribution? Would someone distributing actually keep stacking positions higher and higher? A short-term pullback looks scary, but on the four-hour timeframe the trend hasn’t loosened at all—it's still pushing upward. The shorts are treating this little correction as a reversal signal; once price surges higher again, they won’t even get a chance to get on board.
85
·
--
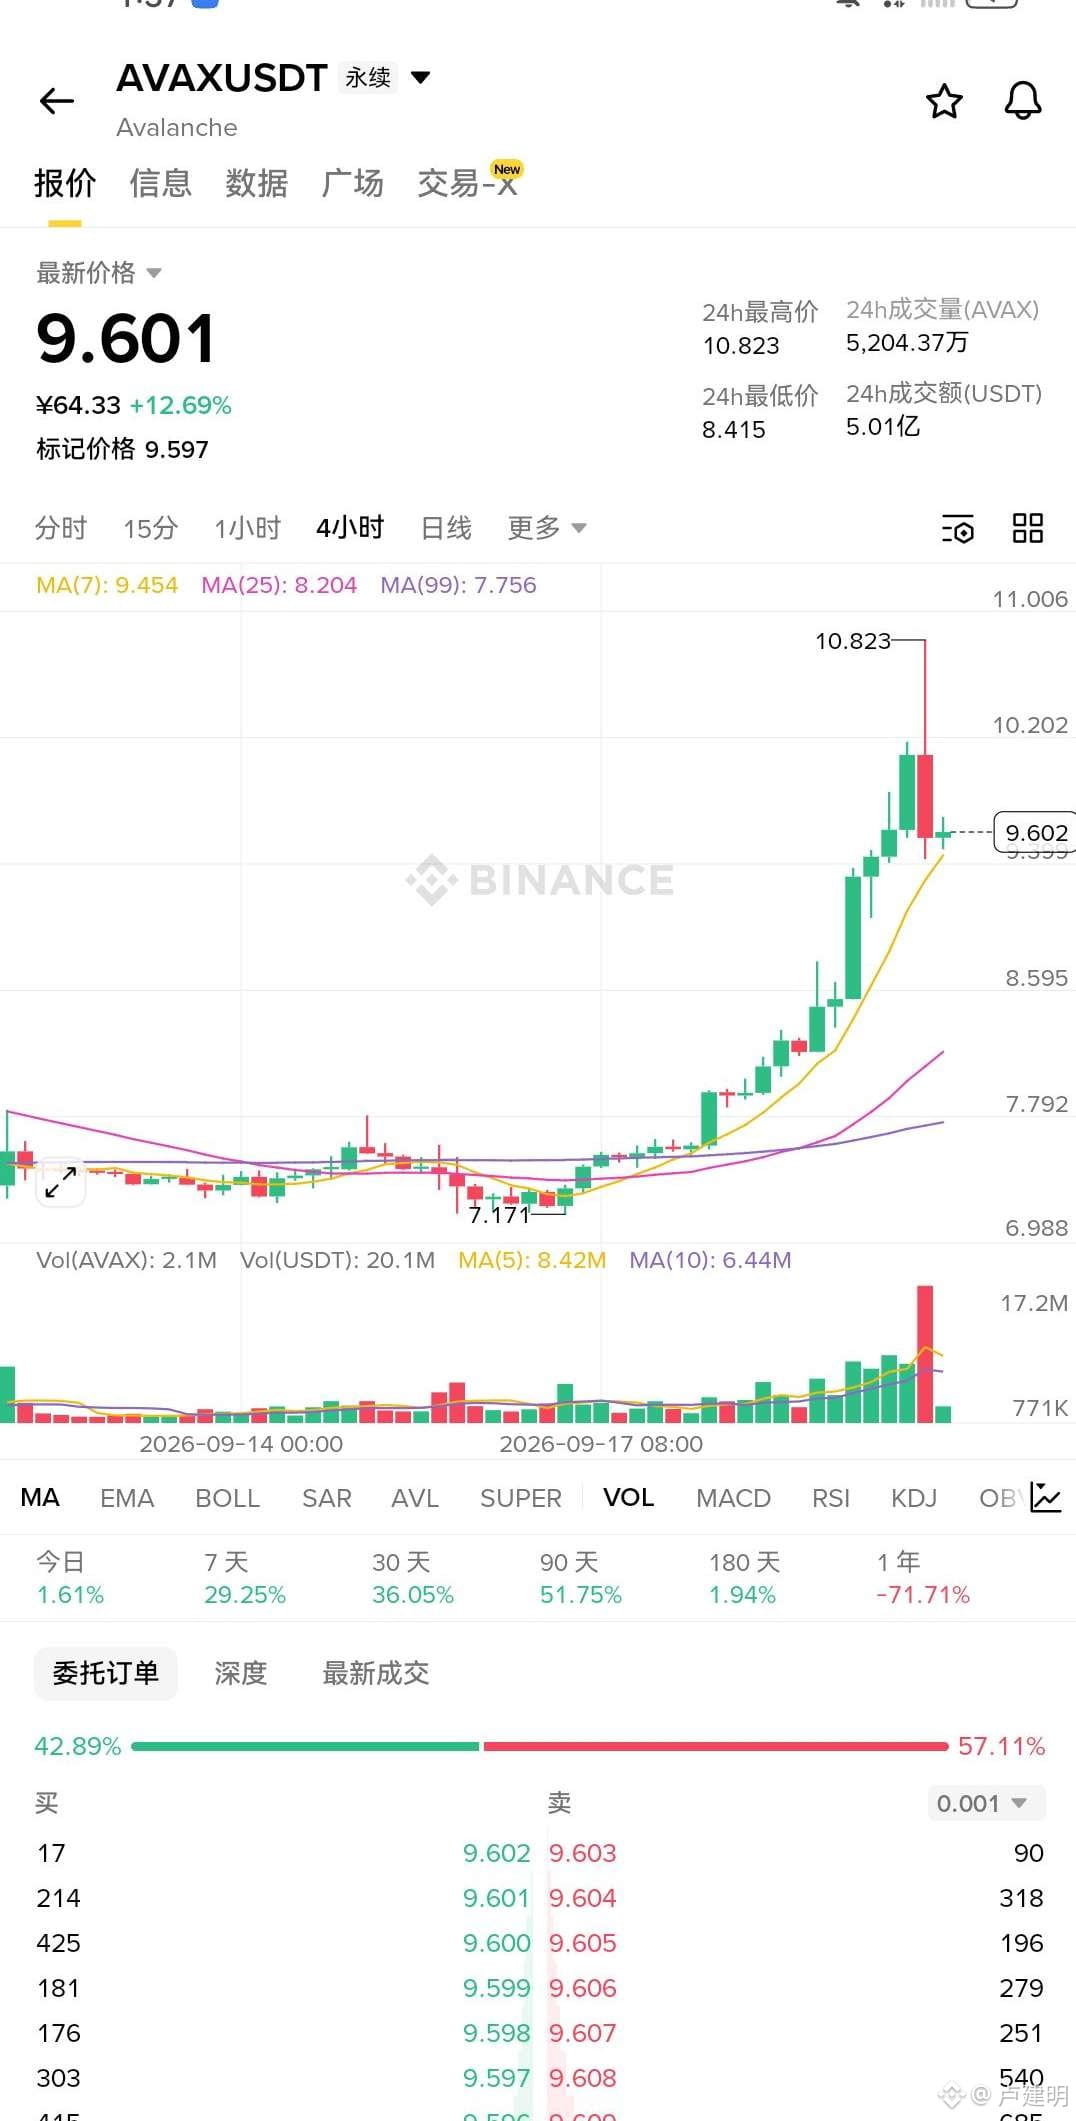
Can an AVAX short-term pullback still be called weak? On the four-hour timeframe, the directional structure hasn’t really broken at all. The candles are being stacked one by one upward, and the rebound from the lows is already visibly obvious to the naked eye. Derivatives open interest jumped by 30% in a single day—when price dips lower, positions are piled higher. This isn’t panic selling; it’s accumulation. Then look at on-chain leverage: over the past twelve hours, the borrowed funds have more than doubled—someone is borrowing money with long positions. Spot large orders have been net outflow these past couple of days, but those people have been selling for the last five K-lines, and after they sell, price hasn’t fallen back to the original point. What does that mean? It means the sell pressure is being absorbed. A short-term pullback is like compressing a spring downward so it can spring higher—don’t hand over your positions before takeoff.
Can an AVAX short-term pullback still be called weak? On the four-hour timeframe, the directional structure hasn’t really broken at all. The candles are being stacked one by one upward, and the rebound from the lows is already visibly obvious to the naked eye. Derivatives open interest jumped by 30% in a single day—when price dips lower, positions are piled higher. This isn’t panic selling; it’s accumulation. Then look at on-chain leverage: over the past twelve hours, the borrowed funds have more than doubled—someone is borrowing money with long positions. Spot large orders have been net outflow these past couple of days, but those people have been selling for the last five K-lines, and after they sell, price hasn’t fallen back to the original point. What does that mean? It means the sell pressure is being absorbed. A short-term pullback is like compressing a spring downward so it can spring higher—don’t hand over your positions before takeoff.
2
·
--
G You don’t need to guess this time. For nearly the past three hours, there has been zero net outflow of spot funds; twelve consecutive candlesticks show net inflow— and the big orders have even been buying non-stop across five consecutive candlesticks. This is buying while price is rising, not pumping to dump. The capital has already voted with its feet—just hold in line with the trend. The remaining gains are still substantial.
G You don’t need to guess this time. For nearly the past three hours, there has been zero net outflow of spot funds; twelve consecutive candlesticks show net inflow— and the big orders have even been buying non-stop across five consecutive candlesticks. This is buying while price is rising, not pumping to dump. The capital has already voted with its feet—just hold in line with the trend. The remaining gains are still substantial.
131
·
--
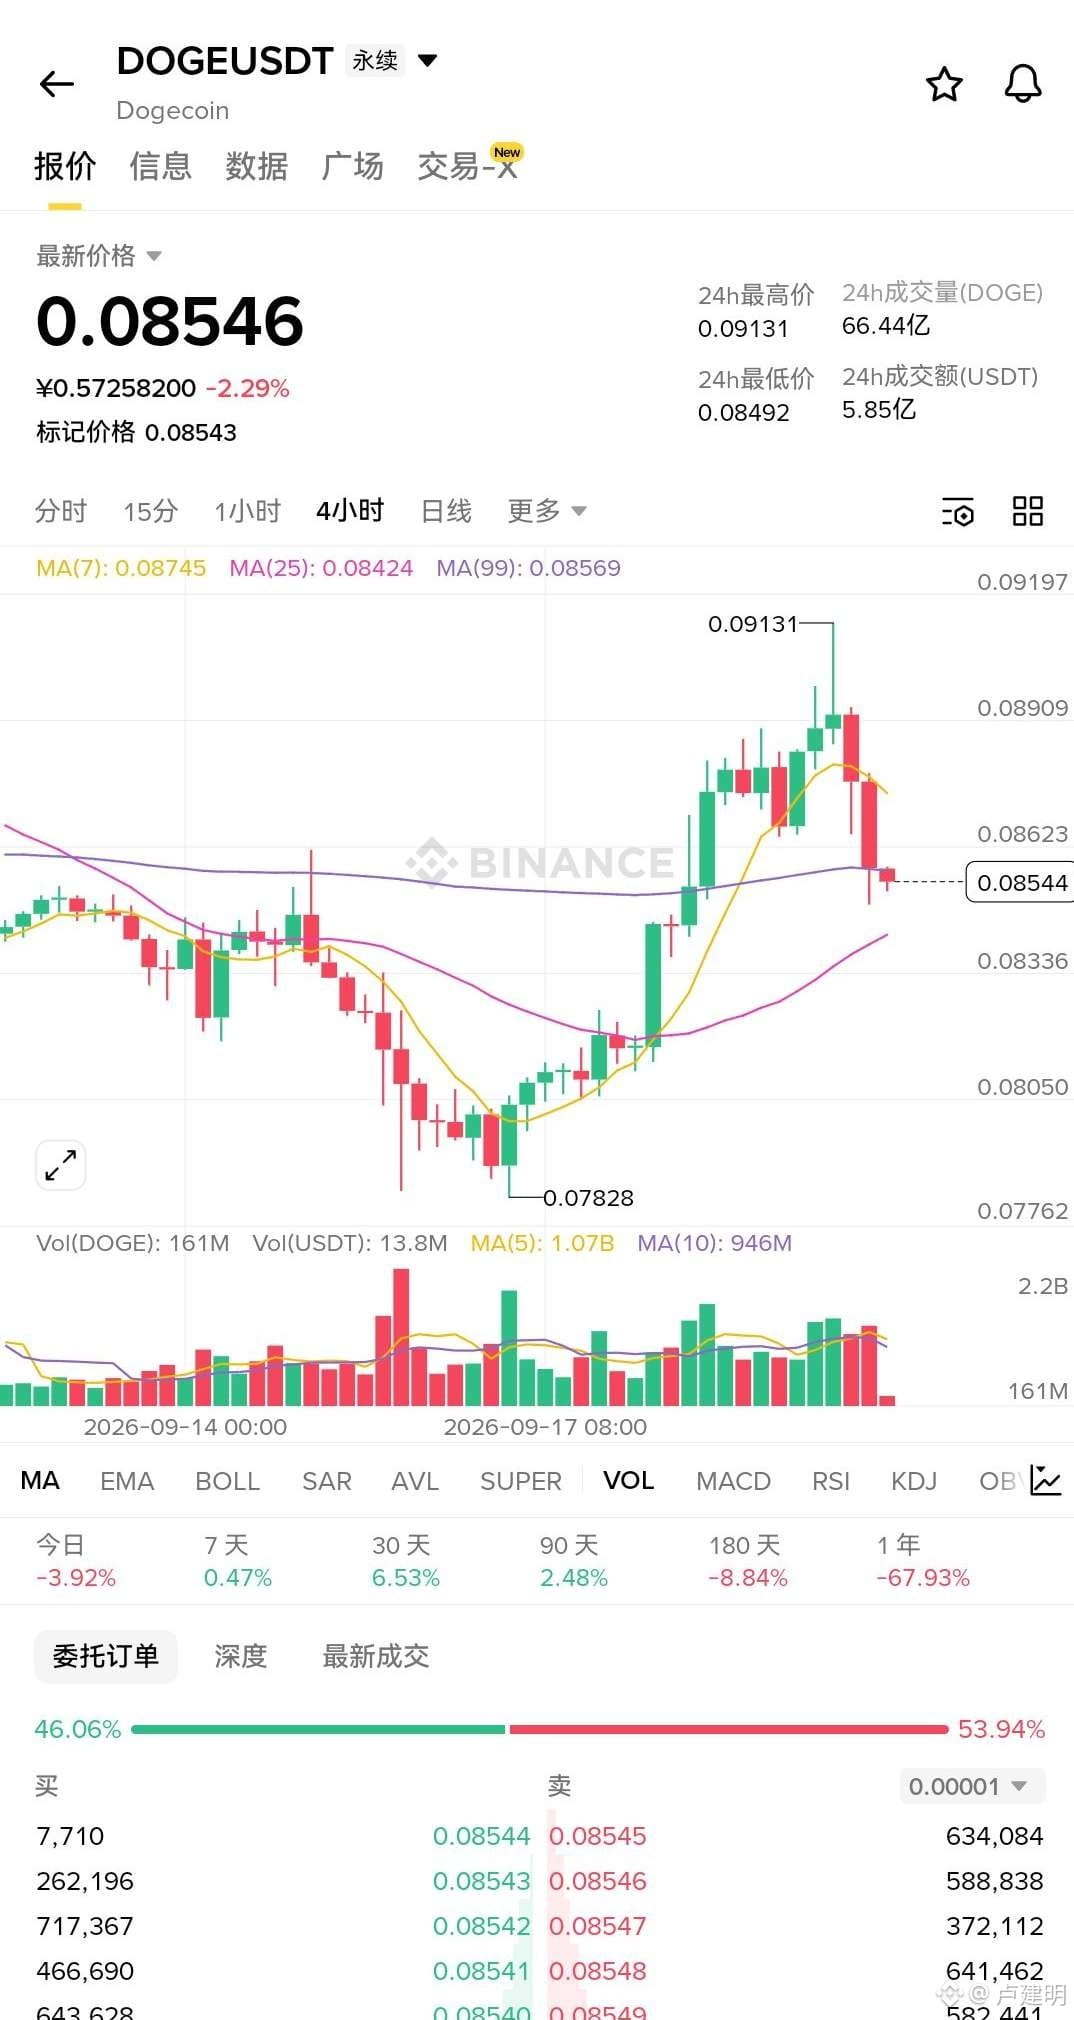
The person sitting in the bulls’ palanquin is still stubborn with their claims. The price has already smashed through the short- to mid-term moving averages, yet the contract positions are being stacked up one layer at a time—this isn’t accumulation. This is someone using your margin money to prop up the table legs. In the big-player accounts, the count shrank within seven hours, the bulls’ share has been dropping from a high level, the smart money is letting go, and the buy volume on the order book is left with nothing but silence. Don’t tell me about some oversold rebound—there hasn’t been a single bullish candle in twelve consecutive K-lines for continuous big buy orders in the spot market. This liquidity is a one-way door. If the bulls keep holding on, until the day open interest explodes, you’ll know who’s cashing out their “year-end bonus” on you.
The person sitting in the bulls’ palanquin is still stubborn with their claims. The price has already smashed through the short- to mid-term moving averages, yet the contract positions are being stacked up one layer at a time—this isn’t accumulation. This is someone using your margin money to prop up the table legs. In the big-player accounts, the count shrank within seven hours, the bulls’ share has been dropping from a high level, the smart money is letting go, and the buy volume on the order book is left with nothing but silence. Don’t tell me about some oversold rebound—there hasn’t been a single bullish candle in twelve consecutive K-lines for continuous big buy orders in the spot market. This liquidity is a one-way door. If the bulls keep holding on, until the day open interest explodes, you’ll know who’s cashing out their “year-end bonus” on you.
142
·
--
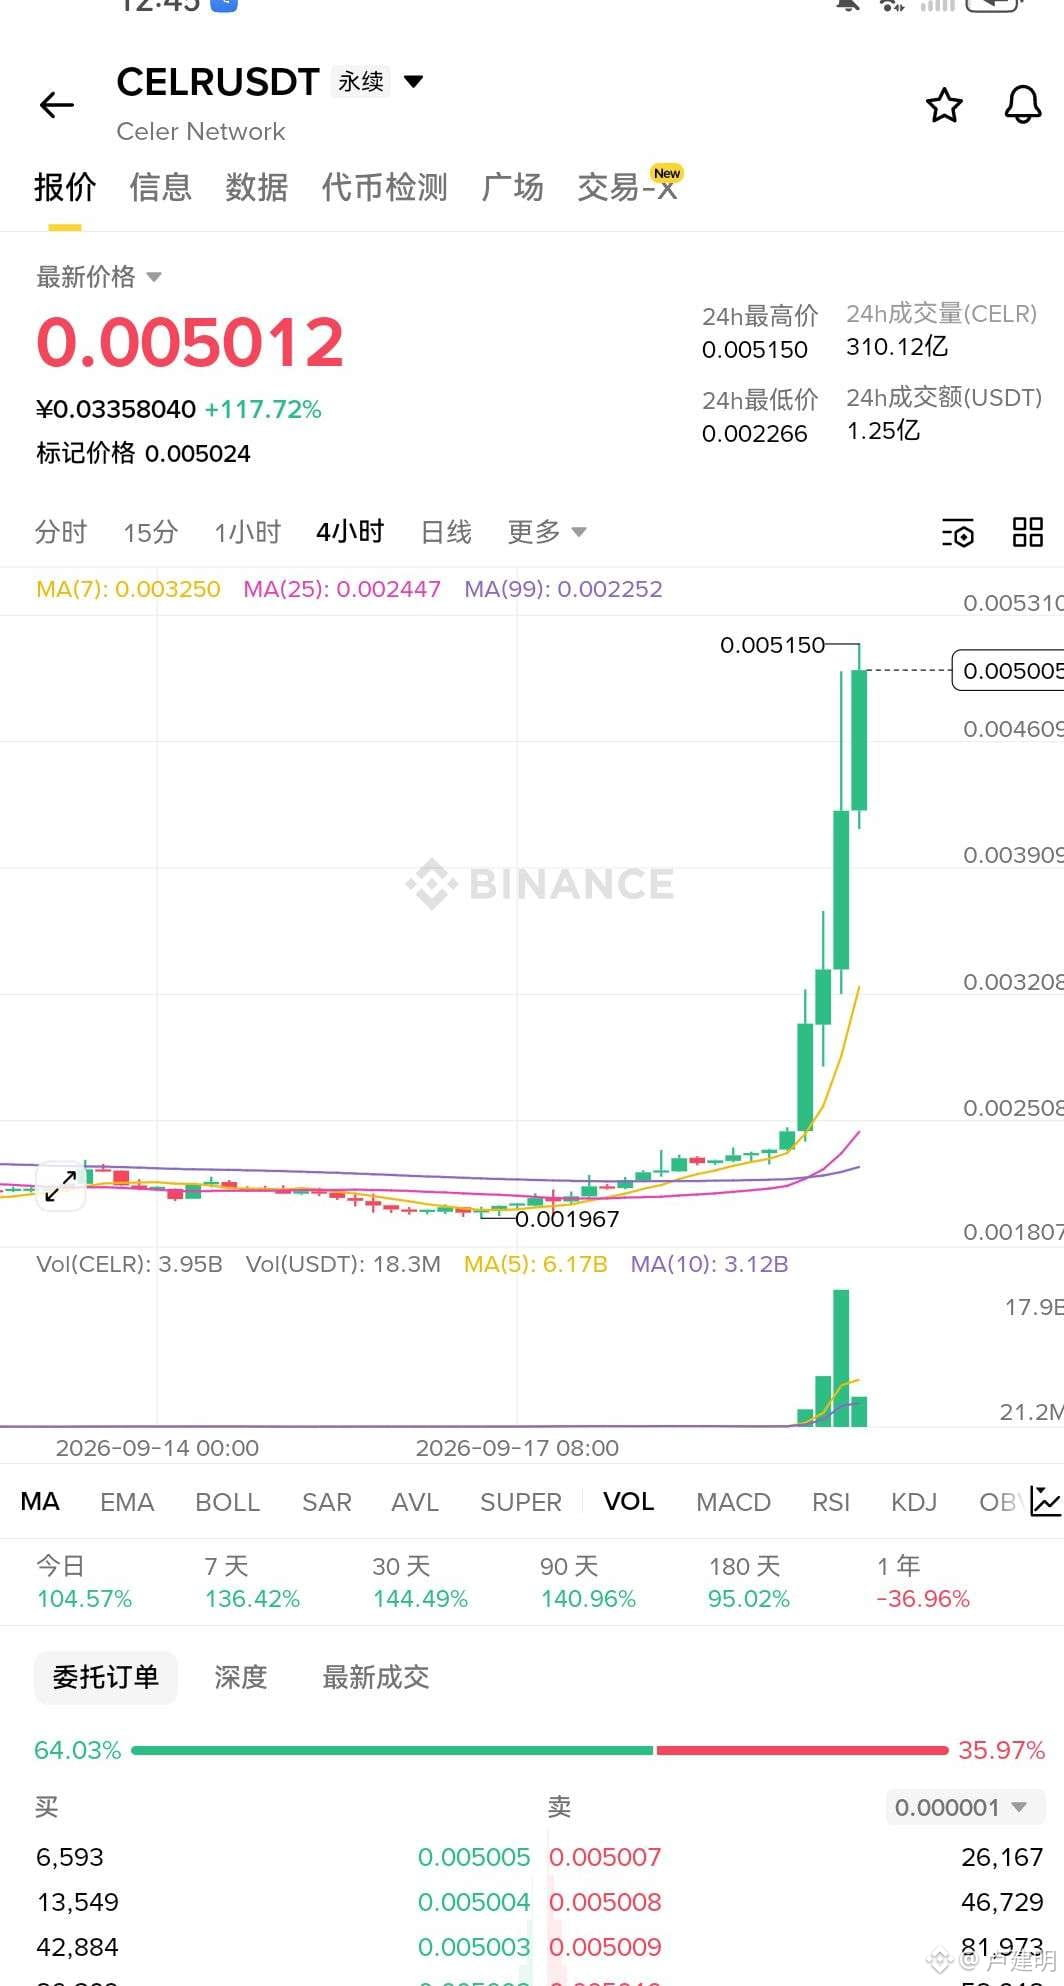
$CELR Why hesitate on this order book? Buy the book actively and smash the sell orders that are being stacked—the buy volume is directly three times (or more) the sell volume. This isn’t a small-scale stunt; it’s real money fighting for accumulation. In the short-term K-lines, there’s a whole chain of bullish candles, and on the four-hour chart the direction is even cleaner and more decisive—all red. The key is this: after such a big move, the market still dares to buy like this at the order book level—clearly there’s big capital that hasn’t finished eating yet. Smart people have already started acting—don’t be the one who’s always late to realize it.
$CELR Why hesitate on this order book? Buy the book actively and smash the sell orders that are being stacked—the buy volume is directly three times (or more) the sell volume. This isn’t a small-scale stunt; it’s real money fighting for accumulation. In the short-term K-lines, there’s a whole chain of bullish candles, and on the four-hour chart the direction is even cleaner and more decisive—all red. The key is this: after such a big move, the market still dares to buy like this at the order book level—clearly there’s big capital that hasn’t finished eating yet. Smart people have already started acting—don’t be the one who’s always late to realize it.
1
183
·
--
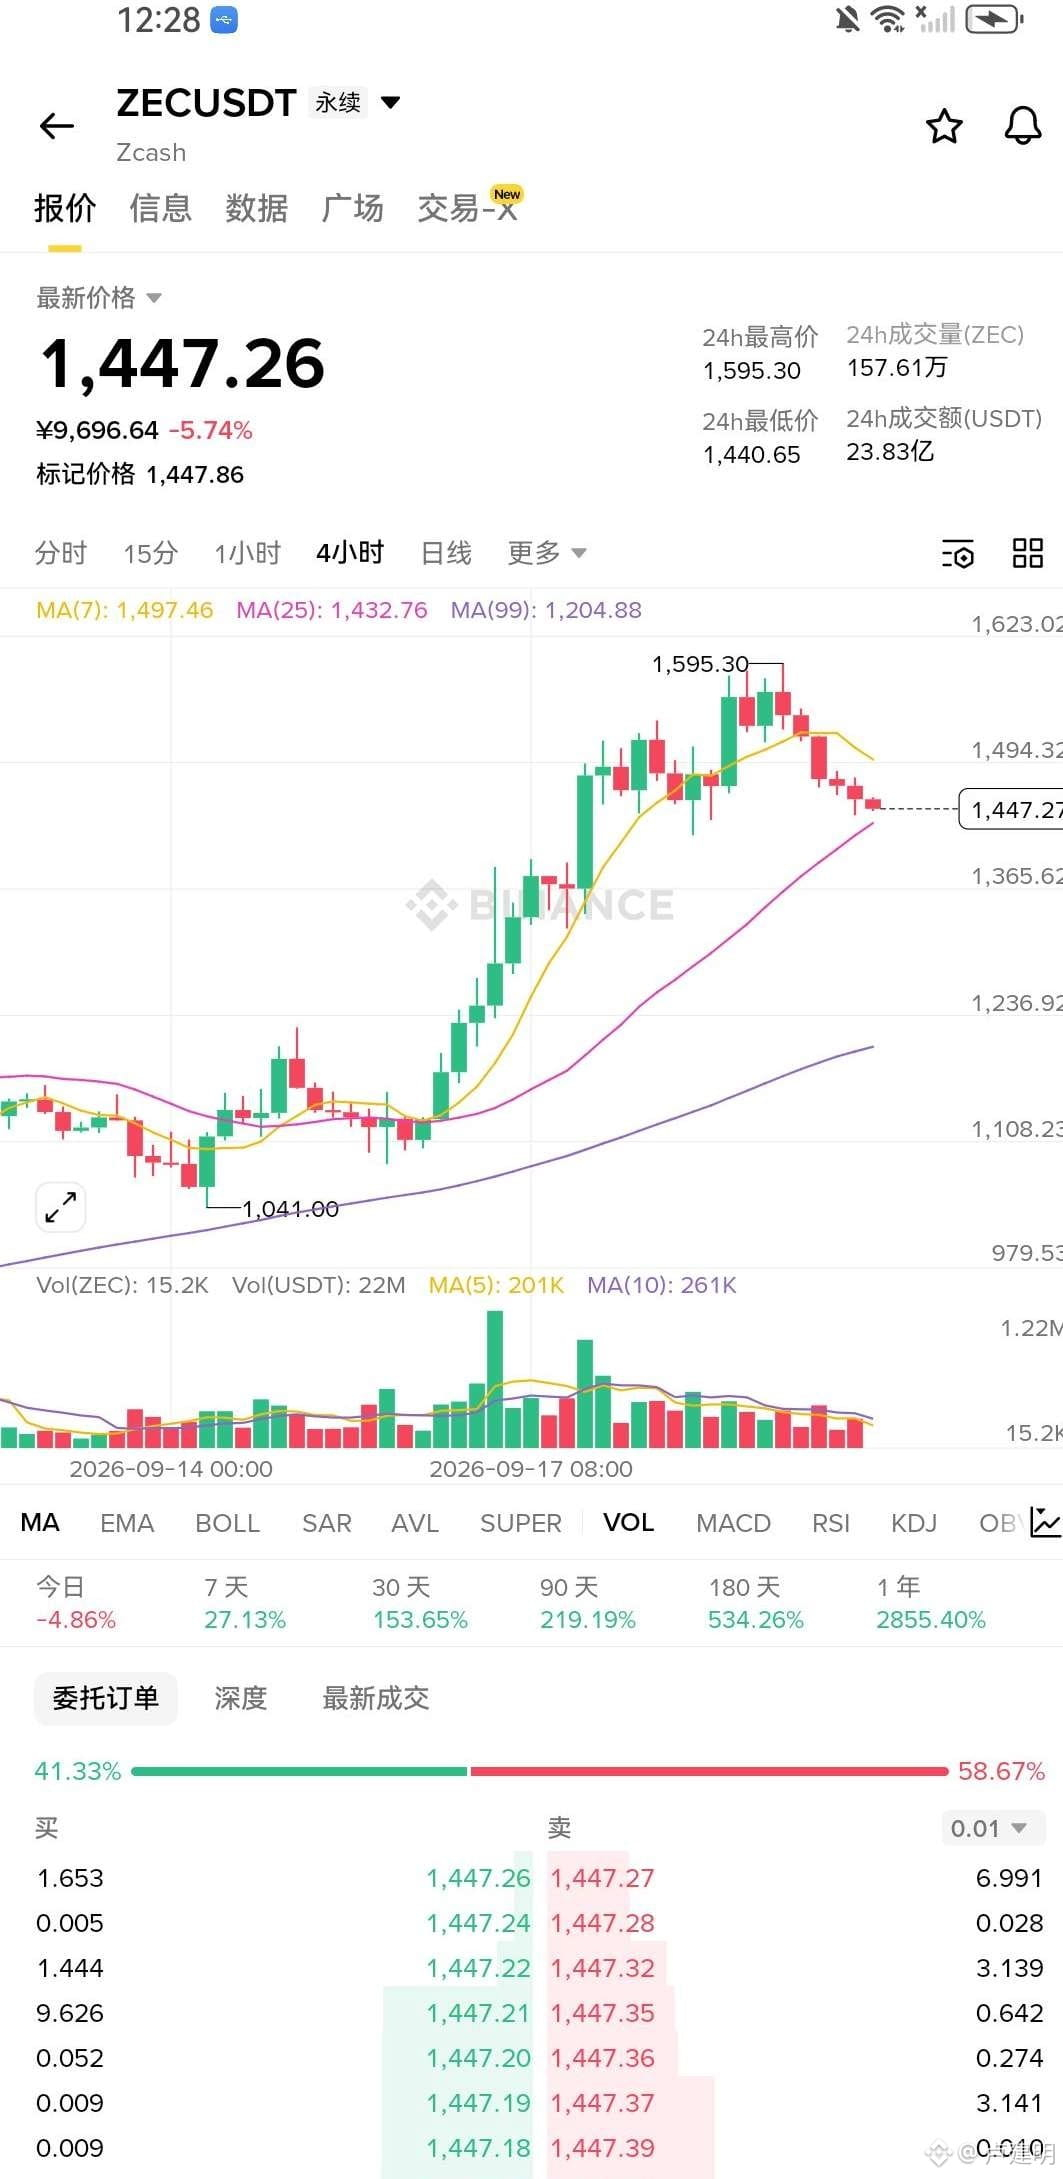
ZEC is gently pulling back; the direction hasn’t fully opened. Aggressive buy orders account for only around 40%. Sell volume is being tightly suppressed, and futures funding rates are dragged down to negative on average. The willingness of long positions to add is not particularly strong. On the spot side, large orders have seen a continuous net outflow. In the lending market, debt growth is still negative. The rebound lacks fuel, and whether the market can hold is the key—don’t get too carried away.
ZEC is gently pulling back; the direction hasn’t fully opened. Aggressive buy orders account for only around 40%. Sell volume is being tightly suppressed, and futures funding rates are dragged down to negative on average. The willingness of long positions to add is not particularly strong. On the spot side, large orders have seen a continuous net outflow. In the lending market, debt growth is still negative. The rebound lacks fuel, and whether the market can hold is the key—don’t get too carried away.
·
--
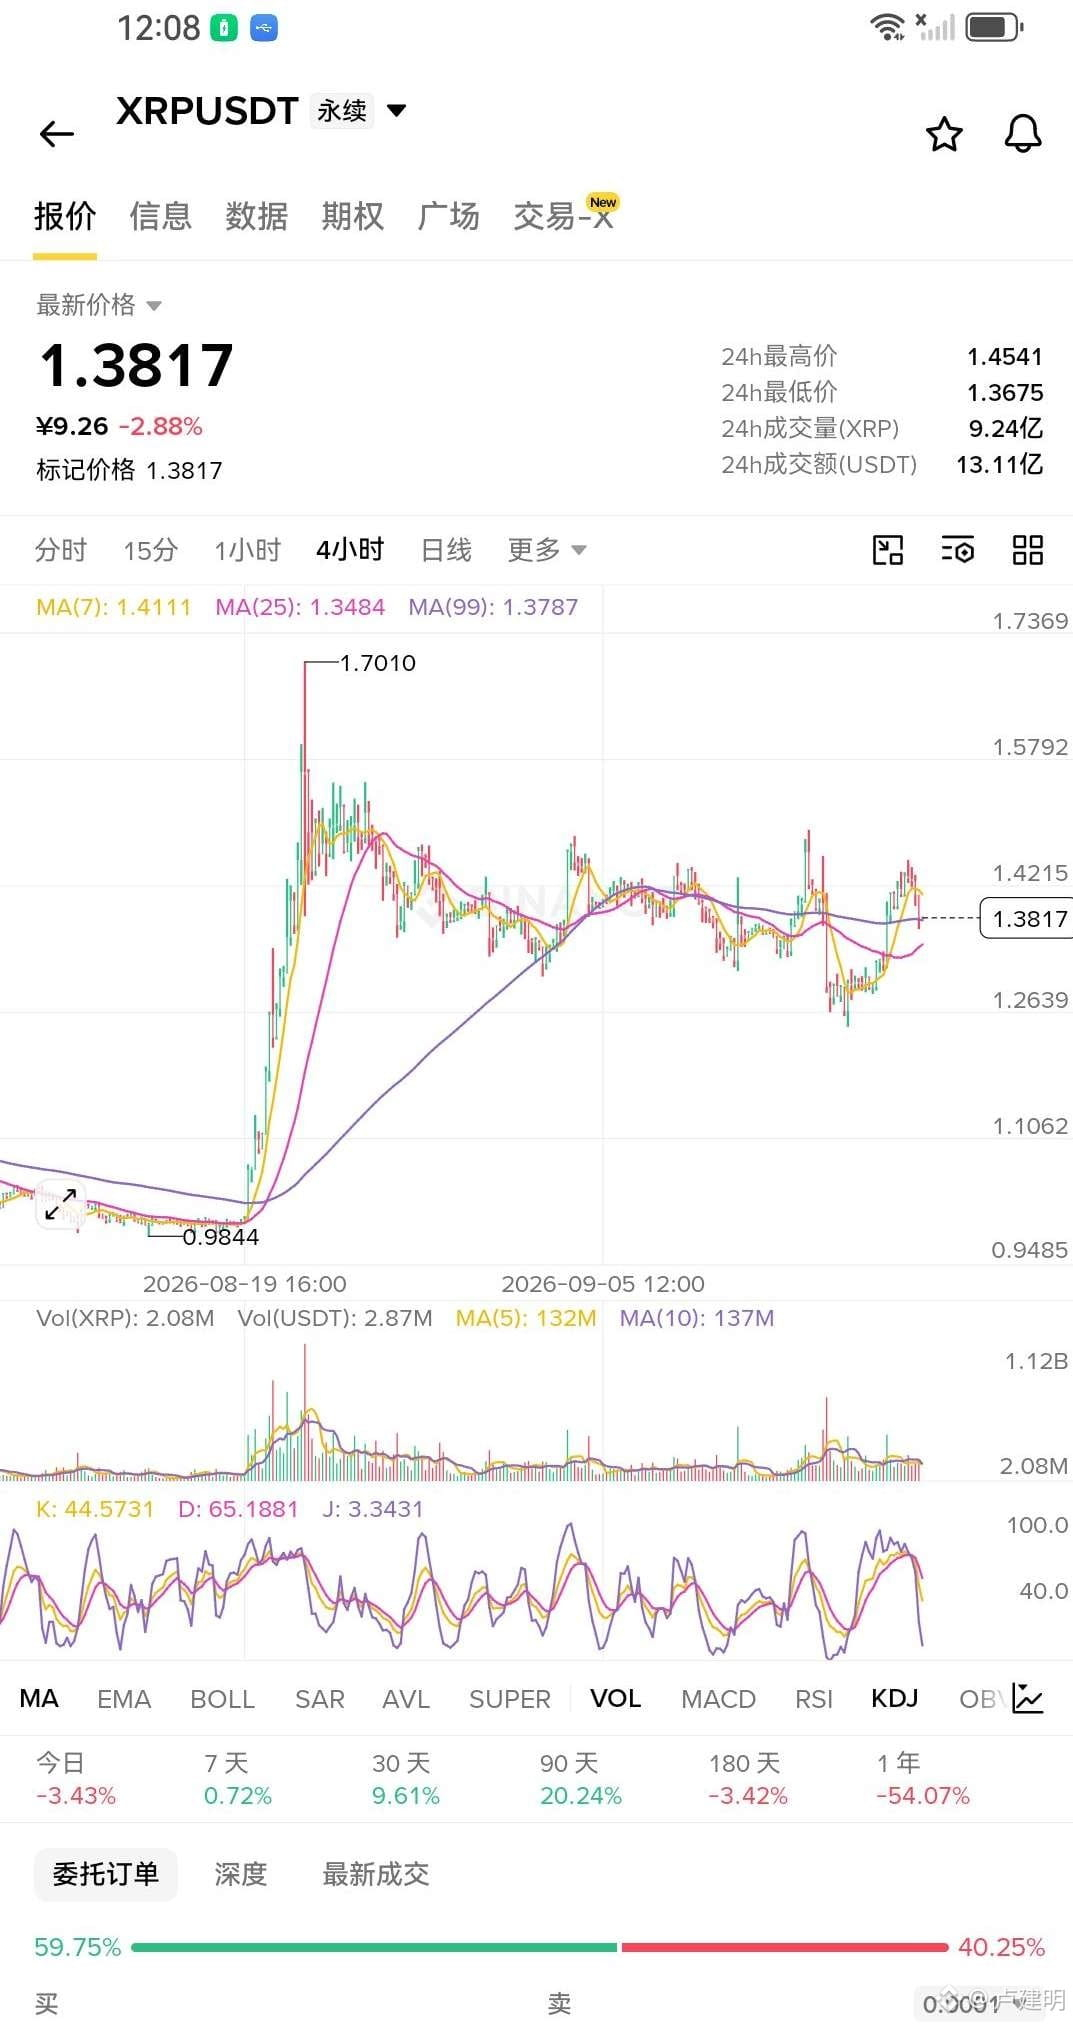
$XRP This rebound is a joke—short-term moving averages are pressing down on the top of our heads. Out of six candlesticks, five closed bearish. The rebound can’t even reach the moving average line before getting beaten down by others. Not exaggerating: on the daily chart, there’s a huge bearish candle. For spot markets, large orders show net outflows for twelve consecutive candlesticks. Funds are giving their verdict with their feet. Brothers who are holding positions at the top, thinking this is a bargain at the bottom—no, it’s really mid-way up the mountain.
$XRP This rebound is a joke—short-term moving averages are pressing down on the top of our heads. Out of six candlesticks, five closed bearish. The rebound can’t even reach the moving average line before getting beaten down by others. Not exaggerating: on the daily chart, there’s a huge bearish candle. For spot markets, large orders show net outflows for twelve consecutive candlesticks. Funds are giving their verdict with their feet. Brothers who are holding positions at the top, thinking this is a bargain at the bottom—no, it’s really mid-way up the mountain.
36
·
--
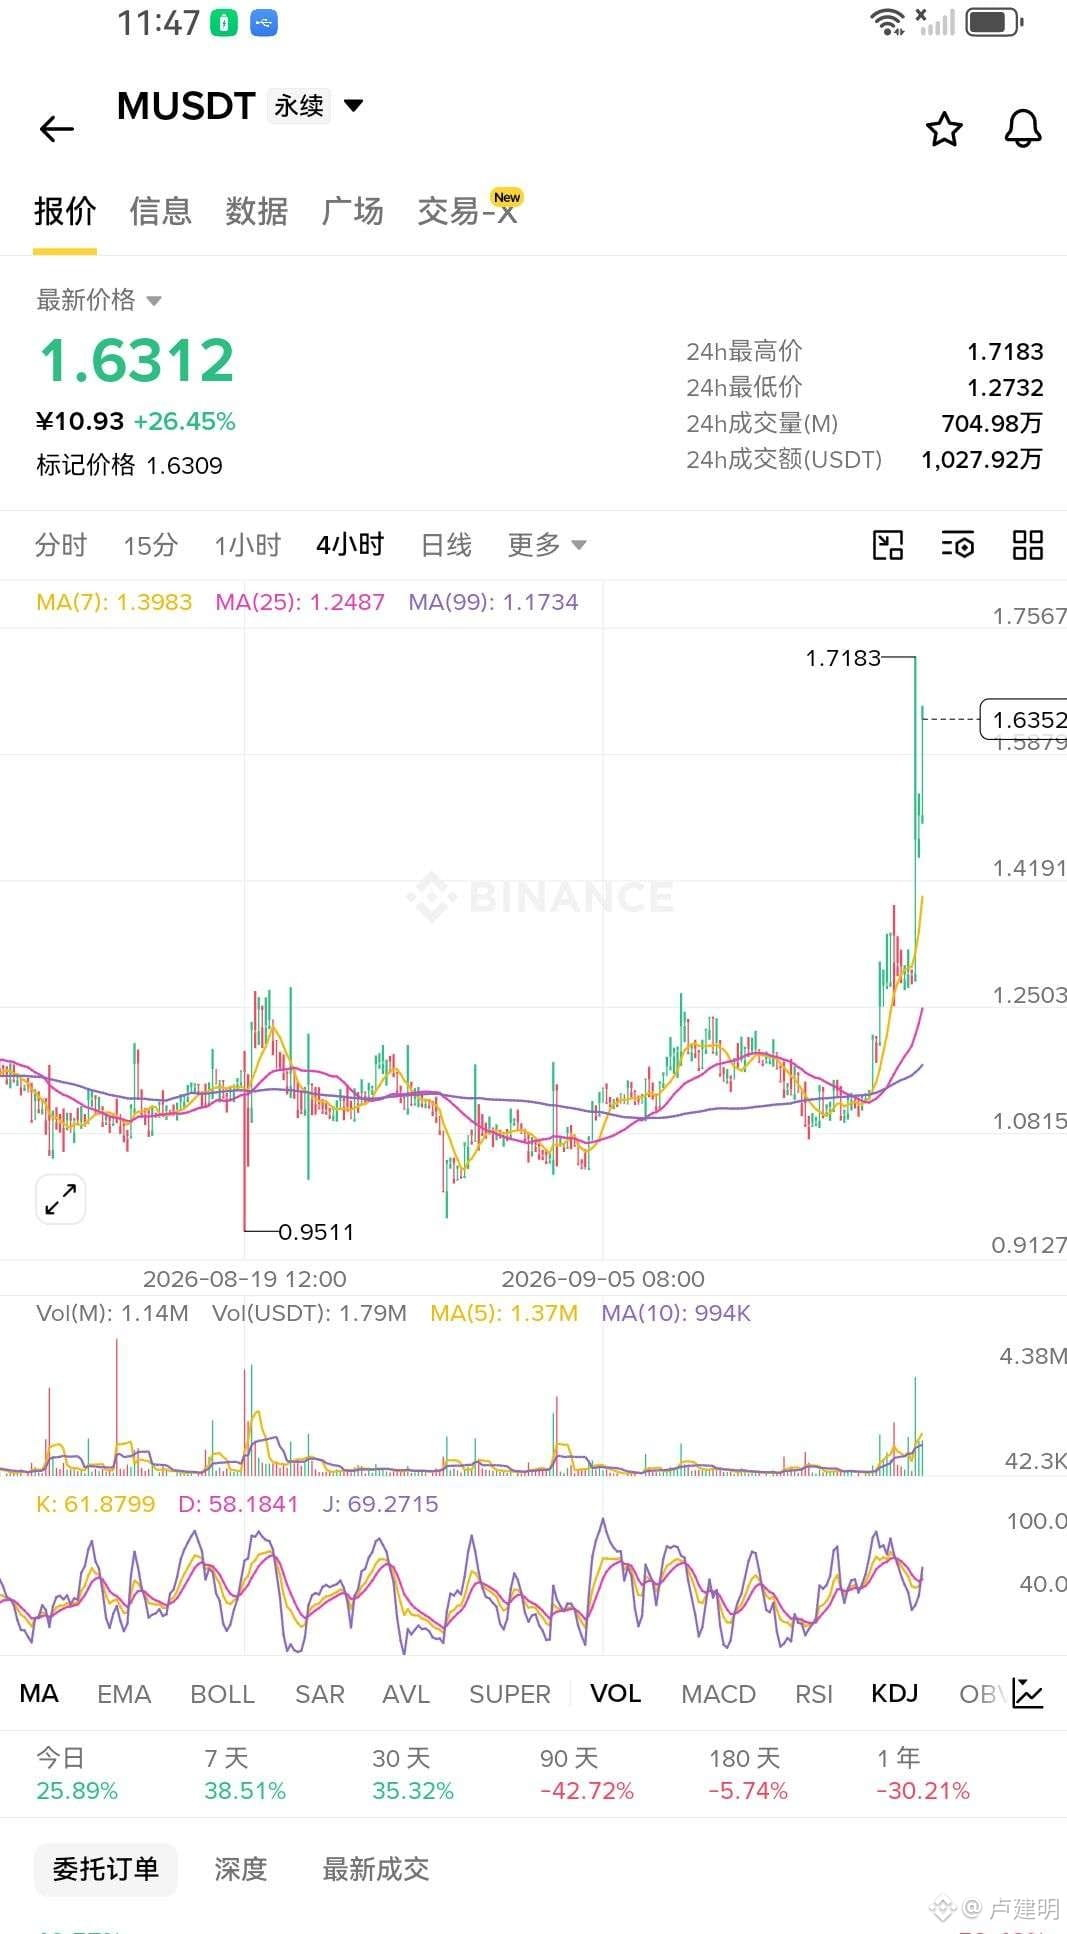
M Do you still need to hesitate over this board? The contract open interest surged by more than 10% in a single day. The price is grinding right near the highs, and all the newly added positions are real, hard-chasing longs. On the 4-hour chart, there are six K-lines with four closing green; on the daily chart, a single strong bullish candle is sitting there. The trend is already running smoothly—don’t wait for a pullback. This main uptrend leg is just getting started. Just keep watching for new highs and continue going long.
M Do you still need to hesitate over this board? The contract open interest surged by more than 10% in a single day. The price is grinding right near the highs, and all the newly added positions are real, hard-chasing longs. On the 4-hour chart, there are six K-lines with four closing green; on the daily chart, a single strong bullish candle is sitting there. The trend is already running smoothly—don’t wait for a pullback. This main uptrend leg is just getting started. Just keep watching for new highs and continue going long.
24
·
--
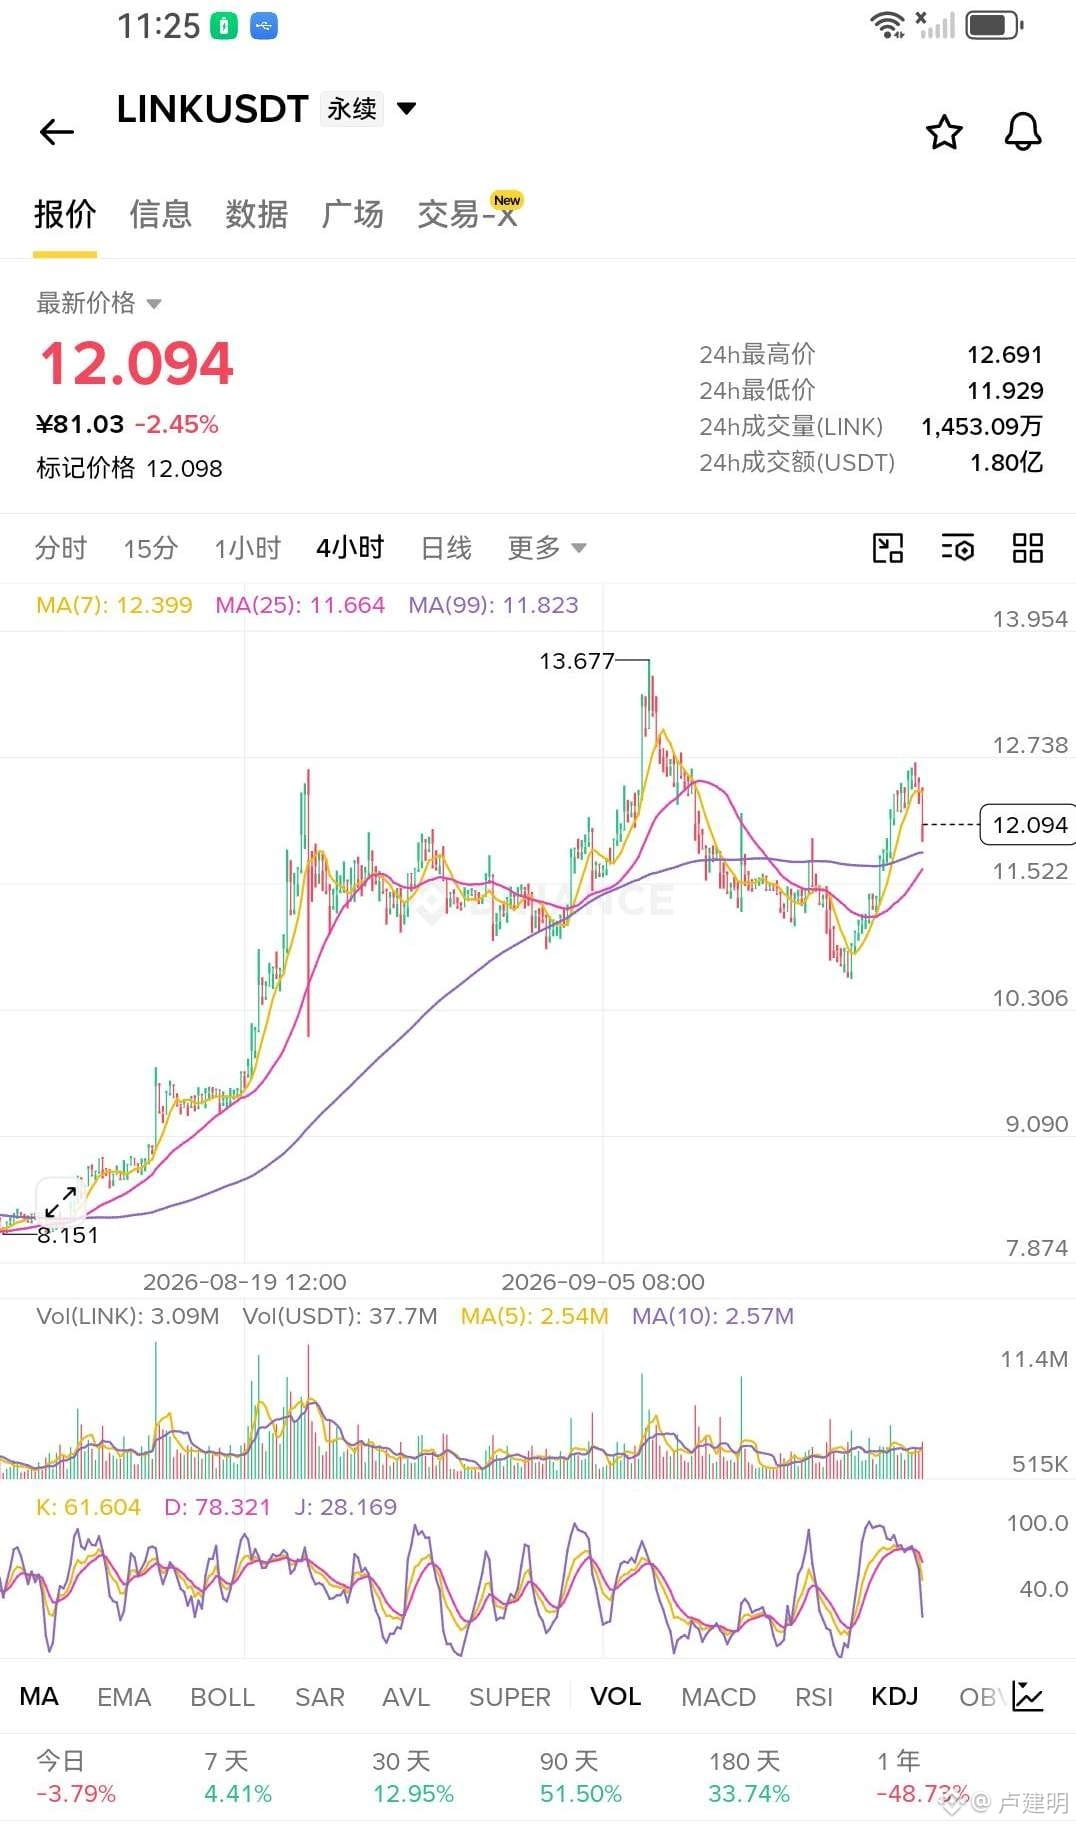
🤣 Still someone doesn’t believe? This 🐶 stock doesn’t even演 anymore—the spot big orders show nearly five consecutive K-lines of net outflow. In just 15 minutes it plummeted. The small amount of money that rushed in short-term is barely enough to hold it back. The number of big-holder accounts shrank even after seven hours—while the long/short ratio keeps falling. This is a clear sign of an escape, not a shakeout. Brothers, don’t catch the falling knife—wait for it to break down through the next level, 🈳!
🤣 Still someone doesn’t believe? This 🐶 stock doesn’t even演 anymore—the spot big orders show nearly five consecutive K-lines of net outflow. In just 15 minutes it plummeted. The small amount of money that rushed in short-term is barely enough to hold it back. The number of big-holder accounts shrank even after seven hours—while the long/short ratio keeps falling. This is a clear sign of an escape, not a shakeout. Brothers, don’t catch the falling knife—wait for it to break down through the next level, 🈳!
34
·
--
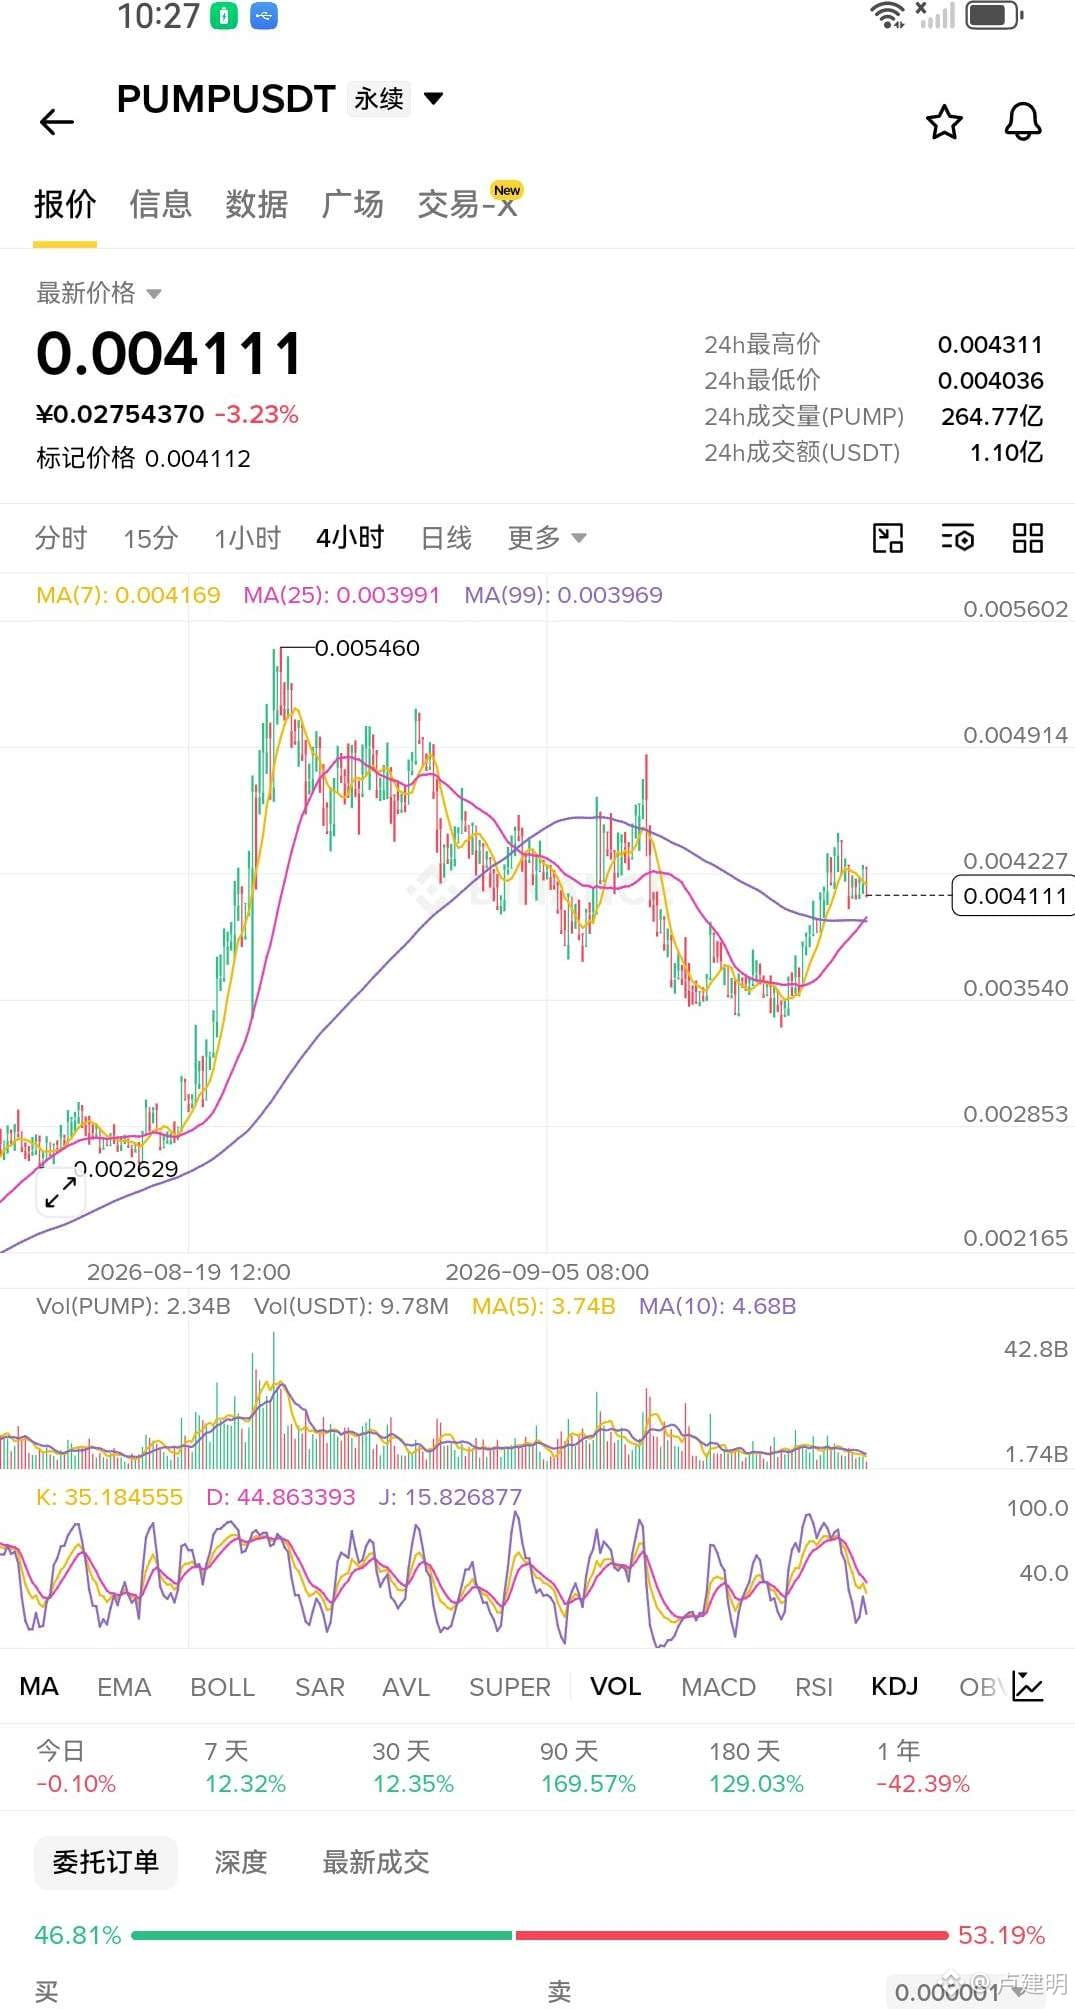
Here we go again—the familiar script of big money running away while small money takes the bag. Spot trading saw net outflows on the order of tens of billions within just 3 hours: over 12 candlesticks with not a single one positive. Yet the futures open interest is still standing firm and hasn’t collapsed. So tell me—who’s propping it up? On the order book, the bid side is only about 90% of the ask side. The aggressive sell volume keeps pressing down, so buyers can’t even lift their heads. Prices are still sliding lower with a bearish drift, while the longs are still queuing inside, waiting for a rebound. Believe them—your money will be gone.
Here we go again—the familiar script of big money running away while small money takes the bag. Spot trading saw net outflows on the order of tens of billions within just 3 hours: over 12 candlesticks with not a single one positive. Yet the futures open interest is still standing firm and hasn’t collapsed. So tell me—who’s propping it up? On the order book, the bid side is only about 90% of the ask side. The aggressive sell volume keeps pressing down, so buyers can’t even lift their heads. Prices are still sliding lower with a bearish drift, while the longs are still queuing inside, waiting for a rebound. Believe them—your money will be gone.
3
·
--
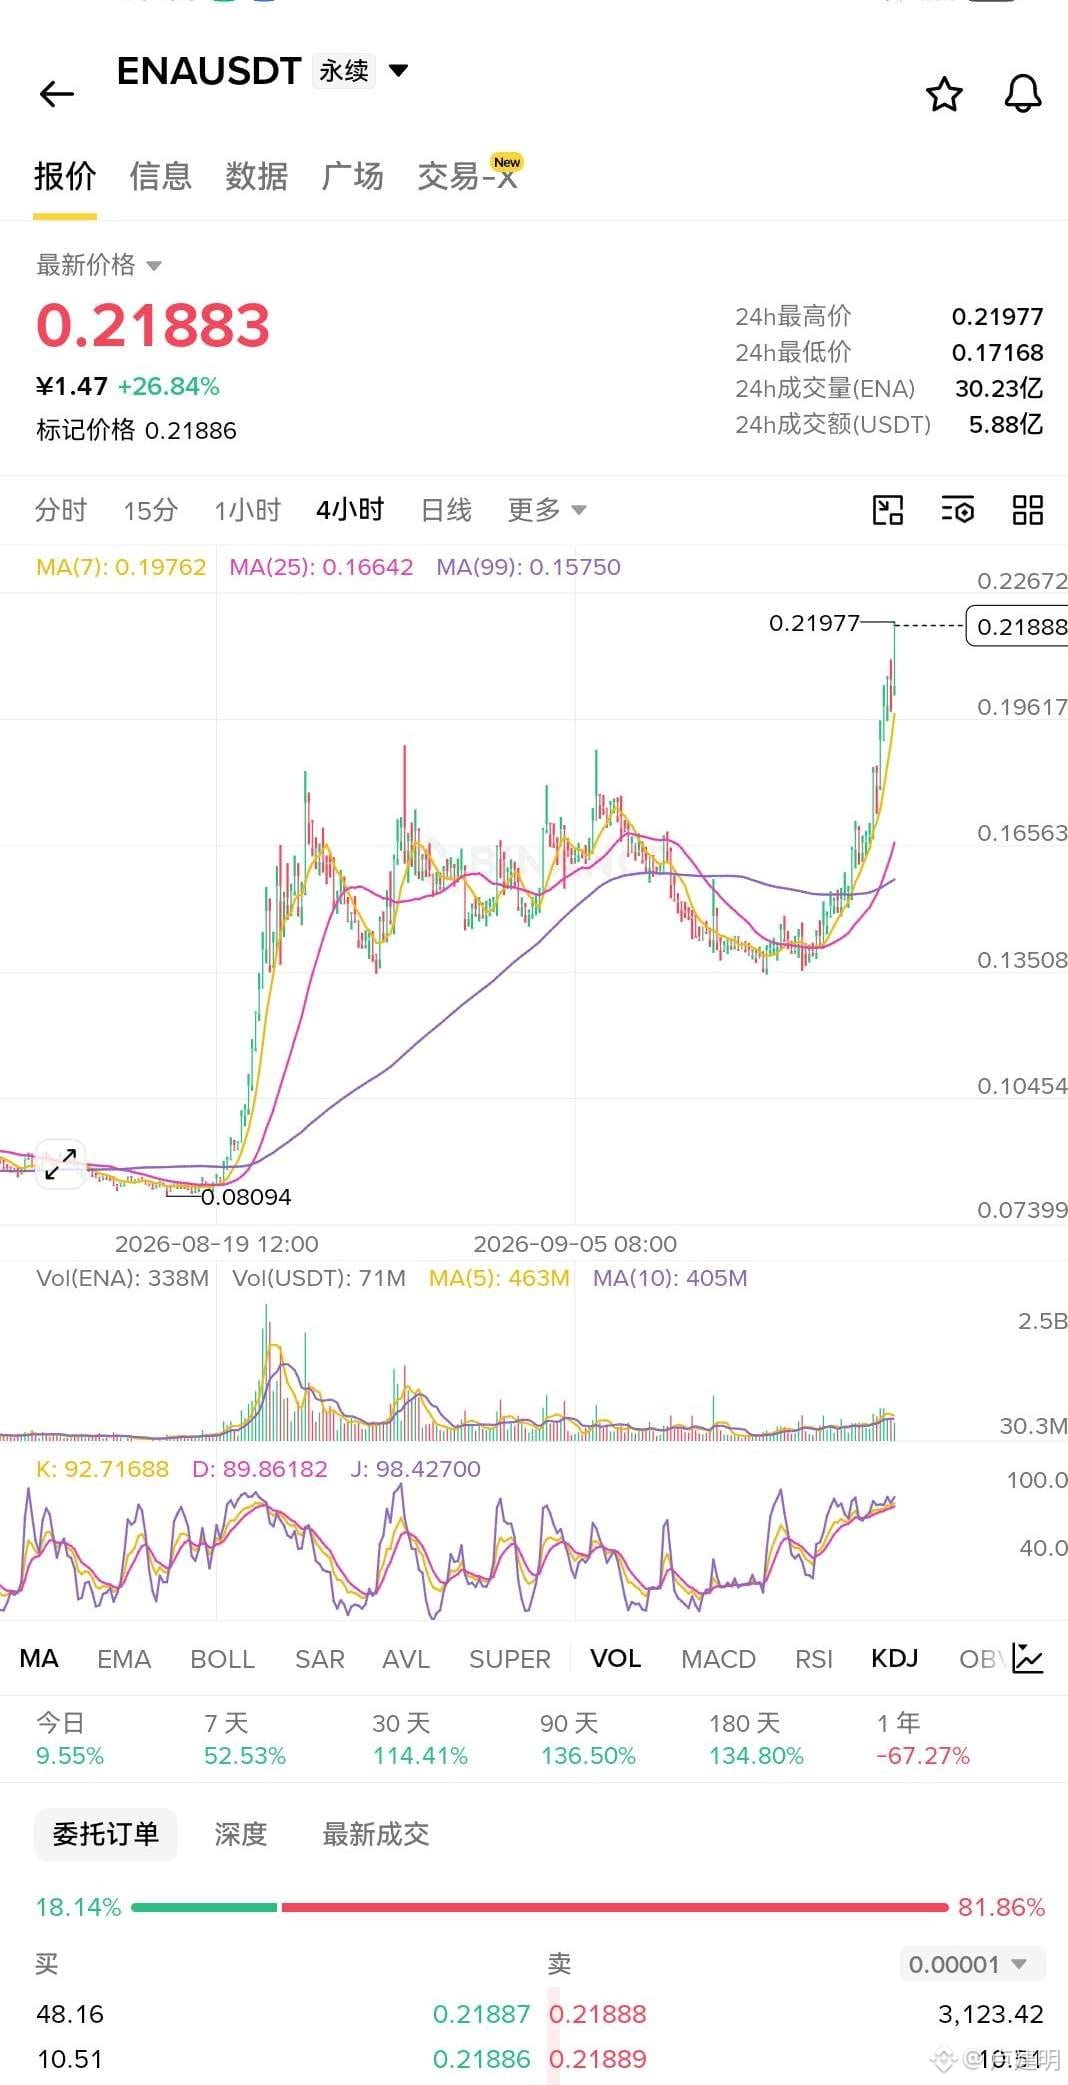
$ENA This is a clear read of the market—smart money has already moved. The number of accounts rose by more than half a percent in seven hours. The proportion of long accounts is nearing 70%, and the large players are accelerating their assembly. This doesn’t look like hesitation at all. On the spot side, major order funds have been net inflows for five consecutive K-lines—buying as the price rises, clearly accumulation rather than distribution. The price is grinding right along the highs. In the four-hour outlook, the direction remains upward, and momentum is still strengthening itself. Once the rocket launches, just hold your seat steady.
$ENA This is a clear read of the market—smart money has already moved. The number of accounts rose by more than half a percent in seven hours. The proportion of long accounts is nearing 70%, and the large players are accelerating their assembly. This doesn’t look like hesitation at all. On the spot side, major order funds have been net inflows for five consecutive K-lines—buying as the price rises, clearly accumulation rather than distribution. The price is grinding right along the highs. In the four-hour outlook, the direction remains upward, and momentum is still strengthening itself. Once the rocket launches, just hold your seat steady.
79
·
--
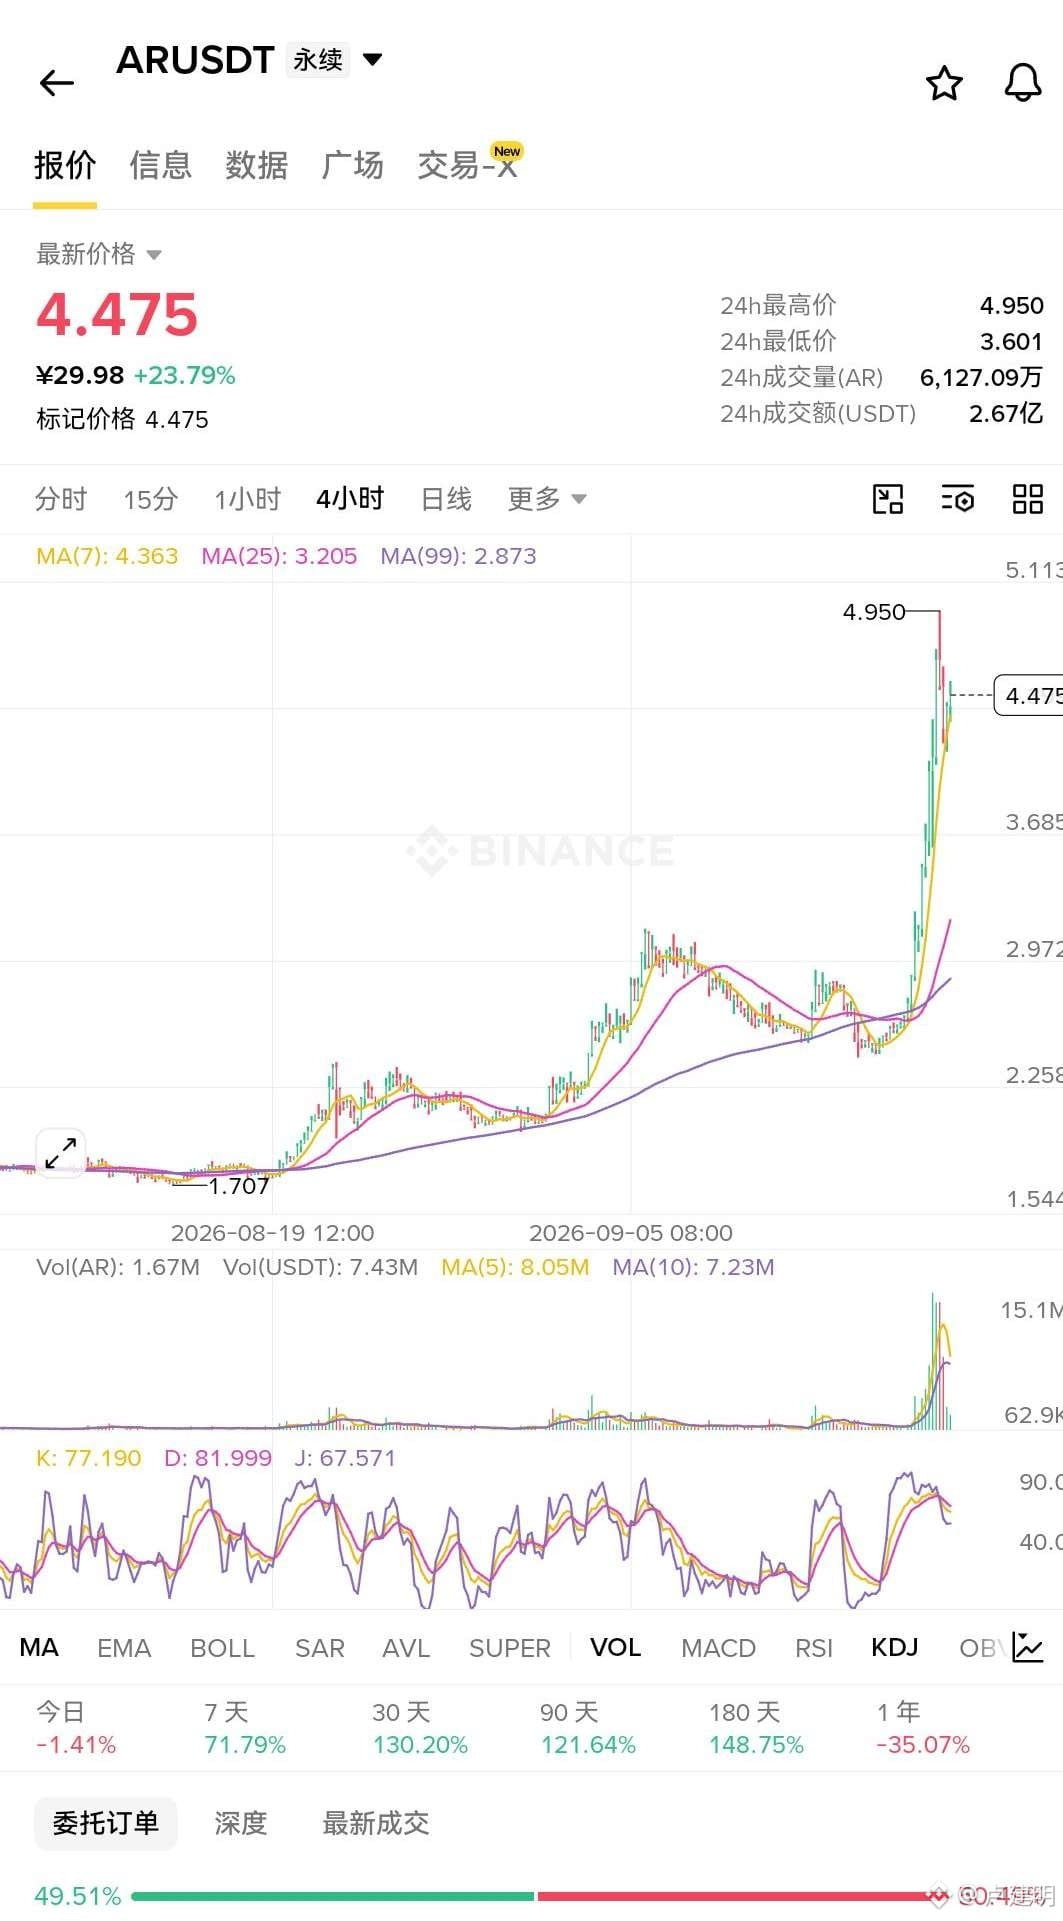
@AR The harder this order book runs up, the more ruthlessly it gets sold. Spot prices are up nearly 24% over the past 24 hours, but the active buy side only accounts for around 30%. Meanwhile, sell volume doubles and overwhelms everything—so is this what you call a rise? This is high-level distribution! The derivatives side is even more ridiculous: funding rates are pinned to the floor, and the basis is still drilling further into discount. Futures simply don’t recognize this pump. In the end, the order book votes with its feet. Trying to push it higher just on spot, with no takers in sight—anyone moving it up is just propping up the broker’s chair. This trading style is way too crude; anyone chasing higher is probably coming to make a joke of it.
@AR The harder this order book runs up, the more ruthlessly it gets sold. Spot prices are up nearly 24% over the past 24 hours, but the active buy side only accounts for around 30%. Meanwhile, sell volume doubles and overwhelms everything—so is this what you call a rise? This is high-level distribution! The derivatives side is even more ridiculous: funding rates are pinned to the floor, and the basis is still drilling further into discount. Futures simply don’t recognize this pump. In the end, the order book votes with its feet. Trying to push it higher just on spot, with no takers in sight—anyone moving it up is just propping up the broker’s chair. This trading style is way too crude; anyone chasing higher is probably coming to make a joke of it.
90
·
--
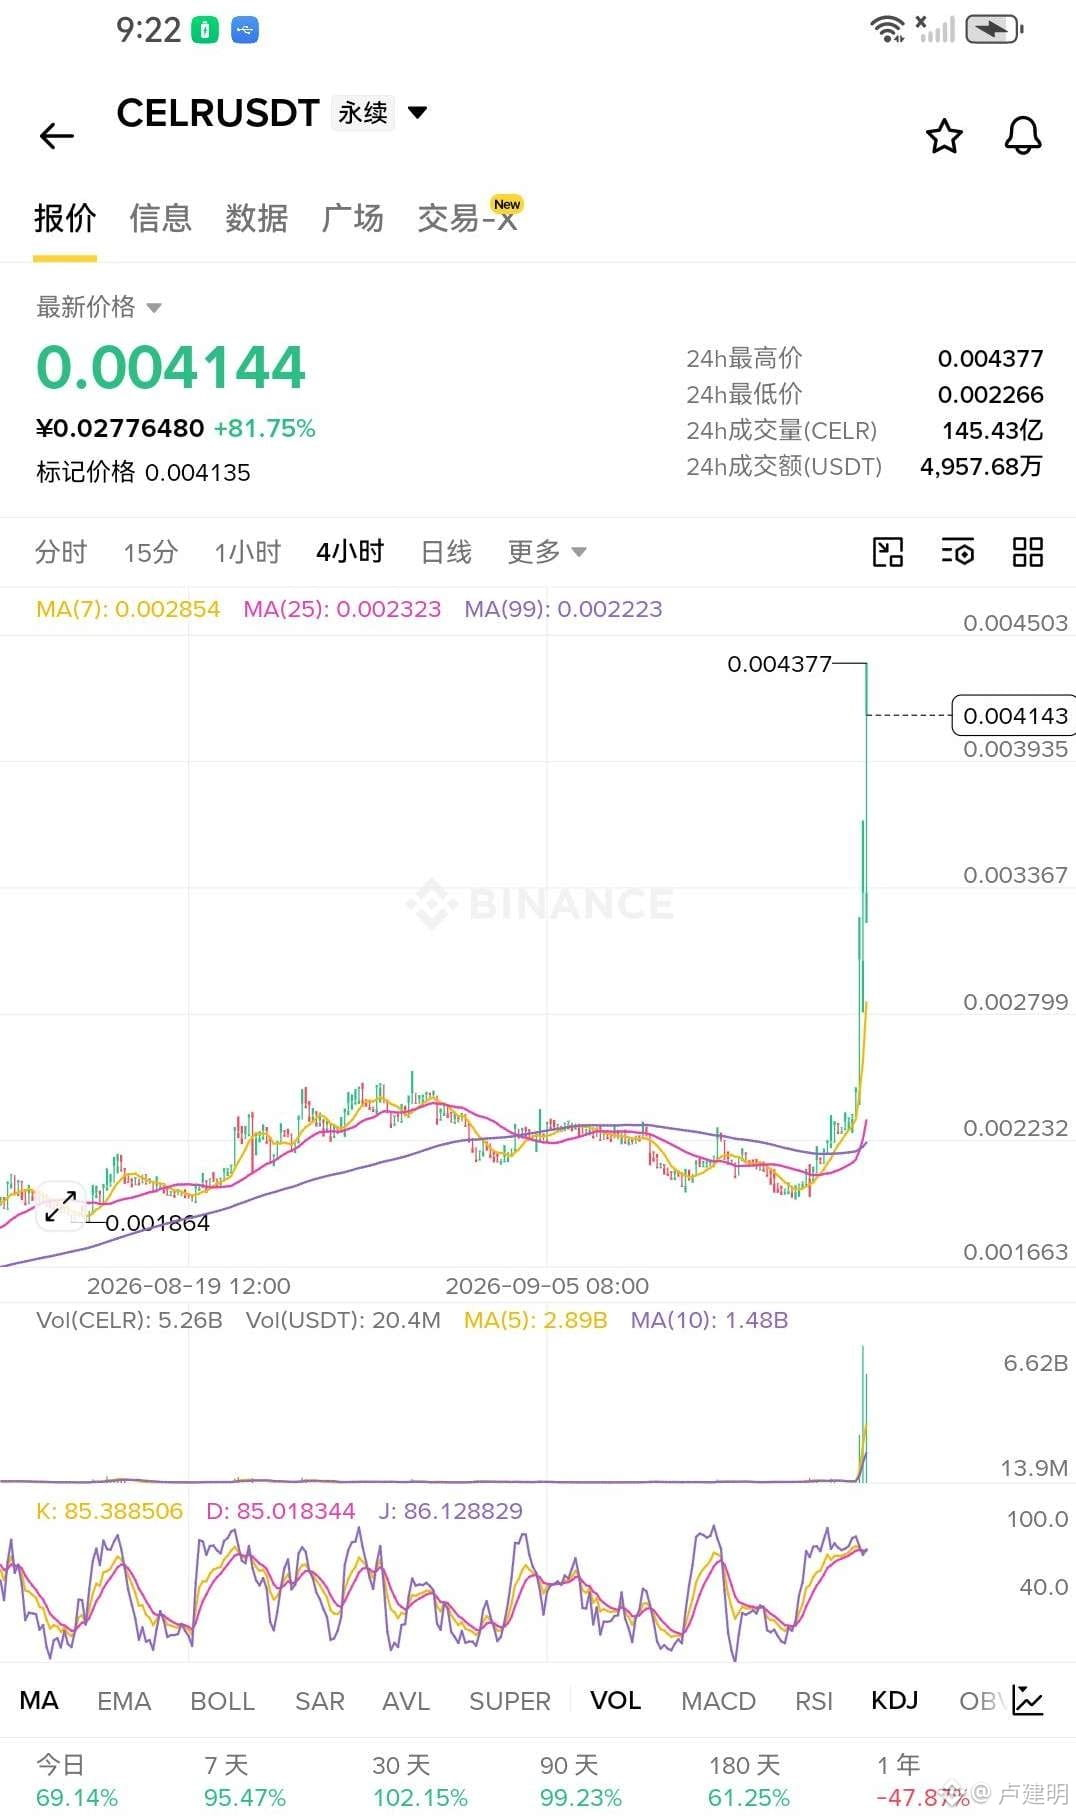
CELR The fuel for this continued rise hasn’t burned out yet! For the past three hours, spot funds have seen net inflows staying consistently positive. A whole string of candlesticks are green, with clear signs of big funds dipping in to buy. Don’t be misled by some choppiness in the short term—this kind of dense turnover of shares is often the prelude to a major upswing. Let the chart be your “foot-vote”; hold in line with the direction of the money.
CELR The fuel for this continued rise hasn’t burned out yet! For the past three hours, spot funds have seen net inflows staying consistently positive. A whole string of candlesticks are green, with clear signs of big funds dipping in to buy. Don’t be misled by some choppiness in the short term—this kind of dense turnover of shares is often the prelude to a major upswing. Let the chart be your “foot-vote”; hold in line with the direction of the money.
135
·
--
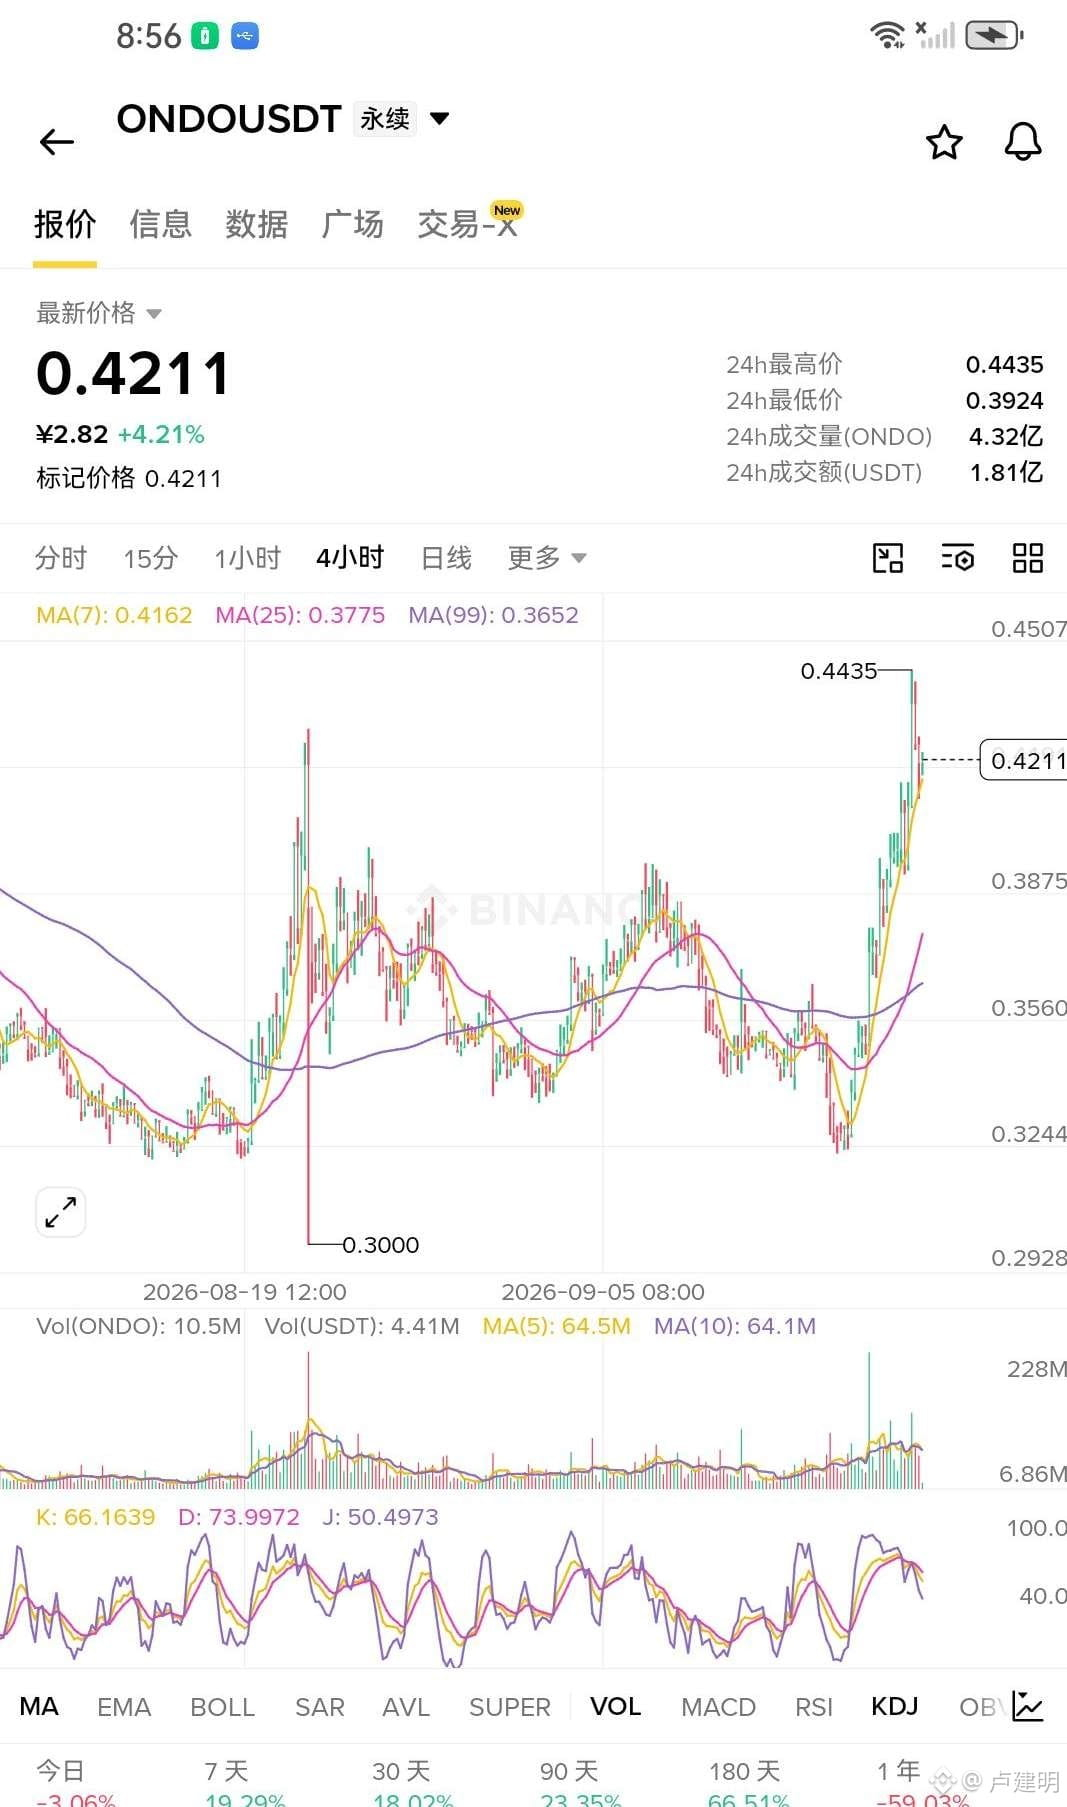
ONDO don’t wait until it really starts flying to chase—large order capital shows net inflow of $5.43 million over 5 K-lines, the fee rate has been positive for 8 straight times, and the bulls are willing to pay the cost to hold tight—this is a clear sign of accumulation, not distribution. A 1-hour pullback is just a shakeout; the 4-hour direction is still headed upward, and a big daily bullish candle is set to define the trend. The current price at 0.4211—go in directly: first target 0.4435. Once it holds, look at 0.4700. Set stop-loss at 0.3440 just outside the 3-day low; if it breaks, I admit defeat. If it doesn’t, sit tight and wait for the rocket launch.
ONDO don’t wait until it really starts flying to chase—large order capital shows net inflow of $5.43 million over 5 K-lines, the fee rate has been positive for 8 straight times, and the bulls are willing to pay the cost to hold tight—this is a clear sign of accumulation, not distribution. A 1-hour pullback is just a shakeout; the 4-hour direction is still headed upward, and a big daily bullish candle is set to define the trend. The current price at 0.4211—go in directly: first target 0.4435. Once it holds, look at 0.4700. Set stop-loss at 0.3440 just outside the 3-day low; if it breaks, I admit defeat. If it doesn’t, sit tight and wait for the rocket launch.
135
Log in to explore more content
Join global crypto users on Binance Square
⚡️ Get latest and useful information about crypto.
💬 Trusted by the world’s largest crypto exchange.
👍 Discover real insights from verified creators.
Email / Phone number
Trending Topics
BOJRaisesRatesTo31YearHigh
108,068 views
1,710 Discussing
🚨 BOJ JUST FIRED A WARNING SHOT AT GLOBAL MARKETS! 🇯🇵🔥
The Bank of Japan just raised rates from 1.00% → 1.25%, hitting the highest level in 31 YEARS! 📈
⚠️ Why traders should care:
• 💴 Yen funding conditions are changing
• 🏦 BOJ is moving further away from ultra-easy money
• 🌍 Global liquidity could face additional pressure
• 📊 Inflation is forcing central banks to stay restrictive
• 🔥 More BOJ hikes remain possible if inflation keeps rising
And here's the key detail:
The decision was 7–2, with two policymakers opposing the hike — meaning the path ahead could remain highly uncertain.
For crypto & risk assets, this is a macro signal traders cannot ignore.
👀 Watch the YEN + BTC + NASDAQ + global liquidity next.
BOJ tightening = potentially bigger volatility ahead.
#BoJ #Japan #bojraisesratesto31yearhigh
ASHFAQ NAEEM
·7 Likes
·5.2k views
BuffettStepsDownAsBerkshireChairman
49,984 views
829 Discussing
XRPExchangeReservesHitSevenYearLow
53,569 views
793 Discussing