
信号与噪声
2.4k Posts

信号与噪声
Report
Block User
446 Following
742 Followers
2.6K+ Liked
Posts
·
--
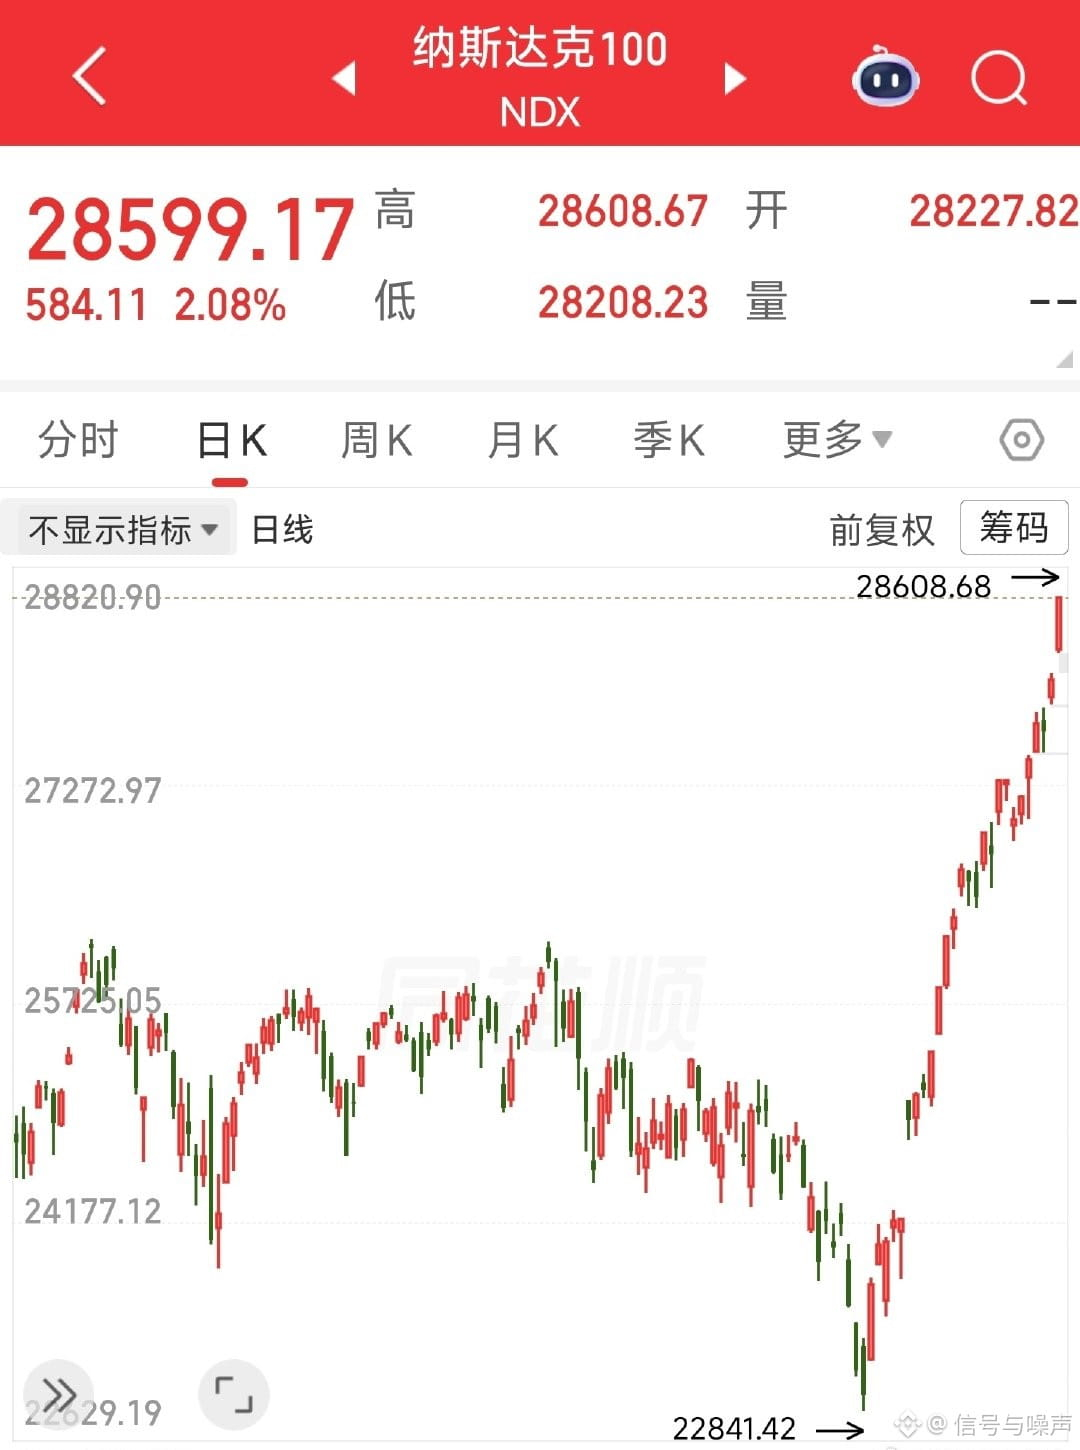
Woke up and Nana's up 2% again, hitting new all-time highs [污][污]
Woke up and Nana's up 2% again, hitting new all-time highs [污][污]
178
·
--
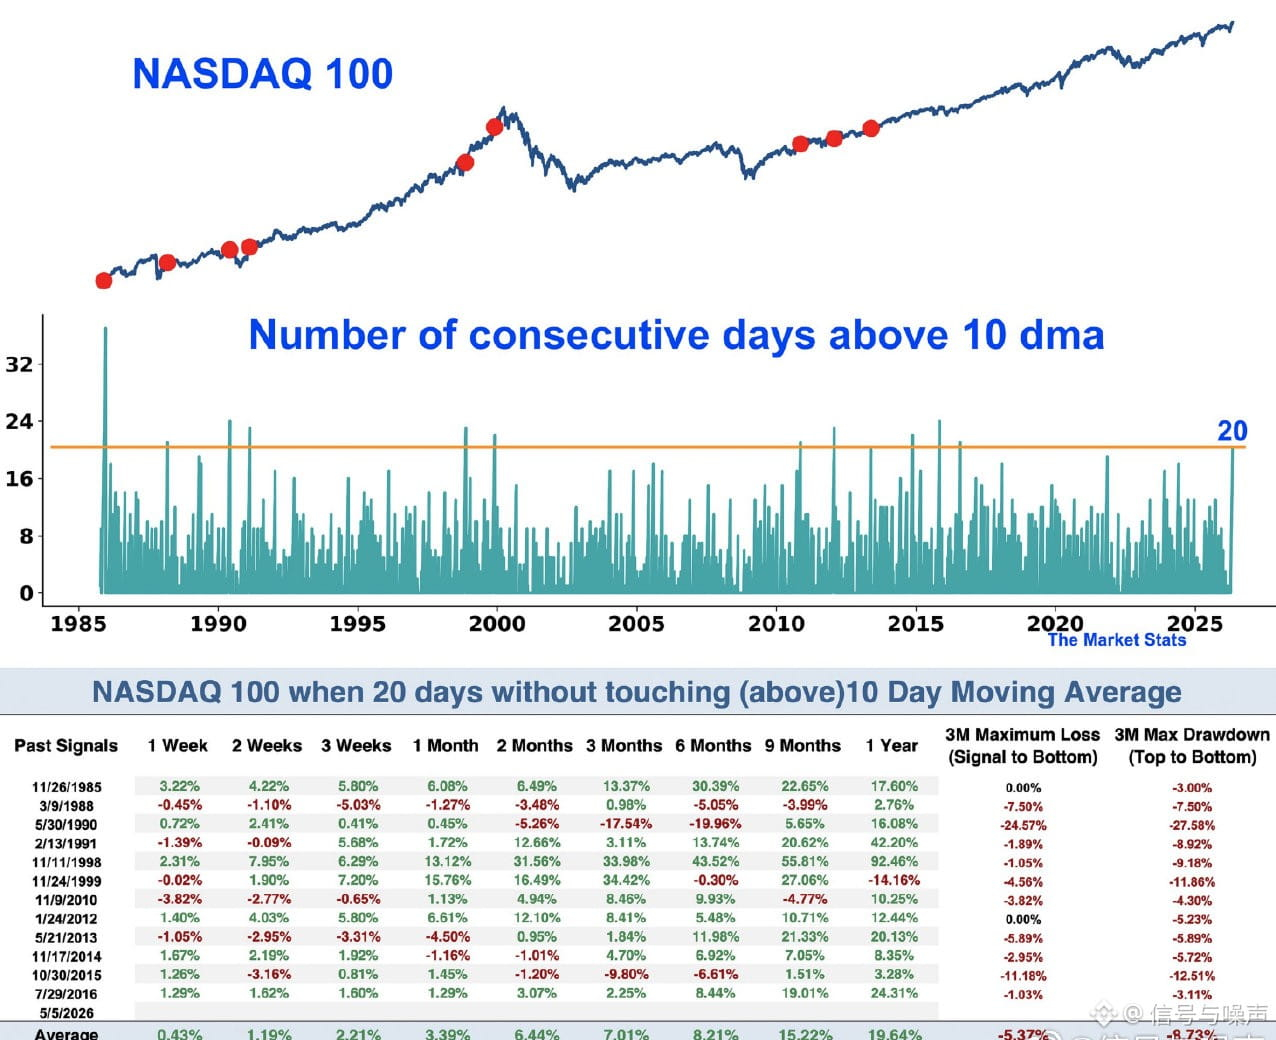
The Nasdaq 100 index has held above the 10-day moving average for 20 consecutive trading days without touching it.
Historically, after 3 months, $NDX has risen 10 out of 12 times, and after 1 year, it has risen 11 out of 12 times, with an average gain of 19.6%.
The maximum drawdown over 3 months was -8.7%.
The Nasdaq 100 index has held above the 10-day moving average for 20 consecutive trading days without touching it.
Historically, after 3 months, $NDX has risen 10 out of 12 times, and after 1 year, it has risen 11 out of 12 times, with an average gain of 19.6%.
The maximum drawdown over 3 months was -8.7%.
Historically, after 3 months, $NDX has risen 10 out of 12 times, and after 1 year, it has risen 11 out of 12 times, with an average gain of 19.6%.
The maximum drawdown over 3 months was -8.7%.
45
·
--
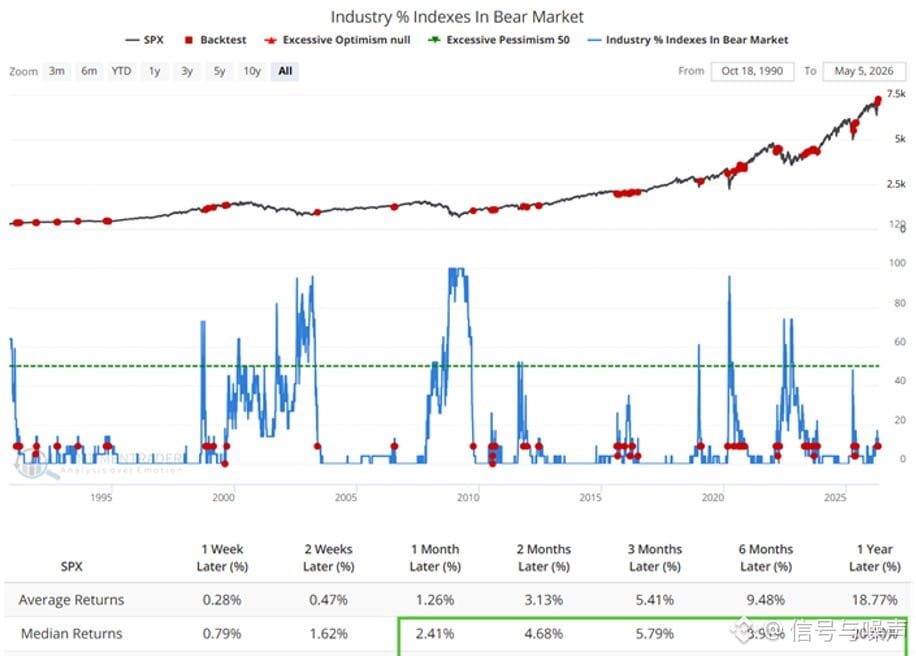
#USStocks# The sectors that have dipped more than 20% from their 52-week highs just fell back below 10%.
"Guaranteed profit?" Definitely not (just look at 2022).
Historically, is this a solid "continuation" signal? Absolutely.
#USStocks# The sectors that have dipped more than 20% from their 52-week highs just fell back below 10%.
"Guaranteed profit?" Definitely not (just look at 2022).
Historically, is this a solid "continuation" signal? Absolutely.
"Guaranteed profit?" Definitely not (just look at 2022).
Historically, is this a solid "continuation" signal? Absolutely.
26
·
--
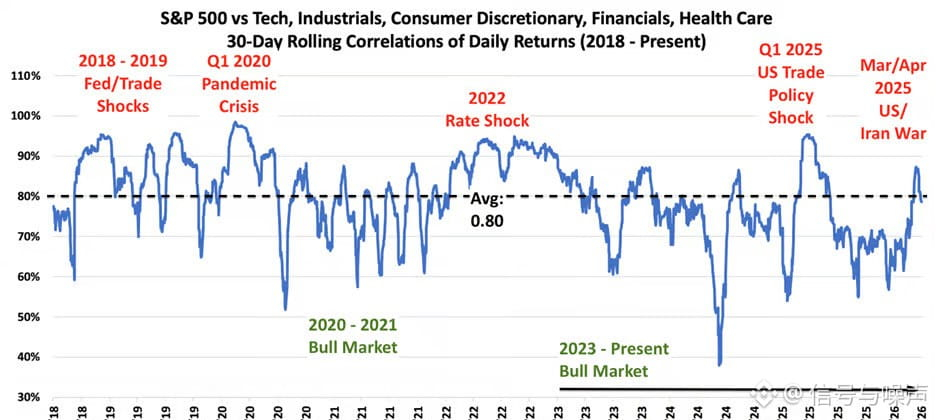
#USStockMarket# The sector correlation has pulled back from its recent high of 0.87 in mid-March to currently sitting at 0.79, slightly below the long-term average of 0.80. This indicates that investors have largely shaken off concerns regarding ongoing geopolitical tensions and persistently high energy prices.
#USStockMarket# The sector correlation has pulled back from its recent high of 0.87 in mid-March to currently sitting at 0.79, slightly below the long-term average of 0.80. This indicates that investors have largely shaken off concerns regarding ongoing geopolitical tensions and persistently high energy prices.
53
·
--
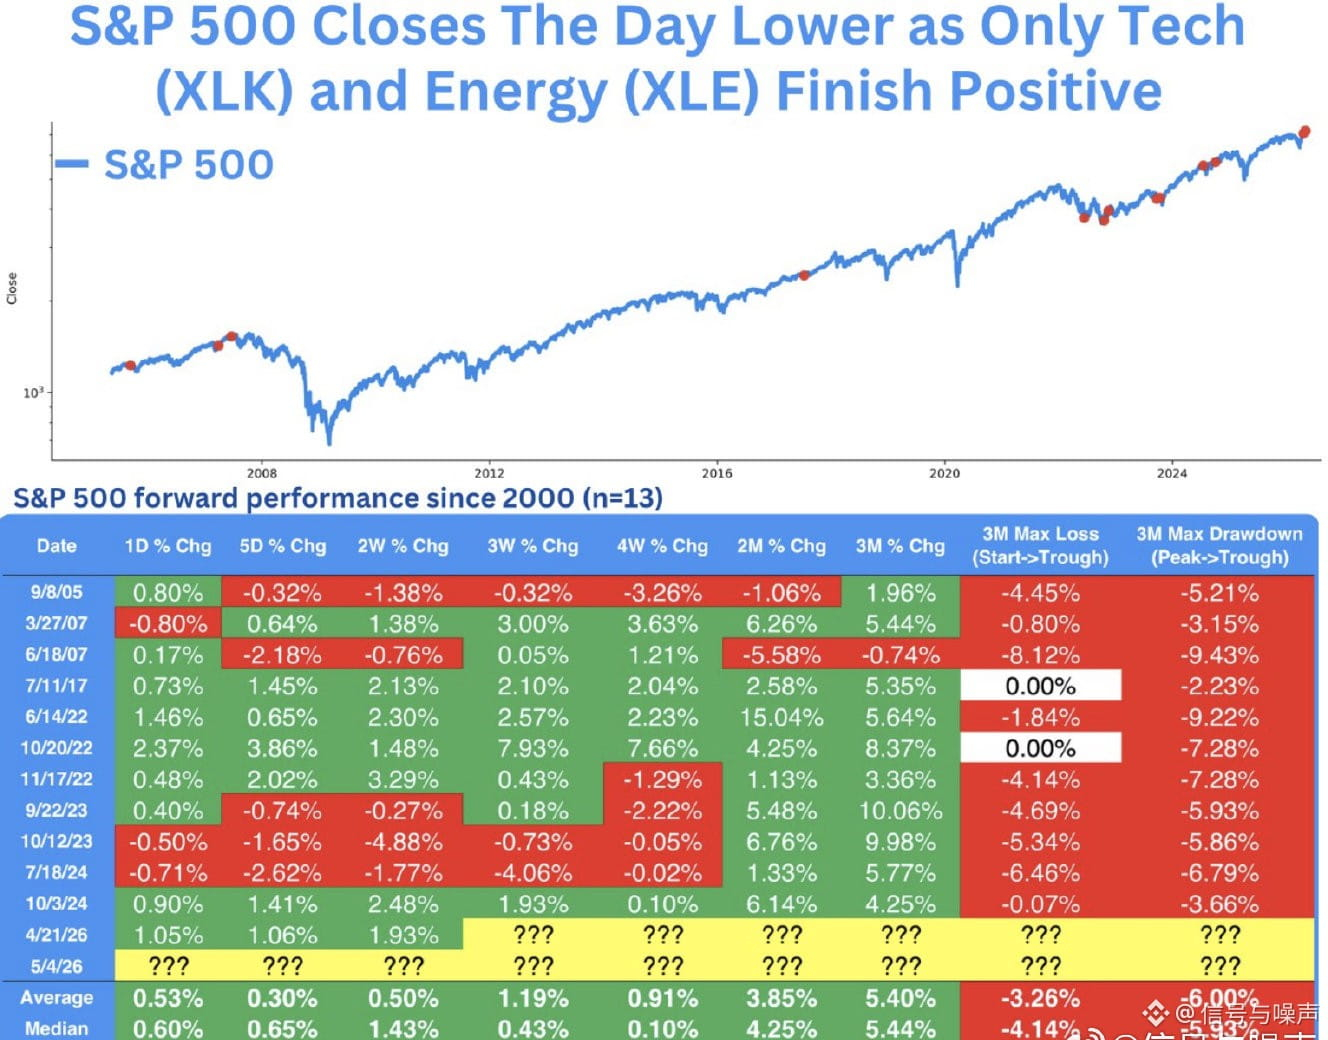
Yesterday, the market showcased an "extremely rare dumbbell style." The S&P SPY 500 index closed down, with tech and energy being the only two sectors in the green. Since 2000, this scenario has only occurred 12 times. In the following 3 months, the S&P SPY 500 index surged 10 out of 11 times on average by 5%.
Yesterday, the market showcased an "extremely rare dumbbell style." The S&P SPY 500 index closed down, with tech and energy being the only two sectors in the green. Since 2000, this scenario has only occurred 12 times. In the following 3 months, the S&P SPY 500 index surged 10 out of 11 times on average by 5%.
61
·
--
S&P SPY 500 Index Sector Weights
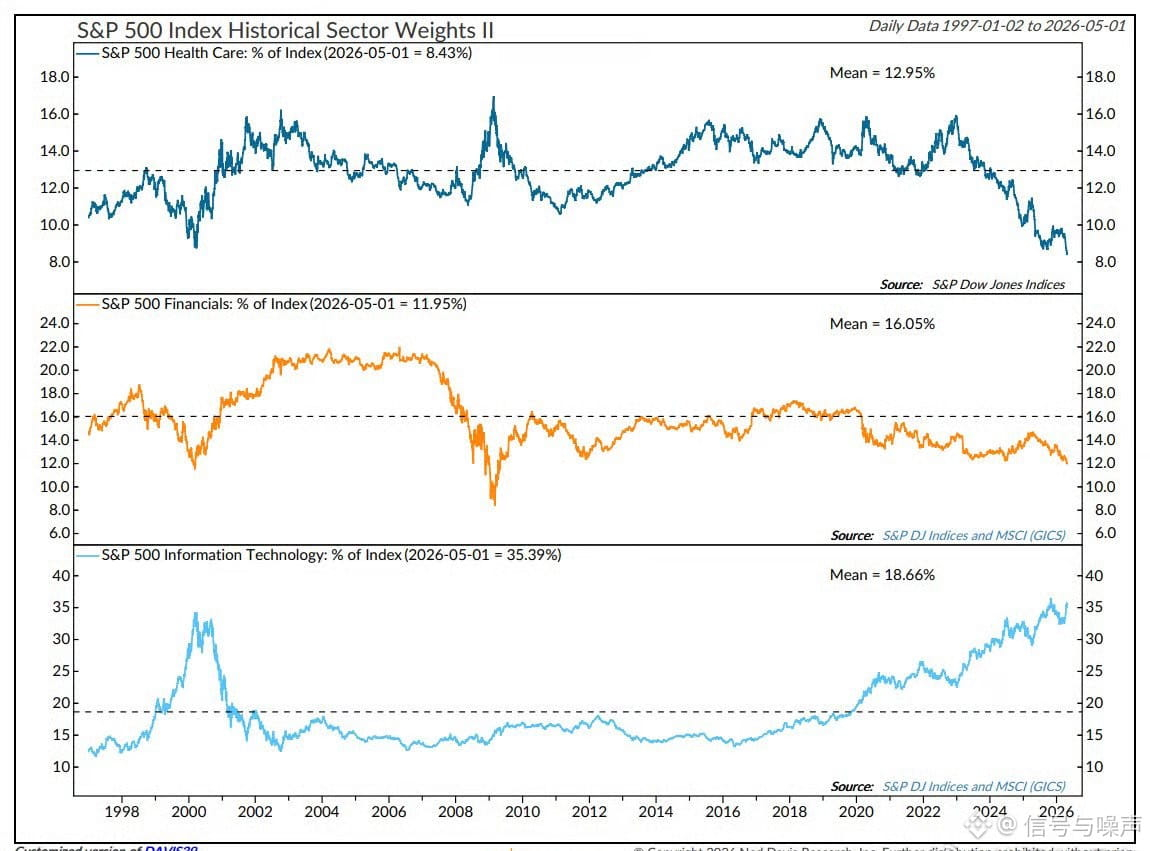
As the tech sector regains strength, the weakness in the financial and healthcare sectors has been reaffirmed since the outbreak of the war.
Currently,
the healthcare sector's weight in the S&P SPY 500 index is at its lowest level since 1994,
the financial sector's weight has dropped to its lowest point since 2009,
and the tech sector's weight is barely less than 1% off its historical high.
S&P SPY 500 Index Sector Weights
As the tech sector regains strength, the weakness in the financial and healthcare sectors has been reaffirmed since the outbreak of the war.
Currently,
the healthcare sector's weight in the S&P SPY 500 index is at its lowest level since 1994,
the financial sector's weight has dropped to its lowest point since 2009,
and the tech sector's weight is barely less than 1% off its historical high.
As the tech sector regains strength, the weakness in the financial and healthcare sectors has been reaffirmed since the outbreak of the war.
Currently,
the healthcare sector's weight in the S&P SPY 500 index is at its lowest level since 1994,
the financial sector's weight has dropped to its lowest point since 2009,
and the tech sector's weight is barely less than 1% off its historical high.
1
70
·
--
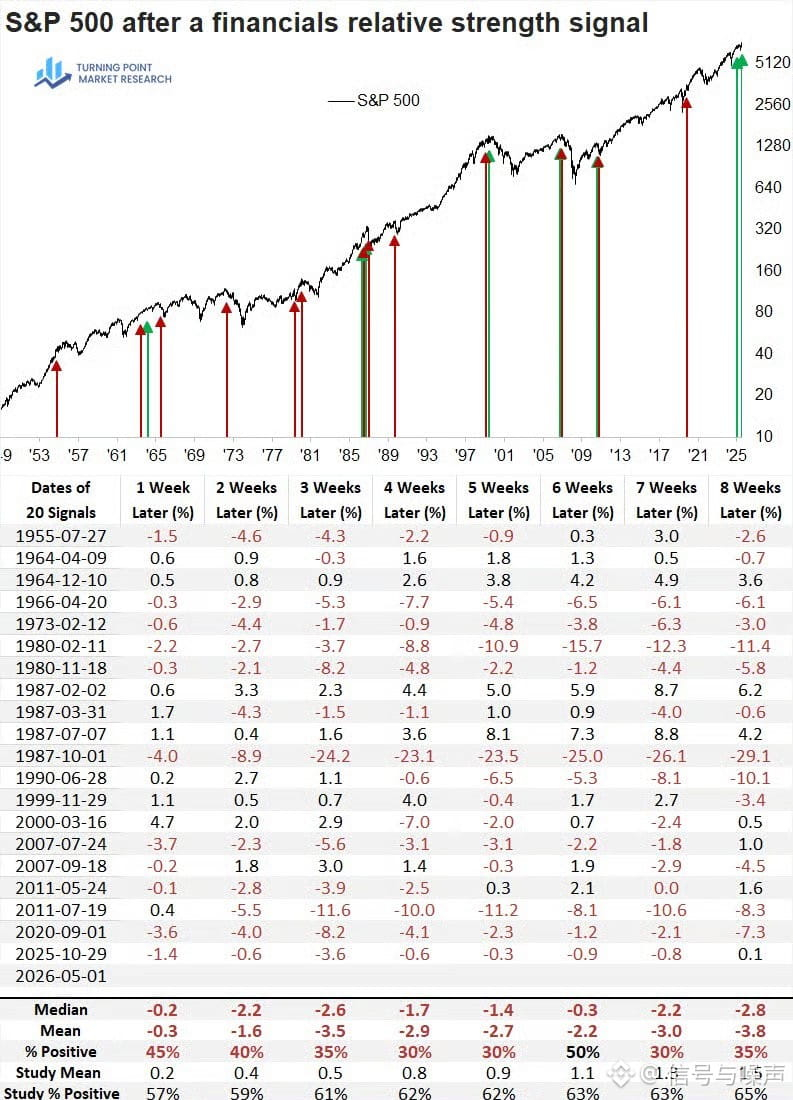
#StockMarket# When the financial sector hits a relative low of 252 days over four months, the overall market usually shows weakness in the following eight weeks.
#StockMarket# When the financial sector hits a relative low of 252 days over four months, the overall market usually shows weakness in the following eight weeks.
50
·
--
Nasdaq: Netscape and ChatGPT
Update:
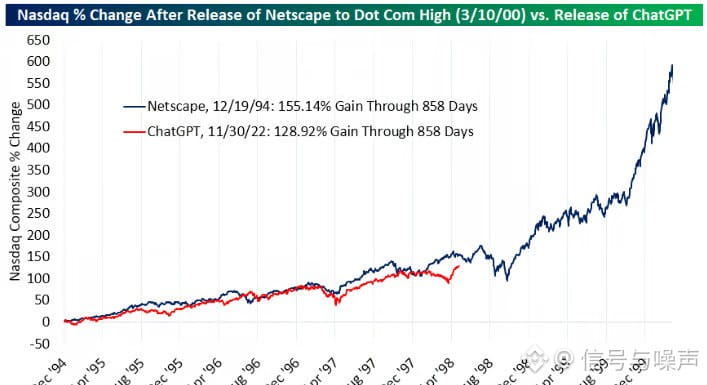
858 days after Netscape's launch in December 1994, the Nasdaq index surged 155%
858 days after ChatGPT's launch in November 2022, the Nasdaq index climbed 129%
Nasdaq: Netscape and ChatGPT
Update:
858 days after Netscape's launch in December 1994, the Nasdaq index surged 155%
858 days after ChatGPT's launch in November 2022, the Nasdaq index climbed 129%
Update:
858 days after Netscape's launch in December 1994, the Nasdaq index surged 155%
858 days after ChatGPT's launch in November 2022, the Nasdaq index climbed 129%
9
·
--
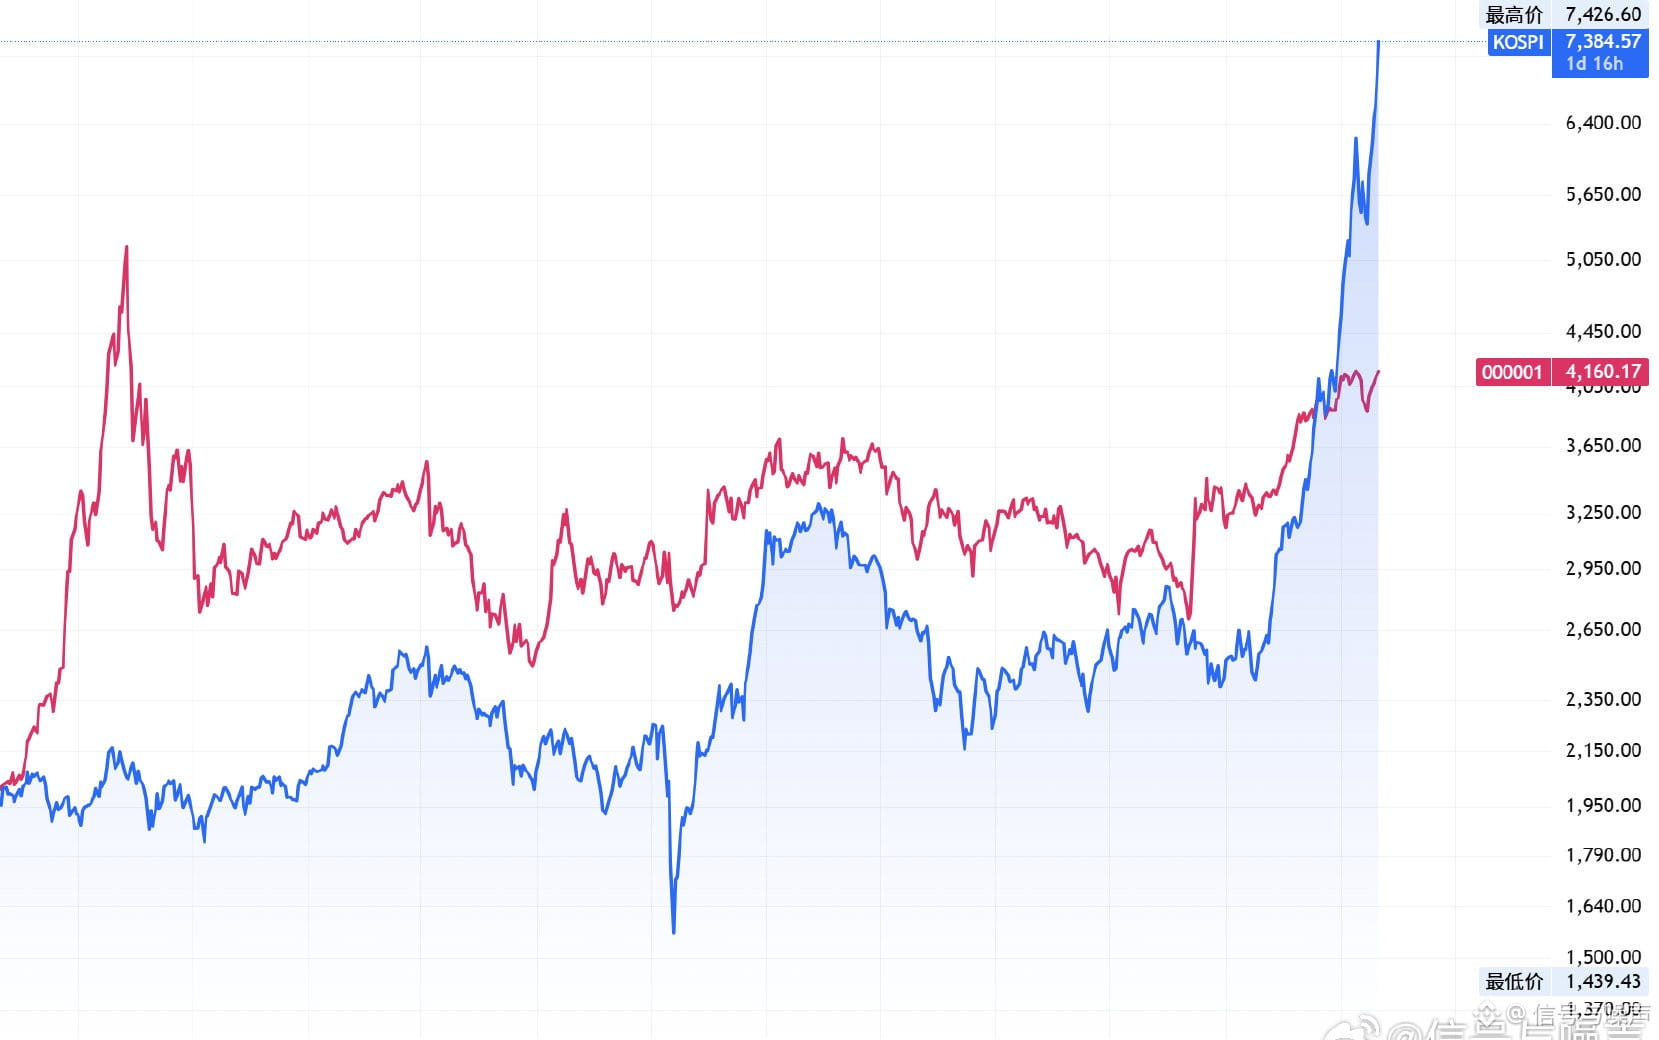
A-shares: Han! You said the market would never rise past 3,000 to 4,000 points, and here we are stuck in a sideways trend for 10 years. At the start of the year, everyone was at 4,000 points, and now you’re sitting at 7,000 points. What’s the deal?
A-shares: Han! You said the market would never rise past 3,000 to 4,000 points, and here we are stuck in a sideways trend for 10 years. At the start of the year, everyone was at 4,000 points, and now you’re sitting at 7,000 points. What’s the deal?
27
·
--
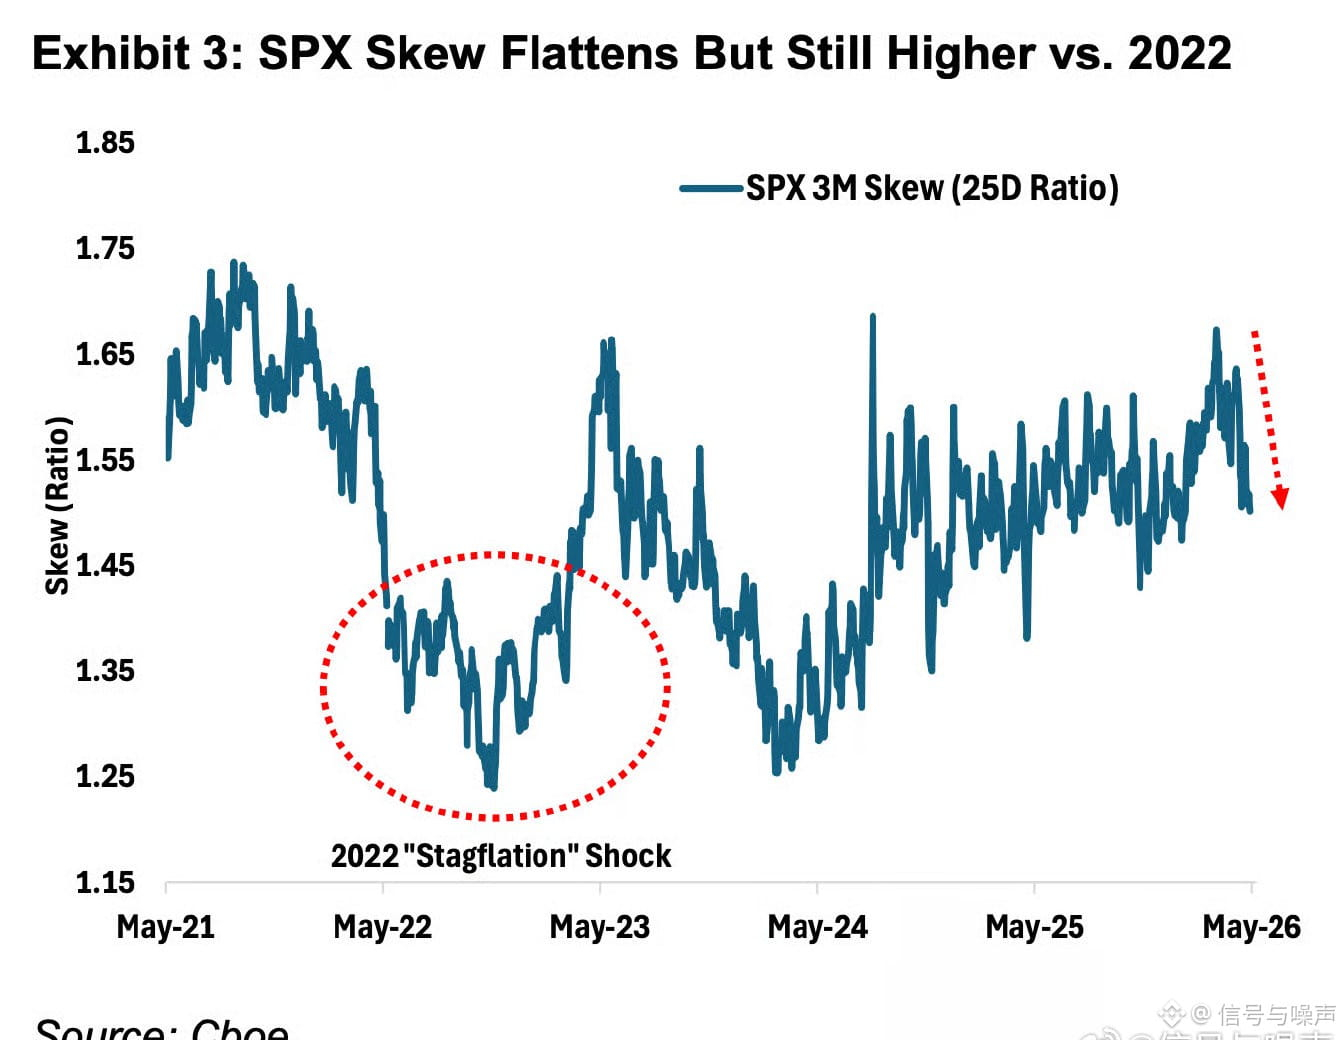
Although the skew of the S&P SPY 500 index has flattened out, its absolute level is still way above the historical lows seen in 2022. Compared to 2022, the current hedging demand is significantly higher; back then, many traders shifted their funds from stocks to cash (thus no need for hedging).
Although the skew of the S&P SPY 500 index has flattened out, its absolute level is still way above the historical lows seen in 2022. Compared to 2022, the current hedging demand is significantly higher; back then, many traders shifted their funds from stocks to cash (thus no need for hedging).
34
·
--
#Samsung Appliances Exits Mainland Market#
Samsung China's official site still retains access for mobiles, vibrators, storage, and other business entries.
#Samsung Appliances Exits Mainland Market#
Samsung China's official site still retains access for mobiles, vibrators, storage, and other business entries.
Samsung China's official site still retains access for mobiles, vibrators, storage, and other business entries.
2
·
--
#Why Some Women Are Down for Last Week's Sex Business Course#
What's this course all about?
#Why Some Women Are Down for Last Week's Sex Business Course#
What's this course all about?
What's this course all about?
·
--
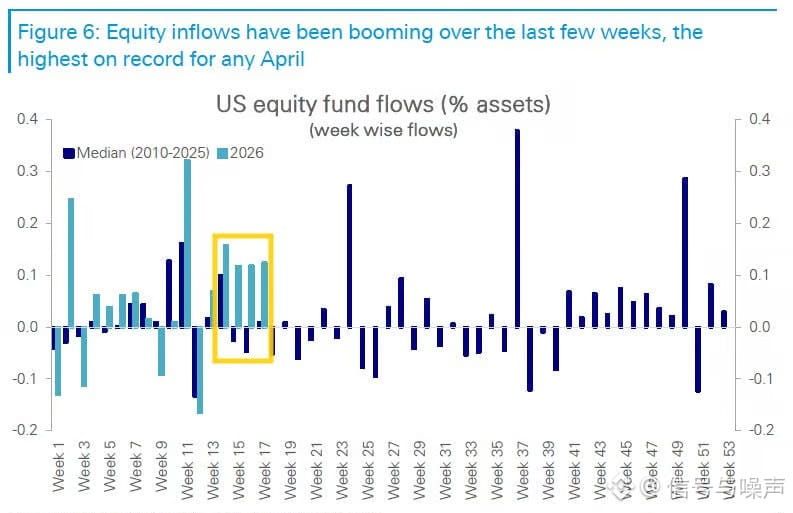
US stock funds' capital flow
Typically, April is a month with weak capital inflow, but this year saw a whopping $97 billion flowing into stocks, with $77 billion hitting the US stock market.
In fact, whether measured in dollar value or as a percentage of Assets Under Management (AUM), this marks the highest record for any April in history...
Over the past five years, US stock funds have averaged a net outflow of $7 billion in April.
US stock funds' capital flow
Typically, April is a month with weak capital inflow, but this year saw a whopping $97 billion flowing into stocks, with $77 billion hitting the US stock market.
In fact, whether measured in dollar value or as a percentage of Assets Under Management (AUM), this marks the highest record for any April in history...
Over the past five years, US stock funds have averaged a net outflow of $7 billion in April.
Typically, April is a month with weak capital inflow, but this year saw a whopping $97 billion flowing into stocks, with $77 billion hitting the US stock market.
In fact, whether measured in dollar value or as a percentage of Assets Under Management (AUM), this marks the highest record for any April in history...
Over the past five years, US stock funds have averaged a net outflow of $7 billion in April.
161
·
--
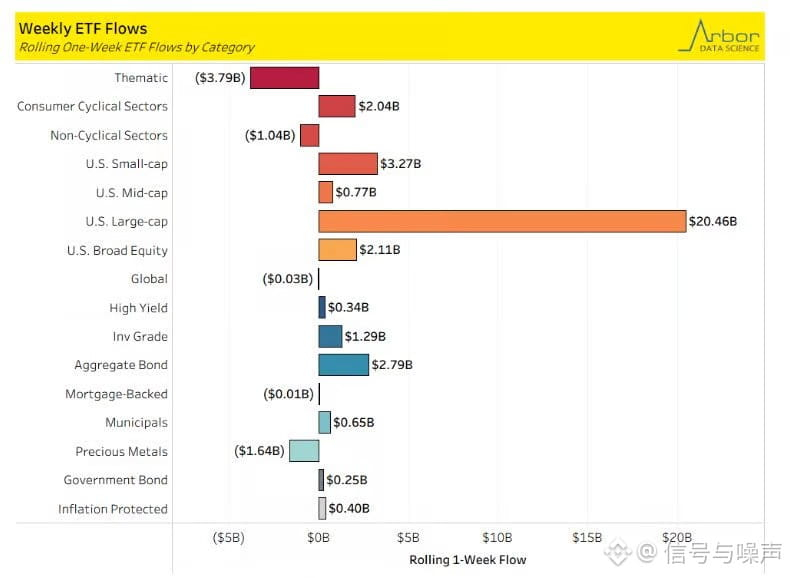
Over the past week, large-cap stocks in the US have made a strong rebound, recording the largest net inflow, followed by small-cap stocks and diversified bonds... Meanwhile, thematic funds saw the biggest net outflow.
Over the past week, large-cap stocks in the US have made a strong rebound, recording the largest net inflow, followed by small-cap stocks and diversified bonds... Meanwhile, thematic funds saw the biggest net outflow.
20
·
--
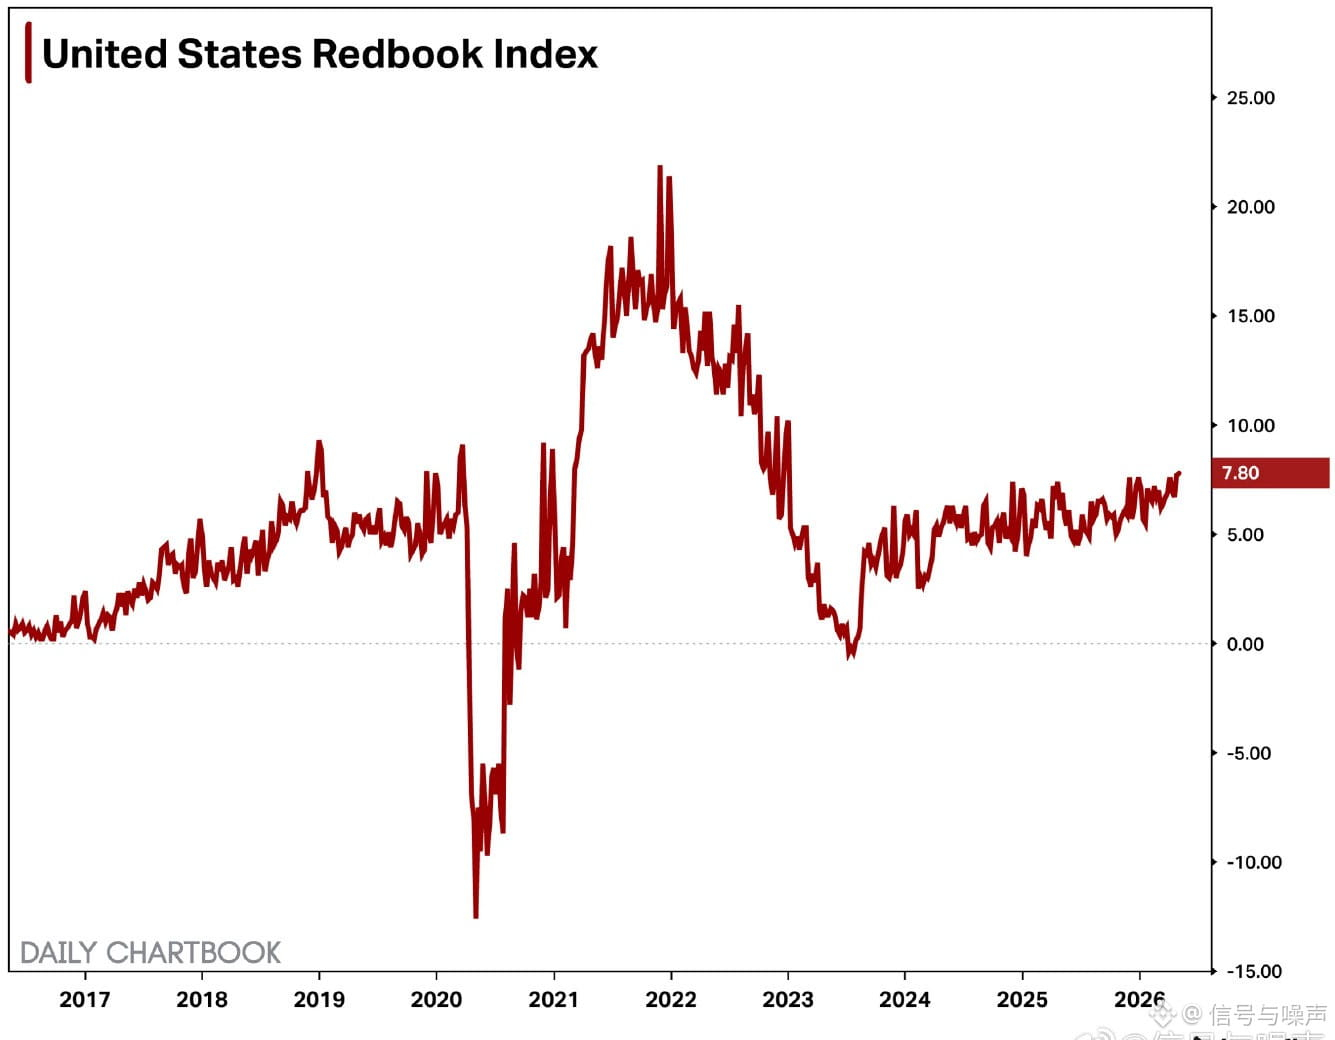
#US# As of the week ending May 2nd, same-store retail sales surged by 7.8% year-over-year (previous value was 7.7%), hitting a four-year high.
#US# As of the week ending May 2nd, same-store retail sales surged by 7.8% year-over-year (previous value was 7.7%), hitting a four-year high.
12
·
--
JOLTS hiring rate hits a two-year high, the soft landing data puzzle is coming together
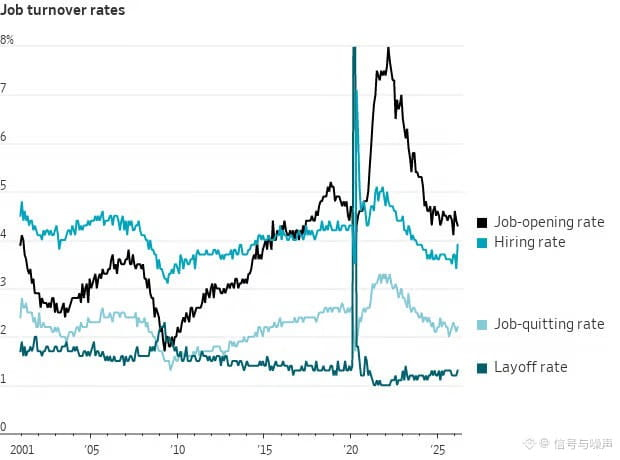
The latest JOLTS report from the U.S. Labor Department shows that in March, the private sector labor market is showcasing the "soft landing" scenario that economists have been hoping for: the hiring rate rebounded to 3.9%, marking the highest level in nearly two years, indicating that companies' willingness to hire is genuinely recovering; the job vacancy rate slightly dipped to 4.3%, close to a one-year low, with frictional mismatches continuing to decrease; the layoff rate only ticked up from 1.2% to 1.3%, still at a historical low, with almost no signs of companies actively cutting back on staff.
This data resonates positively with other recent macroeconomic indicators: the voluntary resignation rate has fallen back to pre-pandemic levels of 2019, and the wage inflation pressure from the "Great Resignation" has basically dissipated; combined with the trimmed mean PCE annualized dropping to 2.3%, both inflation and employment are trending towards normalization.
JOLTS hiring rate hits a two-year high, the soft landing data puzzle is coming together
The latest JOLTS report from the U.S. Labor Department shows that in March, the private sector labor market is showcasing the "soft landing" scenario that economists have been hoping for: the hiring rate rebounded to 3.9%, marking the highest level in nearly two years, indicating that companies' willingness to hire is genuinely recovering; the job vacancy rate slightly dipped to 4.3%, close to a one-year low, with frictional mismatches continuing to decrease; the layoff rate only ticked up from 1.2% to 1.3%, still at a historical low, with almost no signs of companies actively cutting back on staff.
This data resonates positively with other recent macroeconomic indicators: the voluntary resignation rate has fallen back to pre-pandemic levels of 2019, and the wage inflation pressure from the "Great Resignation" has basically dissipated; combined with the trimmed mean PCE annualized dropping to 2.3%, both inflation and employment are trending towards normalization.
The latest JOLTS report from the U.S. Labor Department shows that in March, the private sector labor market is showcasing the "soft landing" scenario that economists have been hoping for: the hiring rate rebounded to 3.9%, marking the highest level in nearly two years, indicating that companies' willingness to hire is genuinely recovering; the job vacancy rate slightly dipped to 4.3%, close to a one-year low, with frictional mismatches continuing to decrease; the layoff rate only ticked up from 1.2% to 1.3%, still at a historical low, with almost no signs of companies actively cutting back on staff.
This data resonates positively with other recent macroeconomic indicators: the voluntary resignation rate has fallen back to pre-pandemic levels of 2019, and the wage inflation pressure from the "Great Resignation" has basically dissipated; combined with the trimmed mean PCE annualized dropping to 2.3%, both inflation and employment are trending towards normalization.
52
·
--
OpenAI is opening up retail investing; computing power shortages are the biggest bottleneck
1. Revenue Structure and User Behavior
1. User Segmentation and Conversion
Among 900 million weekly active users, 95% are free users
Paid users engage 11 times more than free users
The deeper the user understanding, the higher the engagement and willingness to pay
2. Changes in Revenue Structure
The current ratio of consumer to enterprise business is 6:4
Enterprise business is growing rapidly and is expected to catch up to consumer business by the end of 2026
Advertising pilot launched for 8 weeks, with annualized revenue exceeding $100 million
3. Advertising Business Model
Ads are matched to conversational intent rather than selling user data
Emphasizes that ads do not affect model response quality
Currently expanding from the US to Canada, New Zealand, and Australia
2. Enterprise AI Products and Ecosystem
1. Codex Programming Tool
Weekly active developers reach 4 million, with rapid growth
Showcases real application scenarios for Agents
The CFO personally uses multiple agents to handle financial tasks
2. Three-Tier Enterprise Product System
API Integration Layer
ChatGPT Enterprise Deployment Layer
Frontier Platform (complete AI transformation solution)
3. Industry Penetration Cases
Banking clients include BNY, BBVA, and others
Successful companies feature: CEO involvement with clear strategic focus
3. Computing Power Strategy and Capital Planning
1. Current Supply and Demand for Computing Power
Computing power planning is done on a ten-year basis
By 2026, there will again be a shortage of computing power
Demand shows a “vertical ascent” trend
2. Supply Chain Diversification
Expanding from a single supplier to multi-cloud and multi-chip combinations
Cloud service providers include Microsoft, Oracle, Amazon AMZN, Google, etc.
Chip collaborations include Nvidia, AMD, and Cerebras
3. Capital Operations
Completed $122 billion financing, with a valuation of $852 billion
Investment in computing power is key to maintaining the “data-model-product-revenue” flywheel
4. Technological Evolution and AGI Outlook
1. Vertical Domain Models
Released GPT-Rosalind, focusing on the life sciences sector
Collaborating with biotech companies like Amgen and Moderna
AI is expected to shorten drug development cycles from ten years to one or two years
2. Path to AGI Development
AGI is a gradual process, not a sudden switch
Work scenarios are transitioning to a “human + agent” hybrid model
The job market will see disruption, enhancement, and new creation coexisting
5. Retail Investment Channels
1. RVI Fund Features
A closed-end fund under Robinhood, code RVI
Listed on the NYSE on March 6, 2026
No qualified investor thresholds, no performance fees
2. Investment Composition
Purchased $75 million of OpenAI common stock on April 17, 2026
The fund also includes 10 unicorns like Airwallex and Databricks
OpenAI actively chose this channel to open up to retail investors
Core Conclusion:
OpenAI is at a critical juncture, shifting from a purely consumer subscription model to a diversified revenue structure, with advertising and enterprise services becoming new growth engines. Despite facing hard constraints of computing power shortages, the company ensures long-term development through $122 billion in financing and supply chain diversification. Retail investors gain access through channels like the RVI fund, reflecting the trend of AI assets becoming mainstream. Potential risks include underwhelming computing construction, advertising impacting user experience, and ethical and regulatory challenges brought by AGI development.
OpenAI is opening up retail investing; computing power shortages are the biggest bottleneck
1. Revenue Structure and User Behavior
1. User Segmentation and Conversion
Among 900 million weekly active users, 95% are free users
Paid users engage 11 times more than free users
The deeper the user understanding, the higher the engagement and willingness to pay
2. Changes in Revenue Structure
The current ratio of consumer to enterprise business is 6:4
Enterprise business is growing rapidly and is expected to catch up to consumer business by the end of 2026
Advertising pilot launched for 8 weeks, with annualized revenue exceeding $100 million
3. Advertising Business Model
Ads are matched to conversational intent rather than selling user data
Emphasizes that ads do not affect model response quality
Currently expanding from the US to Canada, New Zealand, and Australia
2. Enterprise AI Products and Ecosystem
1. Codex Programming Tool
Weekly active developers reach 4 million, with rapid growth
Showcases real application scenarios for Agents
The CFO personally uses multiple agents to handle financial tasks
2. Three-Tier Enterprise Product System
API Integration Layer
ChatGPT Enterprise Deployment Layer
Frontier Platform (complete AI transformation solution)
3. Industry Penetration Cases
Banking clients include BNY, BBVA, and others
Successful companies feature: CEO involvement with clear strategic focus
3. Computing Power Strategy and Capital Planning
1. Current Supply and Demand for Computing Power
Computing power planning is done on a ten-year basis
By 2026, there will again be a shortage of computing power
Demand shows a “vertical ascent” trend
2. Supply Chain Diversification
Expanding from a single supplier to multi-cloud and multi-chip combinations
Cloud service providers include Microsoft, Oracle, Amazon AMZN, Google, etc.
Chip collaborations include Nvidia, AMD, and Cerebras
3. Capital Operations
Completed $122 billion financing, with a valuation of $852 billion
Investment in computing power is key to maintaining the “data-model-product-revenue” flywheel
4. Technological Evolution and AGI Outlook
1. Vertical Domain Models
Released GPT-Rosalind, focusing on the life sciences sector
Collaborating with biotech companies like Amgen and Moderna
AI is expected to shorten drug development cycles from ten years to one or two years
2. Path to AGI Development
AGI is a gradual process, not a sudden switch
Work scenarios are transitioning to a “human + agent” hybrid model
The job market will see disruption, enhancement, and new creation coexisting
5. Retail Investment Channels
1. RVI Fund Features
A closed-end fund under Robinhood, code RVI
Listed on the NYSE on March 6, 2026
No qualified investor thresholds, no performance fees
2. Investment Composition
Purchased $75 million of OpenAI common stock on April 17, 2026
The fund also includes 10 unicorns like Airwallex and Databricks
OpenAI actively chose this channel to open up to retail investors
Core Conclusion:
OpenAI is at a critical juncture, shifting from a purely consumer subscription model to a diversified revenue structure, with advertising and enterprise services becoming new growth engines. Despite facing hard constraints of computing power shortages, the company ensures long-term development through $122 billion in financing and supply chain diversification. Retail investors gain access through channels like the RVI fund, reflecting the trend of AI assets becoming mainstream. Potential risks include underwhelming computing construction, advertising impacting user experience, and ethical and regulatory challenges brought by AGI development.
1. Revenue Structure and User Behavior
1. User Segmentation and Conversion
Among 900 million weekly active users, 95% are free users
Paid users engage 11 times more than free users
The deeper the user understanding, the higher the engagement and willingness to pay
2. Changes in Revenue Structure
The current ratio of consumer to enterprise business is 6:4
Enterprise business is growing rapidly and is expected to catch up to consumer business by the end of 2026
Advertising pilot launched for 8 weeks, with annualized revenue exceeding $100 million
3. Advertising Business Model
Ads are matched to conversational intent rather than selling user data
Emphasizes that ads do not affect model response quality
Currently expanding from the US to Canada, New Zealand, and Australia
2. Enterprise AI Products and Ecosystem
1. Codex Programming Tool
Weekly active developers reach 4 million, with rapid growth
Showcases real application scenarios for Agents
The CFO personally uses multiple agents to handle financial tasks
2. Three-Tier Enterprise Product System
API Integration Layer
ChatGPT Enterprise Deployment Layer
Frontier Platform (complete AI transformation solution)
3. Industry Penetration Cases
Banking clients include BNY, BBVA, and others
Successful companies feature: CEO involvement with clear strategic focus
3. Computing Power Strategy and Capital Planning
1. Current Supply and Demand for Computing Power
Computing power planning is done on a ten-year basis
By 2026, there will again be a shortage of computing power
Demand shows a “vertical ascent” trend
2. Supply Chain Diversification
Expanding from a single supplier to multi-cloud and multi-chip combinations
Cloud service providers include Microsoft, Oracle, Amazon AMZN, Google, etc.
Chip collaborations include Nvidia, AMD, and Cerebras
3. Capital Operations
Completed $122 billion financing, with a valuation of $852 billion
Investment in computing power is key to maintaining the “data-model-product-revenue” flywheel
4. Technological Evolution and AGI Outlook
1. Vertical Domain Models
Released GPT-Rosalind, focusing on the life sciences sector
Collaborating with biotech companies like Amgen and Moderna
AI is expected to shorten drug development cycles from ten years to one or two years
2. Path to AGI Development
AGI is a gradual process, not a sudden switch
Work scenarios are transitioning to a “human + agent” hybrid model
The job market will see disruption, enhancement, and new creation coexisting
5. Retail Investment Channels
1. RVI Fund Features
A closed-end fund under Robinhood, code RVI
Listed on the NYSE on March 6, 2026
No qualified investor thresholds, no performance fees
2. Investment Composition
Purchased $75 million of OpenAI common stock on April 17, 2026
The fund also includes 10 unicorns like Airwallex and Databricks
OpenAI actively chose this channel to open up to retail investors
Core Conclusion:
OpenAI is at a critical juncture, shifting from a purely consumer subscription model to a diversified revenue structure, with advertising and enterprise services becoming new growth engines. Despite facing hard constraints of computing power shortages, the company ensures long-term development through $122 billion in financing and supply chain diversification. Retail investors gain access through channels like the RVI fund, reflecting the trend of AI assets becoming mainstream. Potential risks include underwhelming computing construction, advertising impacting user experience, and ethical and regulatory challenges brought by AGI development.
43
·
--
#USA# March median home price $390,000
Over 2,000 sqft single-family home with no shared space
By 2026, the median household income in the US is projected to be around $84,000 - $87,000
#USA# March median home price $390,000
Over 2,000 sqft single-family home with no shared space
By 2026, the median household income in the US is projected to be around $84,000 - $87,000
Over 2,000 sqft single-family home with no shared space
By 2026, the median household income in the US is projected to be around $84,000 - $87,000
72
·
--
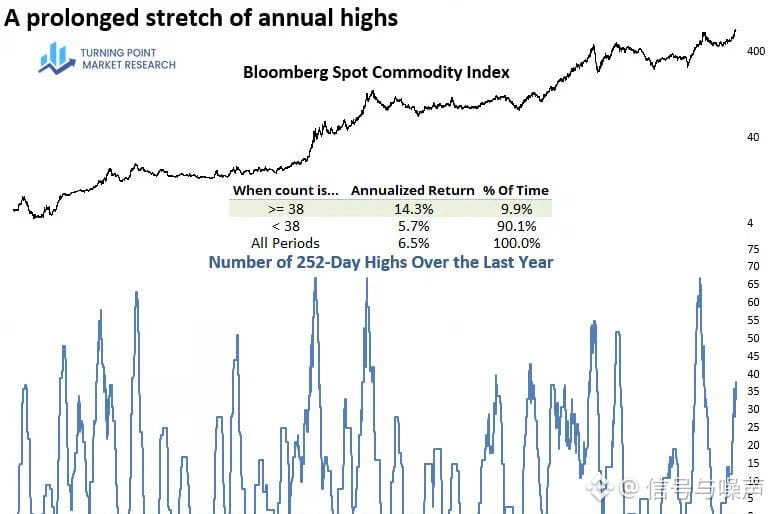
The Bloomberg Spot Commodity Index skyrocketed to a new high last week. This marks the 38th time in the past year that the index hit a new 252-day high. Historically, this has only happened 11 other times. When the rolling count reaches 38, the annualized returns generated by the index historically stand at 14.3%, more than double its long-term average returns.
The Bloomberg Spot Commodity Index skyrocketed to a new high last week. This marks the 38th time in the past year that the index hit a new 252-day high. Historically, this has only happened 11 other times. When the rolling count reaches 38, the annualized returns generated by the index historically stand at 14.3%, more than double its long-term average returns.
48
·
--
The ratio of commodity countries to tech countries has hit historic support lows, and the four-year cycle rotation window has quietly opened.
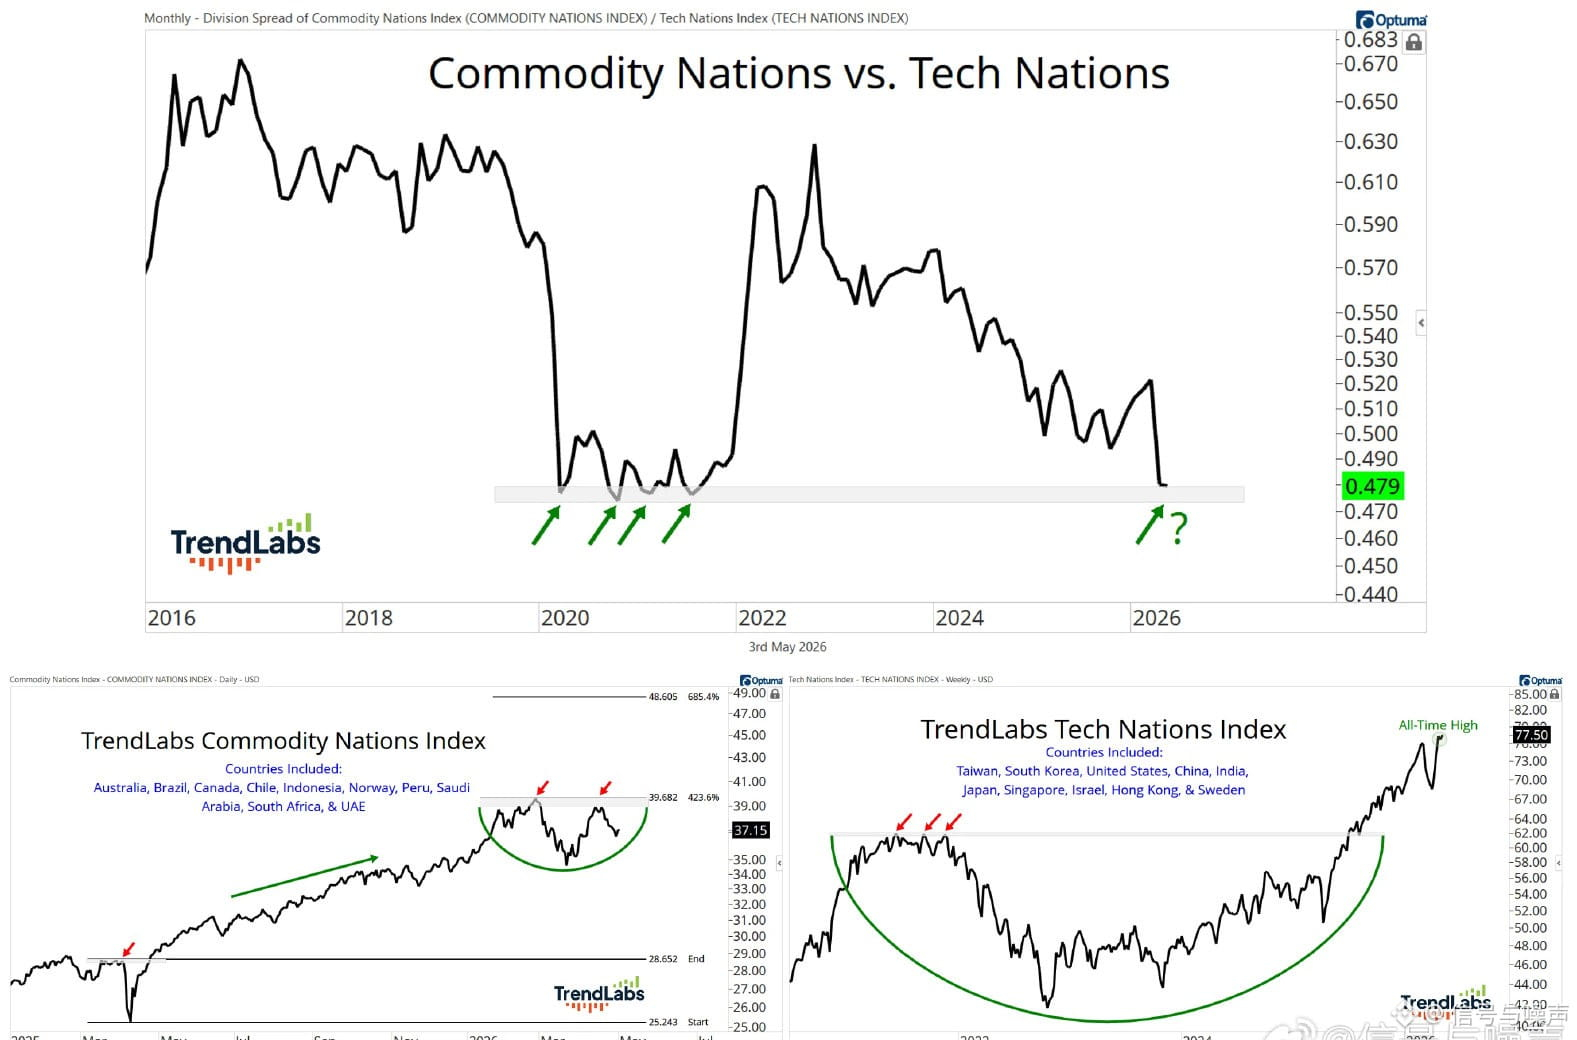
A global asset allocation signal worth keeping a close eye on: the ratio of the commodity country index to the tech country index has fallen to 0.479, nearing the critical historical support zone established at the pandemic's bottom in 2020. That same support level in 2020 triggered a nearly two-year bullish reversal for commodity countries, leading to the onset of a supercycle for commodities.
The tech country index (including the US, Taiwan, South Korea, China, etc.) has currently reached a historic high of 77.50, with its strong dominance over the past four years pushing valuations to record levels; meanwhile, the commodity country index (including Australia, Brazil, Canada, Saudi Arabia, etc.) is forming a rounded bottom pattern on the technical charts after plummeting due to tariff shocks in March 2026, awaiting a confirmation breakout.
However, the rotation signal still requires validation. The tech country index continuously hitting new highs indicates that the bullish trend is not yet over, and the neckline of the rounded bottom has yet to be broken, making a full switch risky. For global allocation investors, the optimal strategy now is to gradually reduce exposure to overvalued tech countries and build positions in batches after the commodity countries confirm their technical breakout—historical patterns show that once these cyclical rotations start, they often last for more than two years, with favorable odds.
The ratio of commodity countries to tech countries has hit historic support lows, and the four-year cycle rotation window has quietly opened.
A global asset allocation signal worth keeping a close eye on: the ratio of the commodity country index to the tech country index has fallen to 0.479, nearing the critical historical support zone established at the pandemic's bottom in 2020. That same support level in 2020 triggered a nearly two-year bullish reversal for commodity countries, leading to the onset of a supercycle for commodities.
The tech country index (including the US, Taiwan, South Korea, China, etc.) has currently reached a historic high of 77.50, with its strong dominance over the past four years pushing valuations to record levels; meanwhile, the commodity country index (including Australia, Brazil, Canada, Saudi Arabia, etc.) is forming a rounded bottom pattern on the technical charts after plummeting due to tariff shocks in March 2026, awaiting a confirmation breakout.
However, the rotation signal still requires validation. The tech country index continuously hitting new highs indicates that the bullish trend is not yet over, and the neckline of the rounded bottom has yet to be broken, making a full switch risky. For global allocation investors, the optimal strategy now is to gradually reduce exposure to overvalued tech countries and build positions in batches after the commodity countries confirm their technical breakout—historical patterns show that once these cyclical rotations start, they often last for more than two years, with favorable odds.
A global asset allocation signal worth keeping a close eye on: the ratio of the commodity country index to the tech country index has fallen to 0.479, nearing the critical historical support zone established at the pandemic's bottom in 2020. That same support level in 2020 triggered a nearly two-year bullish reversal for commodity countries, leading to the onset of a supercycle for commodities.
The tech country index (including the US, Taiwan, South Korea, China, etc.) has currently reached a historic high of 77.50, with its strong dominance over the past four years pushing valuations to record levels; meanwhile, the commodity country index (including Australia, Brazil, Canada, Saudi Arabia, etc.) is forming a rounded bottom pattern on the technical charts after plummeting due to tariff shocks in March 2026, awaiting a confirmation breakout.
However, the rotation signal still requires validation. The tech country index continuously hitting new highs indicates that the bullish trend is not yet over, and the neckline of the rounded bottom has yet to be broken, making a full switch risky. For global allocation investors, the optimal strategy now is to gradually reduce exposure to overvalued tech countries and build positions in batches after the commodity countries confirm their technical breakout—historical patterns show that once these cyclical rotations start, they often last for more than two years, with favorable odds.
60
Log in to explore more content
Join global crypto users on Binance Square
⚡️ Get latest and useful information about crypto.
💬 Trusted by the world’s largest crypto exchange.
👍 Discover real insights from verified creators.
Email / Phone number
Trending Topics
MultiversXPlansHardForkRecovery
68 views
50 Discussing
#multiversxplanshardforkrecovery
⚡ MULTIVERSX ENTERS RECOVERY MODE: HARD FORK PLAN REVEALED ⚡
When the chain falls silent,
The real test begins when it must rise again.
MultiversX has identified the root cause of the recent attack as an ordering error in an edge case that enabled invalid state changes. Validators responded quickly, containing the incident.
Now comes the critical phase: MultiversX plans a coordinated hard fork from a known-good checkpoint. The recovery will first be rehearsed on Testnet and Devnet with validators before the network restart.
Until an official all-clear, the team has told users not to submit or rebroadcast transactions and not to use EGLD/ESDT deposit or withdrawal routes through exchanges or bridges. Services are expected to reopen in stages after recovery.
My Take: This is no longer about speed or features. It is about whether MultiversX can restore a clean, verifiable state and rebuild confidence through disciplined execution.
The biggest risk now is not the announcement itself, but the recovery process. Testing, validator coordination, state integrity, and the eventual reopening of infrastructure all matter more than short-term market reactions.
A hard fork can restart a network. Only reliable execution can restart trust.
Do you think successful recovery could become the foundation for MultiversX's next chapter?
Disclaimer: Educational content only, not financial advice.
#MultiversX #CryptoSecurity #GrowWithSAC $EGLD $SAGA $FTT
#MultiversXPlansHardForkRecovery
SAC-King-你真棒-带我走
·0 Likes
·204 views
CircleLaunchesInstitutionalBTCBackedBorrowing
1,417 views
212 Discussing
BitcoinHits$85K
4,617 views
175 Discussing