

Cacheton2561
36 Posts

Cacheton2561
Report
Block User
0 Following
27 Followers
56 Liked
Posts
·
--
The Supreme Court of the United States struck down Trump's tariffs: strong impact on global tradeThe U.S. Supreme Court declared this Friday that the U.S. government exceeded its emergency powers invoked by President Donald Trump to impose many of his tariffs on the country's trade partners, in a significant setback to his tariff policy.
With a clear majority of 6-3, the Supreme Court, dominated by conservatives, thus dealt one of the first major setbacks to Trump during his second term, a shift in the trend that had so far been favorable to the president on other key issues of his agenda.
The Supreme Court of the United States struck down Trump's tariffs: strong impact on global trade
The U.S. Supreme Court declared this Friday that the U.S. government exceeded its emergency powers invoked by President Donald Trump to impose many of his tariffs on the country's trade partners, in a significant setback to his tariff policy.
With a clear majority of 6-3, the Supreme Court, dominated by conservatives, thus dealt one of the first major setbacks to Trump during his second term, a shift in the trend that had so far been favorable to the president on other key issues of his agenda.
With a clear majority of 6-3, the Supreme Court, dominated by conservatives, thus dealt one of the first major setbacks to Trump during his second term, a shift in the trend that had so far been favorable to the president on other key issues of his agenda.
88
·
--
XRP Shoots Towards $60: Technical Analysis and ForecastsCryptocurrency analyst CryptoBull has highlighted a bullish pattern that could send the price of $XRP up to $60. This ultra-bullish prediction comes as the alternative cryptocurrency continues to struggle to overcome key resistance levels amid the current downtrend in the cryptocurrency market.
The price of XRP could reach $60 with this Cup and Handle pattern
In a post on X, CryptoBull revealed that a Cup and Handle pattern is developing on the monthly chart and that the measured target for XRP is $60. In another post on X, the analyst suggested that the downtrend of the alternative cryptocurrency may be about to end and it could begin a run towards double digits.
XRP Shoots Towards $60: Technical Analysis and Forecasts
Cryptocurrency analyst CryptoBull has highlighted a bullish pattern that could send the price of $XRP up to $60. This ultra-bullish prediction comes as the alternative cryptocurrency continues to struggle to overcome key resistance levels amid the current downtrend in the cryptocurrency market.
The price of XRP could reach $60 with this Cup and Handle pattern
In a post on X, CryptoBull revealed that a Cup and Handle pattern is developing on the monthly chart and that the measured target for XRP is $60. In another post on X, the analyst suggested that the downtrend of the alternative cryptocurrency may be about to end and it could begin a run towards double digits.
The price of XRP could reach $60 with this Cup and Handle pattern
In a post on X, CryptoBull revealed that a Cup and Handle pattern is developing on the monthly chart and that the measured target for XRP is $60. In another post on X, the analyst suggested that the downtrend of the alternative cryptocurrency may be about to end and it could begin a run towards double digits.
1
1
526
·
--
The price of XRP could fall to $0.87 if the Bitcoin crash deepens!The cryptocurrency analyst TARA has predicted that the price of XRP could still fall below the psychological level of $1. This happened while drawing the correlation of the alternative cryptocurrency with Bitcoin's price action, highlighting how a BTC crash could also lead XRP to a low of $0.87.
The Price of $XRP Could Fall to $0.87 If the Bitcoin Crash Deepens
In a post on X, TARA stated that a Bitcoin crash to $52,200 would bring the price of XRP to its .786 support at $0.87. She noted that this level is also the .618 extension and the gap left by the liquidation event on October 10. The analyst made these comments while pointing out what she was observing in XRP during this downward market trend.
The price of XRP could fall to $0.87 if the Bitcoin crash deepens!
The cryptocurrency analyst TARA has predicted that the price of XRP could still fall below the psychological level of $1. This happened while drawing the correlation of the alternative cryptocurrency with Bitcoin's price action, highlighting how a BTC crash could also lead XRP to a low of $0.87.
The Price of $XRP Could Fall to $0.87 If the Bitcoin Crash Deepens
In a post on X, TARA stated that a Bitcoin crash to $52,200 would bring the price of XRP to its .786 support at $0.87. She noted that this level is also the .618 extension and the gap left by the liquidation event on October 10. The analyst made these comments while pointing out what she was observing in XRP during this downward market trend.
The Price of $XRP Could Fall to $0.87 If the Bitcoin Crash Deepens
In a post on X, TARA stated that a Bitcoin crash to $52,200 would bring the price of XRP to its .786 support at $0.87. She noted that this level is also the .618 extension and the gap left by the liquidation event on October 10. The analyst made these comments while pointing out what she was observing in XRP during this downward market trend.
155
·
--
Ethereum On The Decline: Will It Recover Or Fall Below $1,980?
The price of $ETH began a recovery wave above $2,000. ETH is now consolidating and remains at risk of another decline below $1,980.
•Ethereum struggled to extend gains above $2,120 and corrected downward.
•The price is operating below $2,050 and the simple moving average of 100 hours.
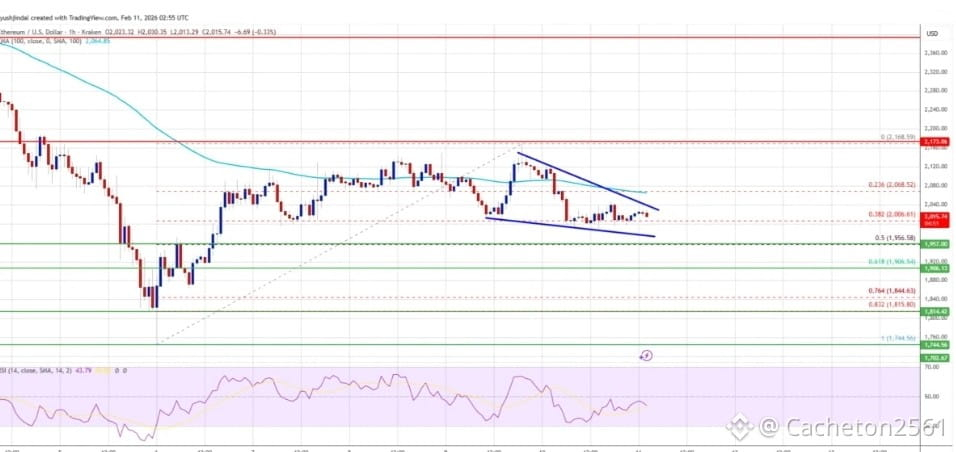
•There is a contracting triangle forming with resistance at $2,040 on the hourly chart of $ETH /USD (data source via Kraken).
•The pair could initiate a new decline if it stays below the $2,120 zone.
The price of Ethereum drops again.
The price of Ethereum managed to form a base above $1,950 and began a recovery wave, similar to Bitcoin. The price of ETH traded above the resistance levels of $1,980 and $2,020.
The pair even surged above $2,140. A high was formed at $2,168, and the price is now moving downward. There was a drop below $2,050. The price tested the 38.2% retracement level of the upward move from the low of $1,745 to the high of $2,168.
The price of $ETH is now operating below $2,050 and the simple moving average of 100 hours. If the bulls remain active above $2,000, the price could attempt another increase. Immediate resistance is near the $2,050 level. There is also a contracting triangle forming with resistance at $2,040 on the hourly chart of ETH/USD.
The first key resistance is near the $2,065 level. The next significant resistance is near the $2,120 level. A clear move above the $2,120 resistance could send the price toward the $2,165 resistance. A rise above the $2,165 region could generate more gains in the coming days. In the mentioned case, Ether could increase towards the resistance zone of $2,250 or even $2,280 in the short term.
Ethereum On The Decline: Will It Recover Or Fall Below $1,980?
The price of $ETH began a recovery wave above $2,000. ETH is now consolidating and remains at risk of another decline below $1,980.
•Ethereum struggled to extend gains above $2,120 and corrected downward.
•The price is operating below $2,050 and the simple moving average of 100 hours.
•There is a contracting triangle forming with resistance at $2,040 on the hourly chart of $ETH /USD (data source via Kraken).
•The pair could initiate a new decline if it stays below the $2,120 zone.
The price of Ethereum drops again.
The price of Ethereum managed to form a base above $1,950 and began a recovery wave, similar to Bitcoin. The price of ETH traded above the resistance levels of $1,980 and $2,020.
The pair even surged above $2,140. A high was formed at $2,168, and the price is now moving downward. There was a drop below $2,050. The price tested the 38.2% retracement level of the upward move from the low of $1,745 to the high of $2,168.
The price of $ETH is now operating below $2,050 and the simple moving average of 100 hours. If the bulls remain active above $2,000, the price could attempt another increase. Immediate resistance is near the $2,050 level. There is also a contracting triangle forming with resistance at $2,040 on the hourly chart of ETH/USD.
The first key resistance is near the $2,065 level. The next significant resistance is near the $2,120 level. A clear move above the $2,120 resistance could send the price toward the $2,165 resistance. A rise above the $2,165 region could generate more gains in the coming days. In the mentioned case, Ether could increase towards the resistance zone of $2,250 or even $2,280 in the short term.
The price of $ETH began a recovery wave above $2,000. ETH is now consolidating and remains at risk of another decline below $1,980.
•Ethereum struggled to extend gains above $2,120 and corrected downward.
•The price is operating below $2,050 and the simple moving average of 100 hours.
•There is a contracting triangle forming with resistance at $2,040 on the hourly chart of $ETH /USD (data source via Kraken).
•The pair could initiate a new decline if it stays below the $2,120 zone.
The price of Ethereum drops again.
The price of Ethereum managed to form a base above $1,950 and began a recovery wave, similar to Bitcoin. The price of ETH traded above the resistance levels of $1,980 and $2,020.
The pair even surged above $2,140. A high was formed at $2,168, and the price is now moving downward. There was a drop below $2,050. The price tested the 38.2% retracement level of the upward move from the low of $1,745 to the high of $2,168.
The price of $ETH is now operating below $2,050 and the simple moving average of 100 hours. If the bulls remain active above $2,000, the price could attempt another increase. Immediate resistance is near the $2,050 level. There is also a contracting triangle forming with resistance at $2,040 on the hourly chart of ETH/USD.
The first key resistance is near the $2,065 level. The next significant resistance is near the $2,120 level. A clear move above the $2,120 resistance could send the price toward the $2,165 resistance. A rise above the $2,165 region could generate more gains in the coming days. In the mentioned case, Ether could increase towards the resistance zone of $2,250 or even $2,280 in the short term.
94
·
--
The bearish trend is confirmed, $SOL the momentum remains negative and there are no supports
The technical outlook continues to be decidedly bearish, as SOL trades well below the MA-20, the MA-50, and the MA-200, with the nearest dynamic resistance at the Ichimoku Kijun level of $106.53 and no immediate dynamic support below current prices. Daily momentum indicators confirm the negative trend: the MACD continues to give sell signals, the ADX remains strong at 40.81 on D1 but is neutral on W1, and oscillators like the RSI (D1: 27.38, W1: 29.17), Stochastic RSI, and the CCI record oversold conditions, while the Bull/Bear Power is deeply negative at -8.16. The Awesome Oscillator is neutral, but overall, the bearish momentum and dominance of sellers persist, with high volatility and limited intraday bounce attempts.
Limited bounce possibilities, as volatility bands indicate probable lateral action
Over the next five days, it is likely that $SOL will fluctuate between $78.00 and $85.00, reflecting a volatility band relative to current levels. A breakout above $85.00-$86.00 would be necessary to signal a bullish reversal, although the persistent bearish signals in daily and weekly technical indicators make a sustained recovery unlikely. If $SOL breaks below $78.00, it is likely to continue falling, as there is no significant technical support based on current indicators. The base scenario anticipates lateral consolidation, with the oversold outlook potentially driving stabilization instead of an immediate bounce.
The bearish trend is confirmed, $SOL the momentum remains negative and there are no supports
The technical outlook continues to be decidedly bearish, as SOL trades well below the MA-20, the MA-50, and the MA-200, with the nearest dynamic resistance at the Ichimoku Kijun level of $106.53 and no immediate dynamic support below current prices. Daily momentum indicators confirm the negative trend: the MACD continues to give sell signals, the ADX remains strong at 40.81 on D1 but is neutral on W1, and oscillators like the RSI (D1: 27.38, W1: 29.17), Stochastic RSI, and the CCI record oversold conditions, while the Bull/Bear Power is deeply negative at -8.16. The Awesome Oscillator is neutral, but overall, the bearish momentum and dominance of sellers persist, with high volatility and limited intraday bounce attempts.
Limited bounce possibilities, as volatility bands indicate probable lateral action
Over the next five days, it is likely that $SOL will fluctuate between $78.00 and $85.00, reflecting a volatility band relative to current levels. A breakout above $85.00-$86.00 would be necessary to signal a bullish reversal, although the persistent bearish signals in daily and weekly technical indicators make a sustained recovery unlikely. If $SOL breaks below $78.00, it is likely to continue falling, as there is no significant technical support based on current indicators. The base scenario anticipates lateral consolidation, with the oversold outlook potentially driving stabilization instead of an immediate bounce.
The technical outlook continues to be decidedly bearish, as SOL trades well below the MA-20, the MA-50, and the MA-200, with the nearest dynamic resistance at the Ichimoku Kijun level of $106.53 and no immediate dynamic support below current prices. Daily momentum indicators confirm the negative trend: the MACD continues to give sell signals, the ADX remains strong at 40.81 on D1 but is neutral on W1, and oscillators like the RSI (D1: 27.38, W1: 29.17), Stochastic RSI, and the CCI record oversold conditions, while the Bull/Bear Power is deeply negative at -8.16. The Awesome Oscillator is neutral, but overall, the bearish momentum and dominance of sellers persist, with high volatility and limited intraday bounce attempts.
Limited bounce possibilities, as volatility bands indicate probable lateral action
Over the next five days, it is likely that $SOL will fluctuate between $78.00 and $85.00, reflecting a volatility band relative to current levels. A breakout above $85.00-$86.00 would be necessary to signal a bullish reversal, although the persistent bearish signals in daily and weekly technical indicators make a sustained recovery unlikely. If $SOL breaks below $78.00, it is likely to continue falling, as there is no significant technical support based on current indicators. The base scenario anticipates lateral consolidation, with the oversold outlook potentially driving stabilization instead of an immediate bounce.
2
1
1.2k
·
--
Bitcoin Price Prediction: BTC multiplied by 6 the last time this happened
$BTC has lost nearly a quarter of its value in the last 30 days as the market did not react well to Kevin Warsh's nomination as the future president of the Federal Reserve.
Long position liquidations soared above 8 billion dollars in a single day, triggering a cascade of sales that plunged market sentiment to historic lows.
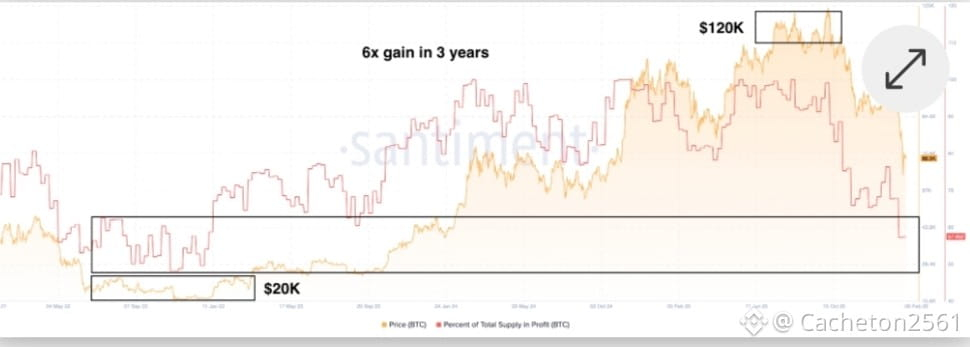
As a result, 43% of holders of $BTC are currently at unrealized losses — the lowest level seen in the last three years.
Bitcoin rose from 15,000 to 120,000 dollars after the end of the last bear cycle
Santiment data shows that the last time investors were doing this poorly, BTC was trading at 20,000 dollars. This was approximately 5,000 dollars above the bottom of the 2022 bear market.
Guess what happened next? The leading cryptocurrency rose to 120,000 dollars in 36 months, delivering a 6x gain to those who bought at that time.
Now, $BTC could still fall another 25% if historical patterns repeat. This would mean we could see it trading close to 50,000 dollars in the coming weeks.
So, how to benefit from this early signal? The simplest way would be to adopt dollar-cost averaging (DCA) and buy on the dip until BTC stops falling.
This on-chain metric shows that the bottom may not be far off. At that time, the lowest this metric reached was 48%.
Bitcoin Price Prediction: BTC multiplied by 6 the last time this happened
$BTC has lost nearly a quarter of its value in the last 30 days as the market did not react well to Kevin Warsh's nomination as the future president of the Federal Reserve.
Long position liquidations soared above 8 billion dollars in a single day, triggering a cascade of sales that plunged market sentiment to historic lows.
As a result, 43% of holders of $BTC are currently at unrealized losses — the lowest level seen in the last three years.
Bitcoin rose from 15,000 to 120,000 dollars after the end of the last bear cycle
Santiment data shows that the last time investors were doing this poorly, BTC was trading at 20,000 dollars. This was approximately 5,000 dollars above the bottom of the 2022 bear market.
Guess what happened next? The leading cryptocurrency rose to 120,000 dollars in 36 months, delivering a 6x gain to those who bought at that time.
Now, $BTC could still fall another 25% if historical patterns repeat. This would mean we could see it trading close to 50,000 dollars in the coming weeks.
So, how to benefit from this early signal? The simplest way would be to adopt dollar-cost averaging (DCA) and buy on the dip until BTC stops falling.
This on-chain metric shows that the bottom may not be far off. At that time, the lowest this metric reached was 48%.
$BTC has lost nearly a quarter of its value in the last 30 days as the market did not react well to Kevin Warsh's nomination as the future president of the Federal Reserve.
Long position liquidations soared above 8 billion dollars in a single day, triggering a cascade of sales that plunged market sentiment to historic lows.
As a result, 43% of holders of $BTC are currently at unrealized losses — the lowest level seen in the last three years.
Bitcoin rose from 15,000 to 120,000 dollars after the end of the last bear cycle
Santiment data shows that the last time investors were doing this poorly, BTC was trading at 20,000 dollars. This was approximately 5,000 dollars above the bottom of the 2022 bear market.
Guess what happened next? The leading cryptocurrency rose to 120,000 dollars in 36 months, delivering a 6x gain to those who bought at that time.
Now, $BTC could still fall another 25% if historical patterns repeat. This would mean we could see it trading close to 50,000 dollars in the coming weeks.
So, how to benefit from this early signal? The simplest way would be to adopt dollar-cost averaging (DCA) and buy on the dip until BTC stops falling.
This on-chain metric shows that the bottom may not be far off. At that time, the lowest this metric reached was 48%.
1
2
3k
·
--
Could XRP Surpass Bitcoin? The Forgotten Vision of Ripple from 2013The question of whether XRP could surpass Bitcoin returned to the forefront after legal analyst Bill Morgan mentioned a 2013 text by journalist Felix Salmon describing Ripple as a solid alternative to early models of digital money. Morgan stated that the article became hard to find on the internet and that this situation raised doubts about how the history of the sector was preserved. XRP advocates argue that the text reflected a period when many experts believed that Ripple's technology was better suited for real economic use than Bitcoin.
Could XRP Surpass Bitcoin? The Forgotten Vision of Ripple from 2013
The question of whether XRP could surpass Bitcoin returned to the forefront after legal analyst Bill Morgan mentioned a 2013 text by journalist Felix Salmon describing Ripple as a solid alternative to early models of digital money. Morgan stated that the article became hard to find on the internet and that this situation raised doubts about how the history of the sector was preserved. XRP advocates argue that the text reflected a period when many experts believed that Ripple's technology was better suited for real economic use than Bitcoin.
3
2
1.2k
·
--
Despite having hit rock bottom, an analyst stated that the price of $XRP will rebound and reach this incredible figure
The statement comes at a time of marked weakness for the asset
Analyst Crypto Patel, known for predicting the more than 600% rally of XRP in the previous cycle, stated that the cryptocurrency is close to a floor and maintained his long-term projection around 10 dollars.
The statement comes at a time of marked weakness for the asset. Since the peak reached in July, $XRP has registered a correction of over 60% and has been showing a sequence of support breaks that have reconfigured its short-term technical structure.
According to the analysis shared by Patel, the current movement should be interpreted within a logic of accumulation and not as an invalidation of the underlying trend. In the two-week candlestick chart, the analyst identifies that the correction is around 58% from the last peak, a level that places the price within a first key zone between 1.50 and 1.30 dollars.
In that range, the proposed strategy does not aim to capture an exact minimum, but to gradually build a position as the price finds stability. For Patel, this is a transition stage in which the market begins to absorb the accumulated selling pressure during the corrective phase.
The contemplated scenario includes a deeper alternative. If $XRP loses the 1.30 dollar zone, the analyst points out a second accumulation area situated between 0.90 and 0.70 dollars. That movement, far from nullifying the bullish projection, would reinforce the long-term positioning opportunity under his technical approach.
Despite the bearish context, Patel kept his final target unchanged around 10 dollars. In that sense, he clarified that purchases at levels of 3 or 2 dollars are not attractive in the face of potential sharper declines, where the return potential would be greater.
Despite having hit rock bottom, an analyst stated that the price of $XRP will rebound and reach this incredible figure
The statement comes at a time of marked weakness for the asset
Analyst Crypto Patel, known for predicting the more than 600% rally of XRP in the previous cycle, stated that the cryptocurrency is close to a floor and maintained his long-term projection around 10 dollars.
The statement comes at a time of marked weakness for the asset. Since the peak reached in July, $XRP has registered a correction of over 60% and has been showing a sequence of support breaks that have reconfigured its short-term technical structure.
According to the analysis shared by Patel, the current movement should be interpreted within a logic of accumulation and not as an invalidation of the underlying trend. In the two-week candlestick chart, the analyst identifies that the correction is around 58% from the last peak, a level that places the price within a first key zone between 1.50 and 1.30 dollars.
In that range, the proposed strategy does not aim to capture an exact minimum, but to gradually build a position as the price finds stability. For Patel, this is a transition stage in which the market begins to absorb the accumulated selling pressure during the corrective phase.
The contemplated scenario includes a deeper alternative. If $XRP loses the 1.30 dollar zone, the analyst points out a second accumulation area situated between 0.90 and 0.70 dollars. That movement, far from nullifying the bullish projection, would reinforce the long-term positioning opportunity under his technical approach.
Despite the bearish context, Patel kept his final target unchanged around 10 dollars. In that sense, he clarified that purchases at levels of 3 or 2 dollars are not attractive in the face of potential sharper declines, where the return potential would be greater.
The statement comes at a time of marked weakness for the asset
Analyst Crypto Patel, known for predicting the more than 600% rally of XRP in the previous cycle, stated that the cryptocurrency is close to a floor and maintained his long-term projection around 10 dollars.
The statement comes at a time of marked weakness for the asset. Since the peak reached in July, $XRP has registered a correction of over 60% and has been showing a sequence of support breaks that have reconfigured its short-term technical structure.
According to the analysis shared by Patel, the current movement should be interpreted within a logic of accumulation and not as an invalidation of the underlying trend. In the two-week candlestick chart, the analyst identifies that the correction is around 58% from the last peak, a level that places the price within a first key zone between 1.50 and 1.30 dollars.
In that range, the proposed strategy does not aim to capture an exact minimum, but to gradually build a position as the price finds stability. For Patel, this is a transition stage in which the market begins to absorb the accumulated selling pressure during the corrective phase.
The contemplated scenario includes a deeper alternative. If $XRP loses the 1.30 dollar zone, the analyst points out a second accumulation area situated between 0.90 and 0.70 dollars. That movement, far from nullifying the bullish projection, would reinforce the long-term positioning opportunity under his technical approach.
Despite the bearish context, Patel kept his final target unchanged around 10 dollars. In that sense, he clarified that purchases at levels of 3 or 2 dollars are not attractive in the face of potential sharper declines, where the return potential would be greater.

8
4
14
12k
·
--
The price of $BTC holds above USD 70,000: is it the end of the correction or calm before the storm?
$BTC is trading this Monday around USD 70,436, a level that brings some relief to investors after the strong corrections of last week. Despite the recent recovery, the debate about the real valuation of the asset remains alive in the main financial circles.
Analysts highlighted the impact of the recent volatility in the crypto ecosystem. The digital currency lost nearly 15% of its value in the last seven days, a movement that experts link to a lower risk tolerance in global markets. It is worth remembering that, since its all-time high last October, the asset experienced in certain phases a decline of over 50%.
The importance of objectivity in investing
For Banorte's experts, the current corrections serve as a fundamental reminder for the investor. They stressed that it is vital to conduct an objective analysis of any financial instrument before committing capital. The current debate centers on whether the previous rises were supported by solid fundamentals or if they responded to an exaggerated market euphoria.
Although the price holds above the psychological barrier of USD 70,000, the future scenario remains uncertain. Key levels to monitor include:
•Technical support: the zone of USD 70,000 is the floor that defines short-term stability.
•Immediate resistance: the level of USD 70,700 marks the limit to confirm a trend change.
$BTC
The price of $BTC holds above USD 70,000: is it the end of the correction or calm before the storm?
$BTC is trading this Monday around USD 70,436, a level that brings some relief to investors after the strong corrections of last week. Despite the recent recovery, the debate about the real valuation of the asset remains alive in the main financial circles.
Analysts highlighted the impact of the recent volatility in the crypto ecosystem. The digital currency lost nearly 15% of its value in the last seven days, a movement that experts link to a lower risk tolerance in global markets. It is worth remembering that, since its all-time high last October, the asset experienced in certain phases a decline of over 50%.
The importance of objectivity in investing
For Banorte's experts, the current corrections serve as a fundamental reminder for the investor. They stressed that it is vital to conduct an objective analysis of any financial instrument before committing capital. The current debate centers on whether the previous rises were supported by solid fundamentals or if they responded to an exaggerated market euphoria.
Although the price holds above the psychological barrier of USD 70,000, the future scenario remains uncertain. Key levels to monitor include:
•Technical support: the zone of USD 70,000 is the floor that defines short-term stability.
•Immediate resistance: the level of USD 70,700 marks the limit to confirm a trend change.
$BTC
$BTC is trading this Monday around USD 70,436, a level that brings some relief to investors after the strong corrections of last week. Despite the recent recovery, the debate about the real valuation of the asset remains alive in the main financial circles.
Analysts highlighted the impact of the recent volatility in the crypto ecosystem. The digital currency lost nearly 15% of its value in the last seven days, a movement that experts link to a lower risk tolerance in global markets. It is worth remembering that, since its all-time high last October, the asset experienced in certain phases a decline of over 50%.
The importance of objectivity in investing
For Banorte's experts, the current corrections serve as a fundamental reminder for the investor. They stressed that it is vital to conduct an objective analysis of any financial instrument before committing capital. The current debate centers on whether the previous rises were supported by solid fundamentals or if they responded to an exaggerated market euphoria.
Although the price holds above the psychological barrier of USD 70,000, the future scenario remains uncertain. Key levels to monitor include:
•Technical support: the zone of USD 70,000 is the floor that defines short-term stability.
•Immediate resistance: the level of USD 70,700 marks the limit to confirm a trend change.
$BTC

83
·
--
Trump Media company announces plans to grant digital tokens to its shareholders
The Trump Media and Technology Group in the United States has announced a partnership with a cryptocurrency exchange to grant digital tokens to its shareholders.
The announcement coincided with a small jump on Wednesday in the company’s stock, which rose by 5 percent at 11 a.m. Eastern Time (16:00 GMT).
Most of Trump Media's shares are owned by its namesake, the President of the United States, Donald Trump, who has been a strong advocate for cryptocurrencies, particularly during his second term.
In a press release, the company explained that it would work with the Singapore-based firm Crypto.com to provide shareholders with one digital token for each full share they own.
There was no timeline for the plan, but Trump Media said that the tokens would be available "in the near future".
It added that "various rewards" would be made "available to token holders periodically throughout the year," including "benefits and discounts" related to Trump’s social media platform, Truth Social, and its affiliated streaming platform, Truth+.
"We look forward to utilizing Crypto.com’s blockchain technology and enhancing regulatory clarity to implement this token distribution, the first of its kind," said Trump Media CEO Devin Nunes in the press release.
Trump Media company announces plans to grant digital tokens to its shareholders
The Trump Media and Technology Group in the United States has announced a partnership with a cryptocurrency exchange to grant digital tokens to its shareholders.
The announcement coincided with a small jump on Wednesday in the company’s stock, which rose by 5 percent at 11 a.m. Eastern Time (16:00 GMT).
Most of Trump Media's shares are owned by its namesake, the President of the United States, Donald Trump, who has been a strong advocate for cryptocurrencies, particularly during his second term.
In a press release, the company explained that it would work with the Singapore-based firm Crypto.com to provide shareholders with one digital token for each full share they own.
There was no timeline for the plan, but Trump Media said that the tokens would be available "in the near future".
It added that "various rewards" would be made "available to token holders periodically throughout the year," including "benefits and discounts" related to Trump’s social media platform, Truth Social, and its affiliated streaming platform, Truth+.
"We look forward to utilizing Crypto.com’s blockchain technology and enhancing regulatory clarity to implement this token distribution, the first of its kind," said Trump Media CEO Devin Nunes in the press release.
The Trump Media and Technology Group in the United States has announced a partnership with a cryptocurrency exchange to grant digital tokens to its shareholders.
The announcement coincided with a small jump on Wednesday in the company’s stock, which rose by 5 percent at 11 a.m. Eastern Time (16:00 GMT).
Most of Trump Media's shares are owned by its namesake, the President of the United States, Donald Trump, who has been a strong advocate for cryptocurrencies, particularly during his second term.
In a press release, the company explained that it would work with the Singapore-based firm Crypto.com to provide shareholders with one digital token for each full share they own.
There was no timeline for the plan, but Trump Media said that the tokens would be available "in the near future".
It added that "various rewards" would be made "available to token holders periodically throughout the year," including "benefits and discounts" related to Trump’s social media platform, Truth Social, and its affiliated streaming platform, Truth+.
"We look forward to utilizing Crypto.com’s blockchain technology and enhancing regulatory clarity to implement this token distribution, the first of its kind," said Trump Media CEO Devin Nunes in the press release.
11
·
--
$BTC ERROR MULTIMILLONARIO | Bithumb was involved in one of the most unusual errors in the crypto world: the South Korean platform accidentally transferred 620,000 $BTC to 249 users during a promotion, froze operations, and is struggling to recover the funds while $BTC is experiencing its lowest level in months.
$BTC ERROR MULTIMILLONARIO | Bithumb was involved in one of the most unusual errors in the crypto world: the South Korean platform accidentally transferred 620,000 $BTC to 249 users during a promotion, froze operations, and is struggling to recover the funds while $BTC is experiencing its lowest level in months.
334
·
--
AI will abandon Earth: Elon Musk plans to take data centers into space
Elon Musk has set a new challenge for artificial intelligence (AI): to take it into space. To achieve this, the world's richest entrepreneur aims to move data centers out of Earth's orbit.
This was expressed by the tycoon on the podcast Cheeky Pint, hosted by Dwarkesh Patel, where he stated that he aims to send at least one terawatt of GPU (Graphics Processing Unit) into space within a period of less than three years.
The reason behind this, the tycoon claimed, lies in energy availability, as the conditions of space create a perfect environment for uninterrupted solar energy due to the absence of the day-night cycle and other earthly limitations like the atmosphere.
"The atmosphere alone produces an energy loss of approximately 30%,"
commented Musk on the podcast.
These advantages, combined with the fact that batteries would not be necessary, could make data centers more profitable and efficient than any existing on the planet. Additionally, according to the owner of xAI, it would also be an alternative to meet the growing demand for processing power in the sector.
The attractive solution has already begun to face some challenges and questions, such as the difficulty of maintaining data centers in case of a failure, although the entrepreneur has assured that this would not represent a real problem if next-generation chips are installed.
Under this science fiction scenario, he has already begun the procedures to materialize his idea by requesting permission from the Federal Communications Commission (FCC) and consolidating the acquisition of xAI by SpaceX, merging two of the tycoon's most ambitious projects.
$XRP
$DOGE
$SOL
AI will abandon Earth: Elon Musk plans to take data centers into space
Elon Musk has set a new challenge for artificial intelligence (AI): to take it into space. To achieve this, the world's richest entrepreneur aims to move data centers out of Earth's orbit.
This was expressed by the tycoon on the podcast Cheeky Pint, hosted by Dwarkesh Patel, where he stated that he aims to send at least one terawatt of GPU (Graphics Processing Unit) into space within a period of less than three years.
The reason behind this, the tycoon claimed, lies in energy availability, as the conditions of space create a perfect environment for uninterrupted solar energy due to the absence of the day-night cycle and other earthly limitations like the atmosphere.
"The atmosphere alone produces an energy loss of approximately 30%,"
commented Musk on the podcast.
These advantages, combined with the fact that batteries would not be necessary, could make data centers more profitable and efficient than any existing on the planet. Additionally, according to the owner of xAI, it would also be an alternative to meet the growing demand for processing power in the sector.
The attractive solution has already begun to face some challenges and questions, such as the difficulty of maintaining data centers in case of a failure, although the entrepreneur has assured that this would not represent a real problem if next-generation chips are installed.
Under this science fiction scenario, he has already begun the procedures to materialize his idea by requesting permission from the Federal Communications Commission (FCC) and consolidating the acquisition of xAI by SpaceX, merging two of the tycoon's most ambitious projects.
$XRP
$DOGE
$SOL
Elon Musk has set a new challenge for artificial intelligence (AI): to take it into space. To achieve this, the world's richest entrepreneur aims to move data centers out of Earth's orbit.
This was expressed by the tycoon on the podcast Cheeky Pint, hosted by Dwarkesh Patel, where he stated that he aims to send at least one terawatt of GPU (Graphics Processing Unit) into space within a period of less than three years.
The reason behind this, the tycoon claimed, lies in energy availability, as the conditions of space create a perfect environment for uninterrupted solar energy due to the absence of the day-night cycle and other earthly limitations like the atmosphere.
"The atmosphere alone produces an energy loss of approximately 30%,"
commented Musk on the podcast.
These advantages, combined with the fact that batteries would not be necessary, could make data centers more profitable and efficient than any existing on the planet. Additionally, according to the owner of xAI, it would also be an alternative to meet the growing demand for processing power in the sector.
The attractive solution has already begun to face some challenges and questions, such as the difficulty of maintaining data centers in case of a failure, although the entrepreneur has assured that this would not represent a real problem if next-generation chips are installed.
Under this science fiction scenario, he has already begun the procedures to materialize his idea by requesting permission from the Federal Communications Commission (FCC) and consolidating the acquisition of xAI by SpaceX, merging two of the tycoon's most ambitious projects.
$XRP
$DOGE
$SOL

1
1k
·
--
Who is Kevin Warsh, nominated by Trump to lead the Federal Reserve?
President Donald Trump announced that former Federal Reserve governor Kevin Warsh is his candidate to lead the institution, one of the most influential positions in the global economy. Warsh must be confirmed by the U.S. Senate and, if so, will succeed Jerome Powell when his term ends in May.
This nomination comes after a selection process lasting several months led by Treasury Secretary Scott Bessent, who narrowed an initial list of a dozen candidates down to just four.
Trump has repeatedly stated that he expects whoever he appoints to the position of Federal Reserve chair to push for interest rate cuts. However, due to the structure of the central bank, the chair of the Federal Reserve is only one of the voting members on the interest rate decision committee and cannot veto the decisions of the majority of the 12 committee members.
$BTC
$BNB
$XRP
Who is Kevin Warsh, nominated by Trump to lead the Federal Reserve?
President Donald Trump announced that former Federal Reserve governor Kevin Warsh is his candidate to lead the institution, one of the most influential positions in the global economy. Warsh must be confirmed by the U.S. Senate and, if so, will succeed Jerome Powell when his term ends in May.
This nomination comes after a selection process lasting several months led by Treasury Secretary Scott Bessent, who narrowed an initial list of a dozen candidates down to just four.
Trump has repeatedly stated that he expects whoever he appoints to the position of Federal Reserve chair to push for interest rate cuts. However, due to the structure of the central bank, the chair of the Federal Reserve is only one of the voting members on the interest rate decision committee and cannot veto the decisions of the majority of the 12 committee members.
$BTC
$BNB
$XRP
President Donald Trump announced that former Federal Reserve governor Kevin Warsh is his candidate to lead the institution, one of the most influential positions in the global economy. Warsh must be confirmed by the U.S. Senate and, if so, will succeed Jerome Powell when his term ends in May.
This nomination comes after a selection process lasting several months led by Treasury Secretary Scott Bessent, who narrowed an initial list of a dozen candidates down to just four.
Trump has repeatedly stated that he expects whoever he appoints to the position of Federal Reserve chair to push for interest rate cuts. However, due to the structure of the central bank, the chair of the Federal Reserve is only one of the voting members on the interest rate decision committee and cannot veto the decisions of the majority of the 12 committee members.
$BTC
$BNB
$XRP

291
·
--
Ripple: what is the price this Sunday, February 8.
This Sunday, February 8, 2026, $XRP starts the day in Spain with a quotation of 1.69 euros. The opening value reflects a variation of 2,101.78% compared to the previous close, in a new demonstration of the volatility that characterizes digital assets.
The price of $XRP has shown a positive trend in recent days, with a data point of -1 positive. This indicates that the interest and demand for Ripple are increasing, which could reflect a favorable change in the market.
The cryptocurrency $XRP has experienced a notable evolution in its quotation, reflecting a downward trend both in the short and long term. In the last week, its value has decreased by -9.07%, indicating recent volatility that could concern investors. Over the past year, the situation is even more worrying, with a variation of -31.74% in its quotation, suggesting that Ripple has faced significant challenges in the market, affecting its profitability and the confidence of users.
Ripple: what is the price this Sunday, February 8.
This Sunday, February 8, 2026, $XRP starts the day in Spain with a quotation of 1.69 euros. The opening value reflects a variation of 2,101.78% compared to the previous close, in a new demonstration of the volatility that characterizes digital assets.
The price of $XRP has shown a positive trend in recent days, with a data point of -1 positive. This indicates that the interest and demand for Ripple are increasing, which could reflect a favorable change in the market.
The cryptocurrency $XRP has experienced a notable evolution in its quotation, reflecting a downward trend both in the short and long term. In the last week, its value has decreased by -9.07%, indicating recent volatility that could concern investors. Over the past year, the situation is even more worrying, with a variation of -31.74% in its quotation, suggesting that Ripple has faced significant challenges in the market, affecting its profitability and the confidence of users.
This Sunday, February 8, 2026, $XRP starts the day in Spain with a quotation of 1.69 euros. The opening value reflects a variation of 2,101.78% compared to the previous close, in a new demonstration of the volatility that characterizes digital assets.
The price of $XRP has shown a positive trend in recent days, with a data point of -1 positive. This indicates that the interest and demand for Ripple are increasing, which could reflect a favorable change in the market.
The cryptocurrency $XRP has experienced a notable evolution in its quotation, reflecting a downward trend both in the short and long term. In the last week, its value has decreased by -9.07%, indicating recent volatility that could concern investors. Over the past year, the situation is even more worrying, with a variation of -31.74% in its quotation, suggesting that Ripple has faced significant challenges in the market, affecting its profitability and the confidence of users.
327
·
--
Ethereum: how much is it trading this Sunday, February 8.
The price of $ETH this Sunday, February 8, 2026, at 12 o'clock in Spain is 2,470.64 euros. This figure reflects a variation of 1.66% compared to the previous day.
The price of $ETH and the euro has shown a positive trend in recent days. This indicates that both assets are in a process of sustained growth.
The cryptocurrency $ETH has experienced notable evolution in its price, although in the last week it has recorded a decrease of -6%. This setback adds to a broader trend, as in the last year its variation has been -14.21%. Despite these recent challenges, Ethereum remains one of the most relevant cryptocurrencies in the market, driven by its smart contract technology and its adoption in various decentralized applications.
Ethereum: how much is it trading this Sunday, February 8.
The price of $ETH this Sunday, February 8, 2026, at 12 o'clock in Spain is 2,470.64 euros. This figure reflects a variation of 1.66% compared to the previous day.
The price of $ETH and the euro has shown a positive trend in recent days. This indicates that both assets are in a process of sustained growth.
The cryptocurrency $ETH has experienced notable evolution in its price, although in the last week it has recorded a decrease of -6%. This setback adds to a broader trend, as in the last year its variation has been -14.21%. Despite these recent challenges, Ethereum remains one of the most relevant cryptocurrencies in the market, driven by its smart contract technology and its adoption in various decentralized applications.
The price of $ETH this Sunday, February 8, 2026, at 12 o'clock in Spain is 2,470.64 euros. This figure reflects a variation of 1.66% compared to the previous day.
The price of $ETH and the euro has shown a positive trend in recent days. This indicates that both assets are in a process of sustained growth.
The cryptocurrency $ETH has experienced notable evolution in its price, although in the last week it has recorded a decrease of -6%. This setback adds to a broader trend, as in the last year its variation has been -14.21%. Despite these recent challenges, Ethereum remains one of the most relevant cryptocurrencies in the market, driven by its smart contract technology and its adoption in various decentralized applications.
196
·
--
Is Bitcoin cheap? Experts believe that the price of $BTC entered a zone of accumulation: is it time to buy?
The recent pullback in the price of $BTC began to catch the attention of institutional investors. From Fidelity Investments, one of the largest asset managers in the world, they point out that the area of USD 65,000-70,000 constitutes an attractive entry point within the current market cycle, marked by macroeconomic tensions, changes in U.S. monetary policy, and a partial rotation of flows toward assets considered defensive, like gold.
The assessment was shared by Jurrien Timmer, global macro director at Fidelity, who linked the behavior of $BTC with the volatility generated by the U.S. political and monetary scenario. In that context, he explained that, despite the sharp movements of the past few weeks, the asset maintains a technical structure consistent with a phase of adjustment and not with a long-term trend break.
Is Bitcoin cheap? Experts believe that the price of $BTC entered a zone of accumulation: is it time to buy?
The recent pullback in the price of $BTC began to catch the attention of institutional investors. From Fidelity Investments, one of the largest asset managers in the world, they point out that the area of USD 65,000-70,000 constitutes an attractive entry point within the current market cycle, marked by macroeconomic tensions, changes in U.S. monetary policy, and a partial rotation of flows toward assets considered defensive, like gold.
The assessment was shared by Jurrien Timmer, global macro director at Fidelity, who linked the behavior of $BTC with the volatility generated by the U.S. political and monetary scenario. In that context, he explained that, despite the sharp movements of the past few weeks, the asset maintains a technical structure consistent with a phase of adjustment and not with a long-term trend break.
The recent pullback in the price of $BTC began to catch the attention of institutional investors. From Fidelity Investments, one of the largest asset managers in the world, they point out that the area of USD 65,000-70,000 constitutes an attractive entry point within the current market cycle, marked by macroeconomic tensions, changes in U.S. monetary policy, and a partial rotation of flows toward assets considered defensive, like gold.
The assessment was shared by Jurrien Timmer, global macro director at Fidelity, who linked the behavior of $BTC with the volatility generated by the U.S. political and monetary scenario. In that context, he explained that, despite the sharp movements of the past few weeks, the asset maintains a technical structure consistent with a phase of adjustment and not with a long-term trend break.
93
·
--
XRP ETFs remain stable as XRP price rises
Unlike investors using Bitcoin and Ethereum spot ETFs to gain exposure to the two market leaders, those opting for XRP funds seemed unfazed by the recent crypto crash.
Data from SoSoValue shows that last week ended clearly in the green for Ripple ETFs, despite the underlying asset's price going through some of its darkest moments.
The ETFs of $XRP continue to see inflows.
It is worth noting that the previous work week closed in red for XRP funds for just one trading day. On January 29, when investors withdrew nearly $93 million, it was the worst result in net flows since the launch of these products. On Monday, data showed a slight outflow of just over $400,000, a practically marginal figure considering the market collapsed again that weekend.
Afterward, investors resumed inflows with $19.46 million on Tuesday, $4.83 million on Wednesday, and $15.16 million on Friday, according to SoSoValue. For some reason, the portal has not yet updated Thursday's data, but other sites and reports do reflect a small positive net flow.
Additionally, the accumulated net inflows of XRP spot ETFs rose from $1.18 trillion at the close of the previous work week to $1.22 trillion on February 6, implying a net increase of around $40 million.
During the same period, the spot ETFs of $ETH recorded outflows of about $170 million, while those of $BTC decreased by $358 million.
XRP ETFs remain stable as XRP price rises
Unlike investors using Bitcoin and Ethereum spot ETFs to gain exposure to the two market leaders, those opting for XRP funds seemed unfazed by the recent crypto crash.
Data from SoSoValue shows that last week ended clearly in the green for Ripple ETFs, despite the underlying asset's price going through some of its darkest moments.
The ETFs of $XRP continue to see inflows.
It is worth noting that the previous work week closed in red for XRP funds for just one trading day. On January 29, when investors withdrew nearly $93 million, it was the worst result in net flows since the launch of these products. On Monday, data showed a slight outflow of just over $400,000, a practically marginal figure considering the market collapsed again that weekend.
Afterward, investors resumed inflows with $19.46 million on Tuesday, $4.83 million on Wednesday, and $15.16 million on Friday, according to SoSoValue. For some reason, the portal has not yet updated Thursday's data, but other sites and reports do reflect a small positive net flow.
Additionally, the accumulated net inflows of XRP spot ETFs rose from $1.18 trillion at the close of the previous work week to $1.22 trillion on February 6, implying a net increase of around $40 million.
During the same period, the spot ETFs of $ETH recorded outflows of about $170 million, while those of $BTC decreased by $358 million.
Unlike investors using Bitcoin and Ethereum spot ETFs to gain exposure to the two market leaders, those opting for XRP funds seemed unfazed by the recent crypto crash.
Data from SoSoValue shows that last week ended clearly in the green for Ripple ETFs, despite the underlying asset's price going through some of its darkest moments.
The ETFs of $XRP continue to see inflows.
It is worth noting that the previous work week closed in red for XRP funds for just one trading day. On January 29, when investors withdrew nearly $93 million, it was the worst result in net flows since the launch of these products. On Monday, data showed a slight outflow of just over $400,000, a practically marginal figure considering the market collapsed again that weekend.
Afterward, investors resumed inflows with $19.46 million on Tuesday, $4.83 million on Wednesday, and $15.16 million on Friday, according to SoSoValue. For some reason, the portal has not yet updated Thursday's data, but other sites and reports do reflect a small positive net flow.
Additionally, the accumulated net inflows of XRP spot ETFs rose from $1.18 trillion at the close of the previous work week to $1.22 trillion on February 6, implying a net increase of around $40 million.
During the same period, the spot ETFs of $ETH recorded outflows of about $170 million, while those of $BTC decreased by $358 million.

84
·
--
$XRP is heading towards a new accumulation phase: what does it mean for investors?
The current withdrawal of $XRP has shifted attention away from short-term volatility and towards the bigger picture on the chart. The cryptocurrency is now below its all-time high from July by more than 60%, and the decline shows signs of further descent.
As the price continues to break support levels, an analyst whose previous outlook preceded a major XRP rally suggests that the cryptocurrency may be approaching a bottom for another accumulation phase.
Analyst points to a new accumulation phase
The price action of $XRP has seen many analysts projecting a bottom where the decline could end. However, a technical analysis of XRP's price action on the 2-week candlestick chart, posted on the social media platform X, frames the current price action of XRP as an entry into an accumulation zone.
According to the analysis, XRP has corrected approximately 58% from its recent peak, placing it directly within what he calls the first accumulation zone between $1.50 and $1.30. Crypto Patel's perspective is that this area is not about catching an exact bottom, but about gradually building exposure as the price stabilizes. Based on this, the analyst predicted that XRP's decline will bottom out at some point between $1.5 and $1.3, and that this is a good time to start buying slowly at these levels.
However, Patel's outlook also considers a deeper pullback scenario. If XRP loses the $1.30 region, then the focus shifts to a secondary accumulation band between $0.90 and $0.70. Nevertheless, a move towards that lower range would not invalidate the bullish thesis. Instead, it would represent what he describes as the best long-term accumulation opportunity for maximum profits.
$XRP is heading towards a new accumulation phase: what does it mean for investors?
The current withdrawal of $XRP has shifted attention away from short-term volatility and towards the bigger picture on the chart. The cryptocurrency is now below its all-time high from July by more than 60%, and the decline shows signs of further descent.
As the price continues to break support levels, an analyst whose previous outlook preceded a major XRP rally suggests that the cryptocurrency may be approaching a bottom for another accumulation phase.
Analyst points to a new accumulation phase
The price action of $XRP has seen many analysts projecting a bottom where the decline could end. However, a technical analysis of XRP's price action on the 2-week candlestick chart, posted on the social media platform X, frames the current price action of XRP as an entry into an accumulation zone.
According to the analysis, XRP has corrected approximately 58% from its recent peak, placing it directly within what he calls the first accumulation zone between $1.50 and $1.30. Crypto Patel's perspective is that this area is not about catching an exact bottom, but about gradually building exposure as the price stabilizes. Based on this, the analyst predicted that XRP's decline will bottom out at some point between $1.5 and $1.3, and that this is a good time to start buying slowly at these levels.
However, Patel's outlook also considers a deeper pullback scenario. If XRP loses the $1.30 region, then the focus shifts to a secondary accumulation band between $0.90 and $0.70. Nevertheless, a move towards that lower range would not invalidate the bullish thesis. Instead, it would represent what he describes as the best long-term accumulation opportunity for maximum profits.
The current withdrawal of $XRP has shifted attention away from short-term volatility and towards the bigger picture on the chart. The cryptocurrency is now below its all-time high from July by more than 60%, and the decline shows signs of further descent.
As the price continues to break support levels, an analyst whose previous outlook preceded a major XRP rally suggests that the cryptocurrency may be approaching a bottom for another accumulation phase.
Analyst points to a new accumulation phase
The price action of $XRP has seen many analysts projecting a bottom where the decline could end. However, a technical analysis of XRP's price action on the 2-week candlestick chart, posted on the social media platform X, frames the current price action of XRP as an entry into an accumulation zone.
According to the analysis, XRP has corrected approximately 58% from its recent peak, placing it directly within what he calls the first accumulation zone between $1.50 and $1.30. Crypto Patel's perspective is that this area is not about catching an exact bottom, but about gradually building exposure as the price stabilizes. Based on this, the analyst predicted that XRP's decline will bottom out at some point between $1.5 and $1.3, and that this is a good time to start buying slowly at these levels.
However, Patel's outlook also considers a deeper pullback scenario. If XRP loses the $1.30 region, then the focus shifts to a secondary accumulation band between $0.90 and $0.70. Nevertheless, a move towards that lower range would not invalidate the bullish thesis. Instead, it would represent what he describes as the best long-term accumulation opportunity for maximum profits.

1
567
·
--
The SHIB burn rate plummets: will we see more drops before the end of the year?
The sharp decline in the SHIB burn coincides with a shift in price and reopens doubts about the token's behavior before the end of the year.
The $SHIB Inu network is once again under the market spotlight after registering a sharp drop in one of its most observed indicators.
In recent hours, the burn rate of $SHIB has significantly collapsed, breaking a dynamic that until recently fueled expectations of deflationary pressure on the token.
The adjustment coincided with a shift in price, which gave back some of the recent gains and reopened the debate about the asset's behavior before the end of the year.
The burn mechanism has historically been one of the narrative pillars of the $SHIB Shiba Inu ecosystem. By reducing the circulating supply, it aims to offset the high initial supply of the token and reinforce its long-term appeal.
However, the latest data suggest that this effect has lost strength, introducing new doubts about its real impact in the short term.
The SHIB burn rate plummets: will we see more drops before the end of the year?
The sharp decline in the SHIB burn coincides with a shift in price and reopens doubts about the token's behavior before the end of the year.
The $SHIB Inu network is once again under the market spotlight after registering a sharp drop in one of its most observed indicators.
In recent hours, the burn rate of $SHIB has significantly collapsed, breaking a dynamic that until recently fueled expectations of deflationary pressure on the token.
The adjustment coincided with a shift in price, which gave back some of the recent gains and reopened the debate about the asset's behavior before the end of the year.
The burn mechanism has historically been one of the narrative pillars of the $SHIB Shiba Inu ecosystem. By reducing the circulating supply, it aims to offset the high initial supply of the token and reinforce its long-term appeal.
However, the latest data suggest that this effect has lost strength, introducing new doubts about its real impact in the short term.
The sharp decline in the SHIB burn coincides with a shift in price and reopens doubts about the token's behavior before the end of the year.
The $SHIB Inu network is once again under the market spotlight after registering a sharp drop in one of its most observed indicators.
In recent hours, the burn rate of $SHIB has significantly collapsed, breaking a dynamic that until recently fueled expectations of deflationary pressure on the token.
The adjustment coincided with a shift in price, which gave back some of the recent gains and reopened the debate about the asset's behavior before the end of the year.
The burn mechanism has historically been one of the narrative pillars of the $SHIB Shiba Inu ecosystem. By reducing the circulating supply, it aims to offset the high initial supply of the token and reinforce its long-term appeal.
However, the latest data suggest that this effect has lost strength, introducing new doubts about its real impact in the short term.

2
1.2k
·
--
$BTC BITCOIN IS NOT FALLING.
IT'S DOING EXACTLY WHAT WE SAID IT WOULD DO.
In 2025 we said it in advance:
📉 strong corrections
📉 emotional sweeps
📉 exit of those who entered without structure
And here it is.
Bitcoin does not break supports due to weakness.
It breaks them because the market always cleans before continuing.
How much lower can it go?
🔹 Probable zone: 63,000 – 61,500 USD
Pause zone, technical bounces, and false hopes.
This is the one I would recommend that seems to be
where it will reach, in case you want to buy when it grazes 61k
🔹 Real cleaning zone: 58,000 – 53,000 USD
Only if global fear intensifies.
It's not a collapse. It's purging.
🔹 Extreme zone (only with global fear): 52,000 – 49,000 USD
It's not the base scenario, but the market always cleans before moving forward.
Why now?
Because liquidity is adjusting, smart money is getting ahead, and the market needs to shake out the emotional traders before the next leg.
Bitcoin does not move on news.
It moves on collective psychology.
Those who do not understand sell out of fear.
Those who think they know enter late.
Those who do know… were already expecting it.
🧠 My personal position (and I am clear here)
I do not like Bitcoin as an asset to invest in.
It is not part of my wealth strategy.
But that does not mean I do not understand it or that I do not read it.
Bitcoin$BTC is one of the best laboratories of structural psychology in the market:
– Fear
– Greed
– Identity
– Reaction
– Mass vs. criteria
That's why I analyze it. Not out of belief, but out of understanding human behavior.
📌 The real difference
Those who do not understand react.
Those who idolize become blind.
Those who observe with criteria learn from the movement.
This was already on the map this year.
The drop is not surprising. It is surprising that there are still those who do not understand the cycle.
$BTC
$BTC BITCOIN IS NOT FALLING.
IT'S DOING EXACTLY WHAT WE SAID IT WOULD DO.
In 2025 we said it in advance:
📉 strong corrections
📉 emotional sweeps
📉 exit of those who entered without structure
And here it is.
Bitcoin does not break supports due to weakness.
It breaks them because the market always cleans before continuing.
How much lower can it go?
🔹 Probable zone: 63,000 – 61,500 USD
Pause zone, technical bounces, and false hopes.
This is the one I would recommend that seems to be
where it will reach, in case you want to buy when it grazes 61k
🔹 Real cleaning zone: 58,000 – 53,000 USD
Only if global fear intensifies.
It's not a collapse. It's purging.
🔹 Extreme zone (only with global fear): 52,000 – 49,000 USD
It's not the base scenario, but the market always cleans before moving forward.
Why now?
Because liquidity is adjusting, smart money is getting ahead, and the market needs to shake out the emotional traders before the next leg.
Bitcoin does not move on news.
It moves on collective psychology.
Those who do not understand sell out of fear.
Those who think they know enter late.
Those who do know… were already expecting it.
🧠 My personal position (and I am clear here)
I do not like Bitcoin as an asset to invest in.
It is not part of my wealth strategy.
But that does not mean I do not understand it or that I do not read it.
Bitcoin$BTC is one of the best laboratories of structural psychology in the market:
– Fear
– Greed
– Identity
– Reaction
– Mass vs. criteria
That's why I analyze it. Not out of belief, but out of understanding human behavior.
📌 The real difference
Those who do not understand react.
Those who idolize become blind.
Those who observe with criteria learn from the movement.
This was already on the map this year.
The drop is not surprising. It is surprising that there are still those who do not understand the cycle.
$BTC
IT'S DOING EXACTLY WHAT WE SAID IT WOULD DO.
In 2025 we said it in advance:
📉 strong corrections
📉 emotional sweeps
📉 exit of those who entered without structure
And here it is.
Bitcoin does not break supports due to weakness.
It breaks them because the market always cleans before continuing.
How much lower can it go?
🔹 Probable zone: 63,000 – 61,500 USD
Pause zone, technical bounces, and false hopes.
This is the one I would recommend that seems to be
where it will reach, in case you want to buy when it grazes 61k
🔹 Real cleaning zone: 58,000 – 53,000 USD
Only if global fear intensifies.
It's not a collapse. It's purging.
🔹 Extreme zone (only with global fear): 52,000 – 49,000 USD
It's not the base scenario, but the market always cleans before moving forward.
Why now?
Because liquidity is adjusting, smart money is getting ahead, and the market needs to shake out the emotional traders before the next leg.
Bitcoin does not move on news.
It moves on collective psychology.
Those who do not understand sell out of fear.
Those who think they know enter late.
Those who do know… were already expecting it.
🧠 My personal position (and I am clear here)
I do not like Bitcoin as an asset to invest in.
It is not part of my wealth strategy.
But that does not mean I do not understand it or that I do not read it.
Bitcoin$BTC is one of the best laboratories of structural psychology in the market:
– Fear
– Greed
– Identity
– Reaction
– Mass vs. criteria
That's why I analyze it. Not out of belief, but out of understanding human behavior.
📌 The real difference
Those who do not understand react.
Those who idolize become blind.
Those who observe with criteria learn from the movement.
This was already on the map this year.
The drop is not surprising. It is surprising that there are still those who do not understand the cycle.
$BTC
5
1
5
3.8k
Log in to explore more content
Join global crypto users on Binance Square
⚡️ Get latest and useful information about crypto.
💬 Trusted by the world’s largest crypto exchange.
👍 Discover real insights from verified creators.
Email / Phone number