

不爱练腹的小宇
115 Posts

不爱练腹的小宇
Report
Block User
2026对我好点
Open Trade
High-Frequency Trader
11.1 Months
19 Following
106 Followers
83 Liked
Posts
Portfolio
All
Quotes
·
--
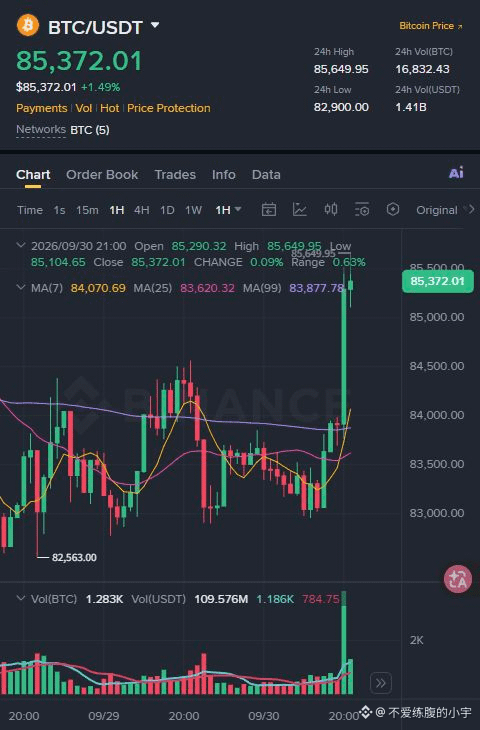
$BTC At 8:00 PM, that hourly K-line surged from about 83,900 to 85,300, up roughly 1.6%, and the trading volume also clearly expanded.
Right now, around 85,400, the market is turning stronger in the short term, but this move has been too straight. Whether 85,100—85,300 can form follow-through still depends on how the pullback holds. First look above at 85,650, which has just been tested. If the hourly close falls back below 84,000, this breakout will need to be reassessed.
$BTC At 8:00 PM, that hourly K-line surged from about 83,900 to 85,300, up roughly 1.6%, and the trading volume also clearly expanded.
Right now, around 85,400, the market is turning stronger in the short term, but this move has been too straight. Whether 85,100—85,300 can form follow-through still depends on how the pullback holds. First look above at 85,650, which has just been tested. If the hourly close falls back below 84,000, this breakout will need to be reassessed.
Right now, around 85,400, the market is turning stronger in the short term, but this move has been too straight. Whether 85,100—85,300 can form follow-through still depends on how the pullback holds. First look above at 85,650, which has just been tested. If the hourly close falls back below 84,000, this breakout will need to be reassessed.
184
·
--
Verified
$LINK This is worth watching this time—whether banks can truly plug in.
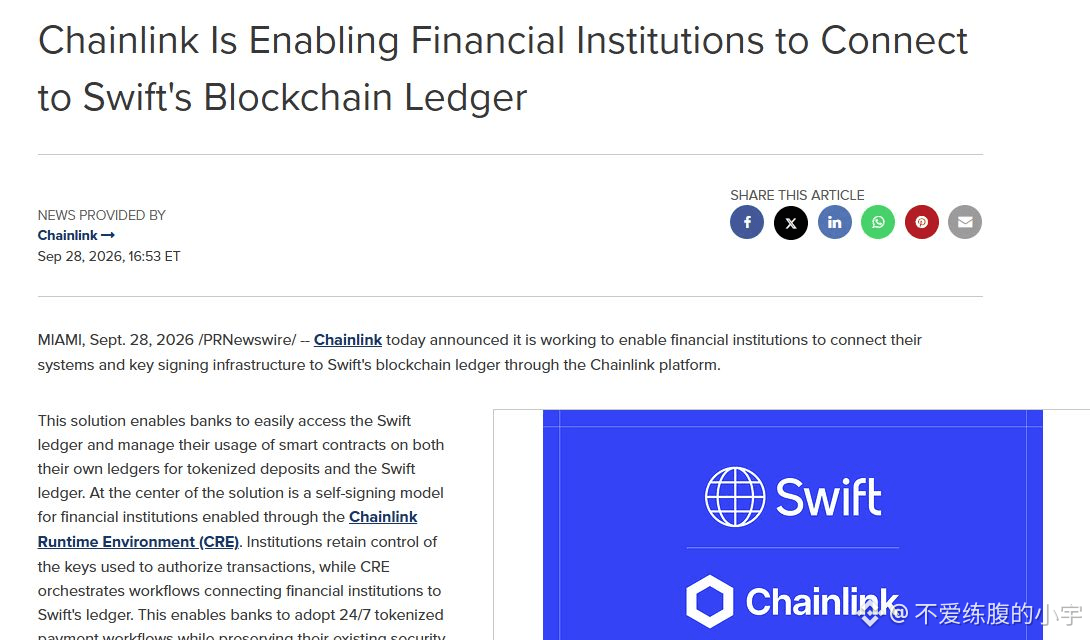
Chainlink’s latest announcement says it is helping financial institutions connect to the Swift ledger through CRE. Banks still control the transaction signing keys themselves, and tokenized deposits also remain on the banks’ ledgers. The goal is to keep cross-border payments running on weekends and at night.
Next, what I care about more is which banks actually end up using it and how much business volume it can generate. The technical integration has moved one step forward, but how reflected it becomes in token demand still depends on real usage.
$LINK This is worth watching this time—whether banks can truly plug in.
Chainlink’s latest announcement says it is helping financial institutions connect to the Swift ledger through CRE. Banks still control the transaction signing keys themselves, and tokenized deposits also remain on the banks’ ledgers. The goal is to keep cross-border payments running on weekends and at night.
Next, what I care about more is which banks actually end up using it and how much business volume it can generate. The technical integration has moved one step forward, but how reflected it becomes in token demand still depends on real usage.
Chainlink’s latest announcement says it is helping financial institutions connect to the Swift ledger through CRE. Banks still control the transaction signing keys themselves, and tokenized deposits also remain on the banks’ ledgers. The goal is to keep cross-border payments running on weekends and at night.
Next, what I care about more is which banks actually end up using it and how much business volume it can generate. The technical integration has moved one step forward, but how reflected it becomes in token demand still depends on real usage.
249
·
--
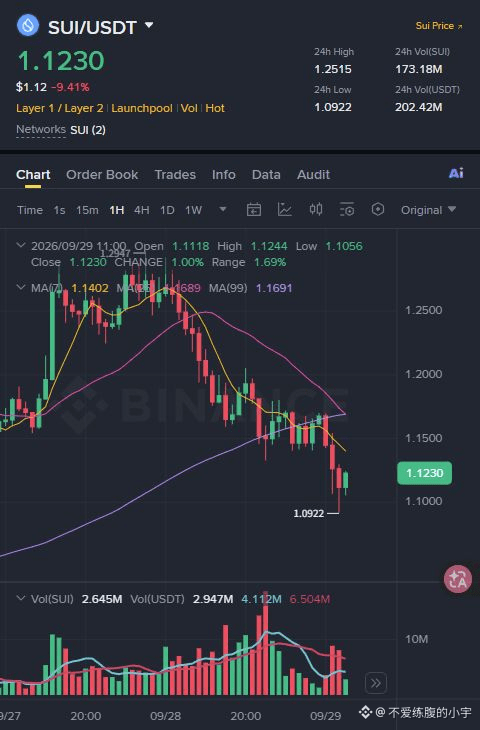
$SUI From the 24-hour high of 1.2515, it retreated to 1.123, giving back about 10%. A small bounce has occurred at the lower level, but the hourly chart has not yet reclaimed the prior consolidation range. In the short term, conditions remain relatively weak, and the rebound volume/strength has not caught up to the earlier sell-off.
Support to watch: 1.09—1.11, the newly formed low-area, with confirmation that buy support/holding is in place
Rebound resistance: 1.15—1.17
If the hourly close regains and holds above 1.17, the bearish view can be withdrawn. If it falls again below 1.09, this time the minor rebound will not have held.
$SUI From the 24-hour high of 1.2515, it retreated to 1.123, giving back about 10%. A small bounce has occurred at the lower level, but the hourly chart has not yet reclaimed the prior consolidation range. In the short term, conditions remain relatively weak, and the rebound volume/strength has not caught up to the earlier sell-off.
Support to watch: 1.09—1.11, the newly formed low-area, with confirmation that buy support/holding is in place
Rebound resistance: 1.15—1.17
If the hourly close regains and holds above 1.17, the bearish view can be withdrawn. If it falls again below 1.09, this time the minor rebound will not have held.
Support to watch: 1.09—1.11, the newly formed low-area, with confirmation that buy support/holding is in place
Rebound resistance: 1.15—1.17
If the hourly close regains and holds above 1.17, the bearish view can be withdrawn. If it falls again below 1.09, this time the minor rebound will not have held.
495
·
--
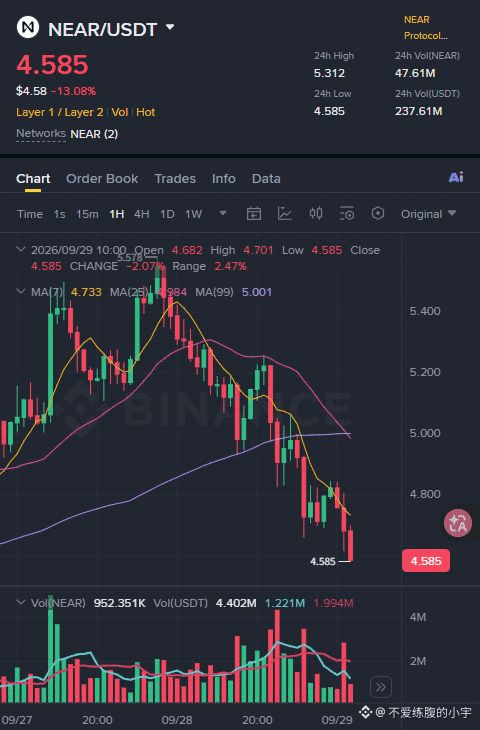
$NEAR Yesterday around 5.28, now around 4.59—down about 13% in a day. On the hourly chart, the rebounds keep coming lower and lower; the morning rebound also didn’t hold. Near-term outlook is slightly bearish.
Support to watch below: 4.40—4.50, the prior consolidation area; it hasn’t been retested yet.
Resistance on rebounds: 4.75—4.85, the rebound zone that was just broken.
Around 4.58 it’s still testing new lows; the follow-through/market backing hasn’t been confirmed. If the hourly close regains and holds above 4.85, then the slightly bearish view is withdrawn.
$NEAR Yesterday around 5.28, now around 4.59—down about 13% in a day. On the hourly chart, the rebounds keep coming lower and lower; the morning rebound also didn’t hold. Near-term outlook is slightly bearish.
Support to watch below: 4.40—4.50, the prior consolidation area; it hasn’t been retested yet.
Resistance on rebounds: 4.75—4.85, the rebound zone that was just broken.
Around 4.58 it’s still testing new lows; the follow-through/market backing hasn’t been confirmed. If the hourly close regains and holds above 4.85, then the slightly bearish view is withdrawn.
Support to watch below: 4.40—4.50, the prior consolidation area; it hasn’t been retested yet.
Resistance on rebounds: 4.75—4.85, the rebound zone that was just broken.
Around 4.58 it’s still testing new lows; the follow-through/market backing hasn’t been confirmed. If the hourly close regains and holds above 4.85, then the slightly bearish view is withdrawn.
393
·
--
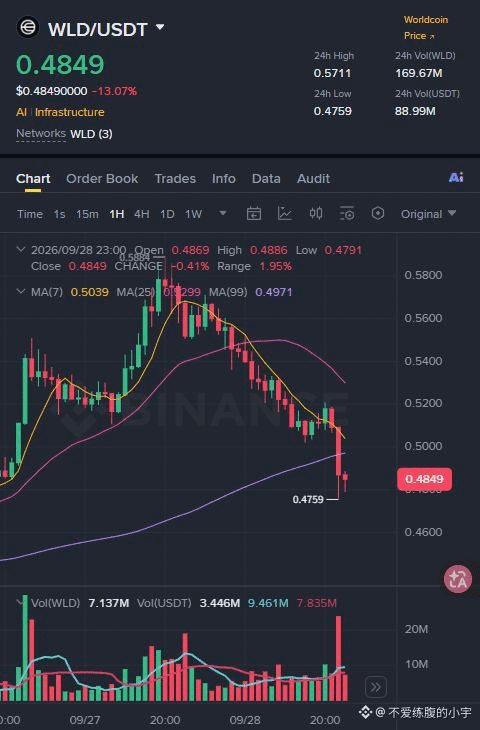
$WLD Yesterday, at this time, it was about 0.558; now it's around 0.485, down about 13% in a day. The hourly chart shows heavy volume and broke below 0.50; the rebound hasn’t yet regained the lost ground, so the short-term bias remains bearish.
Support to watch: 0.476—0.480; buyers have just started to show up, but confirmation is still needed.
Rebound resistance: 0.505—0.515; the prior consolidation zone.
A few small K-lines have been holding sideways at the low level, but it doesn’t yet indicate a reversal. If the hourly close regains and holds above 0.515, the bearish view would be withdrawn; if it breaks below 0.476 again, continue monitoring for further downside.
$WLD Yesterday, at this time, it was about 0.558; now it's around 0.485, down about 13% in a day. The hourly chart shows heavy volume and broke below 0.50; the rebound hasn’t yet regained the lost ground, so the short-term bias remains bearish.
Support to watch: 0.476—0.480; buyers have just started to show up, but confirmation is still needed.
Rebound resistance: 0.505—0.515; the prior consolidation zone.
A few small K-lines have been holding sideways at the low level, but it doesn’t yet indicate a reversal. If the hourly close regains and holds above 0.515, the bearish view would be withdrawn; if it breaks below 0.476 again, continue monitoring for further downside.
Support to watch: 0.476—0.480; buyers have just started to show up, but confirmation is still needed.
Rebound resistance: 0.505—0.515; the prior consolidation zone.
A few small K-lines have been holding sideways at the low level, but it doesn’t yet indicate a reversal. If the hourly close regains and holds above 0.515, the bearish view would be withdrawn; if it breaks below 0.476 again, continue monitoring for further downside.
342
·
--
Bearish
Daily Trading Recap
Today's floating loss is 700u
Reasons:
First: The leveraged position was opened too high—starting from 2x, I went all the way up to around 3x, and even between 3x and 4x.
Second: At the time, the established rule was to close the position when BTC breaks below 83500 or 83800. But I was too impulsive—I didn’t really follow the indicators, and I didn’t set a stop loss. I even kept hoping that while BTC was ranging or pulled back downward, the WLD and ONDO I held would continue to rise. The “missed the sell” feeling was too strong. Instead of reducing the position, I actually added to it. This led to a reversal of profits over two days.
Third: BTC ranging caused my panic to keep rising. Also, the coin price had already surged by about 40% in the short term, so at this time I shouldn’t keep adding—holding still would have been stronger than continuing to trade.
Fourth: Because of the range-induced panic, if the price dropped a few points, I would want to close. Then when it dropped a bit and I sold, the next second it would rise again and I’d feel like I sold at the bottom, so I bought back. The repeated spread fluctuations and the fee losses add up each time.
Points worth reflecting on: I only did asset allocation and a general directional strategy. But when I had floating profit and BTC was ranging in the macro sense, I didn’t choose to reduce the position or go to cash. My FOMO got pushed too high.
Optimized trading strategy: Check trading volume every day, so I can use moving stop-loss and moving take-profit for the coins I hold. When it’s time to reduce the position, I can’t let the FOMO of “missing out on profits” drive my trading.
Making less profit is always better than letting it turn into a loss.
$WLD $ONDO $BTC
Daily Trading Recap
Today's floating loss is 700u
Reasons:
First: The leveraged position was opened too high—starting from 2x, I went all the way up to around 3x, and even between 3x and 4x.
Second: At the time, the established rule was to close the position when BTC breaks below 83500 or 83800. But I was too impulsive—I didn’t really follow the indicators, and I didn’t set a stop loss. I even kept hoping that while BTC was ranging or pulled back downward, the WLD and ONDO I held would continue to rise. The “missed the sell” feeling was too strong. Instead of reducing the position, I actually added to it. This led to a reversal of profits over two days.
Third: BTC ranging caused my panic to keep rising. Also, the coin price had already surged by about 40% in the short term, so at this time I shouldn’t keep adding—holding still would have been stronger than continuing to trade.
Fourth: Because of the range-induced panic, if the price dropped a few points, I would want to close. Then when it dropped a bit and I sold, the next second it would rise again and I’d feel like I sold at the bottom, so I bought back. The repeated spread fluctuations and the fee losses add up each time.
Points worth reflecting on: I only did asset allocation and a general directional strategy. But when I had floating profit and BTC was ranging in the macro sense, I didn’t choose to reduce the position or go to cash. My FOMO got pushed too high.
Optimized trading strategy: Check trading volume every day, so I can use moving stop-loss and moving take-profit for the coins I hold. When it’s time to reduce the position, I can’t let the FOMO of “missing out on profits” drive my trading.
Making less profit is always better than letting it turn into a loss.
$WLD $ONDO $BTC
Today's floating loss is 700u
Reasons:
First: The leveraged position was opened too high—starting from 2x, I went all the way up to around 3x, and even between 3x and 4x.
Second: At the time, the established rule was to close the position when BTC breaks below 83500 or 83800. But I was too impulsive—I didn’t really follow the indicators, and I didn’t set a stop loss. I even kept hoping that while BTC was ranging or pulled back downward, the WLD and ONDO I held would continue to rise. The “missed the sell” feeling was too strong. Instead of reducing the position, I actually added to it. This led to a reversal of profits over two days.
Third: BTC ranging caused my panic to keep rising. Also, the coin price had already surged by about 40% in the short term, so at this time I shouldn’t keep adding—holding still would have been stronger than continuing to trade.
Fourth: Because of the range-induced panic, if the price dropped a few points, I would want to close. Then when it dropped a bit and I sold, the next second it would rise again and I’d feel like I sold at the bottom, so I bought back. The repeated spread fluctuations and the fee losses add up each time.
Points worth reflecting on: I only did asset allocation and a general directional strategy. But when I had floating profit and BTC was ranging in the macro sense, I didn’t choose to reduce the position or go to cash. My FOMO got pushed too high.
Optimized trading strategy: Check trading volume every day, so I can use moving stop-loss and moving take-profit for the coins I hold. When it’s time to reduce the position, I can’t let the FOMO of “missing out on profits” drive my trading.
Making less profit is always better than letting it turn into a loss.
$WLD $ONDO $BTC
471
·
--
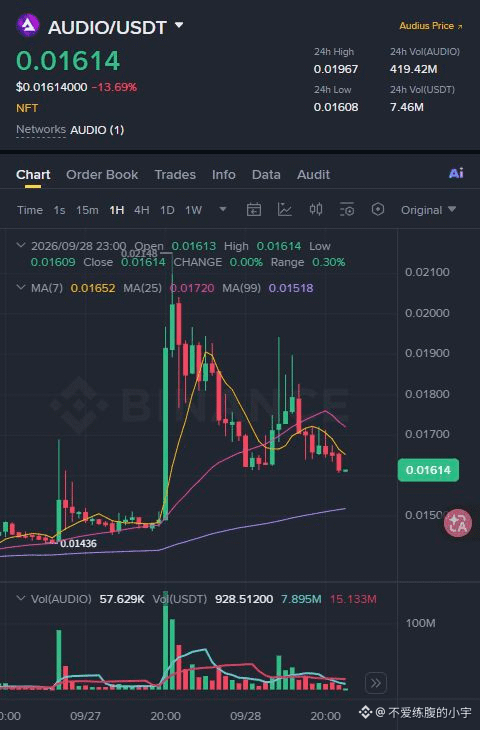
$AUDIO This afternoon it was still around 0.0184; now it’s down to 0.0161, giving back about 12%. The hourly close has fallen below the then 0.0170 invalidation line, so the earlier bullish bias has been withdrawn and the short-term outlook has turned weaker.
Support to watch below: 0.0145—0.0150, the prior consolidation range, farther away
Resistance on rebound: 0.0167—0.0173
Near 0.0161, there hasn’t formed reliable support yet. Don’t assume it’s a bottom just because it has fallen a lot. If the hourly close can stand back above 0.0173, then revoke the bearish assessment.
$AUDIO This afternoon it was still around 0.0184; now it’s down to 0.0161, giving back about 12%. The hourly close has fallen below the then 0.0170 invalidation line, so the earlier bullish bias has been withdrawn and the short-term outlook has turned weaker.
Support to watch below: 0.0145—0.0150, the prior consolidation range, farther away
Resistance on rebound: 0.0167—0.0173
Near 0.0161, there hasn’t formed reliable support yet. Don’t assume it’s a bottom just because it has fallen a lot. If the hourly close can stand back above 0.0173, then revoke the bearish assessment.
Support to watch below: 0.0145—0.0150, the prior consolidation range, farther away
Resistance on rebound: 0.0167—0.0173
Near 0.0161, there hasn’t formed reliable support yet. Don’t assume it’s a bottom just because it has fallen a lot. If the hourly close can stand back above 0.0173, then revoke the bearish assessment.
88
·
--
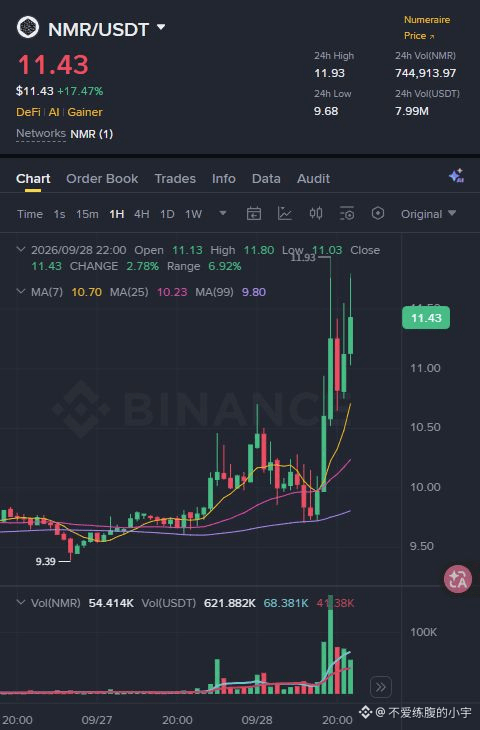
$NMR Yesterday, it was still around 9.7 at this time. Now it’s at 11.43, up about 17% in a day. After the hourly chart saw a surge on increased volume and pushed to a high, it pulled back to around 10.7 and bounced again. The short-term bias is still bullish, but it hasn’t yet broken above the previous high.
Key support to watch: 10.65—10.85
Resistance overhead: 11.80—11.93
This upswing came quickly—first, see whether the pullback can hold. If the hourly close breaks below 10.65, the bullish view would need to be adjusted; if it holds above 11.93, then look for continuation.
$NMR Yesterday, it was still around 9.7 at this time. Now it’s at 11.43, up about 17% in a day. After the hourly chart saw a surge on increased volume and pushed to a high, it pulled back to around 10.7 and bounced again. The short-term bias is still bullish, but it hasn’t yet broken above the previous high.
Key support to watch: 10.65—10.85
Resistance overhead: 11.80—11.93
This upswing came quickly—first, see whether the pullback can hold. If the hourly close breaks below 10.65, the bullish view would need to be adjusted; if it holds above 11.93, then look for continuation.
Key support to watch: 10.65—10.85
Resistance overhead: 11.80—11.93
This upswing came quickly—first, see whether the pullback can hold. If the hourly close breaks below 10.65, the bullish view would need to be adjusted; if it holds above 11.93, then look for continuation.
123
·
--
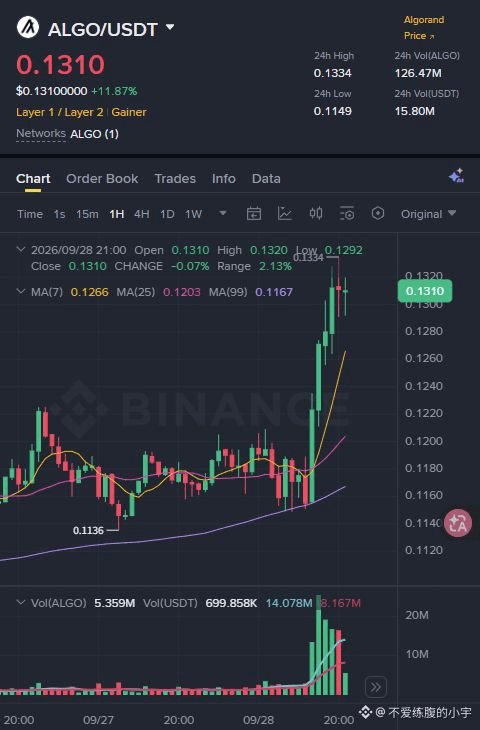
$ALGO Yesterday, at this moment, it was about 0.117; now it’s near 0.131, up roughly 12% for the day. After the hourly chart saw a volume surge and a push up, the pullback has not yet lost 0.129, so in the short term it still leans bullish.
Support to watch: 0.129—0.130
Resistance overhead: 0.132—0.1334
This is a newly formed high-level consolidation zone, and we’ll still look for continued follow-through in terms of support. If the hourly close falls below 0.129, the bullish call will be invalidated and it’s considered more bullish only if it can reclaim; once it holds above 0.1334, then reassess whether the move can continue.
$ALGO Yesterday, at this moment, it was about 0.117; now it’s near 0.131, up roughly 12% for the day. After the hourly chart saw a volume surge and a push up, the pullback has not yet lost 0.129, so in the short term it still leans bullish.
Support to watch: 0.129—0.130
Resistance overhead: 0.132—0.1334
This is a newly formed high-level consolidation zone, and we’ll still look for continued follow-through in terms of support. If the hourly close falls below 0.129, the bullish call will be invalidated and it’s considered more bullish only if it can reclaim; once it holds above 0.1334, then reassess whether the move can continue.
Support to watch: 0.129—0.130
Resistance overhead: 0.132—0.1334
This is a newly formed high-level consolidation zone, and we’ll still look for continued follow-through in terms of support. If the hourly close falls below 0.129, the bullish call will be invalidated and it’s considered more bullish only if it can reclaim; once it holds above 0.1334, then reassess whether the move can continue.
146
·
--
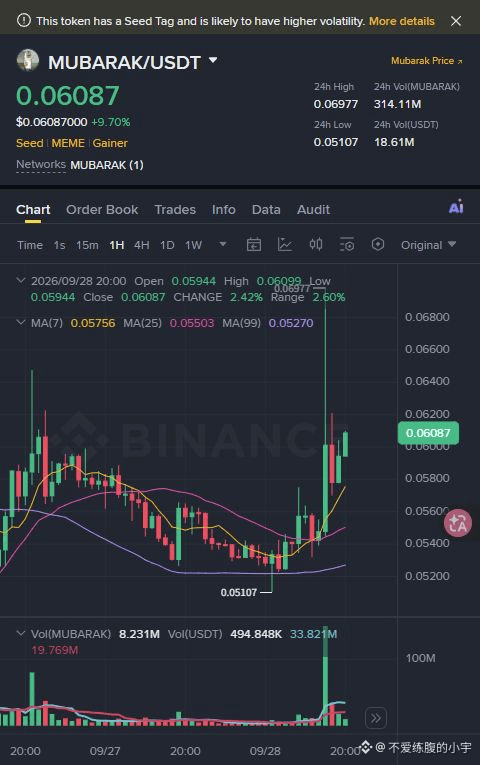
$MUBARAK surged to 0.06977 and then retreated back near 0.0609; it still rose by nearly 10% in a single day. After breaking out with increased volume on the hourly chart, it left a long upper shadow. In the short term, look for consolidation first—don't treat this upper shadow as already holding steady.
Support to watch: 0.0575—0.0590
Resistance above: 0.0610—0.0620
If the hourly close breaks below 0.0575, the rebound will weaken; only after it holds above 0.0620 should you reassess whether the move can continue. Binance still labels it as Seed—given the high volatility, don't ignore that.
$MUBARAK surged to 0.06977 and then retreated back near 0.0609; it still rose by nearly 10% in a single day. After breaking out with increased volume on the hourly chart, it left a long upper shadow. In the short term, look for consolidation first—don't treat this upper shadow as already holding steady.
Support to watch: 0.0575—0.0590
Resistance above: 0.0610—0.0620
If the hourly close breaks below 0.0575, the rebound will weaken; only after it holds above 0.0620 should you reassess whether the move can continue. Binance still labels it as Seed—given the high volatility, don't ignore that.
Support to watch: 0.0575—0.0590
Resistance above: 0.0610—0.0620
If the hourly close breaks below 0.0575, the rebound will weaken; only after it holds above 0.0620 should you reassess whether the move can continue. Binance still labels it as Seed—given the high volatility, don't ignore that.
204
·
--
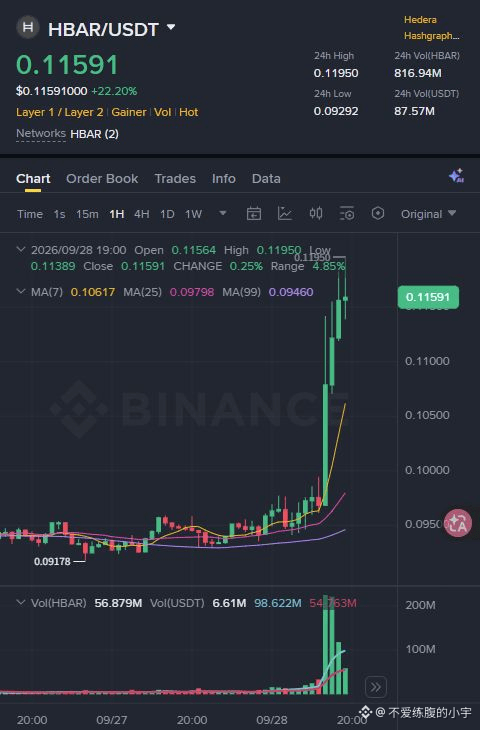
$HBAR Yesterday around this time it was about 0.095; now it's near 0.116, up about 22% in a day. The hourly chart shows volume expanding and breaking out of the consolidation range. In the short term it's still leaning bullish, but after the move up to 0.1195 it's still digesting.
Key support to watch: 0.111—0.114
Resistance above: 0.118—0.1195
Below is only the new support zone formed after the breakout. If the hourly close falls below 0.111, the bullish view weakens and we may look for it to recover; if it holds above 0.1195, then reassess whether the move can continue.
$HBAR Yesterday around this time it was about 0.095; now it's near 0.116, up about 22% in a day. The hourly chart shows volume expanding and breaking out of the consolidation range. In the short term it's still leaning bullish, but after the move up to 0.1195 it's still digesting.
Key support to watch: 0.111—0.114
Resistance above: 0.118—0.1195
Below is only the new support zone formed after the breakout. If the hourly close falls below 0.111, the bullish view weakens and we may look for it to recover; if it holds above 0.1195, then reassess whether the move can continue.
Key support to watch: 0.111—0.114
Resistance above: 0.118—0.1195
Below is only the new support zone formed after the breakout. If the hourly close falls below 0.111, the bullish view weakens and we may look for it to recover; if it holds above 0.1195, then reassess whether the move can continue.
277
·
--
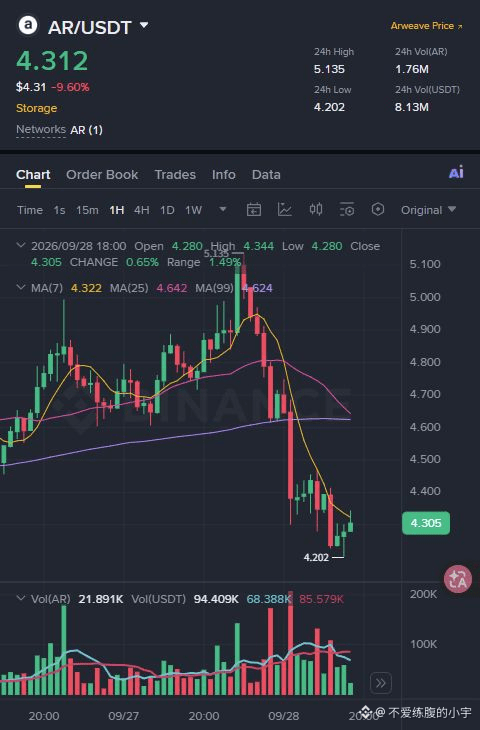
$AR dropped from 5.135 to around 4.31 and rebounded back near 4.31, still about 16% below the high. On the hourly chart, these few small bullish candles show that the volume still hasn’t caught up with the prior drop segment, so the short-term outlook is relatively weak for now.
Support to watch: 4.20—4.30
Resistance above: 4.38—4.45
Also below is the earlier pullback area on the four-hour chart, and it is currently testing for sustained support. If the hourly close reclaims 4.45, that would be a relatively weaker sign to start recovering first; if it breaks below 4.20, this small rebound will not hold.
$AR dropped from 5.135 to around 4.31 and rebounded back near 4.31, still about 16% below the high. On the hourly chart, these few small bullish candles show that the volume still hasn’t caught up with the prior drop segment, so the short-term outlook is relatively weak for now.
Support to watch: 4.20—4.30
Resistance above: 4.38—4.45
Also below is the earlier pullback area on the four-hour chart, and it is currently testing for sustained support. If the hourly close reclaims 4.45, that would be a relatively weaker sign to start recovering first; if it breaks below 4.20, this small rebound will not hold.
Support to watch: 4.20—4.30
Resistance above: 4.38—4.45
Also below is the earlier pullback area on the four-hour chart, and it is currently testing for sustained support. If the hourly close reclaims 4.45, that would be a relatively weaker sign to start recovering first; if it breaks below 4.20, this small rebound will not hold.
531
·
--
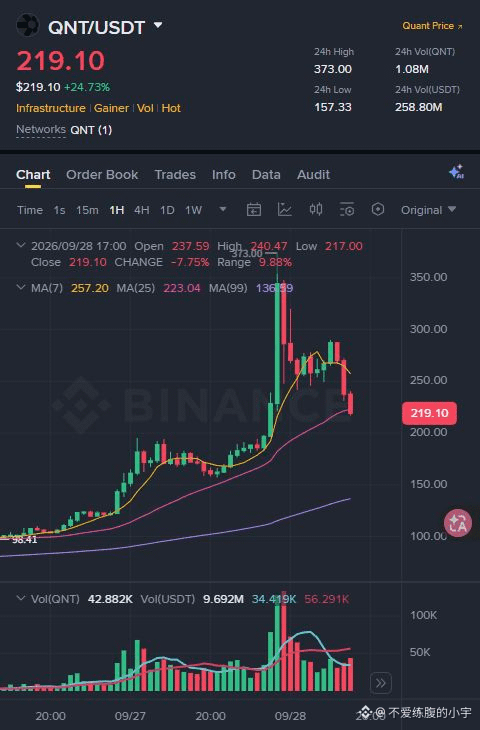
$QNT This morning it was still around 264; now it has pulled back to about 219. The previous hour candlestick closed around 237.6, has broken below the 250 level that was being watched earlier this morning. The prior high-level consolidation view has weakened.
Support to watch below: 180—190
Resistance on rebounds: 250—260
What’s below is the consolidation area before the rally; it’s still far away, so it doesn’t mean it must reach there. If the hourly close returns above 260 and then holds, the weak outlook remains; in the past 24 hours it is still up about 25%, which also doesn’t mean the pullback has ended.
$QNT This morning it was still around 264; now it has pulled back to about 219. The previous hour candlestick closed around 237.6, has broken below the 250 level that was being watched earlier this morning. The prior high-level consolidation view has weakened.
Support to watch below: 180—190
Resistance on rebounds: 250—260
What’s below is the consolidation area before the rally; it’s still far away, so it doesn’t mean it must reach there. If the hourly close returns above 260 and then holds, the weak outlook remains; in the past 24 hours it is still up about 25%, which also doesn’t mean the pullback has ended.
Support to watch below: 180—190
Resistance on rebounds: 250—260
What’s below is the consolidation area before the rally; it’s still far away, so it doesn’t mean it must reach there. If the hourly close returns above 260 and then holds, the weak outlook remains; in the past 24 hours it is still up about 25%, which also doesn’t mean the pullback has ended.
13
·
--
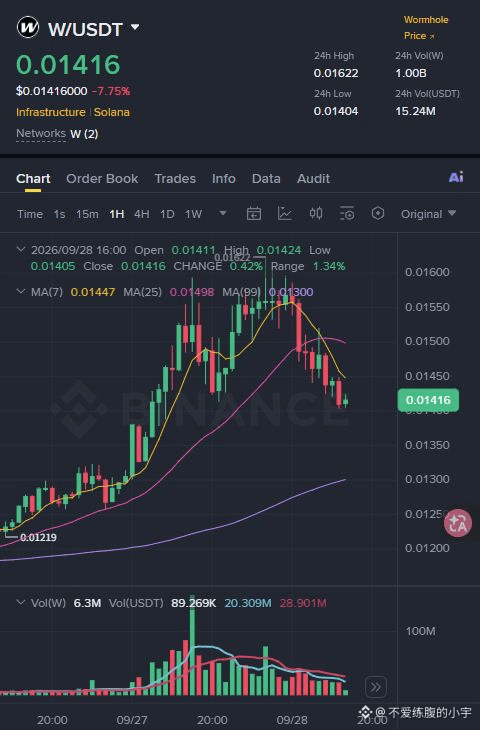
$W Having moved from 0.01622 down to around 0.0142, the peak has already pulled back by about 13%. The earlier volume-driven surge is still very noticeable; however, the hourly rebounds are each lower than the last, making the short-term outlook weak.
Support to watch: 0.0140—0.0143
Resistance overhead: 0.0147—0.0150
The price is currently approaching the previous pullback area below, but it hasn’t confirmed that it will hold. If the hourly close returns to 0.0150, it would be relatively weak—so I would first look to take back. If it breaks below 0.0140, the four-hour rally from this round also needs to be reassessed.
$W Having moved from 0.01622 down to around 0.0142, the peak has already pulled back by about 13%. The earlier volume-driven surge is still very noticeable; however, the hourly rebounds are each lower than the last, making the short-term outlook weak.
Support to watch: 0.0140—0.0143
Resistance overhead: 0.0147—0.0150
The price is currently approaching the previous pullback area below, but it hasn’t confirmed that it will hold. If the hourly close returns to 0.0150, it would be relatively weak—so I would first look to take back. If it breaks below 0.0140, the four-hour rally from this round also needs to be reassessed.
Support to watch: 0.0140—0.0143
Resistance overhead: 0.0147—0.0150
The price is currently approaching the previous pullback area below, but it hasn’t confirmed that it will hold. If the hourly close returns to 0.0150, it would be relatively weak—so I would first look to take back. If it breaks below 0.0140, the four-hour rally from this round also needs to be reassessed.
243
·
--
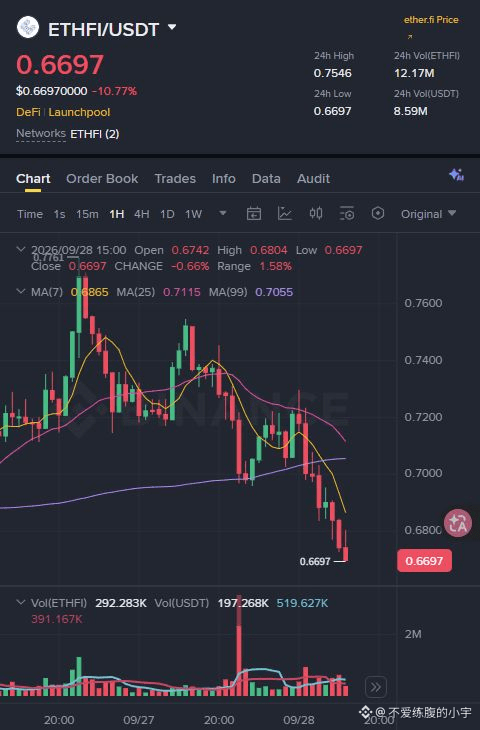
$ETHFI Yesterday, around this time, it was still near 0.75. Now it’s down to around 0.67, a daily drop of nearly 11%. The hourly rebound peak has been trending lower all the way down. During the declining phase, trading volume has also been more active than during the previous sideways consolidation, so the short term bias remains bearish.
Support to watch: 0.650—0.660
Resistance above: 0.685—0.695
Below lies the dense zone from the earlier four-hour chart, which hasn’t been retested yet, so it shouldn’t be taken as a confirmed bottom. If the hourly close can regain 0.695, the bearish view should be adjusted; otherwise, the outlook remains bearish for now, and the market should first pull back and recover.
$ETHFI Yesterday, around this time, it was still near 0.75. Now it’s down to around 0.67, a daily drop of nearly 11%. The hourly rebound peak has been trending lower all the way down. During the declining phase, trading volume has also been more active than during the previous sideways consolidation, so the short term bias remains bearish.
Support to watch: 0.650—0.660
Resistance above: 0.685—0.695
Below lies the dense zone from the earlier four-hour chart, which hasn’t been retested yet, so it shouldn’t be taken as a confirmed bottom. If the hourly close can regain 0.695, the bearish view should be adjusted; otherwise, the outlook remains bearish for now, and the market should first pull back and recover.
Support to watch: 0.650—0.660
Resistance above: 0.685—0.695
Below lies the dense zone from the earlier four-hour chart, which hasn’t been retested yet, so it shouldn’t be taken as a confirmed bottom. If the hourly close can regain 0.695, the bearish view should be adjusted; otherwise, the outlook remains bearish for now, and the market should first pull back and recover.
139
·
--
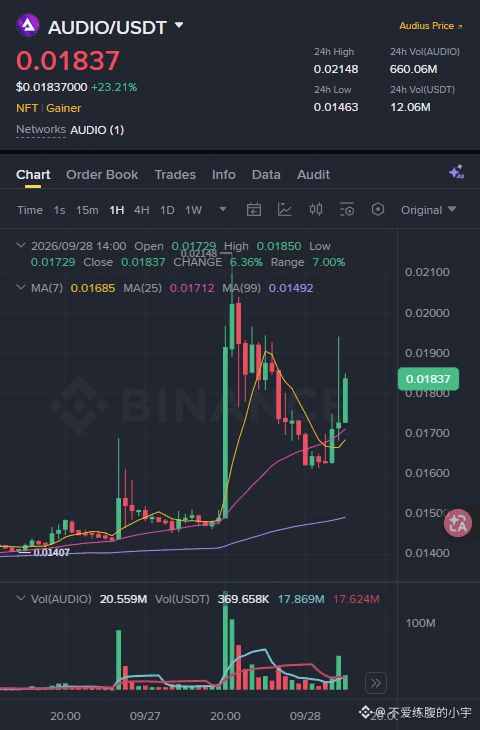
$AUDIO bounced back from around 0.0163 to 0.0184, up about 23% over 24 hours. The four-hour chart is still rising; the one-hour trading volume has surged for a rebound and repair. In the short term, it’s slightly bullish, but the long upper wicks haven’t been reclaimed yet.
Support to watch: 0.0170—0.0173
Resistance above: 0.0188—0.0194
Below is the rebound breakout zone; whether the pullback can be met with sustained support still needs confirmation. If the hourly close falls below 0.0170, the bullish view would be weakened; only after holding steady above 0.0194 should we reassess for continuation.
$AUDIO bounced back from around 0.0163 to 0.0184, up about 23% over 24 hours. The four-hour chart is still rising; the one-hour trading volume has surged for a rebound and repair. In the short term, it’s slightly bullish, but the long upper wicks haven’t been reclaimed yet.
Support to watch: 0.0170—0.0173
Resistance above: 0.0188—0.0194
Below is the rebound breakout zone; whether the pullback can be met with sustained support still needs confirmation. If the hourly close falls below 0.0170, the bullish view would be weakened; only after holding steady above 0.0194 should we reassess for continuation.
Support to watch: 0.0170—0.0173
Resistance above: 0.0188—0.0194
Below is the rebound breakout zone; whether the pullback can be met with sustained support still needs confirmation. If the hourly close falls below 0.0170, the bullish view would be weakened; only after holding steady above 0.0194 should we reassess for continuation.
45
·
--
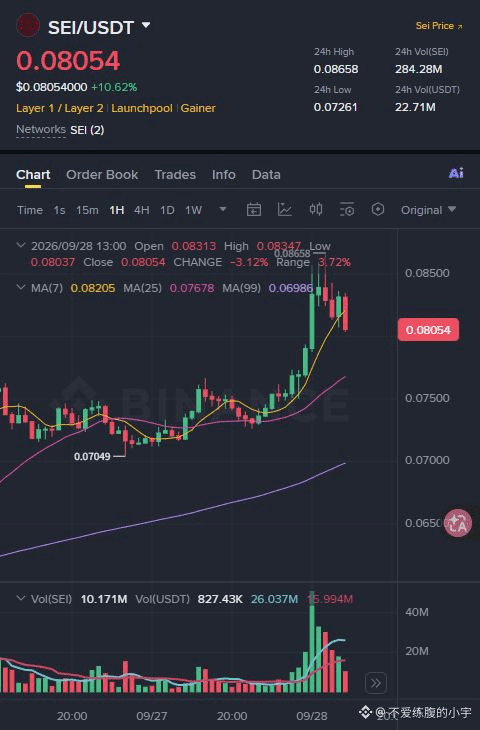
$SEI Four hours still moving upward, while one hour is already pulling back: from 0.0866 down to around 0.0805, with the 24-hour change still up by about 10%. After a volume surge pushed it higher, the rebound in the afternoon failed to hold; short-term momentum is still relatively weak for now.
Support to watch: 0.0800—0.0810
Resistance overhead: 0.0825—0.0835
It’s currently testing the downside again, but it hasn’t confirmed that support is holding yet. If the hourly close returns to 0.0835, the bearish bias remains and the price may pull back. If it breaks below 0.0800, the four-hour uptrend structure also needs to be reassessed.
$SEI Four hours still moving upward, while one hour is already pulling back: from 0.0866 down to around 0.0805, with the 24-hour change still up by about 10%. After a volume surge pushed it higher, the rebound in the afternoon failed to hold; short-term momentum is still relatively weak for now.
Support to watch: 0.0800—0.0810
Resistance overhead: 0.0825—0.0835
It’s currently testing the downside again, but it hasn’t confirmed that support is holding yet. If the hourly close returns to 0.0835, the bearish bias remains and the price may pull back. If it breaks below 0.0800, the four-hour uptrend structure also needs to be reassessed.
Support to watch: 0.0800—0.0810
Resistance overhead: 0.0825—0.0835
It’s currently testing the downside again, but it hasn’t confirmed that support is holding yet. If the hourly close returns to 0.0835, the bearish bias remains and the price may pull back. If it breaks below 0.0800, the four-hour uptrend structure also needs to be reassessed.
41
·
--
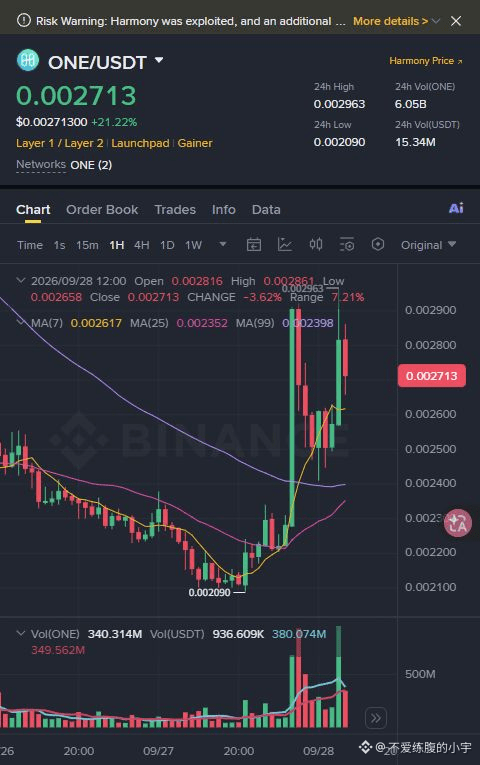
$ONE has returned to around 0.0027. It rose about 21% in a day. After two volume-expansion pushes to break through 0.0029, it still failed to hold. For the next hour, look first for a rebound followed by consolidation.
Support to watch: 0.00245—0.00255
Resistance overhead: 0.00285—0.00296
If the hourly close breaks below 0.00245, the rebound structure weakens; only after holding above 0.00296 should we reassess whether the trend turns stronger. The Binance trading page still shows a safety risk warning—any rebound does not mean the risks have been eliminated.
$ONE has returned to around 0.0027. It rose about 21% in a day. After two volume-expansion pushes to break through 0.0029, it still failed to hold. For the next hour, look first for a rebound followed by consolidation.
Support to watch: 0.00245—0.00255
Resistance overhead: 0.00285—0.00296
If the hourly close breaks below 0.00245, the rebound structure weakens; only after holding above 0.00296 should we reassess whether the trend turns stronger. The Binance trading page still shows a safety risk warning—any rebound does not mean the risks have been eliminated.
Support to watch: 0.00245—0.00255
Resistance overhead: 0.00285—0.00296
If the hourly close breaks below 0.00245, the rebound structure weakens; only after holding above 0.00296 should we reassess whether the trend turns stronger. The Binance trading page still shows a safety risk warning—any rebound does not mean the risks have been eliminated.
178
·
--
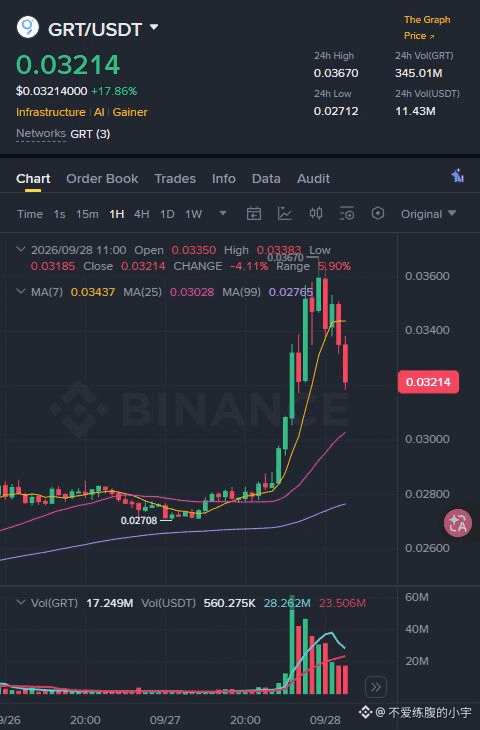
$GRT After a one-day increase of about 18%, it has already retreated from 0.0367 back to around 0.032, a pullback of about 12%. After a surge with increased volume, the intrahour rebound peak is lowering, indicating short-term weakness.
Support to watch: 0.0300–0.0310
Resistance overhead: 0.0335–0.0345
Below is a pause zone during the breakout that needs confirmation for follow-through. If the hourly close returns above 0.0345, it would be weaker and likely requires closing back; if it breaks below 0.0300, then reassess this rally.
$GRT After a one-day increase of about 18%, it has already retreated from 0.0367 back to around 0.032, a pullback of about 12%. After a surge with increased volume, the intrahour rebound peak is lowering, indicating short-term weakness.
Support to watch: 0.0300–0.0310
Resistance overhead: 0.0335–0.0345
Below is a pause zone during the breakout that needs confirmation for follow-through. If the hourly close returns above 0.0345, it would be weaker and likely requires closing back; if it breaks below 0.0300, then reassess this rally.
Support to watch: 0.0300–0.0310
Resistance overhead: 0.0335–0.0345
Below is a pause zone during the breakout that needs confirmation for follow-through. If the hourly close returns above 0.0345, it would be weaker and likely requires closing back; if it breaks below 0.0300, then reassess this rally.
125
·
--
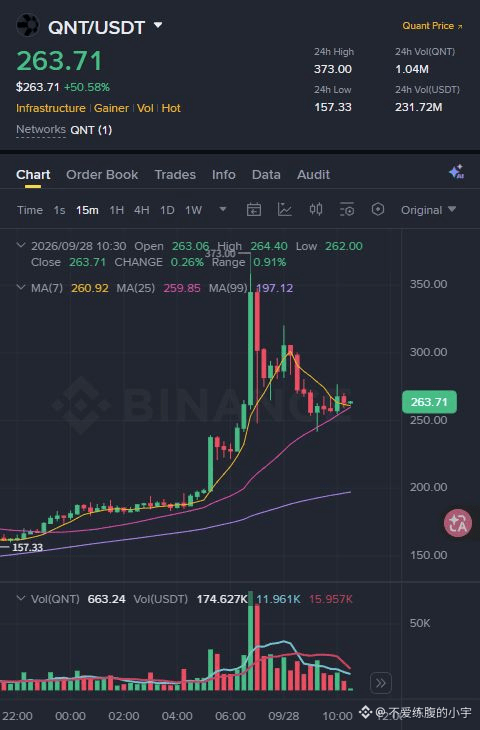
$QNT surged to 373 then retreated to around 264; the retracement from the high is about 29%, yet within 24 hours it’s still up by about 50%. After a high-volume push to the top, in the next hour we should first watch for consolidation in the high range—an equal or greater rise doesn’t necessarily mean the move has already stabilized.
Support to watch: 250—255
Resistance above: 275—285
Below is the short-term tug-of-war zone after the pullback; confirmation is still not sufficient. If the one-hour closing price falls below 250, treat it as weakening; if it holds above 285, reassess whether the rebound can continue.
$QNT surged to 373 then retreated to around 264; the retracement from the high is about 29%, yet within 24 hours it’s still up by about 50%. After a high-volume push to the top, in the next hour we should first watch for consolidation in the high range—an equal or greater rise doesn’t necessarily mean the move has already stabilized.
Support to watch: 250—255
Resistance above: 275—285
Below is the short-term tug-of-war zone after the pullback; confirmation is still not sufficient. If the one-hour closing price falls below 250, treat it as weakening; if it holds above 285, reassess whether the rebound can continue.
Support to watch: 250—255
Resistance above: 275—285
Below is the short-term tug-of-war zone after the pullback; confirmation is still not sufficient. If the one-hour closing price falls below 250, treat it as weakening; if it holds above 285, reassess whether the rebound can continue.
485
Log in to explore more content
Join global crypto users on Binance Square
⚡️ Get latest and useful information about crypto.
💬 Trusted by the world’s largest crypto exchange.
👍 Discover real insights from verified creators.
Email / Phone number
Trending Topics
BitcoinClears$85200
15,479 views
237 Discussing
We got the move, and $BTC is standing exactly where we were before the data. That’s what actual patience for a trade looks like.
The data came in mixed but with some important numbers. ADP Non-Farm Employment Change came at 90K vs 73K forecast, while Core PCE came in at 0.2% vs 0.3% expected. Final GDP was also stronger at 2.2% vs 1.5% forecast, while Personal Spending came in at 0.9% vs 0.8% expected. At the same time, Personal Income missed at 0.2% vs 0.5% forecast.
BTC initially surged to $85,600 and is now back where it needs to be. I’m still looking toward the lower ranges at $82,759 and the $80,000 liquidity, because the overhead liquidity is done and dusted.
We had a live session during the data, and during that session we saw the market at $83,800, then $85,600, and then back toward $83,000 and we still didn’t enter a trade.
That’s what patience is.
We can’t force an entry when the market has no clear direction. The same range is still in focus, and we’ll wait for the market to give us the setup.
Let me know, guys, how was the session? And should we have more regular sessions with our respected members so we can have proper discussions regarding the market?
#BitcoinClears$85200 #AltcoinSeasonIndexHoldsAbove60For5Days #USADPAdds90000JobsInSeptember #BitcoinSlipsBelow$84000 #SECToClarifyOnChainFundraisingRules
Crypto_LUX
·26 Likes
·22.5k views
AltcoinSeasonIndexHoldsAbove60For5Days
74,940 views
1,282 Discussing
USADPAdds90000JobsInSeptember
33,839 views
708 Discussing