
Alamgir al
34 Posts

Alamgir al
Report
Block User
12 Following
4 Followers
38 Liked
Posts
·
--
Article
$APT$APT /USDT
1. $APT /USDT - Current Situation
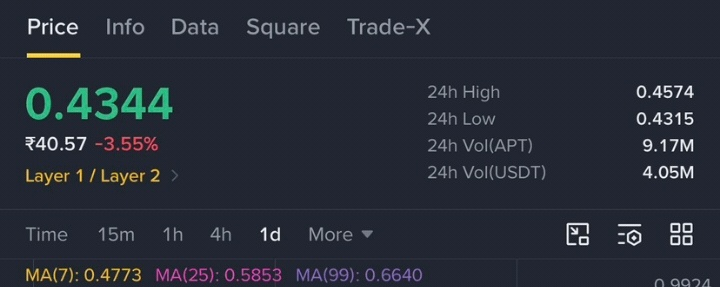
Price in your screenshot: $0.4344
Live Price now: $0.4287 - down *-2.72%* in 24h
24h High: $0.4574
24h Low: $0.4220
24h Volume: 9.17M APT / $4.05M USDT on Binance - volume is low, which means buyers are not interested right now.
Market Cap: $396 Million
Rank: #86 - #94
Circulating Supply: 889M APT
Total Supply: 1.21B APT
Max Supply: 2.10B APT
That means only 42% supply is in market. 58% supply is still locked. This is a big risk for long term.
Performance:
5 Days: -18.77%
1 Month: -48.37%
6 Months: -53.19%
Year to Date: -76.65%
1 Year: -84.92%
From ATH $20.40 (Jan 2023): -97.6% down.
So APT is in one of its worst crashes ever. It has made a new All-Time Low on 14 Nov 2026.
2. Chart Analysis - Your Screenshot (1D Timeframe)
Your chart is 1D, and it is telling a very clear story.
A. The Top:
Price went up and made a top at $0.9655 around early October 2026.
After that, buyers failed, and sellers took full control.
B. The Downtrend:
From $0.9655 to $0.4283, price has fallen -55% in just 1.5 months without any big bounce.
In your screenshot, you can see a big red channel - price is falling inside that channel, making lower highs and lower lows. This is classic bearish downtrend.
Every time price tried to go up, it was rejected from MA.
C. Moving Averages - All Bearish:
MA(7): 0.4773
MA(25): 0.5853
MA(99): 0.6640
Price $0.43 is below all 3 MAs. And MA7 is below MA25, MA25 is below MA99. This is called Death Cross alignment. It means sellers are strong in short, mid and long term.
Price needs to close above MA7 ($0.4773) first to show any strength.
*D. RSI / Momentum:
RSI is around 25-28 on 1D. This is oversold zone.
Oversold does NOT mean buy immediately. It means price has fallen too fast, so a small bounce can come, but trend can stay oversold for many days.
E. Volume:
When price was falling from $0.96, volume was high. Now when price is near $0.43, volume is decreasing. This means sellers are tired, but buyers are also not coming. Market is in fear
3. Key Support and Resistance Levels
This is the most important part.
Support Levels (Neeche):
Support Price Importance
S1 - Immediate Support $0.4347 Price is sitting on this right now. If it breaks, next fall starts
S2 - Strong Support $0.4228 This is the All-Time Low area. Last defence
**S3 - Breakdown Target $0.350 - $0.340** If $0.4228 breaks with daily close, price can go here
S4 - Worst Case $0.3088 Year-end bearish prediction
*Resistance Levels (Upar):
Resistance Price Importance
R1 - First Resistance $0.465 1D pivot, small bounce target
R2 - MA7 Resistance $0.4773 Need to break this to stop downtrend
R3 - Strong Resistance $0.5196 Old support, now resistance
R4 - Major Resistance $0.6120 If price closes above this, then trend changes
R5 - Range Top $0.9655 - $1.00 Full recovery only above $1.00
Simple Rule:
Above $0.4650 = short bounce to $0.48 - $0.52
-Below $0.4228 = big fall to $0.35 - $0.30
Above $0.6120= trend reversal start
Above $1.00= real bull run
4. Fundamental Analysis - Why is APT Falling?
1. Token Unlocks:
Aptos has monthly unlocks. Even though on 11 Oct 2026, annual unlocks decreased by 60%, still new tokens are coming into market every month, creating selling pressure.
2. Whole Market Down:
BTC and whole altcoin market is down. When BTC falls, Layer-1 coins like APT fall 2x more.
3. No New Hype:
Aptos is a Layer-1 blockchain using Move language. It is fast and secure, but it has not got new big hype like Solana or Sui. Users are not growing fast.
4. Investors Selling:
Early investors who bought at $1 - $5 are now selling at loss to cut loss. That is why price keeps falling.
Positive Point:Aptos team is still working. They did a big protocol upgrade in Q4 2026 to improve tokenomics. If market recovers, APT can bounce fast because it is oversold.
5. 3 Possible Scenarios for Next Days
Scenario 1 - Bounce (40% Chance)
Price holds $0.4228, RSI oversold bounce comes.
Price goes to $0.4650 -> $0.4868.
This will be a selling opportunity, not a trend change.
Scenario 2 - Sideways (35% Chance)
Price moves between $0.4228 - $0.4650 for few days, makes base.
Then it will decide next direction.
Scenario 3 - Breakdown (25% Chance)
Price closes daily below $0.4228.
Then next target $0.35, then $0.3088.
This will be very bearish.
6. What Should You Do? - Strategy
If You Are Holding APT in Loss:
1. Do NOT panic sell at bottom. Price is near ATL, panic selling is worst.
2. Do NOT buy more in full amount at once. Use DCA - buy small-small.
3. Example DCA: Buy 25% at $0.43, 25% at $0.38, 25% at $0.34, 25% at $0.30.
4. Keep stop-loss: If you are a trader, stop-loss below $0.42 daily close.
5. If you are long-term holder, hold only that amount which you can afford to lose.
If You Want to Buy Fresh:
1. Wait for daily close above $0.4650 for safe entry. Target $0.51, Stop-loss $0.42.
2. Risky entry: Buy now at $0.43, but keep stop-loss at $0.4150. Target $0.48.
3. Do NOT use leverage in this market. Leverage will liquidate you in this volatility.
If You Want to Short:
Do NOT short at bottom. Price is already oversold. Short only if price goes to $0.48 - $0.51 and rejects from there.
7. Long Term Prediction (Not Guarantee)
According to different models:
End 2026: $0.3088 - $0.5604
End 2027: $0.2694 - $0.8562
End 2030: $0.2024 - $1.93
If APT recovers above $1.00 with volume, next target is $2.05.
Final Summary in 1 Line:
> APT is in strong downtrend, sitting on its last support $0.4228. Hold with patience, don't panic, and don't buy with leverage. Wait for $0.4650 breakout for confirmation
Tell me:
1. Aap ne APT kis price pe buy kiya hai
#VisaPlansStablecoinPrefundingForAPACCrossBorderPayments
2. Kitna amount lagaya hai.
3. Hold karna hai ya trade karna hai.
#NvidiaBeatsEstimatesWith$130BQ4Outlook #RussianCentralBankPlansToAllowFundsToHoldCryptoIn2027
$APT
$APT /USDT
1. $APT /USDT - Current Situation
Price in your screenshot: $0.4344
Live Price now: $0.4287 - down *-2.72%* in 24h
24h High: $0.4574
24h Low: $0.4220
24h Volume: 9.17M APT / $4.05M USDT on Binance - volume is low, which means buyers are not interested right now.
Market Cap: $396 Million
Rank: #86 - #94
Circulating Supply: 889M APT
Total Supply: 1.21B APT
Max Supply: 2.10B APT
That means only 42% supply is in market. 58% supply is still locked. This is a big risk for long term.
Performance:
5 Days: -18.77%
1 Month: -48.37%
6 Months: -53.19%
Year to Date: -76.65%
1 Year: -84.92%
From ATH $20.40 (Jan 2023): -97.6% down.
So APT is in one of its worst crashes ever. It has made a new All-Time Low on 14 Nov 2026.
2. Chart Analysis - Your Screenshot (1D Timeframe)
Your chart is 1D, and it is telling a very clear story.
A. The Top:
Price went up and made a top at $0.9655 around early October 2026.
After that, buyers failed, and sellers took full control.
B. The Downtrend:
From $0.9655 to $0.4283, price has fallen -55% in just 1.5 months without any big bounce.
In your screenshot, you can see a big red channel - price is falling inside that channel, making lower highs and lower lows. This is classic bearish downtrend.
Every time price tried to go up, it was rejected from MA.
C. Moving Averages - All Bearish:
MA(7): 0.4773
MA(25): 0.5853
MA(99): 0.6640
Price $0.43 is below all 3 MAs. And MA7 is below MA25, MA25 is below MA99. This is called Death Cross alignment. It means sellers are strong in short, mid and long term.
Price needs to close above MA7 ($0.4773) first to show any strength.
*D. RSI / Momentum:
RSI is around 25-28 on 1D. This is oversold zone.
Oversold does NOT mean buy immediately. It means price has fallen too fast, so a small bounce can come, but trend can stay oversold for many days.
E. Volume:
When price was falling from $0.96, volume was high. Now when price is near $0.43, volume is decreasing. This means sellers are tired, but buyers are also not coming. Market is in fear
3. Key Support and Resistance Levels
This is the most important part.
Support Levels (Neeche):
Support Price Importance
S1 - Immediate Support $0.4347 Price is sitting on this right now. If it breaks, next fall starts
S2 - Strong Support $0.4228 This is the All-Time Low area. Last defence
**S3 - Breakdown Target $0.350 - $0.340** If $0.4228 breaks with daily close, price can go here
S4 - Worst Case $0.3088 Year-end bearish prediction
*Resistance Levels (Upar):
Resistance Price Importance
R1 - First Resistance $0.465 1D pivot, small bounce target
R2 - MA7 Resistance $0.4773 Need to break this to stop downtrend
R3 - Strong Resistance $0.5196 Old support, now resistance
R4 - Major Resistance $0.6120 If price closes above this, then trend changes
R5 - Range Top $0.9655 - $1.00 Full recovery only above $1.00
Simple Rule:
Above $0.4650 = short bounce to $0.48 - $0.52
-Below $0.4228 = big fall to $0.35 - $0.30
Above $0.6120= trend reversal start
Above $1.00= real bull run
4. Fundamental Analysis - Why is APT Falling?
1. Token Unlocks:
Aptos has monthly unlocks. Even though on 11 Oct 2026, annual unlocks decreased by 60%, still new tokens are coming into market every month, creating selling pressure.
2. Whole Market Down:
BTC and whole altcoin market is down. When BTC falls, Layer-1 coins like APT fall 2x more.
3. No New Hype:
Aptos is a Layer-1 blockchain using Move language. It is fast and secure, but it has not got new big hype like Solana or Sui. Users are not growing fast.
4. Investors Selling:
Early investors who bought at $1 - $5 are now selling at loss to cut loss. That is why price keeps falling.
Positive Point:Aptos team is still working. They did a big protocol upgrade in Q4 2026 to improve tokenomics. If market recovers, APT can bounce fast because it is oversold.
5. 3 Possible Scenarios for Next Days
Scenario 1 - Bounce (40% Chance)
Price holds $0.4228, RSI oversold bounce comes.
Price goes to $0.4650 -> $0.4868.
This will be a selling opportunity, not a trend change.
Scenario 2 - Sideways (35% Chance)
Price moves between $0.4228 - $0.4650 for few days, makes base.
Then it will decide next direction.
Scenario 3 - Breakdown (25% Chance)
Price closes daily below $0.4228.
Then next target $0.35, then $0.3088.
This will be very bearish.
6. What Should You Do? - Strategy
If You Are Holding APT in Loss:
1. Do NOT panic sell at bottom. Price is near ATL, panic selling is worst.
2. Do NOT buy more in full amount at once. Use DCA - buy small-small.
3. Example DCA: Buy 25% at $0.43, 25% at $0.38, 25% at $0.34, 25% at $0.30.
4. Keep stop-loss: If you are a trader, stop-loss below $0.42 daily close.
5. If you are long-term holder, hold only that amount which you can afford to lose.
If You Want to Buy Fresh:
1. Wait for daily close above $0.4650 for safe entry. Target $0.51, Stop-loss $0.42.
2. Risky entry: Buy now at $0.43, but keep stop-loss at $0.4150. Target $0.48.
3. Do NOT use leverage in this market. Leverage will liquidate you in this volatility.
If You Want to Short:
Do NOT short at bottom. Price is already oversold. Short only if price goes to $0.48 - $0.51 and rejects from there.
7. Long Term Prediction (Not Guarantee)
According to different models:
End 2026: $0.3088 - $0.5604
End 2027: $0.2694 - $0.8562
End 2030: $0.2024 - $1.93
If APT recovers above $1.00 with volume, next target is $2.05.
Final Summary in 1 Line:
> APT is in strong downtrend, sitting on its last support $0.4228. Hold with patience, don't panic, and don't buy with leverage. Wait for $0.4650 breakout for confirmation
Tell me:
1. Aap ne APT kis price pe buy kiya hai
#VisaPlansStablecoinPrefundingForAPACCrossBorderPayments
2. Kitna amount lagaya hai.
3. Hold karna hai ya trade karna hai.
#NvidiaBeatsEstimatesWith$130BQ4Outlook #RussianCentralBankPlansToAllowFundsToHoldCryptoIn2027
1. $APT /USDT - Current Situation
Price in your screenshot: $0.4344
Live Price now: $0.4287 - down *-2.72%* in 24h
24h High: $0.4574
24h Low: $0.4220
24h Volume: 9.17M APT / $4.05M USDT on Binance - volume is low, which means buyers are not interested right now.
Market Cap: $396 Million
Rank: #86 - #94
Circulating Supply: 889M APT
Total Supply: 1.21B APT
Max Supply: 2.10B APT
That means only 42% supply is in market. 58% supply is still locked. This is a big risk for long term.
Performance:
5 Days: -18.77%
1 Month: -48.37%
6 Months: -53.19%
Year to Date: -76.65%
1 Year: -84.92%
From ATH $20.40 (Jan 2023): -97.6% down.
So APT is in one of its worst crashes ever. It has made a new All-Time Low on 14 Nov 2026.
2. Chart Analysis - Your Screenshot (1D Timeframe)
Your chart is 1D, and it is telling a very clear story.
A. The Top:
Price went up and made a top at $0.9655 around early October 2026.
After that, buyers failed, and sellers took full control.
B. The Downtrend:
From $0.9655 to $0.4283, price has fallen -55% in just 1.5 months without any big bounce.
In your screenshot, you can see a big red channel - price is falling inside that channel, making lower highs and lower lows. This is classic bearish downtrend.
Every time price tried to go up, it was rejected from MA.
C. Moving Averages - All Bearish:
MA(7): 0.4773
MA(25): 0.5853
MA(99): 0.6640
Price $0.43 is below all 3 MAs. And MA7 is below MA25, MA25 is below MA99. This is called Death Cross alignment. It means sellers are strong in short, mid and long term.
Price needs to close above MA7 ($0.4773) first to show any strength.
*D. RSI / Momentum:
RSI is around 25-28 on 1D. This is oversold zone.
Oversold does NOT mean buy immediately. It means price has fallen too fast, so a small bounce can come, but trend can stay oversold for many days.
E. Volume:
When price was falling from $0.96, volume was high. Now when price is near $0.43, volume is decreasing. This means sellers are tired, but buyers are also not coming. Market is in fear
3. Key Support and Resistance Levels
This is the most important part.
Support Levels (Neeche):
Support Price Importance
S1 - Immediate Support $0.4347 Price is sitting on this right now. If it breaks, next fall starts
S2 - Strong Support $0.4228 This is the All-Time Low area. Last defence
**S3 - Breakdown Target $0.350 - $0.340** If $0.4228 breaks with daily close, price can go here
S4 - Worst Case $0.3088 Year-end bearish prediction
*Resistance Levels (Upar):
Resistance Price Importance
R1 - First Resistance $0.465 1D pivot, small bounce target
R2 - MA7 Resistance $0.4773 Need to break this to stop downtrend
R3 - Strong Resistance $0.5196 Old support, now resistance
R4 - Major Resistance $0.6120 If price closes above this, then trend changes
R5 - Range Top $0.9655 - $1.00 Full recovery only above $1.00
Simple Rule:
Above $0.4650 = short bounce to $0.48 - $0.52
-Below $0.4228 = big fall to $0.35 - $0.30
Above $0.6120= trend reversal start
Above $1.00= real bull run
4. Fundamental Analysis - Why is APT Falling?
1. Token Unlocks:
Aptos has monthly unlocks. Even though on 11 Oct 2026, annual unlocks decreased by 60%, still new tokens are coming into market every month, creating selling pressure.
2. Whole Market Down:
BTC and whole altcoin market is down. When BTC falls, Layer-1 coins like APT fall 2x more.
3. No New Hype:
Aptos is a Layer-1 blockchain using Move language. It is fast and secure, but it has not got new big hype like Solana or Sui. Users are not growing fast.
4. Investors Selling:
Early investors who bought at $1 - $5 are now selling at loss to cut loss. That is why price keeps falling.
Positive Point:Aptos team is still working. They did a big protocol upgrade in Q4 2026 to improve tokenomics. If market recovers, APT can bounce fast because it is oversold.
5. 3 Possible Scenarios for Next Days
Scenario 1 - Bounce (40% Chance)
Price holds $0.4228, RSI oversold bounce comes.
Price goes to $0.4650 -> $0.4868.
This will be a selling opportunity, not a trend change.
Scenario 2 - Sideways (35% Chance)
Price moves between $0.4228 - $0.4650 for few days, makes base.
Then it will decide next direction.
Scenario 3 - Breakdown (25% Chance)
Price closes daily below $0.4228.
Then next target $0.35, then $0.3088.
This will be very bearish.
6. What Should You Do? - Strategy
If You Are Holding APT in Loss:
1. Do NOT panic sell at bottom. Price is near ATL, panic selling is worst.
2. Do NOT buy more in full amount at once. Use DCA - buy small-small.
3. Example DCA: Buy 25% at $0.43, 25% at $0.38, 25% at $0.34, 25% at $0.30.
4. Keep stop-loss: If you are a trader, stop-loss below $0.42 daily close.
5. If you are long-term holder, hold only that amount which you can afford to lose.
If You Want to Buy Fresh:
1. Wait for daily close above $0.4650 for safe entry. Target $0.51, Stop-loss $0.42.
2. Risky entry: Buy now at $0.43, but keep stop-loss at $0.4150. Target $0.48.
3. Do NOT use leverage in this market. Leverage will liquidate you in this volatility.
If You Want to Short:
Do NOT short at bottom. Price is already oversold. Short only if price goes to $0.48 - $0.51 and rejects from there.
7. Long Term Prediction (Not Guarantee)
According to different models:
End 2026: $0.3088 - $0.5604
End 2027: $0.2694 - $0.8562
End 2030: $0.2024 - $1.93
If APT recovers above $1.00 with volume, next target is $2.05.
Final Summary in 1 Line:
> APT is in strong downtrend, sitting on its last support $0.4228. Hold with patience, don't panic, and don't buy with leverage. Wait for $0.4650 breakout for confirmation
Tell me:
1. Aap ne APT kis price pe buy kiya hai
#VisaPlansStablecoinPrefundingForAPACCrossBorderPayments
2. Kitna amount lagaya hai.
3. Hold karna hai ya trade karna hai.
#NvidiaBeatsEstimatesWith$130BQ4Outlook #RussianCentralBankPlansToAllowFundsToHoldCryptoIn2027
1
2
297
·
--
$LAB USDT
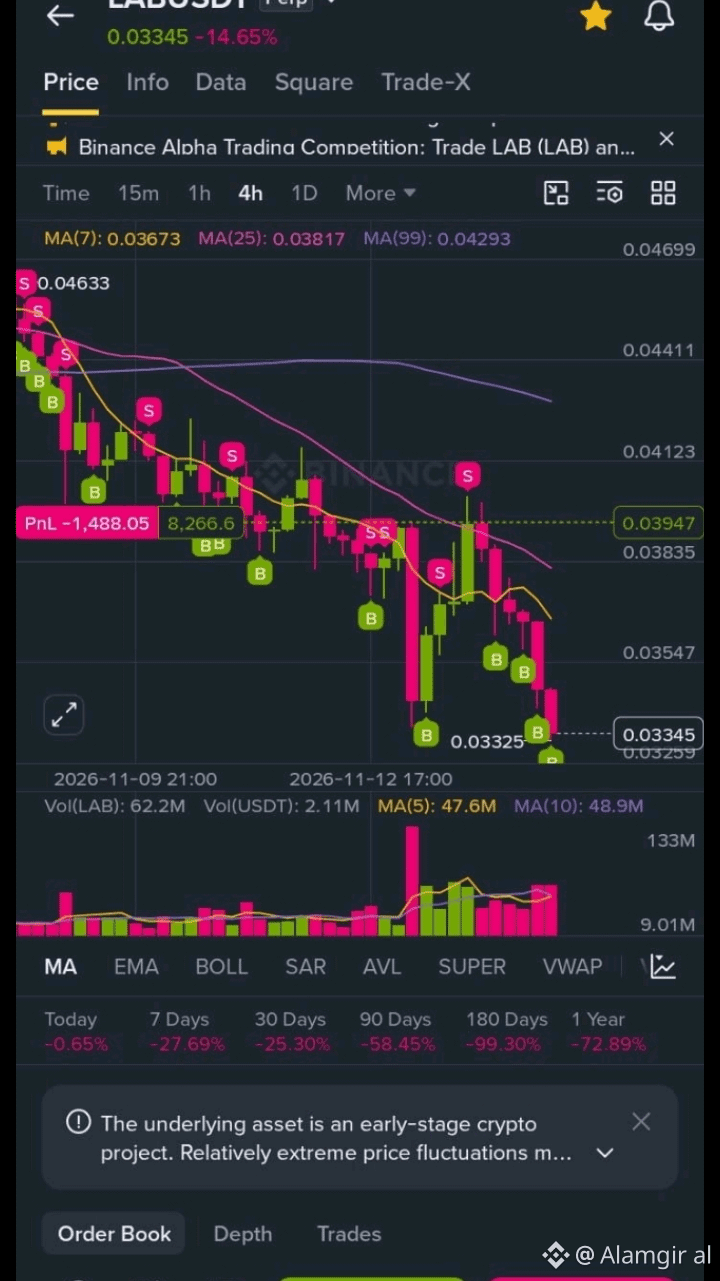
$LAB USDT Perp - 0.03345
Price: 0.03345 / Rs 9.25
Today: -14.65% DOWN
7 Days: -27.69% DOWN
180 Days: -99.30% DOWN
Chart is full downtrend. Price is below all MA lines - 7 0.03673, MA25 0.03817, MA99 0.04293.
Support: 0.03325 - If break, will go to 0.030
Resistance: 0.03673 - If go above, small bounce to 0.038
Don't buy now. Wait for price to go above 0.03673. Very risky coin.
#NvidiaBoardNotConsideringHuang’sReturnasCEO
$LAB USDT
$LAB USDT Perp - 0.03345
Price: 0.03345 / Rs 9.25
Today: -14.65% DOWN
7 Days: -27.69% DOWN
180 Days: -99.30% DOWN
Chart is full downtrend. Price is below all MA lines - 7 0.03673, MA25 0.03817, MA99 0.04293.
Support: 0.03325 - If break, will go to 0.030
Resistance: 0.03673 - If go above, small bounce to 0.038
Don't buy now. Wait for price to go above 0.03673. Very risky coin.
#NvidiaBoardNotConsideringHuang’sReturnasCEO
$LAB USDT Perp - 0.03345
Price: 0.03345 / Rs 9.25
Today: -14.65% DOWN
7 Days: -27.69% DOWN
180 Days: -99.30% DOWN
Chart is full downtrend. Price is below all MA lines - 7 0.03673, MA25 0.03817, MA99 0.04293.
Support: 0.03325 - If break, will go to 0.030
Resistance: 0.03673 - If go above, small bounce to 0.038
Don't buy now. Wait for price to go above 0.03673. Very risky coin.
#NvidiaBoardNotConsideringHuang’sReturnasCEO
1
68
·
--
$BTC -261118-67000
This is NOT a normal coin like BTC, BCH, ZEC. This is a BTC Options Contract. This is very risky. Read this carefully.
1. What Is This Contract?
Name: BTC - 261118 - 67000 - C
BTC = Bitcoin
261118 = Expiry Date: 26 November 2018? No, 26 Nov This contract will expire soon.
67000 a = Strike Price: $67,000
C = CALL Means you are betting that Bitcoin will go UP above $67,000.
Simple meaning: If Bitcoin goes above $67,000 before expiry, you make profit. If Bitcoin stays below $67,000, this contract becomes Zero.
2. Current Price
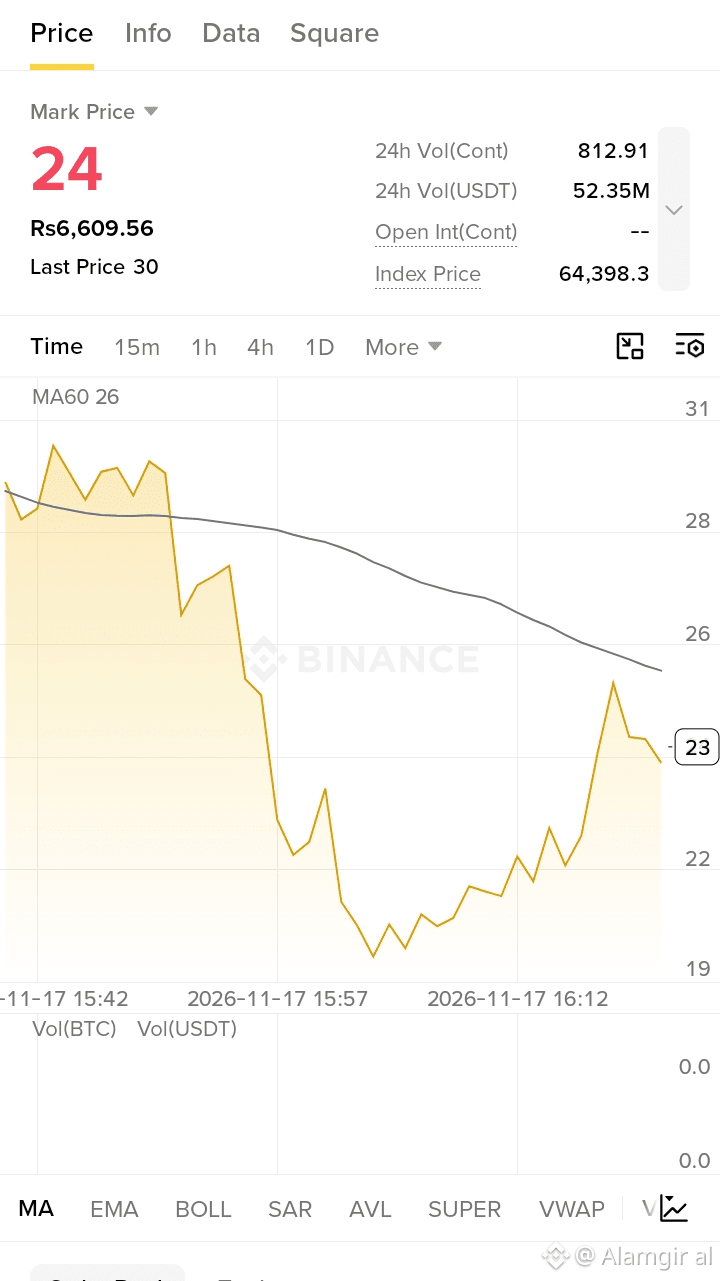
Mark Price: 24 USDT
Last Price: 30 USDT
In Rupees: Rs 6,609.56
Index Price (Real Bitcoin Price): 64,398.3
Bitcoin is now at 64,398. But your Strike is 67,000.
That means Bitcoin is 2,601 dollars BELOW your target. So right now your contract is OUT OF THE MONEY. It is losing.
That is why Mark Price is only 24. Very cheap.
3. Last 24 Hours
24h Vol (Contracts): 812.91
24h Vol (USDT): 52.35M
Volume is high. 52 Million dollars. A lot of people are trading this option.
4. What Does The Chart Show?
Look at the chart carefully. It is a very dangerous chart.
Price was near 29-30, then it fell down in one straight line like a cliff to 19. Then it made a small bounce to 21, then again to 23, then to 25, then it fell again to 23.
The black line MA60 = 26. Price 24 is BELOW that line. That means sellers are winning.
At the bottom, volume is 0.0. No volume now. Market is slow.
Why did it fall from 30 to 19? Because:
1. $BTC price went down from above to 64,398.
2. Time is finishing. Every hour, this option loses value. This is called Time Decay.
Even if Bitcoin stays same, your option price will go down every day.
This is a very, very risky trade. This is not for holding.
You bought a CALL at $67,000. Bitcoin is at $64,398. You need Bitcoin to pump +4% very fast to just reach your strike.
$BTC does not go above $67,000 before expiry, your full money becomes Zero. You will #AnthropicIPOTestsInvestorAppetiteForAI
$BTC -261118-67000
This is NOT a normal coin like BTC, BCH, ZEC. This is a BTC Options Contract. This is very risky. Read this carefully.
1. What Is This Contract?
Name: BTC - 261118 - 67000 - C
BTC = Bitcoin
261118 = Expiry Date: 26 November 2018? No, 26 Nov This contract will expire soon.
67000 a = Strike Price: $67,000
C = CALL Means you are betting that Bitcoin will go UP above $67,000.
Simple meaning: If Bitcoin goes above $67,000 before expiry, you make profit. If Bitcoin stays below $67,000, this contract becomes Zero.
2. Current Price
Mark Price: 24 USDT
Last Price: 30 USDT
In Rupees: Rs 6,609.56
Index Price (Real Bitcoin Price): 64,398.3
Bitcoin is now at 64,398. But your Strike is 67,000.
That means Bitcoin is 2,601 dollars BELOW your target. So right now your contract is OUT OF THE MONEY. It is losing.
That is why Mark Price is only 24. Very cheap.
3. Last 24 Hours
24h Vol (Contracts): 812.91
24h Vol (USDT): 52.35M
Volume is high. 52 Million dollars. A lot of people are trading this option.
4. What Does The Chart Show?
Look at the chart carefully. It is a very dangerous chart.
Price was near 29-30, then it fell down in one straight line like a cliff to 19. Then it made a small bounce to 21, then again to 23, then to 25, then it fell again to 23.
The black line MA60 = 26. Price 24 is BELOW that line. That means sellers are winning.
At the bottom, volume is 0.0. No volume now. Market is slow.
Why did it fall from 30 to 19? Because:
1. $BTC price went down from above to 64,398.
2. Time is finishing. Every hour, this option loses value. This is called Time Decay.
Even if Bitcoin stays same, your option price will go down every day.
This is a very, very risky trade. This is not for holding.
You bought a CALL at $67,000. Bitcoin is at $64,398. You need Bitcoin to pump +4% very fast to just reach your strike.
$BTC does not go above $67,000 before expiry, your full money becomes Zero. You will #AnthropicIPOTestsInvestorAppetiteForAI
This is NOT a normal coin like BTC, BCH, ZEC. This is a BTC Options Contract. This is very risky. Read this carefully.
1. What Is This Contract?
Name: BTC - 261118 - 67000 - C
BTC = Bitcoin
261118 = Expiry Date: 26 November 2018? No, 26 Nov This contract will expire soon.
67000 a = Strike Price: $67,000
C = CALL Means you are betting that Bitcoin will go UP above $67,000.
Simple meaning: If Bitcoin goes above $67,000 before expiry, you make profit. If Bitcoin stays below $67,000, this contract becomes Zero.
2. Current Price
Mark Price: 24 USDT
Last Price: 30 USDT
In Rupees: Rs 6,609.56
Index Price (Real Bitcoin Price): 64,398.3
Bitcoin is now at 64,398. But your Strike is 67,000.
That means Bitcoin is 2,601 dollars BELOW your target. So right now your contract is OUT OF THE MONEY. It is losing.
That is why Mark Price is only 24. Very cheap.
3. Last 24 Hours
24h Vol (Contracts): 812.91
24h Vol (USDT): 52.35M
Volume is high. 52 Million dollars. A lot of people are trading this option.
4. What Does The Chart Show?
Look at the chart carefully. It is a very dangerous chart.
Price was near 29-30, then it fell down in one straight line like a cliff to 19. Then it made a small bounce to 21, then again to 23, then to 25, then it fell again to 23.
The black line MA60 = 26. Price 24 is BELOW that line. That means sellers are winning.
At the bottom, volume is 0.0. No volume now. Market is slow.
Why did it fall from 30 to 19? Because:
1. $BTC price went down from above to 64,398.
2. Time is finishing. Every hour, this option loses value. This is called Time Decay.
Even if Bitcoin stays same, your option price will go down every day.
This is a very, very risky trade. This is not for holding.
You bought a CALL at $67,000. Bitcoin is at $64,398. You need Bitcoin to pump +4% very fast to just reach your strike.
$BTC does not go above $67,000 before expiry, your full money becomes Zero. You will #AnthropicIPOTestsInvestorAppetiteForAI
1
41
·
--
Article
UAIUSDT$UAI / USDT
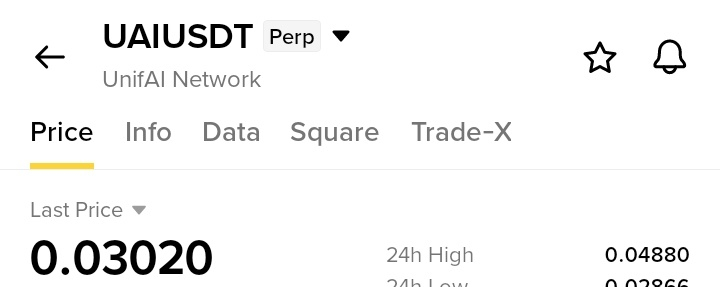
1. Current Price
- Price: 0.03020 USDT
- In Rupees: Rs 8.35
- Today: -36.46% DOWN - This is a very big crash in one day.
- Mark Price: 0.03025
$UAI = Only 8 Rupees 35 Paisa.
2. Last 24 Hours
- 24h High: 0.04880
- 24h Low: 0.02866
- 24h Volume UAI: 1.39B
- 24h Volume USDT: 49.46M
Volume is huge. 49 Million dollars. This means a lot of people are selling in panic.
From High to Low: Price fell from 0.04880 to 0.02866. That is almost -41% fall in one day. This is a crash.
3. What Does The Chart Show?
Look at the chart carefully. It is a very bad chart.
Price was near 0.03050, then it pumped up to 0.03050+ , then suddenly it fell down in one straight line like a cliff to 0.03001. Then it tried to go up 2-3 times, but every time sellers pushed it down again.
The black line MA60 = 0.03022. Price 0.03020 is just BELOW that line. Only a little below. That means buyers and sellers are fighting right on the line.
At the bottom, you see red and green bars. Red = selling, Green = buying. There is one big green bar on the right side - someone bought a lot. But after that, red bar again. Market is very confused.
This is called a Crash + Dead Cat Bounce. Price falls very fast, then makes a small bounce up, then falls again.
4. Past Performance
- Today: -5.80%
- 7 Days: -75.55%
- 30 Days: -90.79%
- 90 Days: -88.46%
- 180 Days: -87.35%
- 1 Year: -83.13%
Simple meaning: UAI is destroyed in all timeframes.
In 30 Days it fell -90.79%. If you bought 30 days ago for 100 Rupees, now it is only 9 Rupees left. 91 Rupees lost.
In 7 Days it fell -75.55%. This coin is in a free fall.
This is a very dangerous, high-risk AI coin. It is not like BTC or BCH.
Final Conclusion in English:
Do NOT buy UAI now for long-term. It is in a strong downtrend and it just crashed -36% today.
This is a Futures Perp coin. People are doing Long and Short here. If you do Long now, you can get liquidated very fast.
*Support: 0.02866 This is the 24h Low. If it breaks this, it will go to 0.025 or 0.020.
*Resistance: 0.03022 This is MA60. If price goes above this and stays there, then a small bounce to 0.032 is possible. But for a big pump, it must break 0.04880.
Wait for price to hold above 0.03022. Don't catch a falling knife.
Did you buy UAI already? Tell me your buying price, I will tell you if you should cut loss $or hold for a bounce.#A Packed Week of Earnings and Data Tests Markets
UAIUSDT
$UAI / USDT
1. Current Price
- Price: 0.03020 USDT
- In Rupees: Rs 8.35
- Today: -36.46% DOWN - This is a very big crash in one day.
- Mark Price: 0.03025
$UAI = Only 8 Rupees 35 Paisa.
2. Last 24 Hours
- 24h High: 0.04880
- 24h Low: 0.02866
- 24h Volume UAI: 1.39B
- 24h Volume USDT: 49.46M
Volume is huge. 49 Million dollars. This means a lot of people are selling in panic.
From High to Low: Price fell from 0.04880 to 0.02866. That is almost -41% fall in one day. This is a crash.
3. What Does The Chart Show?
Look at the chart carefully. It is a very bad chart.
Price was near 0.03050, then it pumped up to 0.03050+ , then suddenly it fell down in one straight line like a cliff to 0.03001. Then it tried to go up 2-3 times, but every time sellers pushed it down again.
The black line MA60 = 0.03022. Price 0.03020 is just BELOW that line. Only a little below. That means buyers and sellers are fighting right on the line.
At the bottom, you see red and green bars. Red = selling, Green = buying. There is one big green bar on the right side - someone bought a lot. But after that, red bar again. Market is very confused.
This is called a Crash + Dead Cat Bounce. Price falls very fast, then makes a small bounce up, then falls again.
4. Past Performance
- Today: -5.80%
- 7 Days: -75.55%
- 30 Days: -90.79%
- 90 Days: -88.46%
- 180 Days: -87.35%
- 1 Year: -83.13%
Simple meaning: UAI is destroyed in all timeframes.
In 30 Days it fell -90.79%. If you bought 30 days ago for 100 Rupees, now it is only 9 Rupees left. 91 Rupees lost.
In 7 Days it fell -75.55%. This coin is in a free fall.
This is a very dangerous, high-risk AI coin. It is not like BTC or BCH.
Final Conclusion in English:
Do NOT buy UAI now for long-term. It is in a strong downtrend and it just crashed -36% today.
This is a Futures Perp coin. People are doing Long and Short here. If you do Long now, you can get liquidated very fast.
*Support: 0.02866 This is the 24h Low. If it breaks this, it will go to 0.025 or 0.020.
*Resistance: 0.03022 This is MA60. If price goes above this and stays there, then a small bounce to 0.032 is possible. But for a big pump, it must break 0.04880.
Wait for price to hold above 0.03022. Don't catch a falling knife.
Did you buy UAI already? Tell me your buying price, I will tell you if you should cut loss $or hold for a bounce.#A Packed Week of Earnings and Data Tests Markets
1. Current Price
- Price: 0.03020 USDT
- In Rupees: Rs 8.35
- Today: -36.46% DOWN - This is a very big crash in one day.
- Mark Price: 0.03025
$UAI = Only 8 Rupees 35 Paisa.
2. Last 24 Hours
- 24h High: 0.04880
- 24h Low: 0.02866
- 24h Volume UAI: 1.39B
- 24h Volume USDT: 49.46M
Volume is huge. 49 Million dollars. This means a lot of people are selling in panic.
From High to Low: Price fell from 0.04880 to 0.02866. That is almost -41% fall in one day. This is a crash.
3. What Does The Chart Show?
Look at the chart carefully. It is a very bad chart.
Price was near 0.03050, then it pumped up to 0.03050+ , then suddenly it fell down in one straight line like a cliff to 0.03001. Then it tried to go up 2-3 times, but every time sellers pushed it down again.
The black line MA60 = 0.03022. Price 0.03020 is just BELOW that line. Only a little below. That means buyers and sellers are fighting right on the line.
At the bottom, you see red and green bars. Red = selling, Green = buying. There is one big green bar on the right side - someone bought a lot. But after that, red bar again. Market is very confused.
This is called a Crash + Dead Cat Bounce. Price falls very fast, then makes a small bounce up, then falls again.
4. Past Performance
- Today: -5.80%
- 7 Days: -75.55%
- 30 Days: -90.79%
- 90 Days: -88.46%
- 180 Days: -87.35%
- 1 Year: -83.13%
Simple meaning: UAI is destroyed in all timeframes.
In 30 Days it fell -90.79%. If you bought 30 days ago for 100 Rupees, now it is only 9 Rupees left. 91 Rupees lost.
In 7 Days it fell -75.55%. This coin is in a free fall.
This is a very dangerous, high-risk AI coin. It is not like BTC or BCH.
Final Conclusion in English:
Do NOT buy UAI now for long-term. It is in a strong downtrend and it just crashed -36% today.
This is a Futures Perp coin. People are doing Long and Short here. If you do Long now, you can get liquidated very fast.
*Support: 0.02866 This is the 24h Low. If it breaks this, it will go to 0.025 or 0.020.
*Resistance: 0.03022 This is MA60. If price goes above this and stays there, then a small bounce to 0.032 is possible. But for a big pump, it must break 0.04880.
Wait for price to hold above 0.03022. Don't catch a falling knife.
Did you buy UAI already? Tell me your buying price, I will tell you if you should cut loss $or hold for a bounce.#A Packed Week of Earnings and Data Tests Markets
1
1.2k
·
--
Bullish
$BCH / USDT
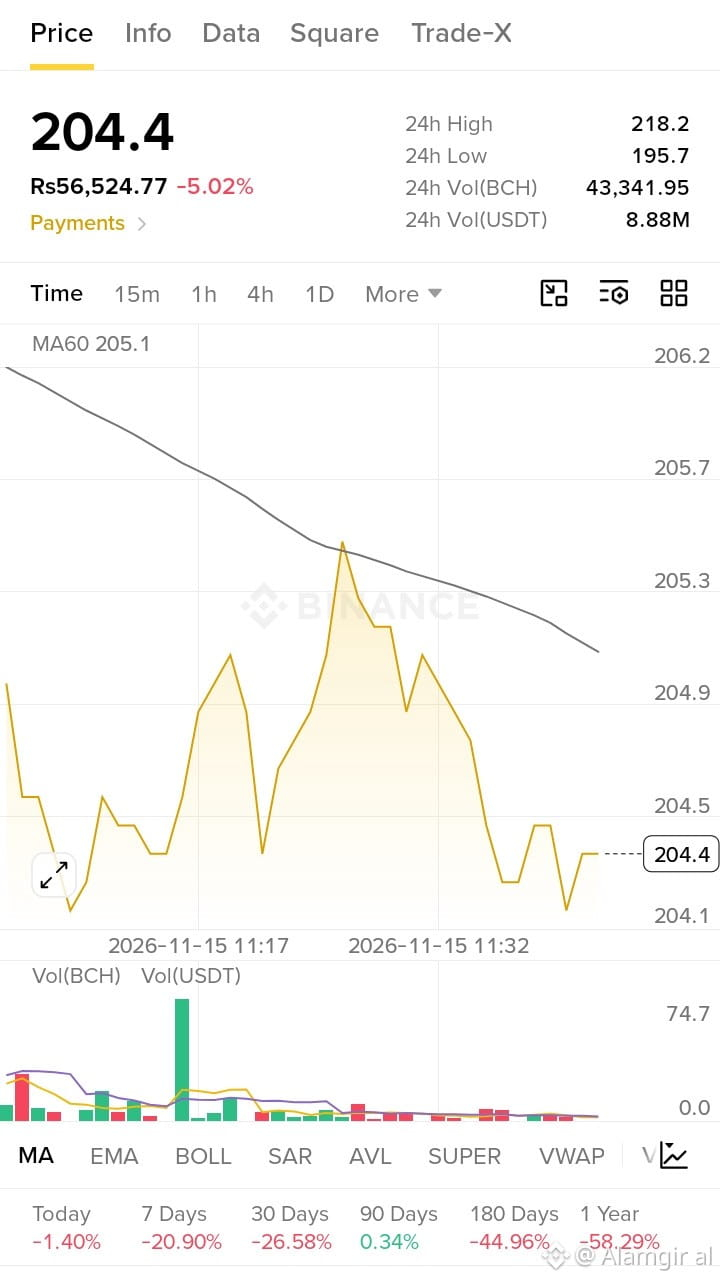
1. Current Price
Price: 204.4 USDT
In Rupees: Rs 56,524.77
Today: -5.02% DOWN
1 BCH = 56 Thousand 524 Rupees.
2. Last 24 Hours
24h High: 218.2
24h Low: 195.7
24h Volume BCH: 43,341.95
24h Volume USDT: 8.88M
Volume is good. 8.88 Million dollars trading. This is a big, old coin, not a new small coin.
3. What Does The Chart Show
Look at the chart carefully. Price is falling.
Price was near 205.3, then it tried to go up 2-3 times to 205.0 and 205.2, but every time sellers pushed it down. At the end, it fell down to 204.1, then made a small bounce to 204.4.
The black line MA60 = 205.1. Price 204.4 is BELOW that line. That means sellers are winning now. Price is under the line. This is a weak sign.
At the bottom, you see one big green bar. That was one big buy. After that, volume is very low. No big buying, no big selling. Market is slow.
This is called a Downtrend. Lower high, lower low. Price is making a staircase going down.
4. Past Performance
Today: -1.40%
7 Days: -20.90%
30 Days: -26.58%
90 Days: +0.34%
180 Days: -44.96%
1 Year: -58.29%
Simple meaning: BCH is red in almost all. In 7 Days it fell -20.90%. In 1 Year it fell -58.29%.
If someone bought 1 year ago for 100 Rupees, now it is only 41 Rupees left. Very big loss.
BCH is the old brother of Bitcoin, but right now it is very weak.
$BCH is not a pump coin. It is a slow, old coin. Right now it is falling.
Buying now at 204.4 is risky because it is below MA60 and it is near its low.
Support.
195.7 This is the 24h Low. If it breaks this, it will go more down to 190 or 185.
Resistance: 205.1 This is MA60. If price goes above this and stays there, then it will be safe to buy again. Next target will be 218.2.
Don't catch a falling knife. Wait for it to come above 205.1.
#WhatWillDriveCryptoandStocks’NextRebound?
$BCH / USDT
1. Current Price
Price: 204.4 USDT
In Rupees: Rs 56,524.77
Today: -5.02% DOWN
1 BCH = 56 Thousand 524 Rupees.
2. Last 24 Hours
24h High: 218.2
24h Low: 195.7
24h Volume BCH: 43,341.95
24h Volume USDT: 8.88M
Volume is good. 8.88 Million dollars trading. This is a big, old coin, not a new small coin.
3. What Does The Chart Show
Look at the chart carefully. Price is falling.
Price was near 205.3, then it tried to go up 2-3 times to 205.0 and 205.2, but every time sellers pushed it down. At the end, it fell down to 204.1, then made a small bounce to 204.4.
The black line MA60 = 205.1. Price 204.4 is BELOW that line. That means sellers are winning now. Price is under the line. This is a weak sign.
At the bottom, you see one big green bar. That was one big buy. After that, volume is very low. No big buying, no big selling. Market is slow.
This is called a Downtrend. Lower high, lower low. Price is making a staircase going down.
4. Past Performance
Today: -1.40%
7 Days: -20.90%
30 Days: -26.58%
90 Days: +0.34%
180 Days: -44.96%
1 Year: -58.29%
Simple meaning: BCH is red in almost all. In 7 Days it fell -20.90%. In 1 Year it fell -58.29%.
If someone bought 1 year ago for 100 Rupees, now it is only 41 Rupees left. Very big loss.
BCH is the old brother of Bitcoin, but right now it is very weak.
$BCH is not a pump coin. It is a slow, old coin. Right now it is falling.
Buying now at 204.4 is risky because it is below MA60 and it is near its low.
Support.
195.7 This is the 24h Low. If it breaks this, it will go more down to 190 or 185.
Resistance: 205.1 This is MA60. If price goes above this and stays there, then it will be safe to buy again. Next target will be 218.2.
Don't catch a falling knife. Wait for it to come above 205.1.
#WhatWillDriveCryptoandStocks’NextRebound?
1. Current Price
Price: 204.4 USDT
In Rupees: Rs 56,524.77
Today: -5.02% DOWN
1 BCH = 56 Thousand 524 Rupees.
2. Last 24 Hours
24h High: 218.2
24h Low: 195.7
24h Volume BCH: 43,341.95
24h Volume USDT: 8.88M
Volume is good. 8.88 Million dollars trading. This is a big, old coin, not a new small coin.
3. What Does The Chart Show
Look at the chart carefully. Price is falling.
Price was near 205.3, then it tried to go up 2-3 times to 205.0 and 205.2, but every time sellers pushed it down. At the end, it fell down to 204.1, then made a small bounce to 204.4.
The black line MA60 = 205.1. Price 204.4 is BELOW that line. That means sellers are winning now. Price is under the line. This is a weak sign.
At the bottom, you see one big green bar. That was one big buy. After that, volume is very low. No big buying, no big selling. Market is slow.
This is called a Downtrend. Lower high, lower low. Price is making a staircase going down.
4. Past Performance
Today: -1.40%
7 Days: -20.90%
30 Days: -26.58%
90 Days: +0.34%
180 Days: -44.96%
1 Year: -58.29%
Simple meaning: BCH is red in almost all. In 7 Days it fell -20.90%. In 1 Year it fell -58.29%.
If someone bought 1 year ago for 100 Rupees, now it is only 41 Rupees left. Very big loss.
BCH is the old brother of Bitcoin, but right now it is very weak.
$BCH is not a pump coin. It is a slow, old coin. Right now it is falling.
Buying now at 204.4 is risky because it is below MA60 and it is near its low.
Support.
195.7 This is the 24h Low. If it breaks this, it will go more down to 190 or 185.
Resistance: 205.1 This is MA60. If price goes above this and stays there, then it will be safe to buy again. Next target will be 218.2.
Don't catch a falling knife. Wait for it to come above 205.1.
#WhatWillDriveCryptoandStocks’NextRebound?
1
126
·
--
Article
SKDDB/USDT$SKDDB / USDT
This is NOT a normal coin. This is a bStocks Leveraged Short Stock Token. Read this carefully, it is very important.
1. What Is This Token
Full Name: GraniteShares 2x Short SK Hynix
SK Hynix is a big Korean company that makes chips / memory.
2x Short means:
If SK Hynix stock falls by 1%, this token goes UP by 2%.
If SK Hynix stock goes UP by 1%, this token goes DOWN by 2%.
So this token makes profit when the real company falls down. It is opposite.
2. Current Price
Price: 10.73 USDTIn Rupees: Rs 2,967.48
Today on Binance: +3.57% UP
Real Stock: SKDD $10.28 +8.78%
1 SKDDB = 2,967 Rupees.
3. Last 24 Hours
24h High: 10.93
24h Low: 10.19
24h Volume SKDDB: 3,974.83
24h Volume USDT: 41,921.32
Volume is very low. Only 41k dollars. This is a new, small token. Not many people trade it.
4. What Does The Chart Show
Look at the chart carefully. This is a very strange chart.
Price was flat near 10.86, then it went up to 10.88, then suddenly it fell down in one straight line like a cliff to 10.73, and then it became completely flat. No up, no down. Just a straight line.
Why? Because:
1. The US / Korea stock market closed, so price stopped moving.
2. There is no buyer / seller, so price is stuck.
The black line MA60 = 10.82. Price 10.73 is BELOW that line. That means it is slightly weak right now.
At the bottom, you see one big green bar, then one red bar, then nothing. That was the last trade. After that, volume is zero.
5. Past Performance
Today: +2.78%
7 Days: -8.45%
30 Days:
90 Days:
180 Days:
1 Year:
Because this token is New on Binance. It has no old history.
Today it is +2.78% UP, but 7 Days it is -8.45% DOWN. That means last week it was falling, today it made a small recovery.
This is a very risky token. Do NOT hold it for long time. Leveraged 2x Short tokens lose value every day because of fees and rebalancing. It is only for 1-day short-term trading.
If you think SK Hynix will fall tomorrow, then this token will go up. If you think SK Hynix will go up, then sell this token now.
Support:10.19 This was the 24h Low. If it breaks this, it will fall more.
Resistance:10.82 This is MA60. If price goes above this and stays there, then it is safe.
#WhoWillSucceedJensenHuangatNvidia?
SKDDB/USDT
$SKDDB / USDT
This is NOT a normal coin. This is a bStocks Leveraged Short Stock Token. Read this carefully, it is very important.
1. What Is This Token
Full Name: GraniteShares 2x Short SK Hynix
SK Hynix is a big Korean company that makes chips / memory.
2x Short means:
If SK Hynix stock falls by 1%, this token goes UP by 2%.
If SK Hynix stock goes UP by 1%, this token goes DOWN by 2%.
So this token makes profit when the real company falls down. It is opposite.
2. Current Price
Price: 10.73 USDTIn Rupees: Rs 2,967.48
Today on Binance: +3.57% UP
Real Stock: SKDD $10.28 +8.78%
1 SKDDB = 2,967 Rupees.
3. Last 24 Hours
24h High: 10.93
24h Low: 10.19
24h Volume SKDDB: 3,974.83
24h Volume USDT: 41,921.32
Volume is very low. Only 41k dollars. This is a new, small token. Not many people trade it.
4. What Does The Chart Show
Look at the chart carefully. This is a very strange chart.
Price was flat near 10.86, then it went up to 10.88, then suddenly it fell down in one straight line like a cliff to 10.73, and then it became completely flat. No up, no down. Just a straight line.
Why? Because:
1. The US / Korea stock market closed, so price stopped moving.
2. There is no buyer / seller, so price is stuck.
The black line MA60 = 10.82. Price 10.73 is BELOW that line. That means it is slightly weak right now.
At the bottom, you see one big green bar, then one red bar, then nothing. That was the last trade. After that, volume is zero.
5. Past Performance
Today: +2.78%
7 Days: -8.45%
30 Days:
90 Days:
180 Days:
1 Year:
Because this token is New on Binance. It has no old history.
Today it is +2.78% UP, but 7 Days it is -8.45% DOWN. That means last week it was falling, today it made a small recovery.
This is a very risky token. Do NOT hold it for long time. Leveraged 2x Short tokens lose value every day because of fees and rebalancing. It is only for 1-day short-term trading.
If you think SK Hynix will fall tomorrow, then this token will go up. If you think SK Hynix will go up, then sell this token now.
Support:10.19 This was the 24h Low. If it breaks this, it will fall more.
Resistance:10.82 This is MA60. If price goes above this and stays there, then it is safe.
#WhoWillSucceedJensenHuangatNvidia?
This is NOT a normal coin. This is a bStocks Leveraged Short Stock Token. Read this carefully, it is very important.
1. What Is This Token
Full Name: GraniteShares 2x Short SK Hynix
SK Hynix is a big Korean company that makes chips / memory.
2x Short means:
If SK Hynix stock falls by 1%, this token goes UP by 2%.
If SK Hynix stock goes UP by 1%, this token goes DOWN by 2%.
So this token makes profit when the real company falls down. It is opposite.
2. Current Price
Price: 10.73 USDTIn Rupees: Rs 2,967.48
Today on Binance: +3.57% UP
Real Stock: SKDD $10.28 +8.78%
1 SKDDB = 2,967 Rupees.
3. Last 24 Hours
24h High: 10.93
24h Low: 10.19
24h Volume SKDDB: 3,974.83
24h Volume USDT: 41,921.32
Volume is very low. Only 41k dollars. This is a new, small token. Not many people trade it.
4. What Does The Chart Show
Look at the chart carefully. This is a very strange chart.
Price was flat near 10.86, then it went up to 10.88, then suddenly it fell down in one straight line like a cliff to 10.73, and then it became completely flat. No up, no down. Just a straight line.
Why? Because:
1. The US / Korea stock market closed, so price stopped moving.
2. There is no buyer / seller, so price is stuck.
The black line MA60 = 10.82. Price 10.73 is BELOW that line. That means it is slightly weak right now.
At the bottom, you see one big green bar, then one red bar, then nothing. That was the last trade. After that, volume is zero.
5. Past Performance
Today: +2.78%
7 Days: -8.45%
30 Days:
90 Days:
180 Days:
1 Year:
Because this token is New on Binance. It has no old history.
Today it is +2.78% UP, but 7 Days it is -8.45% DOWN. That means last week it was falling, today it made a small recovery.
This is a very risky token. Do NOT hold it for long time. Leveraged 2x Short tokens lose value every day because of fees and rebalancing. It is only for 1-day short-term trading.
If you think SK Hynix will fall tomorrow, then this token will go up. If you think SK Hynix will go up, then sell this token now.
Support:10.19 This was the 24h Low. If it breaks this, it will fall more.
Resistance:10.82 This is MA60. If price goes above this and stays there, then it is safe.
#WhoWillSucceedJensenHuangatNvidia?
1
142
·
--
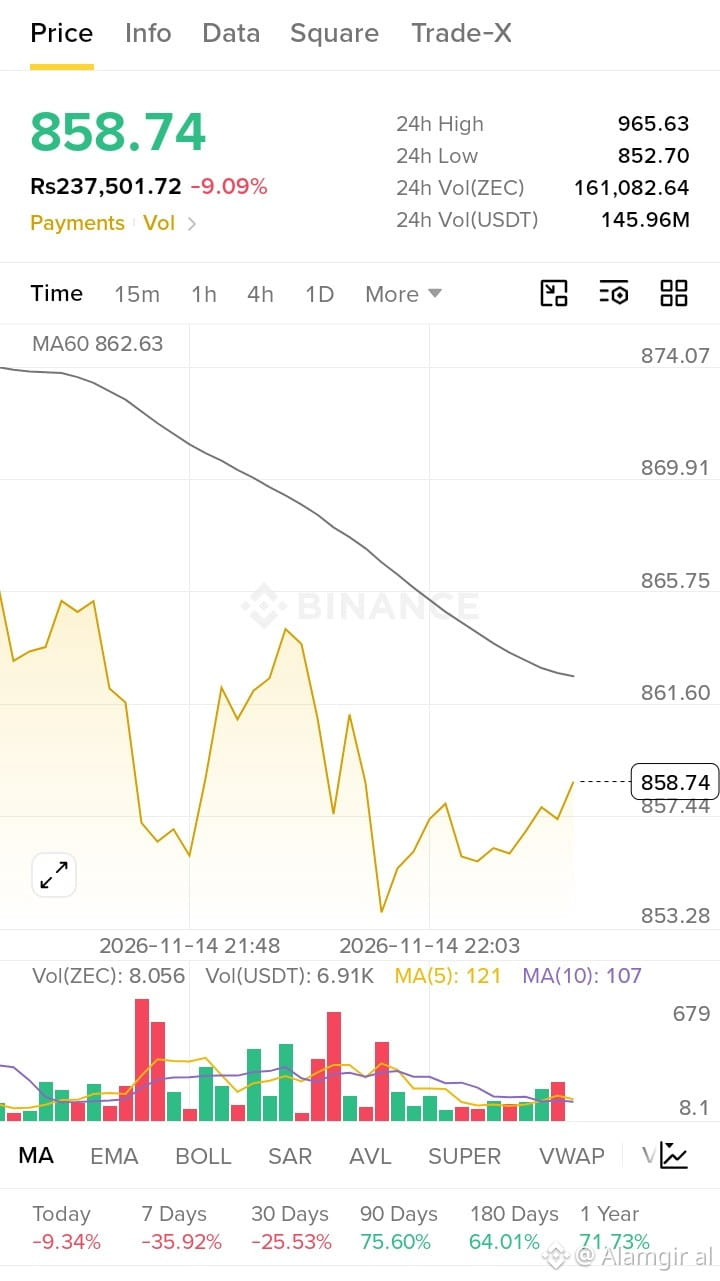
ZEC / USDT
1. Current Price
Price: 858.74 USDT
In Rupees: Rs 237,501.72
Today: -9.09% DOWN
1 ZEC = 2 Lakh 37 Thousand Rupees.
2. Last 24 Hours
24h High: 965.63
24h Low: 852.70
24h Volume ZEC: 161,082.64
24h Volume USDT: 145.96M
Volume is huge. 145 Million dollars. This means a lot of people are buying and selling $ZEC right now. This is a very active coin.
3. What Does The Chart Show
Look at the chart carefully. Price is falling like stairs.
It was near 874, then it fell to 865, then to 861, then to 853. Every time it tried to go up, sellers pushed it back down.
The black line MA60 = 862.63. Price 858.74 is BELOW that line. That means sellers are winning.
But at the right side, price is making a small bounce from 853 to 858.74. That is a small green recovery. Buyers are trying to come back.
At the bottom, you see red bars and green bars. Red = selling, Green = buying. Right now both are fighting.
This is called a Correction. $ZEC went up too fast before, now it is taking a rest and coming down.
4. Past Performance
Today: -9.34%
7 Days: -35.92%
30 Days: -25.53%
90 Days: +75.60%
180 Days: +64.01%
1 Year: +71.73%
Simple meaning: Short-term it is DOWN badly. In 7 Days it fell -35%. That is a big loss.
But long-term it is still UP. In 1 Year it is +71%. So if someone bought 1 year ago for 100 Rupees, now it is 171 Rupees. Still profit.
$ZEC is a fast, volatile coin. It moves very fast up and down. Not for beginners.
Right now it is in a downtrend.
Support (If it falls):852.70 This is the 24h Low. If it breaks this, it will go to 820 or 800.
Resistance (If it goes up):862.63 This is MA60. If price goes above this and stays there, then it is safe to buy. Next target will be 965.63.
Don't catch a falling knife. Wait for price to come above 862.63.
#WhoWillSucceedJensenHuangatNvidia?
ZEC / USDT
1. Current Price
Price: 858.74 USDT
In Rupees: Rs 237,501.72
Today: -9.09% DOWN
1 ZEC = 2 Lakh 37 Thousand Rupees.
2. Last 24 Hours
24h High: 965.63
24h Low: 852.70
24h Volume ZEC: 161,082.64
24h Volume USDT: 145.96M
Volume is huge. 145 Million dollars. This means a lot of people are buying and selling $ZEC right now. This is a very active coin.
3. What Does The Chart Show
Look at the chart carefully. Price is falling like stairs.
It was near 874, then it fell to 865, then to 861, then to 853. Every time it tried to go up, sellers pushed it back down.
The black line MA60 = 862.63. Price 858.74 is BELOW that line. That means sellers are winning.
But at the right side, price is making a small bounce from 853 to 858.74. That is a small green recovery. Buyers are trying to come back.
At the bottom, you see red bars and green bars. Red = selling, Green = buying. Right now both are fighting.
This is called a Correction. $ZEC went up too fast before, now it is taking a rest and coming down.
4. Past Performance
Today: -9.34%
7 Days: -35.92%
30 Days: -25.53%
90 Days: +75.60%
180 Days: +64.01%
1 Year: +71.73%
Simple meaning: Short-term it is DOWN badly. In 7 Days it fell -35%. That is a big loss.
But long-term it is still UP. In 1 Year it is +71%. So if someone bought 1 year ago for 100 Rupees, now it is 171 Rupees. Still profit.
$ZEC is a fast, volatile coin. It moves very fast up and down. Not for beginners.
Right now it is in a downtrend.
Support (If it falls):852.70 This is the 24h Low. If it breaks this, it will go to 820 or 800.
Resistance (If it goes up):862.63 This is MA60. If price goes above this and stays there, then it is safe to buy. Next target will be 965.63.
Don't catch a falling knife. Wait for price to come above 862.63.
#WhoWillSucceedJensenHuangatNvidia?
1. Current Price
Price: 858.74 USDT
In Rupees: Rs 237,501.72
Today: -9.09% DOWN
1 ZEC = 2 Lakh 37 Thousand Rupees.
2. Last 24 Hours
24h High: 965.63
24h Low: 852.70
24h Volume ZEC: 161,082.64
24h Volume USDT: 145.96M
Volume is huge. 145 Million dollars. This means a lot of people are buying and selling $ZEC right now. This is a very active coin.
3. What Does The Chart Show
Look at the chart carefully. Price is falling like stairs.
It was near 874, then it fell to 865, then to 861, then to 853. Every time it tried to go up, sellers pushed it back down.
The black line MA60 = 862.63. Price 858.74 is BELOW that line. That means sellers are winning.
But at the right side, price is making a small bounce from 853 to 858.74. That is a small green recovery. Buyers are trying to come back.
At the bottom, you see red bars and green bars. Red = selling, Green = buying. Right now both are fighting.
This is called a Correction. $ZEC went up too fast before, now it is taking a rest and coming down.
4. Past Performance
Today: -9.34%
7 Days: -35.92%
30 Days: -25.53%
90 Days: +75.60%
180 Days: +64.01%
1 Year: +71.73%
Simple meaning: Short-term it is DOWN badly. In 7 Days it fell -35%. That is a big loss.
But long-term it is still UP. In 1 Year it is +71%. So if someone bought 1 year ago for 100 Rupees, now it is 171 Rupees. Still profit.
$ZEC is a fast, volatile coin. It moves very fast up and down. Not for beginners.
Right now it is in a downtrend.
Support (If it falls):852.70 This is the 24h Low. If it breaks this, it will go to 820 or 800.
Resistance (If it goes up):862.63 This is MA60. If price goes above this and stays there, then it is safe to buy. Next target will be 965.63.
Don't catch a falling knife. Wait for price to come above 862.63.
#WhoWillSucceedJensenHuangatNvidia?
1
531
·
--
APPB / USDT
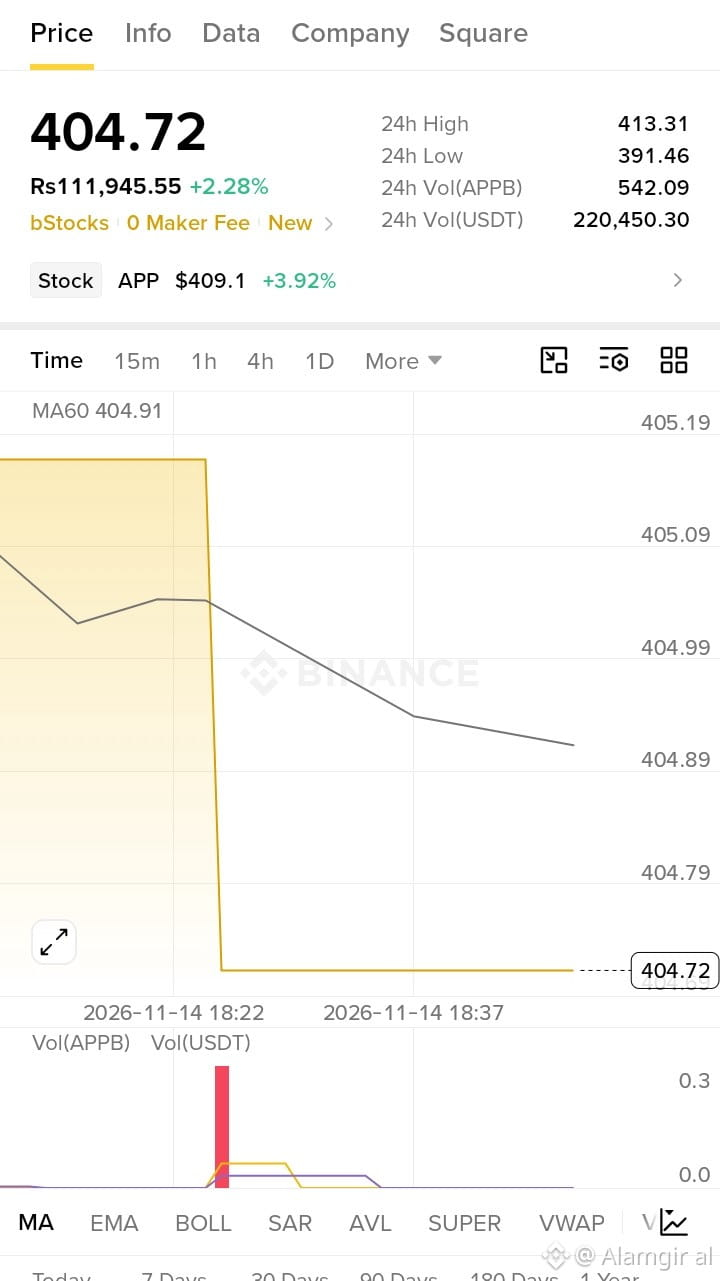
This is not a crypto coin. This is a Stock Token. It follows the real US stock APP - AppLovin.
1. Current Price
Price: 404.72 USDT
In Rupees: Rs 111,945.55
Today on Binance: +2.28% UP
Real Stock Price: APP $409.1 +3.92%
1 APPB = 1 Lakh 11 Thousand Rupees. Very expensive token.
2. Last 24 Hours
24h High: 413.31
24h Low: 391.46
24h Volume APPB: 542.09
24h Volume USDT: 220,450.30
Volume is low. Only 220k dollars. Because this is a new bStocks token, not many people trade it on Binance.
3. What Does The Chart Show
Look at the chart carefully. This is the most important part.
Price was flat near 405.19, then suddenly it fell down in one straight line like a cliff to 404.72, and then it became completely flat. No up, no down. Just a straight line.
This is not a normal crypto chart. This happened because:
1. The US stock market closed, so the price stopped moving.
2. Or there is no buyer / seller at this time, so price is stuck.
The black line MA60 = 404.91. Price 404.72 is just BELOW that line. Only a little below. That means it is slightly weak, but not a big dump.
At the bottom, you see one big red bar. That was the one big sell. After that, volume is zero. No trading.
4. Past Performance
Today: -1.25%
7 Days: +3.10%
30 Days:
90 Days:
180 Days:
1 Year:
Why -- ? Because this bStocks token is New on Binance. It has no old history. The 7 Days data is only +3.10%, that means the real stock is stable and slowly going up.
APPB is a safe, slow stock token. It is not like ADA or SXT that pump and dump.
It is good for long-term holding, not for short-term trading, because volume is very low and price does not move much when US market is closed.
If you want to buy, wait for the US market to open. Then price will move with the real APP stock.
Safe Entry: Above 404.91 (MA60)
Support:391.46 This was the 24h Low. If it breaks this, it will fall more.
APPB / USDT
This is not a crypto coin. This is a Stock Token. It follows the real US stock APP - AppLovin.
1. Current Price
Price: 404.72 USDT
In Rupees: Rs 111,945.55
Today on Binance: +2.28% UP
Real Stock Price: APP $409.1 +3.92%
1 APPB = 1 Lakh 11 Thousand Rupees. Very expensive token.
2. Last 24 Hours
24h High: 413.31
24h Low: 391.46
24h Volume APPB: 542.09
24h Volume USDT: 220,450.30
Volume is low. Only 220k dollars. Because this is a new bStocks token, not many people trade it on Binance.
3. What Does The Chart Show
Look at the chart carefully. This is the most important part.
Price was flat near 405.19, then suddenly it fell down in one straight line like a cliff to 404.72, and then it became completely flat. No up, no down. Just a straight line.
This is not a normal crypto chart. This happened because:
1. The US stock market closed, so the price stopped moving.
2. Or there is no buyer / seller at this time, so price is stuck.
The black line MA60 = 404.91. Price 404.72 is just BELOW that line. Only a little below. That means it is slightly weak, but not a big dump.
At the bottom, you see one big red bar. That was the one big sell. After that, volume is zero. No trading.
4. Past Performance
Today: -1.25%
7 Days: +3.10%
30 Days:
90 Days:
180 Days:
1 Year:
Why -- ? Because this bStocks token is New on Binance. It has no old history. The 7 Days data is only +3.10%, that means the real stock is stable and slowly going up.
APPB is a safe, slow stock token. It is not like ADA or SXT that pump and dump.
It is good for long-term holding, not for short-term trading, because volume is very low and price does not move much when US market is closed.
If you want to buy, wait for the US market to open. Then price will move with the real APP stock.
Safe Entry: Above 404.91 (MA60)
Support:391.46 This was the 24h Low. If it breaks this, it will fall more.
This is not a crypto coin. This is a Stock Token. It follows the real US stock APP - AppLovin.
1. Current Price
Price: 404.72 USDT
In Rupees: Rs 111,945.55
Today on Binance: +2.28% UP
Real Stock Price: APP $409.1 +3.92%
1 APPB = 1 Lakh 11 Thousand Rupees. Very expensive token.
2. Last 24 Hours
24h High: 413.31
24h Low: 391.46
24h Volume APPB: 542.09
24h Volume USDT: 220,450.30
Volume is low. Only 220k dollars. Because this is a new bStocks token, not many people trade it on Binance.
3. What Does The Chart Show
Look at the chart carefully. This is the most important part.
Price was flat near 405.19, then suddenly it fell down in one straight line like a cliff to 404.72, and then it became completely flat. No up, no down. Just a straight line.
This is not a normal crypto chart. This happened because:
1. The US stock market closed, so the price stopped moving.
2. Or there is no buyer / seller at this time, so price is stuck.
The black line MA60 = 404.91. Price 404.72 is just BELOW that line. Only a little below. That means it is slightly weak, but not a big dump.
At the bottom, you see one big red bar. That was the one big sell. After that, volume is zero. No trading.
4. Past Performance
Today: -1.25%
7 Days: +3.10%
30 Days:
90 Days:
180 Days:
1 Year:
Why -- ? Because this bStocks token is New on Binance. It has no old history. The 7 Days data is only +3.10%, that means the real stock is stable and slowly going up.
APPB is a safe, slow stock token. It is not like ADA or SXT that pump and dump.
It is good for long-term holding, not for short-term trading, because volume is very low and price does not move much when US market is closed.
If you want to buy, wait for the US market to open. Then price will move with the real APP stock.
Safe Entry: Above 404.91 (MA60)
Support:391.46 This was the 24h Low. If it breaks this, it will fall more.
1
1
211
·
--
BARD / USDT - Futures Trade
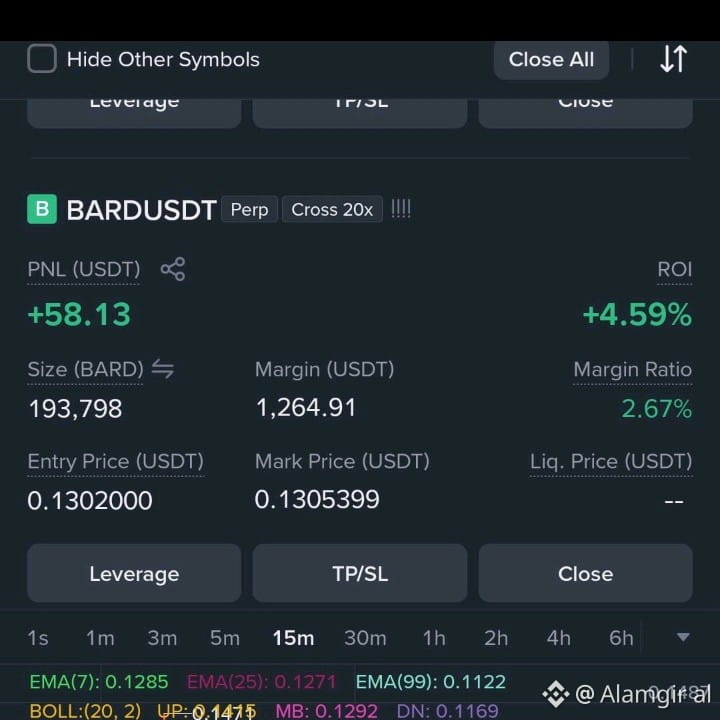
1. Your Position
Coin: BARDUSDT Perp
Leverage: Cross 20x
Position: LONG Because your Entry is lower than Mark Price and your PNL is Green, it means you bought for UP.
2. Your Profit Right Now
PNL: +58.13 USDT
ROI: +4.59%
That means you are in PROFIT. Good trade.
3. Entry and Current Price
Entry Price: 0.1302000
Mark Price (Current): 0.1305399
Difference: Only +0.00034 up. Very small move up, but because you used 20x leverage and a big size, your profit became 58 USDT.
Size: 193,798 BARD
Margin Used: 1,264.91 USDT
Margin Ratio: 2.67% This is very low and safe. No liquidation danger right now.
Liq. Price: Because you are on Cross margin, it is not showing. Your liquidation is far away.
4. What Do The Indicators Show
EMA(7): 0.1285
EMA(25): 0.1271
EMA(99): 0.1122
Price 0.1305 is ABOVE all 3 EMAs. This is a BULLISH sign. Price is above all averages, buyers are strong.
BOLL: UP 0.1475, MB 0.1292, DN 0.1169
Price 0.1305 is just above Middle Line 0.1292. That means it just broke up from the middle. If it stays above 0.1292, it can go to 0.1475.
If it falls below 0.1292 again, it will go down to 0.1169.
SUPERTREND: 0.1382
Price is still BELOW Supertrend 0.1382. That means the big trend is still not fully bullish. Supertrend is still showing resistance at 0.1382.
Your trade is in profit, but it is a very small profit. Price is stuck between 0.1292 support and 0.1382 resistance.
What to do now
1. If you want safe profit, put your Stop Loss at 0.1292 your entry. Then you will not lose.
2. Your first Target is 0.1382 Supertrend. If price breaks that, it will go fast to 0.1475.
3. Don't close now for 58 USDT. The setup is still good, price is above all EMAs. Just protect your trade.
Do you want me to tell you where to put TP/SL for this BARD trade?
BARD / USDT - Futures Trade
1. Your Position
Coin: BARDUSDT Perp
Leverage: Cross 20x
Position: LONG Because your Entry is lower than Mark Price and your PNL is Green, it means you bought for UP.
2. Your Profit Right Now
PNL: +58.13 USDT
ROI: +4.59%
That means you are in PROFIT. Good trade.
3. Entry and Current Price
Entry Price: 0.1302000
Mark Price (Current): 0.1305399
Difference: Only +0.00034 up. Very small move up, but because you used 20x leverage and a big size, your profit became 58 USDT.
Size: 193,798 BARD
Margin Used: 1,264.91 USDT
Margin Ratio: 2.67% This is very low and safe. No liquidation danger right now.
Liq. Price: Because you are on Cross margin, it is not showing. Your liquidation is far away.
4. What Do The Indicators Show
EMA(7): 0.1285
EMA(25): 0.1271
EMA(99): 0.1122
Price 0.1305 is ABOVE all 3 EMAs. This is a BULLISH sign. Price is above all averages, buyers are strong.
BOLL: UP 0.1475, MB 0.1292, DN 0.1169
Price 0.1305 is just above Middle Line 0.1292. That means it just broke up from the middle. If it stays above 0.1292, it can go to 0.1475.
If it falls below 0.1292 again, it will go down to 0.1169.
SUPERTREND: 0.1382
Price is still BELOW Supertrend 0.1382. That means the big trend is still not fully bullish. Supertrend is still showing resistance at 0.1382.
Your trade is in profit, but it is a very small profit. Price is stuck between 0.1292 support and 0.1382 resistance.
What to do now
1. If you want safe profit, put your Stop Loss at 0.1292 your entry. Then you will not lose.
2. Your first Target is 0.1382 Supertrend. If price breaks that, it will go fast to 0.1475.
3. Don't close now for 58 USDT. The setup is still good, price is above all EMAs. Just protect your trade.
Do you want me to tell you where to put TP/SL for this BARD trade?
1. Your Position
Coin: BARDUSDT Perp
Leverage: Cross 20x
Position: LONG Because your Entry is lower than Mark Price and your PNL is Green, it means you bought for UP.
2. Your Profit Right Now
PNL: +58.13 USDT
ROI: +4.59%
That means you are in PROFIT. Good trade.
3. Entry and Current Price
Entry Price: 0.1302000
Mark Price (Current): 0.1305399
Difference: Only +0.00034 up. Very small move up, but because you used 20x leverage and a big size, your profit became 58 USDT.
Size: 193,798 BARD
Margin Used: 1,264.91 USDT
Margin Ratio: 2.67% This is very low and safe. No liquidation danger right now.
Liq. Price: Because you are on Cross margin, it is not showing. Your liquidation is far away.
4. What Do The Indicators Show
EMA(7): 0.1285
EMA(25): 0.1271
EMA(99): 0.1122
Price 0.1305 is ABOVE all 3 EMAs. This is a BULLISH sign. Price is above all averages, buyers are strong.
BOLL: UP 0.1475, MB 0.1292, DN 0.1169
Price 0.1305 is just above Middle Line 0.1292. That means it just broke up from the middle. If it stays above 0.1292, it can go to 0.1475.
If it falls below 0.1292 again, it will go down to 0.1169.
SUPERTREND: 0.1382
Price is still BELOW Supertrend 0.1382. That means the big trend is still not fully bullish. Supertrend is still showing resistance at 0.1382.
Your trade is in profit, but it is a very small profit. Price is stuck between 0.1292 support and 0.1382 resistance.
What to do now
1. If you want safe profit, put your Stop Loss at 0.1292 your entry. Then you will not lose.
2. Your first Target is 0.1382 Supertrend. If price breaks that, it will go fast to 0.1475.
3. Don't close now for 58 USDT. The setup is still good, price is above all EMAs. Just protect your trade.
Do you want me to tell you where to put TP/SL for this BARD trade?
1
64
·
--
ADA / USDT
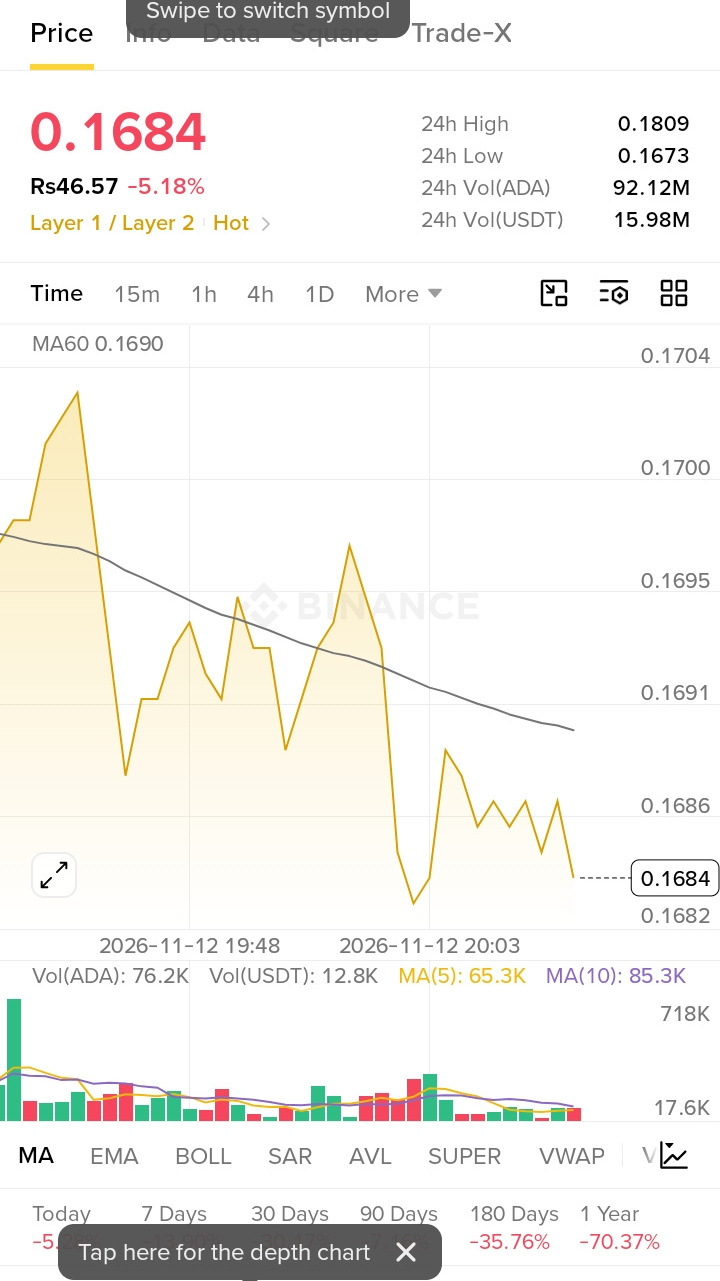
1. Current Price
Price: 0.1684 USDT
In Rupees: Rs 46.57
Today: -5.18% DOWN
1 ADA = 46 Rupees 57 Paisa.
2. Last 24 Hours
24h High: 0.1809
24h Low: 0.1673
24h Volume ADA: 92.12M
24h Volume USDT: 15.98M
Volume is good. 15.98 Million dollars trading. This is a big coin, not a small pump coin like SXT.
3. What Does The Chart Show?l
Look at the chart carefully. This is a DOWN chart, opposite of ERA.
Price was high near 0.1704, then it fell down very fast, then it tried to go up 2-3 times, but every time it went up, sellers pushed it down again. Now it is at the bottom near 0.1684.
The black line MA60 = *0.1690*. Price 0.1684 is *BELOW* that line. That means sellers are winning now. Price is under the line. This is a weak sign.
At the bottom, you see red bars. Red means selling is more than buying.
This is called a Downtrend. Lower high, lower low. Price is making a staircase going down.
4. Past Performance
Today: -5.18% 180 Days: -35.76%
1 Year: -70.37%
Simple meaning: ADA is red in long-term. In 1 Year it is -70.37% DOWN. If someone bought 1 year ago for 100 Rupees, now it is only 29 Rupees left. Very big loss.
Cardano is a very famous coin, Layer 1, but right now the whole market is down, so ADA is also down.
ADA is not a pump coin. It is a slow, big coin. Right now it is falling. Buying now at 0.1684 is risky because it is below MA60 and it is near its 24h Low 0.1673.
If it breaks 0.1673, it will go more down to 0.1650 or 0.1600.
If you want to buy, wait for it to come back above 0.1690 and stay there. That will be a safe entry. Don't catch a falling knife.
Did you buy ADA already? Tell me your buying price, I will tell you if you should hold or sell and wait.
ADA / USDT
1. Current Price
Price: 0.1684 USDT
In Rupees: Rs 46.57
Today: -5.18% DOWN
1 ADA = 46 Rupees 57 Paisa.
2. Last 24 Hours
24h High: 0.1809
24h Low: 0.1673
24h Volume ADA: 92.12M
24h Volume USDT: 15.98M
Volume is good. 15.98 Million dollars trading. This is a big coin, not a small pump coin like SXT.
3. What Does The Chart Show?l
Look at the chart carefully. This is a DOWN chart, opposite of ERA.
Price was high near 0.1704, then it fell down very fast, then it tried to go up 2-3 times, but every time it went up, sellers pushed it down again. Now it is at the bottom near 0.1684.
The black line MA60 = *0.1690*. Price 0.1684 is *BELOW* that line. That means sellers are winning now. Price is under the line. This is a weak sign.
At the bottom, you see red bars. Red means selling is more than buying.
This is called a Downtrend. Lower high, lower low. Price is making a staircase going down.
4. Past Performance
Today: -5.18% 180 Days: -35.76%
1 Year: -70.37%
Simple meaning: ADA is red in long-term. In 1 Year it is -70.37% DOWN. If someone bought 1 year ago for 100 Rupees, now it is only 29 Rupees left. Very big loss.
Cardano is a very famous coin, Layer 1, but right now the whole market is down, so ADA is also down.
ADA is not a pump coin. It is a slow, big coin. Right now it is falling. Buying now at 0.1684 is risky because it is below MA60 and it is near its 24h Low 0.1673.
If it breaks 0.1673, it will go more down to 0.1650 or 0.1600.
If you want to buy, wait for it to come back above 0.1690 and stay there. That will be a safe entry. Don't catch a falling knife.
Did you buy ADA already? Tell me your buying price, I will tell you if you should hold or sell and wait.
1. Current Price
Price: 0.1684 USDT
In Rupees: Rs 46.57
Today: -5.18% DOWN
1 ADA = 46 Rupees 57 Paisa.
2. Last 24 Hours
24h High: 0.1809
24h Low: 0.1673
24h Volume ADA: 92.12M
24h Volume USDT: 15.98M
Volume is good. 15.98 Million dollars trading. This is a big coin, not a small pump coin like SXT.
3. What Does The Chart Show?l
Look at the chart carefully. This is a DOWN chart, opposite of ERA.
Price was high near 0.1704, then it fell down very fast, then it tried to go up 2-3 times, but every time it went up, sellers pushed it down again. Now it is at the bottom near 0.1684.
The black line MA60 = *0.1690*. Price 0.1684 is *BELOW* that line. That means sellers are winning now. Price is under the line. This is a weak sign.
At the bottom, you see red bars. Red means selling is more than buying.
This is called a Downtrend. Lower high, lower low. Price is making a staircase going down.
4. Past Performance
Today: -5.18% 180 Days: -35.76%
1 Year: -70.37%
Simple meaning: ADA is red in long-term. In 1 Year it is -70.37% DOWN. If someone bought 1 year ago for 100 Rupees, now it is only 29 Rupees left. Very big loss.
Cardano is a very famous coin, Layer 1, but right now the whole market is down, so ADA is also down.
ADA is not a pump coin. It is a slow, big coin. Right now it is falling. Buying now at 0.1684 is risky because it is below MA60 and it is near its 24h Low 0.1673.
If it breaks 0.1673, it will go more down to 0.1650 or 0.1600.
If you want to buy, wait for it to come back above 0.1690 and stay there. That will be a safe entry. Don't catch a falling knife.
Did you buy ADA already? Tell me your buying price, I will tell you if you should hold or sell and wait.
1
70
·
--
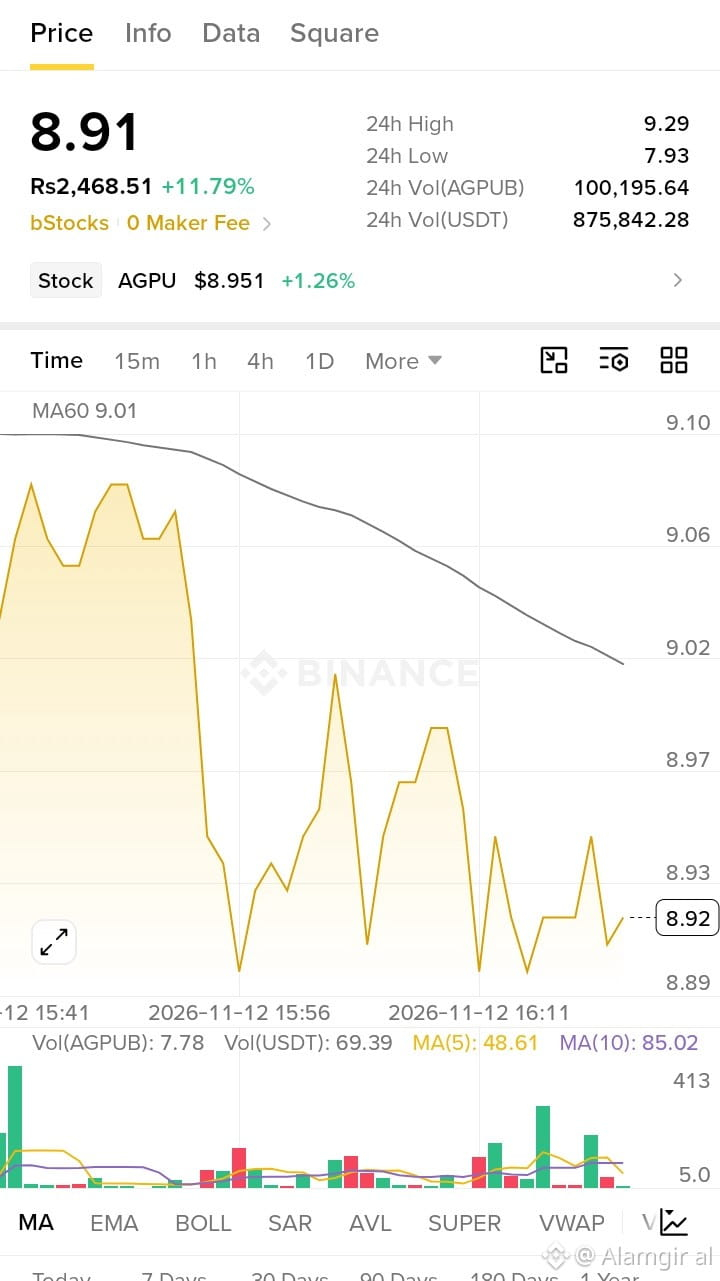
Support 1 $8.90
Support 2 $8.89
Lower support $8.80
3. Possible scenarios
If AGPUB breaks $9.02 and holds above it, the next possible targets are $9.10 and $9.29.
If the price breaks below $8.89, it could move towards $8.80.
4. My opinion
AGPUB has a strong daily gain, but its short-term chart is showing weakness. I would wait for confirmation above $9.02 rather than chase the price.
One question: Have you already bought AGPUB, or are you planning to buy?
I can help calculate entry price, stop-loss and take-profit levels.
Support 1 $8.90
Support 2 $8.89
Lower support $8.80
3. Possible scenarios
If AGPUB breaks $9.02 and holds above it, the next possible targets are $9.10 and $9.29.
If the price breaks below $8.89, it could move towards $8.80.
4. My opinion
AGPUB has a strong daily gain, but its short-term chart is showing weakness. I would wait for confirmation above $9.02 rather than chase the price.
One question: Have you already bought AGPUB, or are you planning to buy?
I can help calculate entry price, stop-loss and take-profit levels.
Support 2 $8.89
Lower support $8.80
3. Possible scenarios
If AGPUB breaks $9.02 and holds above it, the next possible targets are $9.10 and $9.29.
If the price breaks below $8.89, it could move towards $8.80.
4. My opinion
AGPUB has a strong daily gain, but its short-term chart is showing weakness. I would wait for confirmation above $9.02 rather than chase the price.
One question: Have you already bought AGPUB, or are you planning to buy?
I can help calculate entry price, stop-loss and take-profit levels.
1
56
·
--
Article
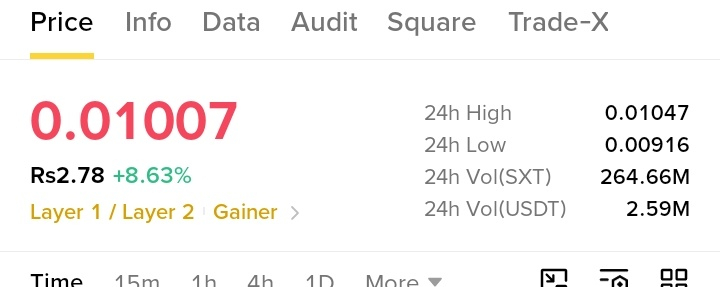
sxt SXT / USDT
1. Current Price
- Price: 0.01007 USDT
- In Rupees: Rs 2.78
- Today: +8.63% UP
1 SXT = 2 Rupees 78 Paisa. Very cheap coin.
2. Last 24 Hours
- 24h High: 0.01047
- 24h Low: 0.00916
- 24h Volume: 2.59M USDT
Volume is low. Only 2.59 Million dollars. That means not many big traders are here.
3. What Does The Chart Show?
Look at the chart carefully. This is the most important part.
Price was flat near 0.0100, then suddenly it pumped up very fast like a mountain to 0.01046, and then it fell down just as fast back to 0.01007.
This is called a Pump and Dump. Someone bought a lot, price went up, then they sold and price came down.
The black line MA60 = 0.01002. Price 0.01007 is just above that line. Only a little above. That means it is still holding, but it is very weak. If it goes below 0.01002, it will fall more.
At the bottom, you see big green and red bars together. That was the pump time. Now the bars are getting small. That means the pump is over, no energy left.
4. Past Performance
- Today: +3.70%
- 7 Days: +14.68%
- 30 Days: +7.58%
- 90 Days: +41.97%
- 180 Days: -22.04%
- 1 Year: -78.73%
Simple meaning: SXT is green in short-term, but in 1 Year it is -78.73% DOWN. That is a huge loss. If someone bought 1 year ago for 100 Rupees, now it is only 21 Rupees left.
So this coin is not strong in long-term. It only pumps for a short time, then dumps.
SXT is a Layer 1 / Layer 2 coin, but right now it is just a short pump. It already pumped and dumped. Buying now at 0.01007 is risky because the pump is already finished.
If you want to buy, wait for it to come down near 0.00986 - 0.00990, that was the old low. Don't chase the pump.
sxt
SXT / USDT
1. Current Price
- Price: 0.01007 USDT
- In Rupees: Rs 2.78
- Today: +8.63% UP
1 SXT = 2 Rupees 78 Paisa. Very cheap coin.
2. Last 24 Hours
- 24h High: 0.01047
- 24h Low: 0.00916
- 24h Volume: 2.59M USDT
Volume is low. Only 2.59 Million dollars. That means not many big traders are here.
3. What Does The Chart Show?
Look at the chart carefully. This is the most important part.
Price was flat near 0.0100, then suddenly it pumped up very fast like a mountain to 0.01046, and then it fell down just as fast back to 0.01007.
This is called a Pump and Dump. Someone bought a lot, price went up, then they sold and price came down.
The black line MA60 = 0.01002. Price 0.01007 is just above that line. Only a little above. That means it is still holding, but it is very weak. If it goes below 0.01002, it will fall more.
At the bottom, you see big green and red bars together. That was the pump time. Now the bars are getting small. That means the pump is over, no energy left.
4. Past Performance
- Today: +3.70%
- 7 Days: +14.68%
- 30 Days: +7.58%
- 90 Days: +41.97%
- 180 Days: -22.04%
- 1 Year: -78.73%
Simple meaning: SXT is green in short-term, but in 1 Year it is -78.73% DOWN. That is a huge loss. If someone bought 1 year ago for 100 Rupees, now it is only 21 Rupees left.
So this coin is not strong in long-term. It only pumps for a short time, then dumps.
SXT is a Layer 1 / Layer 2 coin, but right now it is just a short pump. It already pumped and dumped. Buying now at 0.01007 is risky because the pump is already finished.
If you want to buy, wait for it to come down near 0.00986 - 0.00990, that was the old low. Don't chase the pump.
1. Current Price
- Price: 0.01007 USDT
- In Rupees: Rs 2.78
- Today: +8.63% UP
1 SXT = 2 Rupees 78 Paisa. Very cheap coin.
2. Last 24 Hours
- 24h High: 0.01047
- 24h Low: 0.00916
- 24h Volume: 2.59M USDT
Volume is low. Only 2.59 Million dollars. That means not many big traders are here.
3. What Does The Chart Show?
Look at the chart carefully. This is the most important part.
Price was flat near 0.0100, then suddenly it pumped up very fast like a mountain to 0.01046, and then it fell down just as fast back to 0.01007.
This is called a Pump and Dump. Someone bought a lot, price went up, then they sold and price came down.
The black line MA60 = 0.01002. Price 0.01007 is just above that line. Only a little above. That means it is still holding, but it is very weak. If it goes below 0.01002, it will fall more.
At the bottom, you see big green and red bars together. That was the pump time. Now the bars are getting small. That means the pump is over, no energy left.
4. Past Performance
- Today: +3.70%
- 7 Days: +14.68%
- 30 Days: +7.58%
- 90 Days: +41.97%
- 180 Days: -22.04%
- 1 Year: -78.73%
Simple meaning: SXT is green in short-term, but in 1 Year it is -78.73% DOWN. That is a huge loss. If someone bought 1 year ago for 100 Rupees, now it is only 21 Rupees left.
So this coin is not strong in long-term. It only pumps for a short time, then dumps.
SXT is a Layer 1 / Layer 2 coin, but right now it is just a short pump. It already pumped and dumped. Buying now at 0.01007 is risky because the pump is already finished.
If you want to buy, wait for it to come down near 0.00986 - 0.00990, that was the old low. Don't chase the pump.
1
105
·
--
ERA / USDT
1. Current Price
Price: 0.0954 USDT
In Rupees: Rs 26.43
Today: +7.80% UP
1 ERA = 26 Rupees and 43 paisa.
2. Last 24 Hours
24h High: 0.1026
24h Low: 0.0814
24h Volume: 13.13M USDT
Volume is good. 13 Million dollars trading. Not too low like QNTB.
3. What Does The Chart Show
Look at the chart. This is a GOOD chart, different from ZEC and UNI.
First price was going up and down, then it fell down fast to 0.0926, then it pumped up very fast straight to 0.0954.
The black line MA60 = 0.0948. Price 0.0954 is ABOVE that line now. That means buyers are winning now. Price broke above the line. This is a good sign for short-term.
4. Past Performance
Today: +11.59%
7 Days: +42.03%
30 Days: +38.32%
90 Days: +49.84%
180 Days: -28.08
1 Year: -61.18%
Simple meaning: ERA is green in short-term, Today, 7 Days, 30 Days, 90 Days - all green. But in long-term 1 Year it is still -61% down. So people who bought 1 year ago are still in loss, but people who bought recently are in profit.
ERA is in a pump right now. It is strong today. But remember, it already went up 42% in 7 days. That is a lot. When a coin goes up too fast, it can also fall fast.
If you want to buy, don't buy at the top here at 0.0954. If it comes back down near 0.0948 or 0.0936, that is a better entry.
Did you buy ERA already? Or you are thinking to buy now because it is pumping?
ERA / USDT
1. Current Price
Price: 0.0954 USDT
In Rupees: Rs 26.43
Today: +7.80% UP
1 ERA = 26 Rupees and 43 paisa.
2. Last 24 Hours
24h High: 0.1026
24h Low: 0.0814
24h Volume: 13.13M USDT
Volume is good. 13 Million dollars trading. Not too low like QNTB.
3. What Does The Chart Show
Look at the chart. This is a GOOD chart, different from ZEC and UNI.
First price was going up and down, then it fell down fast to 0.0926, then it pumped up very fast straight to 0.0954.
The black line MA60 = 0.0948. Price 0.0954 is ABOVE that line now. That means buyers are winning now. Price broke above the line. This is a good sign for short-term.
4. Past Performance
Today: +11.59%
7 Days: +42.03%
30 Days: +38.32%
90 Days: +49.84%
180 Days: -28.08
1 Year: -61.18%
Simple meaning: ERA is green in short-term, Today, 7 Days, 30 Days, 90 Days - all green. But in long-term 1 Year it is still -61% down. So people who bought 1 year ago are still in loss, but people who bought recently are in profit.
ERA is in a pump right now. It is strong today. But remember, it already went up 42% in 7 days. That is a lot. When a coin goes up too fast, it can also fall fast.
If you want to buy, don't buy at the top here at 0.0954. If it comes back down near 0.0948 or 0.0936, that is a better entry.
Did you buy ERA already? Or you are thinking to buy now because it is pumping?
1. Current Price
Price: 0.0954 USDT
In Rupees: Rs 26.43
Today: +7.80% UP
1 ERA = 26 Rupees and 43 paisa.
2. Last 24 Hours
24h High: 0.1026
24h Low: 0.0814
24h Volume: 13.13M USDT
Volume is good. 13 Million dollars trading. Not too low like QNTB.
3. What Does The Chart Show
Look at the chart. This is a GOOD chart, different from ZEC and UNI.
First price was going up and down, then it fell down fast to 0.0926, then it pumped up very fast straight to 0.0954.
The black line MA60 = 0.0948. Price 0.0954 is ABOVE that line now. That means buyers are winning now. Price broke above the line. This is a good sign for short-term.
4. Past Performance
Today: +11.59%
7 Days: +42.03%
30 Days: +38.32%
90 Days: +49.84%
180 Days: -28.08
1 Year: -61.18%
Simple meaning: ERA is green in short-term, Today, 7 Days, 30 Days, 90 Days - all green. But in long-term 1 Year it is still -61% down. So people who bought 1 year ago are still in loss, but people who bought recently are in profit.
ERA is in a pump right now. It is strong today. But remember, it already went up 42% in 7 days. That is a lot. When a coin goes up too fast, it can also fall fast.
If you want to buy, don't buy at the top here at 0.0954. If it comes back down near 0.0948 or 0.0936, that is a better entry.
Did you buy ERA already? Or you are thinking to buy now because it is pumping?
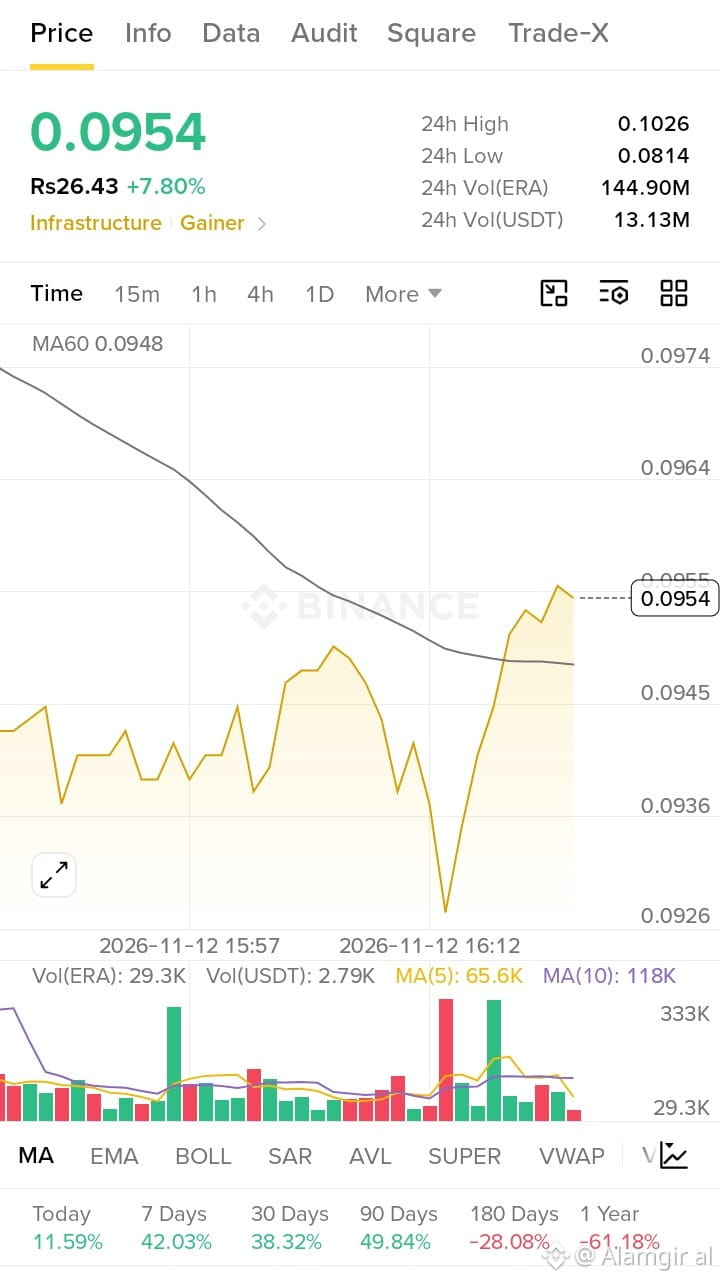
1
114
·
--
Bearish
QNTB / USDT
This is different. This is NOT a normal crypto coin. This is a tokenized STOCK.
1. Current Price
Price: 43.53 USDT
In Rupees: Rs 12,068.69
Today: +8.80% UP
Real Stock price below: QNT $43.39 +0.91%
So the real stock is only up 0.91%, but this token is up 8.80%. That is strange.
2. Last 24 Hours
24h High: 43.75
24h Low: 38.51
24h Volume: 174,588 USDT ONLY
Volume is VERY small. Only 174K dollars. That means almost nobody is trading this.
3. What Does The Chart Show
Look at the chart, it is not a normal chart. It is like steps.
First it was flat at 43.55, then it fell straight down to 43.40, stayed flat there for a long time, then it jumped straight up to 43.53.
This happens when there is no buyer and no seller. Price just jumps. This is not a healthy chart.
The black line MA60 = 43.50 Price 43.53 is just *above* that line, but it means nothing here because volume is so low.
4. Past Performance
Today: +0.95%
7 Days: +34.77%30 Days: +5.32%
90 Days: -36.28%
180 Days:
1 Year:
This is a new token, so there is no old history.
Simple Meaning in English:
Don't trade this like BTC or UNI. This is a bStocks token. It follows a US stock, but on Binance very few people trade it, so price can jump up and down suddenly and you can get stuck.
If you buy here at 43.53, and tomorrow nobody wants to buy, you cannot sell it easily.
QNTB / USDT
This is different. This is NOT a normal crypto coin. This is a tokenized STOCK.
1. Current Price
Price: 43.53 USDT
In Rupees: Rs 12,068.69
Today: +8.80% UP
Real Stock price below: QNT $43.39 +0.91%
So the real stock is only up 0.91%, but this token is up 8.80%. That is strange.
2. Last 24 Hours
24h High: 43.75
24h Low: 38.51
24h Volume: 174,588 USDT ONLY
Volume is VERY small. Only 174K dollars. That means almost nobody is trading this.
3. What Does The Chart Show
Look at the chart, it is not a normal chart. It is like steps.
First it was flat at 43.55, then it fell straight down to 43.40, stayed flat there for a long time, then it jumped straight up to 43.53.
This happens when there is no buyer and no seller. Price just jumps. This is not a healthy chart.
The black line MA60 = 43.50 Price 43.53 is just *above* that line, but it means nothing here because volume is so low.
4. Past Performance
Today: +0.95%
7 Days: +34.77%30 Days: +5.32%
90 Days: -36.28%
180 Days:
1 Year:
This is a new token, so there is no old history.
Simple Meaning in English:
Don't trade this like BTC or UNI. This is a bStocks token. It follows a US stock, but on Binance very few people trade it, so price can jump up and down suddenly and you can get stuck.
If you buy here at 43.53, and tomorrow nobody wants to buy, you cannot sell it easily.
This is different. This is NOT a normal crypto coin. This is a tokenized STOCK.
1. Current Price
Price: 43.53 USDT
In Rupees: Rs 12,068.69
Today: +8.80% UP
Real Stock price below: QNT $43.39 +0.91%
So the real stock is only up 0.91%, but this token is up 8.80%. That is strange.
2. Last 24 Hours
24h High: 43.75
24h Low: 38.51
24h Volume: 174,588 USDT ONLY
Volume is VERY small. Only 174K dollars. That means almost nobody is trading this.
3. What Does The Chart Show
Look at the chart, it is not a normal chart. It is like steps.
First it was flat at 43.55, then it fell straight down to 43.40, stayed flat there for a long time, then it jumped straight up to 43.53.
This happens when there is no buyer and no seller. Price just jumps. This is not a healthy chart.
The black line MA60 = 43.50 Price 43.53 is just *above* that line, but it means nothing here because volume is so low.
4. Past Performance
Today: +0.95%
7 Days: +34.77%30 Days: +5.32%
90 Days: -36.28%
180 Days:
1 Year:
This is a new token, so there is no old history.
Simple Meaning in English:
Don't trade this like BTC or UNI. This is a bStocks token. It follows a US stock, but on Binance very few people trade it, so price can jump up and down suddenly and you can get stuck.
If you buy here at 43.53, and tomorrow nobody wants to buy, you cannot sell it easily.
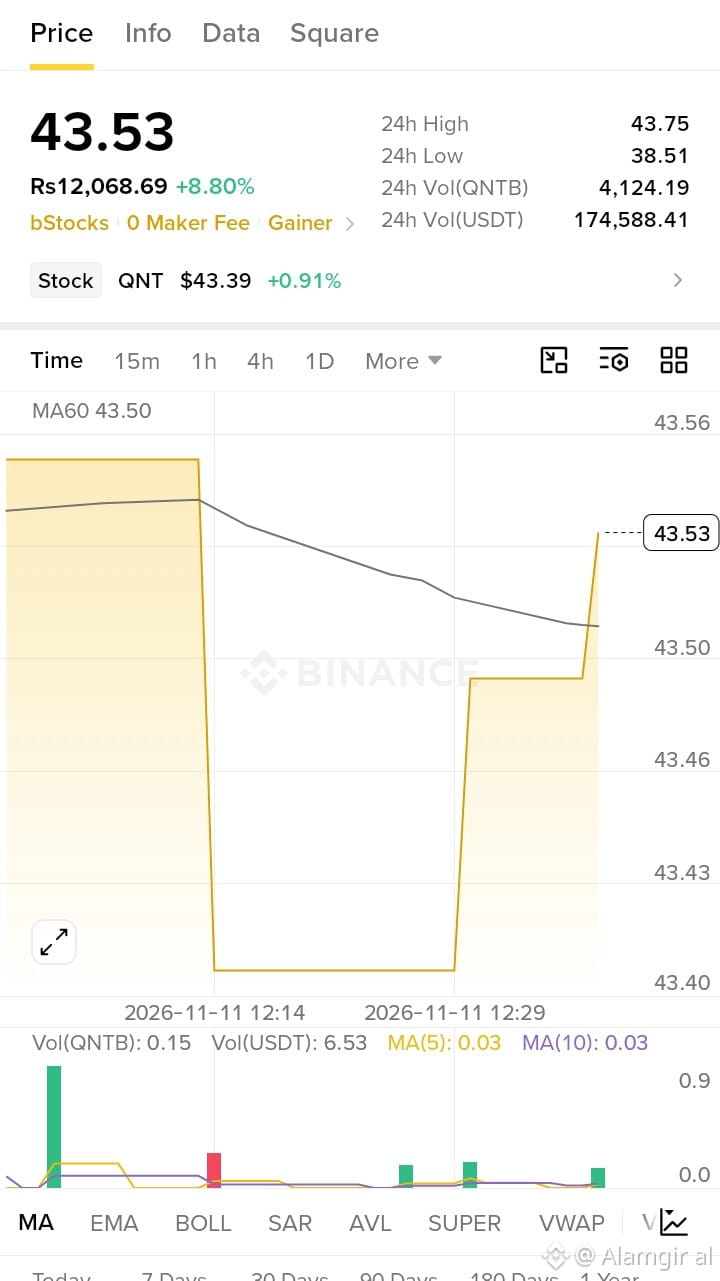
2
91
·
--
ZEC / USDT
1. Current Price
Price: 1,004.02 USDTIn Rupees: RS 278,495.06
Today: -12.70% DOWN
Big fall today. 1 ZEC = almost 2 Lakh 78 Thousand Rupees.
2. Last 24 Hours
24h High: 1,199.82
24h Low: 994.22
24h Volume: 266.59M USDT
This is very high volume. That means many people are selling in panic.
It was at 1,199, now it is at 1,004. It lost almost 200 dollars in one day.
3. What Does The Chart Show
Look at the chart. Price was going down and down from the start.
Then at the end, it fell down very fast like a cliff to 998, then it bounced a little to 1,004.
The black line MA60 = 1,011.09. Price 1,004 is below that line. That means short-term trend is DOWN.
4. Past Performance
Today: -3.24%
7 Days: -17.25%
30 Days: -20.92%
90 Days: +102.09%
180 Days: +87.66%
1 Year: +70.61%
Simple meaning: ZEC is down in short-term, but in long-term it is still up very big. In 90 days it is up 102%, double money. So people who bought 3 months ago are still in profit, but people who bought yesterday are in big loss.
Simple Meaning in English:
ZEC pumped a lot before, now it is crashing. This is called a correction.
Don't try to catch a falling knife. If you want to buy, wait. Let it stop falling first.
ZEC / USDT
1. Current Price
Price: 1,004.02 USDTIn Rupees: RS 278,495.06
Today: -12.70% DOWN
Big fall today. 1 ZEC = almost 2 Lakh 78 Thousand Rupees.
2. Last 24 Hours
24h High: 1,199.82
24h Low: 994.22
24h Volume: 266.59M USDT
This is very high volume. That means many people are selling in panic.
It was at 1,199, now it is at 1,004. It lost almost 200 dollars in one day.
3. What Does The Chart Show
Look at the chart. Price was going down and down from the start.
Then at the end, it fell down very fast like a cliff to 998, then it bounced a little to 1,004.
The black line MA60 = 1,011.09. Price 1,004 is below that line. That means short-term trend is DOWN.
4. Past Performance
Today: -3.24%
7 Days: -17.25%
30 Days: -20.92%
90 Days: +102.09%
180 Days: +87.66%
1 Year: +70.61%
Simple meaning: ZEC is down in short-term, but in long-term it is still up very big. In 90 days it is up 102%, double money. So people who bought 3 months ago are still in profit, but people who bought yesterday are in big loss.
Simple Meaning in English:
ZEC pumped a lot before, now it is crashing. This is called a correction.
Don't try to catch a falling knife. If you want to buy, wait. Let it stop falling first.
1. Current Price
Price: 1,004.02 USDTIn Rupees: RS 278,495.06
Today: -12.70% DOWN
Big fall today. 1 ZEC = almost 2 Lakh 78 Thousand Rupees.
2. Last 24 Hours
24h High: 1,199.82
24h Low: 994.22
24h Volume: 266.59M USDT
This is very high volume. That means many people are selling in panic.
It was at 1,199, now it is at 1,004. It lost almost 200 dollars in one day.
3. What Does The Chart Show
Look at the chart. Price was going down and down from the start.
Then at the end, it fell down very fast like a cliff to 998, then it bounced a little to 1,004.
The black line MA60 = 1,011.09. Price 1,004 is below that line. That means short-term trend is DOWN.
4. Past Performance
Today: -3.24%
7 Days: -17.25%
30 Days: -20.92%
90 Days: +102.09%
180 Days: +87.66%
1 Year: +70.61%
Simple meaning: ZEC is down in short-term, but in long-term it is still up very big. In 90 days it is up 102%, double money. So people who bought 3 months ago are still in profit, but people who bought yesterday are in big loss.
Simple Meaning in English:
ZEC pumped a lot before, now it is crashing. This is called a correction.
Don't try to catch a falling knife. If you want to buy, wait. Let it stop falling first.
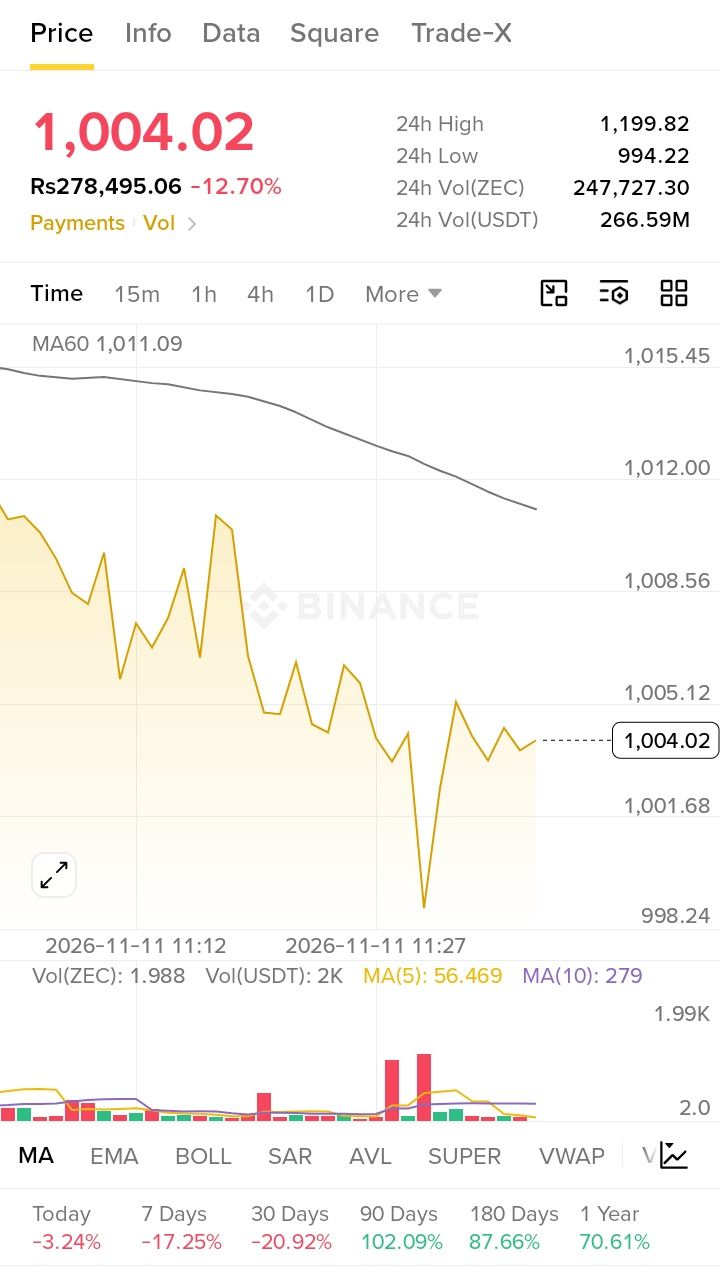
1
749
·
--
JCT / USDT
And now I understand your last message. Rs 0.00186408 is this coin's price in Rupees.
1. Current Price
Price: 0.00000654 USDT
In Rupees: Rs 0.00186408
Today: +20.70% UP
This is a very, very cheap coin. 1 JCT is less than 1 paisa.
2. Last 24 Hours
24h High: 0.00000737
24h Low: 0.00000490
24h Volume: 187.70K USDT
Volume is very small. Only 187K dollars. That means very few people are trading this coin. It is easy to pump and dump.
*3. What Does The Chart Show
In the chart, price pumped up high, then at the end it fell down fast.
The black line MA60 = 0.00000676. Price 0.00000654 is below that line now. That means the pump is over, sellers are back.
4. Past Performance
Today: *+15.81%
7 Days: *+62.16%
30 Days: -27.64%
90 Days: -34.36%
180 Days: -34.36%
1 Year: -34.36%
Simple meaning: It is up this week, but in 30 days, 90 days, 1 year it is DOWN -34%. So this is just a short pump.
5. Order Book
Green Buyers: 48.36%
Red Sellers: 51.64%
Now sellers are a little more than buyers. Not good.
Simple Meaning in English:
This is same like ONE coin. It pumped +20% today, now it is dumping. And it is a MEME coin with very low volume.
JCT / USDT
And now I understand your last message. Rs 0.00186408 is this coin's price in Rupees.
1. Current Price
Price: 0.00000654 USDT
In Rupees: Rs 0.00186408
Today: +20.70% UP
This is a very, very cheap coin. 1 JCT is less than 1 paisa.
2. Last 24 Hours
24h High: 0.00000737
24h Low: 0.00000490
24h Volume: 187.70K USDT
Volume is very small. Only 187K dollars. That means very few people are trading this coin. It is easy to pump and dump.
*3. What Does The Chart Show
In the chart, price pumped up high, then at the end it fell down fast.
The black line MA60 = 0.00000676. Price 0.00000654 is below that line now. That means the pump is over, sellers are back.
4. Past Performance
Today: *+15.81%
7 Days: *+62.16%
30 Days: -27.64%
90 Days: -34.36%
180 Days: -34.36%
1 Year: -34.36%
Simple meaning: It is up this week, but in 30 days, 90 days, 1 year it is DOWN -34%. So this is just a short pump.
5. Order Book
Green Buyers: 48.36%
Red Sellers: 51.64%
Now sellers are a little more than buyers. Not good.
Simple Meaning in English:
This is same like ONE coin. It pumped +20% today, now it is dumping. And it is a MEME coin with very low volume.
And now I understand your last message. Rs 0.00186408 is this coin's price in Rupees.
1. Current Price
Price: 0.00000654 USDT
In Rupees: Rs 0.00186408
Today: +20.70% UP
This is a very, very cheap coin. 1 JCT is less than 1 paisa.
2. Last 24 Hours
24h High: 0.00000737
24h Low: 0.00000490
24h Volume: 187.70K USDT
Volume is very small. Only 187K dollars. That means very few people are trading this coin. It is easy to pump and dump.
*3. What Does The Chart Show
In the chart, price pumped up high, then at the end it fell down fast.
The black line MA60 = 0.00000676. Price 0.00000654 is below that line now. That means the pump is over, sellers are back.
4. Past Performance
Today: *+15.81%
7 Days: *+62.16%
30 Days: -27.64%
90 Days: -34.36%
180 Days: -34.36%
1 Year: -34.36%
Simple meaning: It is up this week, but in 30 days, 90 days, 1 year it is DOWN -34%. So this is just a short pump.
5. Order Book
Green Buyers: 48.36%
Red Sellers: 51.64%
Now sellers are a little more than buyers. Not good.
Simple Meaning in English:
This is same like ONE coin. It pumped +20% today, now it is dumping. And it is a MEME coin with very low volume.
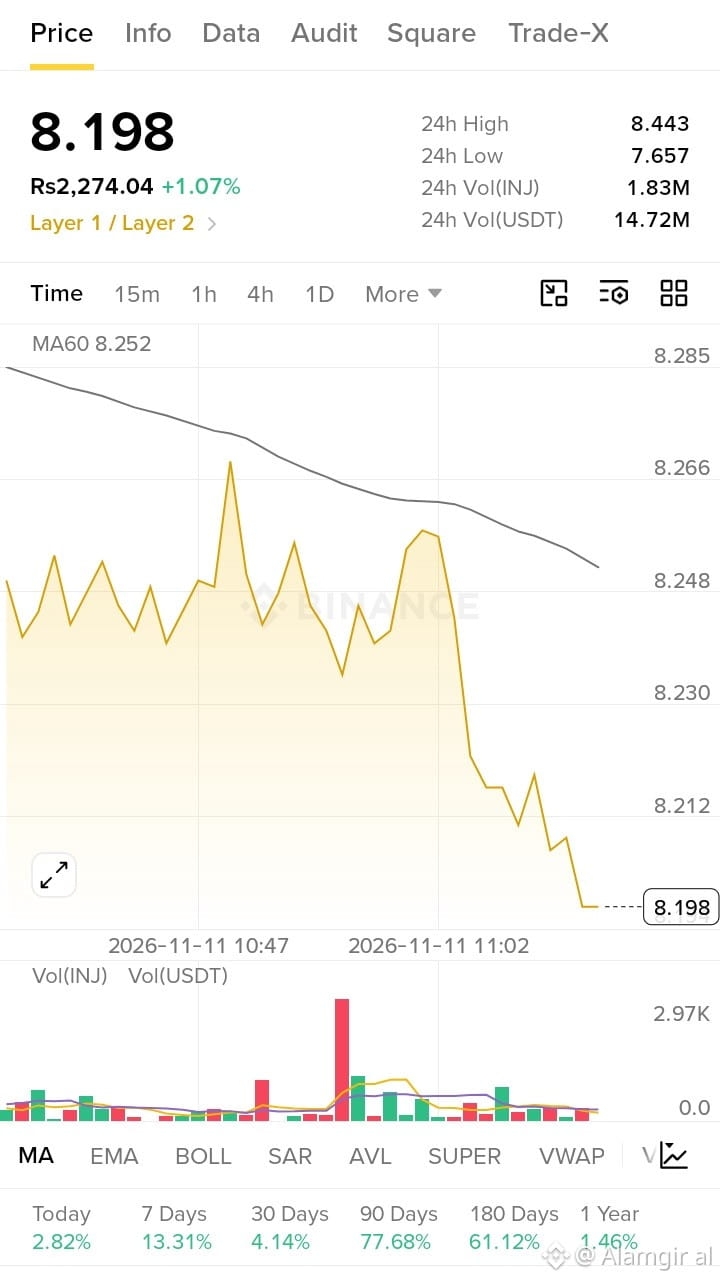
1
686
·
--
ONE / USDT
1. Current Price
Price: 0.001780 USDT
In Rupees: Rs 0.49
Today: +21.25% UP
It looks green, but look at the chart carefully.
2. Last 24 Hours
24h High: 0.002080
24h Low: 0.001351
24h Volume: 23.22M USDT
It means ONE was at 0.001351, it pumped up to 0.002080, and now it has fallen back to 0.001780.
3. What Does The Chart Show
In the chart, price was going up and down, then at the very end it fell down fast like a cliff.
The black line MA60 = 0.001804. Price 0.001780 is below that line now. That means the pump is finished for now, sellers are coming.
At the bottom, you see big RED bars. That means big selling volume at the end.
4. Past Performance
Today: +19.88%
7 Days: $AMZNB +62.02%
30 Days: 13.93%
90 Days: +52.05%
180 Days: -23.97%
1 Year: -69.43%
Simple meaning: ONE is up this week, but in 1 year it is still down -69%. Same like ADA. Old coin, big pump, big dump.
ONE is same story like INIT and JCT. It pumped today, now it is dumping. If you buy now, you are buying late.
If you already have ONE from low price, this is a good time to take profit. If you don't have it, don't chase it now.
Do you have ONE? Or you are thinking to buy because it is +21%
ONE / USDT
1. Current Price
Price: 0.001780 USDT
In Rupees: Rs 0.49
Today: +21.25% UP
It looks green, but look at the chart carefully.
2. Last 24 Hours
24h High: 0.002080
24h Low: 0.001351
24h Volume: 23.22M USDT
It means ONE was at 0.001351, it pumped up to 0.002080, and now it has fallen back to 0.001780.
3. What Does The Chart Show
In the chart, price was going up and down, then at the very end it fell down fast like a cliff.
The black line MA60 = 0.001804. Price 0.001780 is below that line now. That means the pump is finished for now, sellers are coming.
At the bottom, you see big RED bars. That means big selling volume at the end.
4. Past Performance
Today: +19.88%
7 Days: $AMZNB +62.02%
30 Days: 13.93%
90 Days: +52.05%
180 Days: -23.97%
1 Year: -69.43%
Simple meaning: ONE is up this week, but in 1 year it is still down -69%. Same like ADA. Old coin, big pump, big dump.
ONE is same story like INIT and JCT. It pumped today, now it is dumping. If you buy now, you are buying late.
If you already have ONE from low price, this is a good time to take profit. If you don't have it, don't chase it now.
Do you have ONE? Or you are thinking to buy because it is +21%
1. Current Price
Price: 0.001780 USDT
In Rupees: Rs 0.49
Today: +21.25% UP
It looks green, but look at the chart carefully.
2. Last 24 Hours
24h High: 0.002080
24h Low: 0.001351
24h Volume: 23.22M USDT
It means ONE was at 0.001351, it pumped up to 0.002080, and now it has fallen back to 0.001780.
3. What Does The Chart Show
In the chart, price was going up and down, then at the very end it fell down fast like a cliff.
The black line MA60 = 0.001804. Price 0.001780 is below that line now. That means the pump is finished for now, sellers are coming.
At the bottom, you see big RED bars. That means big selling volume at the end.
4. Past Performance
Today: +19.88%
7 Days: $AMZNB +62.02%
30 Days: 13.93%
90 Days: +52.05%
180 Days: -23.97%
1 Year: -69.43%
Simple meaning: ONE is up this week, but in 1 year it is still down -69%. Same like ADA. Old coin, big pump, big dump.
ONE is same story like INIT and JCT. It pumped today, now it is dumping. If you buy now, you are buying late.
If you already have ONE from low price, this is a good time to take profit. If you don't have it, don't chase it now.
Do you have ONE? Or you are thinking to buy because it is +21%
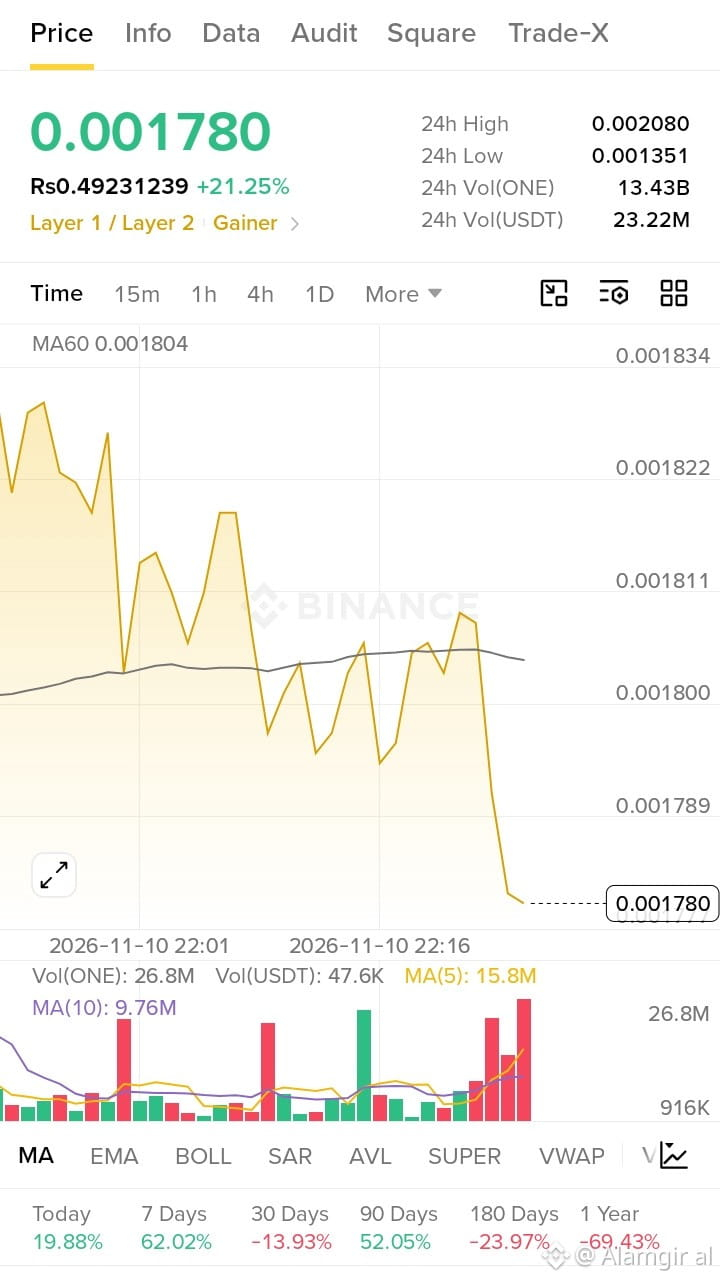
1
4
·
--
ADA / USDT
1. Current Price
Price: 0.1716 USDT
In Rupees: Rs 47.46
Today: 4.29% DOWN
ADA is falling today, more than BTC and PEPE.
2. Last 24 Hours
24h High: 0.1798
24h Low: 0.1702
24h Volume: 13.40M USDT
It means ADA was at 0.1798, now it is at 0.1716. It is very close to its low of the day. Buyers are weak.
3. What Does The Chart Show
Look at the chart. It went up and down many times, but now it is going down and down at the end.
The black line MA60 = 0.1727. Price 0.1716 is below that line. That means short-term trend is DOWN.
4. Past Performance All RED
Today: 3.65%
7 Days: 8.77%
30 Days: 32.04%
90 Days: 7.49%
180 Days: 35.20%
1 Year: 70.28%
This is very bad. In 1 year, ADA lost 70% of its value. If you bought ADA 1 year ago for 100 dollars, now it is only 30 dollars.
Out of all coins you sent today:
BNB = Strongest, almost flat
PEPE = Trying to go up
BTC = Down a little
XRP = Down fast
ADA = Down in every time frame, worst long-term
ADA is a good old project, Layer 1 coin, but right now it is in a long downtrend.
Do you have ADA in loss Or you want to buy ADA because it is cheap now at 0.1716.
ADA / USDT
1. Current Price
Price: 0.1716 USDT
In Rupees: Rs 47.46
Today: 4.29% DOWN
ADA is falling today, more than BTC and PEPE.
2. Last 24 Hours
24h High: 0.1798
24h Low: 0.1702
24h Volume: 13.40M USDT
It means ADA was at 0.1798, now it is at 0.1716. It is very close to its low of the day. Buyers are weak.
3. What Does The Chart Show
Look at the chart. It went up and down many times, but now it is going down and down at the end.
The black line MA60 = 0.1727. Price 0.1716 is below that line. That means short-term trend is DOWN.
4. Past Performance All RED
Today: 3.65%
7 Days: 8.77%
30 Days: 32.04%
90 Days: 7.49%
180 Days: 35.20%
1 Year: 70.28%
This is very bad. In 1 year, ADA lost 70% of its value. If you bought ADA 1 year ago for 100 dollars, now it is only 30 dollars.
Out of all coins you sent today:
BNB = Strongest, almost flat
PEPE = Trying to go up
BTC = Down a little
XRP = Down fast
ADA = Down in every time frame, worst long-term
ADA is a good old project, Layer 1 coin, but right now it is in a long downtrend.
Do you have ADA in loss Or you want to buy ADA because it is cheap now at 0.1716.
1. Current Price
Price: 0.1716 USDT
In Rupees: Rs 47.46
Today: 4.29% DOWN
ADA is falling today, more than BTC and PEPE.
2. Last 24 Hours
24h High: 0.1798
24h Low: 0.1702
24h Volume: 13.40M USDT
It means ADA was at 0.1798, now it is at 0.1716. It is very close to its low of the day. Buyers are weak.
3. What Does The Chart Show
Look at the chart. It went up and down many times, but now it is going down and down at the end.
The black line MA60 = 0.1727. Price 0.1716 is below that line. That means short-term trend is DOWN.
4. Past Performance All RED
Today: 3.65%
7 Days: 8.77%
30 Days: 32.04%
90 Days: 7.49%
180 Days: 35.20%
1 Year: 70.28%
This is very bad. In 1 year, ADA lost 70% of its value. If you bought ADA 1 year ago for 100 dollars, now it is only 30 dollars.
Out of all coins you sent today:
BNB = Strongest, almost flat
PEPE = Trying to go up
BTC = Down a little
XRP = Down fast
ADA = Down in every time frame, worst long-term
ADA is a good old project, Layer 1 coin, but right now it is in a long downtrend.
Do you have ADA in loss Or you want to buy ADA because it is cheap now at 0.1716.
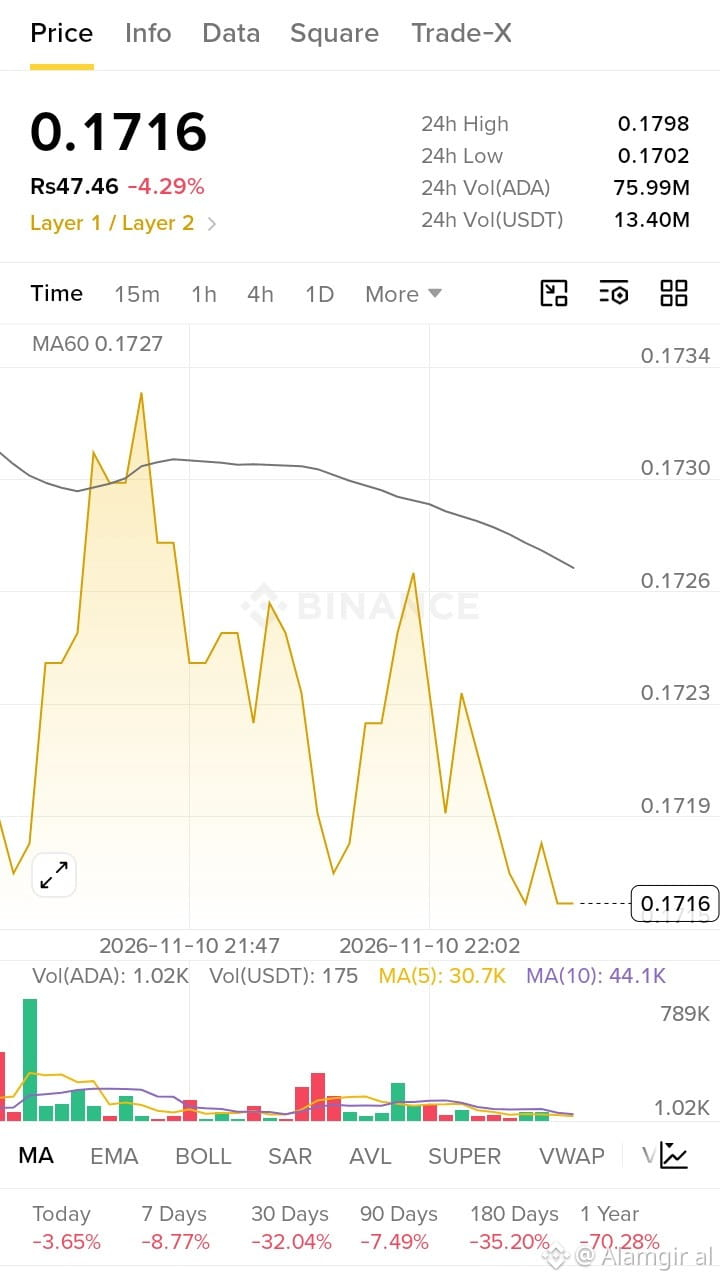
1
88
·
--
PEPE / USDT
1. Current Price
Price: 0.00000520 USDT
Today: 1.14% DOWN
Type: MEME coin it moves on hype, not on real use
Price has many zeros, so people buy it in billions.
2. Last 24 Hours
24h Volume: 91.70M USDT
That means many people are trading PEPE today. Volume is high.
3. What Does The Chart Show
In the chart, PEPE fell down, then went up again fast, and now it is at the top at 0.00000520.
The black line MA60 = 0.00000520. Price is exactly ON that line. That means PEPE is at a decision point. If it goes above, it can go up more. If it goes below, it can fall again.
4. Past Performance
Today: +0.78%
7 Days: +11.83%
30 Days: +28.40%
90 Days: +85.71%
180 Days: +27.14%
1 Year: 15.03%
Simple meaning: In the last 3 months, PEPE is up 85%, but in 1 year it is still down 15%. So it is recovering, but still not at its old high.
5. Order Book Very Important
At the bottom you see:
Green Buyers: 64.43%
Red Sellers: 35.57%
That means right now, more people want to BUY PEPE than SELL. That is a good short-term sign.
PEPE is better than XRP today. XRP is falling, PEPE is trying to go up.
But remember, PEPE is a MEME coin. It can go up 20% in one hour, and fall 20% in the next hour. Very fast, very risky.
Do you have PEPE Or you want to buy PEPE because it is cheap
PEPE / USDT
1. Current Price
Price: 0.00000520 USDT
Today: 1.14% DOWN
Type: MEME coin it moves on hype, not on real use
Price has many zeros, so people buy it in billions.
2. Last 24 Hours
24h Volume: 91.70M USDT
That means many people are trading PEPE today. Volume is high.
3. What Does The Chart Show
In the chart, PEPE fell down, then went up again fast, and now it is at the top at 0.00000520.
The black line MA60 = 0.00000520. Price is exactly ON that line. That means PEPE is at a decision point. If it goes above, it can go up more. If it goes below, it can fall again.
4. Past Performance
Today: +0.78%
7 Days: +11.83%
30 Days: +28.40%
90 Days: +85.71%
180 Days: +27.14%
1 Year: 15.03%
Simple meaning: In the last 3 months, PEPE is up 85%, but in 1 year it is still down 15%. So it is recovering, but still not at its old high.
5. Order Book Very Important
At the bottom you see:
Green Buyers: 64.43%
Red Sellers: 35.57%
That means right now, more people want to BUY PEPE than SELL. That is a good short-term sign.
PEPE is better than XRP today. XRP is falling, PEPE is trying to go up.
But remember, PEPE is a MEME coin. It can go up 20% in one hour, and fall 20% in the next hour. Very fast, very risky.
Do you have PEPE Or you want to buy PEPE because it is cheap
1. Current Price
Price: 0.00000520 USDT
Today: 1.14% DOWN
Type: MEME coin it moves on hype, not on real use
Price has many zeros, so people buy it in billions.
2. Last 24 Hours
24h Volume: 91.70M USDT
That means many people are trading PEPE today. Volume is high.
3. What Does The Chart Show
In the chart, PEPE fell down, then went up again fast, and now it is at the top at 0.00000520.
The black line MA60 = 0.00000520. Price is exactly ON that line. That means PEPE is at a decision point. If it goes above, it can go up more. If it goes below, it can fall again.
4. Past Performance
Today: +0.78%
7 Days: +11.83%
30 Days: +28.40%
90 Days: +85.71%
180 Days: +27.14%
1 Year: 15.03%
Simple meaning: In the last 3 months, PEPE is up 85%, but in 1 year it is still down 15%. So it is recovering, but still not at its old high.
5. Order Book Very Important
At the bottom you see:
Green Buyers: 64.43%
Red Sellers: 35.57%
That means right now, more people want to BUY PEPE than SELL. That is a good short-term sign.
PEPE is better than XRP today. XRP is falling, PEPE is trying to go up.
But remember, PEPE is a MEME coin. It can go up 20% in one hour, and fall 20% in the next hour. Very fast, very risky.
Do you have PEPE Or you want to buy PEPE because it is cheap
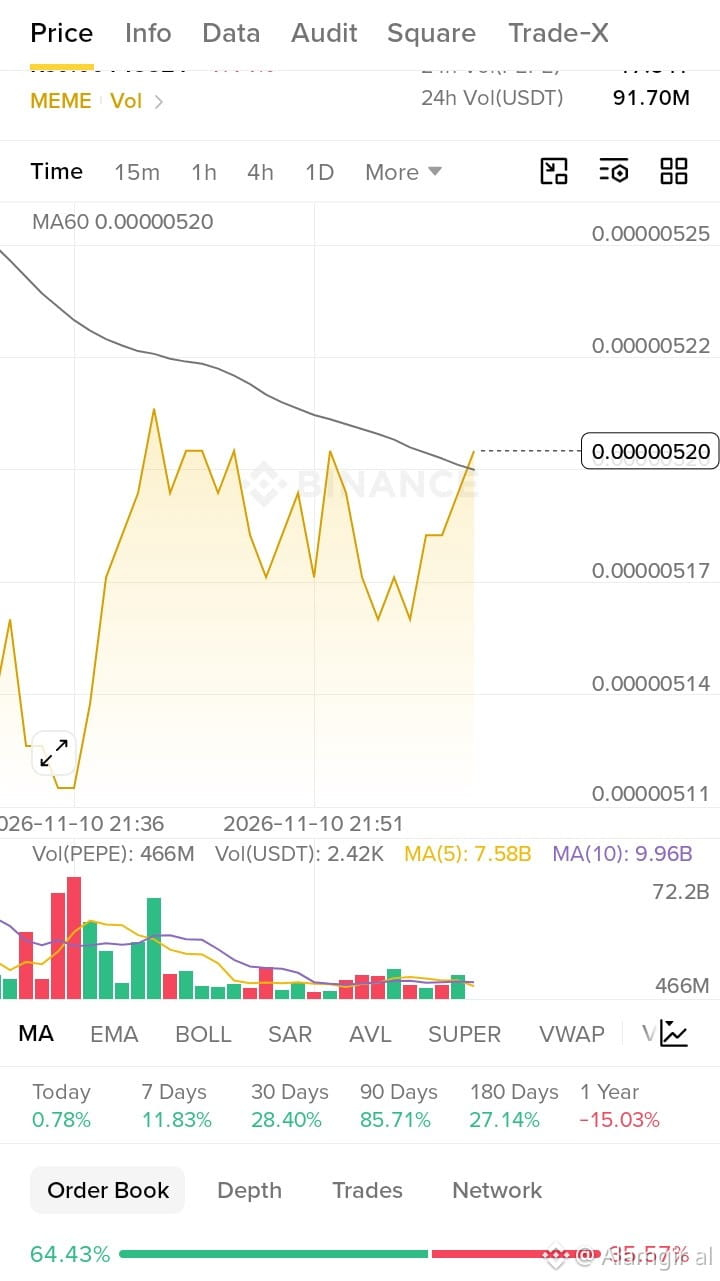
1
86
Log in to explore more content
Join global crypto users on Binance Square
⚡️ Get latest and useful information about crypto.
💬 Trusted by the world’s largest crypto exchange.
👍 Discover real insights from verified creators.
Email / Phone number
Trending Topics
MoreHikesExpectedIsBTCUnderPressure
1,033 views
47 Discussing
FOMC Minutes | Fed Minutes Show Almost All Officials Expect More Rate Hikes, With Some Open to a Larger December Move
Binance News
·12 Likes
·11.3k views
NvidiaBeatsEstimatesWith$130BQ4Outlook
65,530 views
288 Discussing
AnthropicIPOPriceCouldExceed$80
65,908 views
241 Discussing