$BCH / USDT
1. Current Price
Price: 204.4 USDT
In Rupees: Rs 56,524.77
Today: -5.02% DOWN
1 BCH = 56 Thousand 524 Rupees.
2. Last 24 Hours
24h High: 218.2
24h Low: 195.7
24h Volume BCH: 43,341.95
24h Volume USDT: 8.88M
Volume is good. 8.88 Million dollars trading. This is a big, old coin, not a new small coin.
3. What Does The Chart Show
Look at the chart carefully. Price is falling.
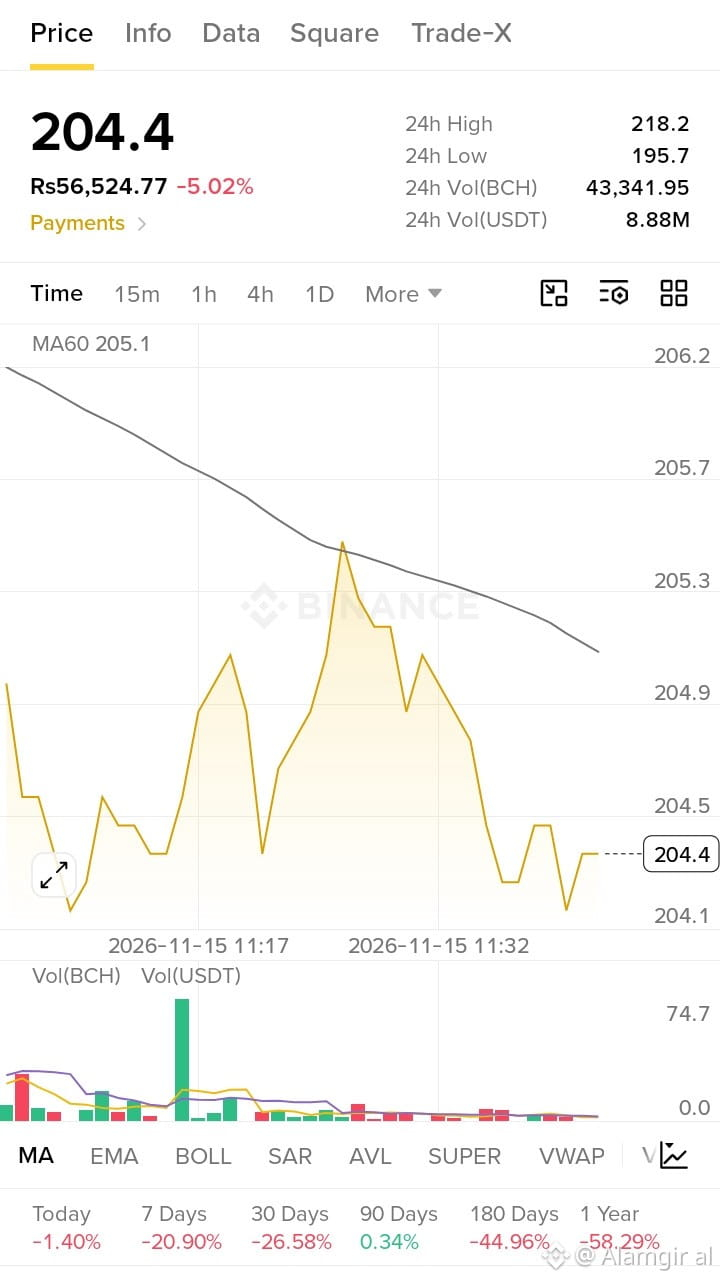
Price was near 205.3, then it tried to go up 2-3 times to 205.0 and 205.2, but every time sellers pushed it down. At the end, it fell down to 204.1, then made a small bounce to 204.4.
The black line MA60 = 205.1. Price 204.4 is BELOW that line. That means sellers are winning now. Price is under the line. This is a weak sign.
At the bottom, you see one big green bar. That was one big buy. After that, volume is very low. No big buying, no big selling. Market is slow.
This is called a Downtrend. Lower high, lower low. Price is making a staircase going down.
4. Past Performance
Today: -1.40%
7 Days: -20.90%
30 Days: -26.58%
90 Days: +0.34%
180 Days: -44.96%
1 Year: -58.29%
Simple meaning: BCH is red in almost all. In 7 Days it fell -20.90%. In 1 Year it fell -58.29%.
If someone bought 1 year ago for 100 Rupees, now it is only 41 Rupees left. Very big loss.
BCH is the old brother of Bitcoin, but right now it is very weak.
$BCH is not a pump coin. It is a slow, old coin. Right now it is falling.
Buying now at 204.4 is risky because it is below MA60 and it is near its low.
Support.
195.7 This is the 24h Low. If it breaks this, it will go more down to 190 or 185.
Resistance: 205.1 This is MA60. If price goes above this and stays there, then it will be safe to buy again. Next target will be 218.2.
Don't catch a falling knife. Wait for it to come above 205.1.
#WhatWillDriveCryptoandStocks’NextRebound?
1. Current Price
Price: 204.4 USDT
In Rupees: Rs 56,524.77
Today: -5.02% DOWN
1 BCH = 56 Thousand 524 Rupees.
2. Last 24 Hours
24h High: 218.2
24h Low: 195.7
24h Volume BCH: 43,341.95
24h Volume USDT: 8.88M
Volume is good. 8.88 Million dollars trading. This is a big, old coin, not a new small coin.
3. What Does The Chart Show
Look at the chart carefully. Price is falling.
Price was near 205.3, then it tried to go up 2-3 times to 205.0 and 205.2, but every time sellers pushed it down. At the end, it fell down to 204.1, then made a small bounce to 204.4.
The black line MA60 = 205.1. Price 204.4 is BELOW that line. That means sellers are winning now. Price is under the line. This is a weak sign.
At the bottom, you see one big green bar. That was one big buy. After that, volume is very low. No big buying, no big selling. Market is slow.
This is called a Downtrend. Lower high, lower low. Price is making a staircase going down.
4. Past Performance
Today: -1.40%
7 Days: -20.90%
30 Days: -26.58%
90 Days: +0.34%
180 Days: -44.96%
1 Year: -58.29%
Simple meaning: BCH is red in almost all. In 7 Days it fell -20.90%. In 1 Year it fell -58.29%.
If someone bought 1 year ago for 100 Rupees, now it is only 41 Rupees left. Very big loss.
BCH is the old brother of Bitcoin, but right now it is very weak.
$BCH is not a pump coin. It is a slow, old coin. Right now it is falling.
Buying now at 204.4 is risky because it is below MA60 and it is near its low.
Support.
195.7 This is the 24h Low. If it breaks this, it will go more down to 190 or 185.
Resistance: 205.1 This is MA60. If price goes above this and stays there, then it will be safe to buy again. Next target will be 218.2.
Don't catch a falling knife. Wait for it to come above 205.1.
#WhatWillDriveCryptoandStocks’NextRebound?