
Muhamad_Farhan
159 Posts

Muhamad_Farhan
Report
Block User
Open Trade
Frequent Trader
5 Years
4 Following
11 Followers
36 Liked
Posts
Portfolio
$SAGA $BTC $SOL
{spot}(SAGAUSDT)
{spot}(BTCUSDT)
{spot}(SOLUSDT)
Technical Analysis & Key Levels
Trend & Momentum: SAGA remains under downward pressure, trading roughly 13.6% below its 200-day moving average and trailing its 30-day moving average (~$0.0176). Short-term 1-hour and 4-hour charts show minor stabilization bounces, while daily and weekly indicators remain firmly bearish.
Immediate Support ($0.0143 – $0.0148): A notable long liquidation cluster sits near $0.01434. Holding above this zone prevents a deeper slide toward the major structural floor around $0.0120.
Immediate Resistance ($0.0161 – $0.0176): A short liquidation cluster sits near $0.01615. Bulls need a decisive daily close above the 30-day moving average (~$0.0176) to shift momentum toward the $0.0445 recovery hurdle.
Key Ecosystem & Fundamental Updates
SagaEVM Sunset (November 23, 2026): Saga is one week away from the final shutdown of SagaEVM (which began its wind-down in September). While the core Saga Mainnet and the SAGA token continue operating normally, short-term migration friction has weighed on sentiment.
Liquidity & Pair Adjustments: Following earlier trading pair removals on select exchanges (such as SAGA/FDUSD on Binance and SAGA/USDT on Bitget in September), order books are thinner than earlier in the year, increasing sensitivity to sudden volume spikes.
Upcoming Token Unlock (November 30, 2026): Roughly 10.92M SAGA (~$168K at current prices) is scheduled to unlock at the end of the month, which may act as minor overhead supply. #sagateembinancesqure👍 #USSpotXRPETFsSeeLargestWeeklyOutflowIn8Months #BitcoinActiveSupplyInProfitDropsBelow45% #KavaSaysAbnormalActivityLimitedToKavaLend #WillFOMCMinutesReinforceRateHikeExpectations?
$SAGA $BTC $SOL
Technical Analysis & Key Levels
Trend & Momentum: SAGA remains under downward pressure, trading roughly 13.6% below its 200-day moving average and trailing its 30-day moving average (~$0.0176). Short-term 1-hour and 4-hour charts show minor stabilization bounces, while daily and weekly indicators remain firmly bearish.
Immediate Support ($0.0143 – $0.0148): A notable long liquidation cluster sits near $0.01434. Holding above this zone prevents a deeper slide toward the major structural floor around $0.0120.
Immediate Resistance ($0.0161 – $0.0176): A short liquidation cluster sits near $0.01615. Bulls need a decisive daily close above the 30-day moving average (~$0.0176) to shift momentum toward the $0.0445 recovery hurdle.
Key Ecosystem & Fundamental Updates
SagaEVM Sunset (November 23, 2026): Saga is one week away from the final shutdown of SagaEVM (which began its wind-down in September). While the core Saga Mainnet and the SAGA token continue operating normally, short-term migration friction has weighed on sentiment.
Liquidity & Pair Adjustments: Following earlier trading pair removals on select exchanges (such as SAGA/FDUSD on Binance and SAGA/USDT on Bitget in September), order books are thinner than earlier in the year, increasing sensitivity to sudden volume spikes.
Upcoming Token Unlock (November 30, 2026): Roughly 10.92M SAGA (~$168K at current prices) is scheduled to unlock at the end of the month, which may act as minor overhead supply. #sagateembinancesqure👍 #USSpotXRPETFsSeeLargestWeeklyOutflowIn8Months #BitcoinActiveSupplyInProfitDropsBelow45% #KavaSaysAbnormalActivityLimitedToKavaLend #WillFOMCMinutesReinforceRateHikeExpectations?
Technical Analysis & Key Levels
Trend & Momentum: SAGA remains under downward pressure, trading roughly 13.6% below its 200-day moving average and trailing its 30-day moving average (~$0.0176). Short-term 1-hour and 4-hour charts show minor stabilization bounces, while daily and weekly indicators remain firmly bearish.
Immediate Support ($0.0143 – $0.0148): A notable long liquidation cluster sits near $0.01434. Holding above this zone prevents a deeper slide toward the major structural floor around $0.0120.
Immediate Resistance ($0.0161 – $0.0176): A short liquidation cluster sits near $0.01615. Bulls need a decisive daily close above the 30-day moving average (~$0.0176) to shift momentum toward the $0.0445 recovery hurdle.
Key Ecosystem & Fundamental Updates
SagaEVM Sunset (November 23, 2026): Saga is one week away from the final shutdown of SagaEVM (which began its wind-down in September). While the core Saga Mainnet and the SAGA token continue operating normally, short-term migration friction has weighed on sentiment.
Liquidity & Pair Adjustments: Following earlier trading pair removals on select exchanges (such as SAGA/FDUSD on Binance and SAGA/USDT on Bitget in September), order books are thinner than earlier in the year, increasing sensitivity to sudden volume spikes.
Upcoming Token Unlock (November 30, 2026): Roughly 10.92M SAGA (~$168K at current prices) is scheduled to unlock at the end of the month, which may act as minor overhead supply. #sagateembinancesqure👍 #USSpotXRPETFsSeeLargestWeeklyOutflowIn8Months #BitcoinActiveSupplyInProfitDropsBelow45% #KavaSaysAbnormalActivityLimitedToKavaLend #WillFOMCMinutesReinforceRateHikeExpectations?

292
$SAGA $BTC $ONE
{spot}(SAGAUSDT)
{spot}(BTCUSDT)
{spot}(ONEUSDT)
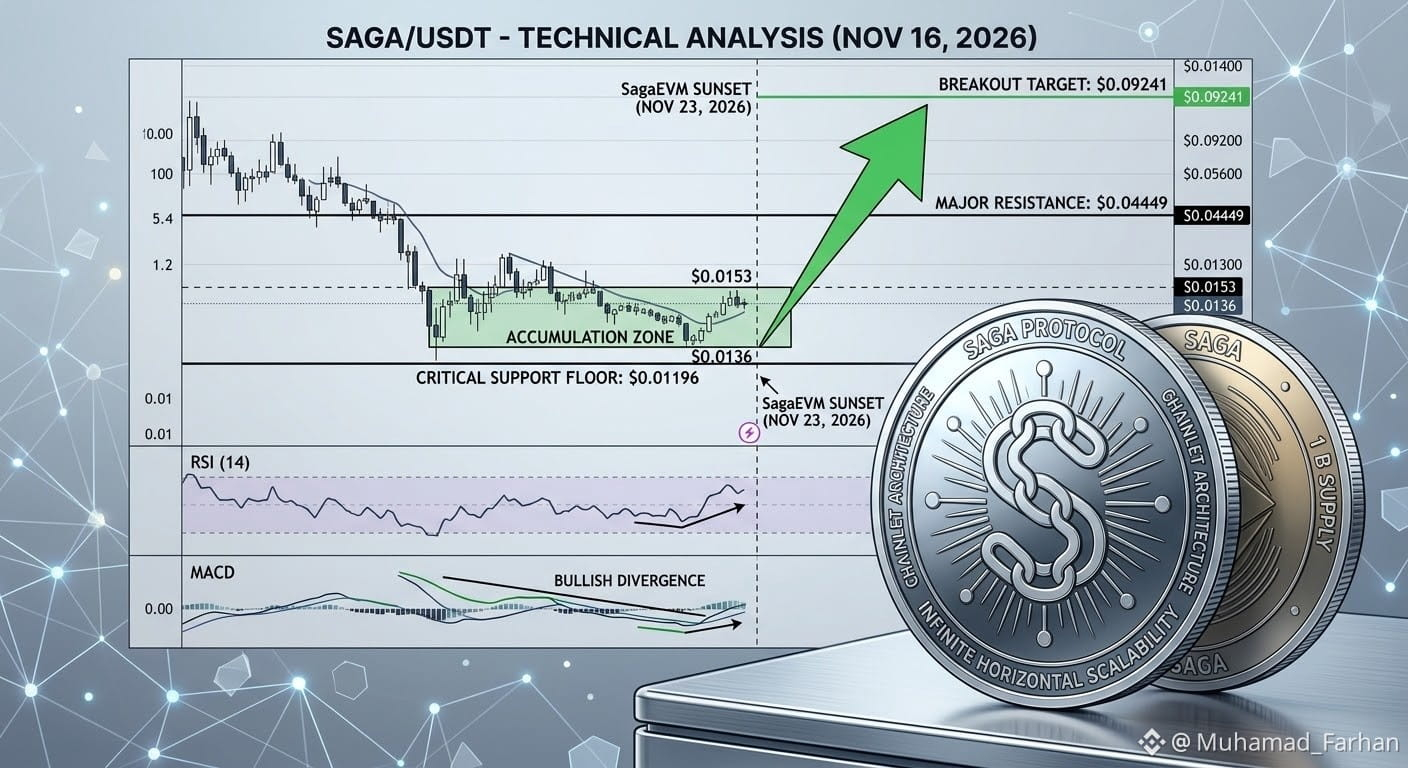
(SAGA) is trading in a tight consolidation range between $0.0136 and $0.0153 following a prolonged multi-month downtrend from its April 2024 peak of $7.82. Market momentum remains cautious ahead of the scheduled SagaEVM sunset on November 23, 2026, though short-term technical indicators show early signs of seller exhaustion.
Fundamental Catalysts & Headwinds
SagaEVM Sunset (November 23, 2026): Saga is winding down SagaEVM following a two-month sunset window. While the core Saga Mainnet and SAGA token continue operating normally, the migration requirement has created short-term uncertainty and suppressed network activity.
Liquidity Compression: Recent spot pair removals—including Bitget delisting SAGA/USDT and Binance removing SAGA/FDUSD in September 2026—have narrowed trading routes. Thinner order books increase slippage and amplify volatility during sudden volume spikes.
AI & Chainlet Ecosystem Growth: On the development side, Saga continues expanding its dedicated Chainlet architecture and partnered with Chrono Labs to launch KEX, an AI agent infrastructure platform aimed at driving long-term Mainnet utility.
#sagateembinancesqure👍 #USSpotXRPETFsSeeLargestWeeklyOutflowIn8Months #BitcoinActiveSupplyInProfitDropsBelow45% #KavaSaysAbnormalActivityLimitedToKavaLend #WORPTLetsTouristsConvertCryptoToThaiBaht
$SAGA $BTC $ONE
(SAGA) is trading in a tight consolidation range between $0.0136 and $0.0153 following a prolonged multi-month downtrend from its April 2024 peak of $7.82. Market momentum remains cautious ahead of the scheduled SagaEVM sunset on November 23, 2026, though short-term technical indicators show early signs of seller exhaustion.
Fundamental Catalysts & Headwinds
SagaEVM Sunset (November 23, 2026): Saga is winding down SagaEVM following a two-month sunset window. While the core Saga Mainnet and SAGA token continue operating normally, the migration requirement has created short-term uncertainty and suppressed network activity.
Liquidity Compression: Recent spot pair removals—including Bitget delisting SAGA/USDT and Binance removing SAGA/FDUSD in September 2026—have narrowed trading routes. Thinner order books increase slippage and amplify volatility during sudden volume spikes.
AI & Chainlet Ecosystem Growth: On the development side, Saga continues expanding its dedicated Chainlet architecture and partnered with Chrono Labs to launch KEX, an AI agent infrastructure platform aimed at driving long-term Mainnet utility.
#sagateembinancesqure👍 #USSpotXRPETFsSeeLargestWeeklyOutflowIn8Months #BitcoinActiveSupplyInProfitDropsBelow45% #KavaSaysAbnormalActivityLimitedToKavaLend #WORPTLetsTouristsConvertCryptoToThaiBaht
(SAGA) is trading in a tight consolidation range between $0.0136 and $0.0153 following a prolonged multi-month downtrend from its April 2024 peak of $7.82. Market momentum remains cautious ahead of the scheduled SagaEVM sunset on November 23, 2026, though short-term technical indicators show early signs of seller exhaustion.
Fundamental Catalysts & Headwinds
SagaEVM Sunset (November 23, 2026): Saga is winding down SagaEVM following a two-month sunset window. While the core Saga Mainnet and SAGA token continue operating normally, the migration requirement has created short-term uncertainty and suppressed network activity.
Liquidity Compression: Recent spot pair removals—including Bitget delisting SAGA/USDT and Binance removing SAGA/FDUSD in September 2026—have narrowed trading routes. Thinner order books increase slippage and amplify volatility during sudden volume spikes.
AI & Chainlet Ecosystem Growth: On the development side, Saga continues expanding its dedicated Chainlet architecture and partnered with Chrono Labs to launch KEX, an AI agent infrastructure platform aimed at driving long-term Mainnet utility.
#sagateembinancesqure👍 #USSpotXRPETFsSeeLargestWeeklyOutflowIn8Months #BitcoinActiveSupplyInProfitDropsBelow45% #KavaSaysAbnormalActivityLimitedToKavaLend #WORPTLetsTouristsConvertCryptoToThaiBaht
528
·
--
Bearish
$DEXE $BTC $SAGA
{spot}(DEXEUSDT)
{spot}(BTCUSDT)
{spot}(SAGAUSDT)
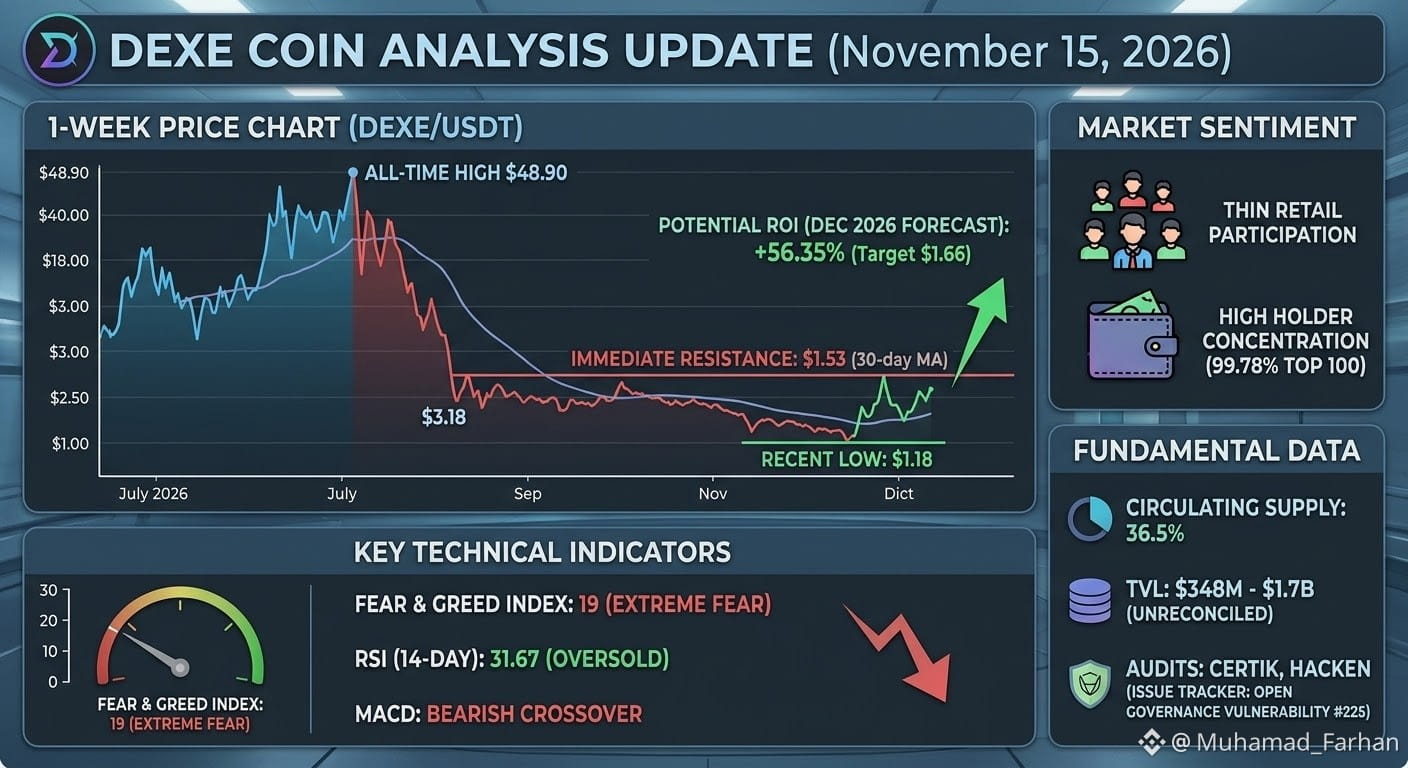
(DEXE) is trading in a post-crash consolidation zone around $1.06 to $1.25, down roughly 97.7% from its July 13, 2026, all-time high of $48.89. While the protocol maintains active DAO infrastructure and a pivoting narrative toward AI-agent governance, the token carries severe structural risks, including extreme wallet concentration and thin liquidity.
Market Snapshot & Price Action
Current Price: ~$1.06 – $1.25 (down ~11% to 14% over the last 24 hours, and down ~30% over the past 30 days).
24h Trading Volume: ~$6.8M – $7.3M.
Market Cap & Supply Discrepancies: Major data aggregators report conflicting circulating supply figures—CoinGecko/Kraken track ~35.2M DEXE (~36.5% of the 96.5M max supply, putting market cap near $37M–$42M), while Crypto.com lists 83.73M DEXE (~$104M market cap).
The July 2026 Collapse: Following an exchange listing and short squeeze that sent DEXE parabolic to $48.89 on July 13, 2026, the token crashed ~96.8% in 11 days after nearly 800,000 DEXE (~$6.15M) moved from Ceffu to Binance. Price has struggled to find sustained buying pressure ever since.
Technical Analysis
Trend & Moving Averages: Firmly bearish on macro timeframes. Both the 200-day moving average and 200-week moving average sit far above current price action and are sloping downward, acting as heavy overhead resistance. On the 4-hour timeframe, short-term moving averages show minor stabilization attempts, though DEXE continues to print lower lows near the $1.04–$1.18 support band.
Momentum (RSI & MACD): The 14-day RSI hovers near the 30–35 oversold threshold, with minor bullish divergences appearing on lower timeframes. However, daily MACD indicators lack bullish crossover confirmation, pointing toward weak relief bounces rather than a structural trend reversal.
#sagateembinancesqure👍 #TradFiForBeginners #WhatWillDriveCryptoandStocks’NextRebound? #WhoWillSucceedJensenHuangatNvidia? #BitcoinActiveSupplyInProfitDropsBelow45%
$DEXE $BTC $SAGA
(DEXE) is trading in a post-crash consolidation zone around $1.06 to $1.25, down roughly 97.7% from its July 13, 2026, all-time high of $48.89. While the protocol maintains active DAO infrastructure and a pivoting narrative toward AI-agent governance, the token carries severe structural risks, including extreme wallet concentration and thin liquidity.
Market Snapshot & Price Action
Current Price: ~$1.06 – $1.25 (down ~11% to 14% over the last 24 hours, and down ~30% over the past 30 days).
24h Trading Volume: ~$6.8M – $7.3M.
Market Cap & Supply Discrepancies: Major data aggregators report conflicting circulating supply figures—CoinGecko/Kraken track ~35.2M DEXE (~36.5% of the 96.5M max supply, putting market cap near $37M–$42M), while Crypto.com lists 83.73M DEXE (~$104M market cap).
The July 2026 Collapse: Following an exchange listing and short squeeze that sent DEXE parabolic to $48.89 on July 13, 2026, the token crashed ~96.8% in 11 days after nearly 800,000 DEXE (~$6.15M) moved from Ceffu to Binance. Price has struggled to find sustained buying pressure ever since.
Technical Analysis
Trend & Moving Averages: Firmly bearish on macro timeframes. Both the 200-day moving average and 200-week moving average sit far above current price action and are sloping downward, acting as heavy overhead resistance. On the 4-hour timeframe, short-term moving averages show minor stabilization attempts, though DEXE continues to print lower lows near the $1.04–$1.18 support band.
Momentum (RSI & MACD): The 14-day RSI hovers near the 30–35 oversold threshold, with minor bullish divergences appearing on lower timeframes. However, daily MACD indicators lack bullish crossover confirmation, pointing toward weak relief bounces rather than a structural trend reversal.
#sagateembinancesqure👍 #TradFiForBeginners #WhatWillDriveCryptoandStocks’NextRebound? #WhoWillSucceedJensenHuangatNvidia? #BitcoinActiveSupplyInProfitDropsBelow45%
(DEXE) is trading in a post-crash consolidation zone around $1.06 to $1.25, down roughly 97.7% from its July 13, 2026, all-time high of $48.89. While the protocol maintains active DAO infrastructure and a pivoting narrative toward AI-agent governance, the token carries severe structural risks, including extreme wallet concentration and thin liquidity.
Market Snapshot & Price Action
Current Price: ~$1.06 – $1.25 (down ~11% to 14% over the last 24 hours, and down ~30% over the past 30 days).
24h Trading Volume: ~$6.8M – $7.3M.
Market Cap & Supply Discrepancies: Major data aggregators report conflicting circulating supply figures—CoinGecko/Kraken track ~35.2M DEXE (~36.5% of the 96.5M max supply, putting market cap near $37M–$42M), while Crypto.com lists 83.73M DEXE (~$104M market cap).
The July 2026 Collapse: Following an exchange listing and short squeeze that sent DEXE parabolic to $48.89 on July 13, 2026, the token crashed ~96.8% in 11 days after nearly 800,000 DEXE (~$6.15M) moved from Ceffu to Binance. Price has struggled to find sustained buying pressure ever since.
Technical Analysis
Trend & Moving Averages: Firmly bearish on macro timeframes. Both the 200-day moving average and 200-week moving average sit far above current price action and are sloping downward, acting as heavy overhead resistance. On the 4-hour timeframe, short-term moving averages show minor stabilization attempts, though DEXE continues to print lower lows near the $1.04–$1.18 support band.
Momentum (RSI & MACD): The 14-day RSI hovers near the 30–35 oversold threshold, with minor bullish divergences appearing on lower timeframes. However, daily MACD indicators lack bullish crossover confirmation, pointing toward weak relief bounces rather than a structural trend reversal.
#sagateembinancesqure👍 #TradFiForBeginners #WhatWillDriveCryptoandStocks’NextRebound? #WhoWillSucceedJensenHuangatNvidia? #BitcoinActiveSupplyInProfitDropsBelow45%
643
·
--
Bearish
$DEXE $BTC $SAGA
{spot}(DEXEUSDT)
{spot}(BTCUSDT)
{spot}(SAGAUSDT)
Market & Derivatives Snapshot
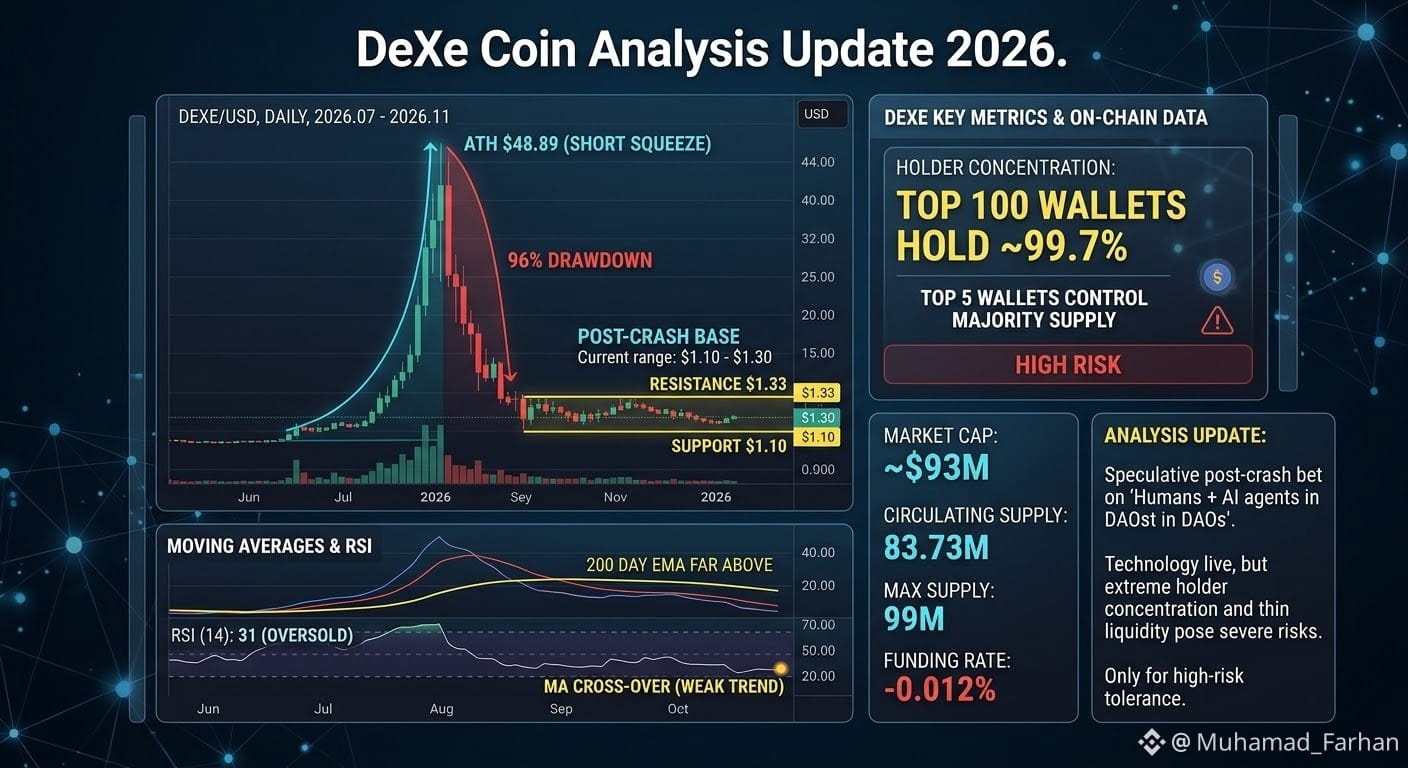
Market Cap / Rank: ~$91M–$93.5M (#169 on CoinMarketCap)
Supply: ~83.73M DEXE circulating out of a 99M max supply (~84.6% unlocked)
24h Volume: ~$7.3M–$10.5M across spot and futures markets
Futures Positioning: Open interest sits near $8.61M (-8.2% 24h), with OI-weighted funding rates slightly negative at -0.0121% (-13.3% annualized). Over the past 24 hours, long liquidations accounted for ~99% of flushed positions ($43.85K), showing weak spot follow-through and net taker selling.
Technical Setup
Support & Resistance: Price is testing immediate support right around $1.06–$1.10 (24h low at $1.104). Overhead, near-term liquidity clusters and a notable Binance spot sell wall sit around $1.325–$1.33 (~20% above current levels), with an intermediate long liquidation cluster near $1.20.
Momentum & Trend: The broader trend remains bearish—DEXE is trading ~88.5% below its downward-sloping 200-day moving average. However, the daily RSI is sitting at ~31.8 (approaching oversold territory) with early signs of bullish divergence on lower timeframes, suggesting sellers may be losing steam near the $1.05–$1.10 floor.
Fundamental & Risk Factors
Narrative & Utility: DeXe has positioned itself around decentralized DAO infrastructure and programmable governance for human-AI agent collaboration across Ethereum and BNB Smart Chain.
Key Risks: Supply concentration remains extreme—on-chain trackers note the top 100 Ethereum wallets hold roughly 99.78% of the supply (including exchange, bridge, and protocol custody), creating sharp volatility and liquidity-gap risks similar to the July 2026 short-squeeze and subsequent 96%+ collapse. Additionally, verified protocol fee/revenue capture remains opaque compared to direct competitors like Aragon, Safe, and Snapshot.
#sagateembinancesqure👍 #WhatWillDriveCryptoandStocks’NextRebound? #TradFiForBeginners #WORPTLetsTouristsConvertCryptoToThaiBaht #WhoWillSucceedJensenHuangatNvidia?
$DEXE $BTC $SAGA
Market & Derivatives Snapshot
Market Cap / Rank: ~$91M–$93.5M (#169 on CoinMarketCap)
Supply: ~83.73M DEXE circulating out of a 99M max supply (~84.6% unlocked)
24h Volume: ~$7.3M–$10.5M across spot and futures markets
Futures Positioning: Open interest sits near $8.61M (-8.2% 24h), with OI-weighted funding rates slightly negative at -0.0121% (-13.3% annualized). Over the past 24 hours, long liquidations accounted for ~99% of flushed positions ($43.85K), showing weak spot follow-through and net taker selling.
Technical Setup
Support & Resistance: Price is testing immediate support right around $1.06–$1.10 (24h low at $1.104). Overhead, near-term liquidity clusters and a notable Binance spot sell wall sit around $1.325–$1.33 (~20% above current levels), with an intermediate long liquidation cluster near $1.20.
Momentum & Trend: The broader trend remains bearish—DEXE is trading ~88.5% below its downward-sloping 200-day moving average. However, the daily RSI is sitting at ~31.8 (approaching oversold territory) with early signs of bullish divergence on lower timeframes, suggesting sellers may be losing steam near the $1.05–$1.10 floor.
Fundamental & Risk Factors
Narrative & Utility: DeXe has positioned itself around decentralized DAO infrastructure and programmable governance for human-AI agent collaboration across Ethereum and BNB Smart Chain.
Key Risks: Supply concentration remains extreme—on-chain trackers note the top 100 Ethereum wallets hold roughly 99.78% of the supply (including exchange, bridge, and protocol custody), creating sharp volatility and liquidity-gap risks similar to the July 2026 short-squeeze and subsequent 96%+ collapse. Additionally, verified protocol fee/revenue capture remains opaque compared to direct competitors like Aragon, Safe, and Snapshot.
#sagateembinancesqure👍 #WhatWillDriveCryptoandStocks’NextRebound? #TradFiForBeginners #WORPTLetsTouristsConvertCryptoToThaiBaht #WhoWillSucceedJensenHuangatNvidia?
Market & Derivatives Snapshot
Market Cap / Rank: ~$91M–$93.5M (#169 on CoinMarketCap)
Supply: ~83.73M DEXE circulating out of a 99M max supply (~84.6% unlocked)
24h Volume: ~$7.3M–$10.5M across spot and futures markets
Futures Positioning: Open interest sits near $8.61M (-8.2% 24h), with OI-weighted funding rates slightly negative at -0.0121% (-13.3% annualized). Over the past 24 hours, long liquidations accounted for ~99% of flushed positions ($43.85K), showing weak spot follow-through and net taker selling.
Technical Setup
Support & Resistance: Price is testing immediate support right around $1.06–$1.10 (24h low at $1.104). Overhead, near-term liquidity clusters and a notable Binance spot sell wall sit around $1.325–$1.33 (~20% above current levels), with an intermediate long liquidation cluster near $1.20.
Momentum & Trend: The broader trend remains bearish—DEXE is trading ~88.5% below its downward-sloping 200-day moving average. However, the daily RSI is sitting at ~31.8 (approaching oversold territory) with early signs of bullish divergence on lower timeframes, suggesting sellers may be losing steam near the $1.05–$1.10 floor.
Fundamental & Risk Factors
Narrative & Utility: DeXe has positioned itself around decentralized DAO infrastructure and programmable governance for human-AI agent collaboration across Ethereum and BNB Smart Chain.
Key Risks: Supply concentration remains extreme—on-chain trackers note the top 100 Ethereum wallets hold roughly 99.78% of the supply (including exchange, bridge, and protocol custody), creating sharp volatility and liquidity-gap risks similar to the July 2026 short-squeeze and subsequent 96%+ collapse. Additionally, verified protocol fee/revenue capture remains opaque compared to direct competitors like Aragon, Safe, and Snapshot.
#sagateembinancesqure👍 #WhatWillDriveCryptoandStocks’NextRebound? #TradFiForBeginners #WORPTLetsTouristsConvertCryptoToThaiBaht #WhoWillSucceedJensenHuangatNvidia?
1
853
$XRP $BTC $DEXE Market Snapshot & Price Action
Current Price: ~$0.99 USD / 3.64 AED
Monthly Performance: Down ~20.6% since November 1 (from 4.59 AED to 3.64 AED), extending October's 16% pullback.
Momentum (4H RSI): Sitting near 32.3, hovering just above oversold territory (30), signaling exhausted short-term selling but lacking a confirmed reversal trigger.
Primary Market Drivers
Long Liquidation Cascade: Over $18.8 million in XRP positions were liquidated in the past 24 hours—94% of which were leveraged longs—accelerating the slip below $1.00.
Macro & Broad Market Drag: Hotter-than-expected U.S. inflation data (November 10 CPI) pushed interest rate expectations higher, dragging Bitcoin below $70,000 and pushing the Crypto Fear & Greed Index into fear territory (~28).
Institutional & Ecosystem Flows: U.S. spot XRP ETFs saw minor net outflows of $1.09 million on November 13 (though cumulative net inflows remain strong at $1.79 billion). On the adoption front, Ripple expanded its Water.org partnership with a $6 million commitment utilizing RLUSD for cross-border microloan settlements.
Outlook: Bulls need a decisive daily close back above $1.00 (3.67 AED) alongside a Bitcoin recovery above $70,000 to avoid a deeper slide toward $0.95 or $0.80.
{spot}(XRPUSDT)
{spot}(BTCUSDT)
{spot}(DEXEUSDT)
#sagateembinancesqure👍 #USPPIMissMayEaseBTCPressure #BitcoinCoreDisclosesTorTrafficVulnerability #Binance
$XRP $BTC $DEXE Market Snapshot & Price Action
Current Price: ~$0.99 USD / 3.64 AED
Monthly Performance: Down ~20.6% since November 1 (from 4.59 AED to 3.64 AED), extending October's 16% pullback.
Momentum (4H RSI): Sitting near 32.3, hovering just above oversold territory (30), signaling exhausted short-term selling but lacking a confirmed reversal trigger.
Primary Market Drivers
Long Liquidation Cascade: Over $18.8 million in XRP positions were liquidated in the past 24 hours—94% of which were leveraged longs—accelerating the slip below $1.00.
Macro & Broad Market Drag: Hotter-than-expected U.S. inflation data (November 10 CPI) pushed interest rate expectations higher, dragging Bitcoin below $70,000 and pushing the Crypto Fear & Greed Index into fear territory (~28).
Institutional & Ecosystem Flows: U.S. spot XRP ETFs saw minor net outflows of $1.09 million on November 13 (though cumulative net inflows remain strong at $1.79 billion). On the adoption front, Ripple expanded its Water.org partnership with a $6 million commitment utilizing RLUSD for cross-border microloan settlements.
Outlook: Bulls need a decisive daily close back above $1.00 (3.67 AED) alongside a Bitcoin recovery above $70,000 to avoid a deeper slide toward $0.95 or $0.80.
#sagateembinancesqure👍 #USPPIMissMayEaseBTCPressure #BitcoinCoreDisclosesTorTrafficVulnerability #Binance
Current Price: ~$0.99 USD / 3.64 AED
Monthly Performance: Down ~20.6% since November 1 (from 4.59 AED to 3.64 AED), extending October's 16% pullback.
Momentum (4H RSI): Sitting near 32.3, hovering just above oversold territory (30), signaling exhausted short-term selling but lacking a confirmed reversal trigger.
Primary Market Drivers
Long Liquidation Cascade: Over $18.8 million in XRP positions were liquidated in the past 24 hours—94% of which were leveraged longs—accelerating the slip below $1.00.
Macro & Broad Market Drag: Hotter-than-expected U.S. inflation data (November 10 CPI) pushed interest rate expectations higher, dragging Bitcoin below $70,000 and pushing the Crypto Fear & Greed Index into fear territory (~28).
Institutional & Ecosystem Flows: U.S. spot XRP ETFs saw minor net outflows of $1.09 million on November 13 (though cumulative net inflows remain strong at $1.79 billion). On the adoption front, Ripple expanded its Water.org partnership with a $6 million commitment utilizing RLUSD for cross-border microloan settlements.
Outlook: Bulls need a decisive daily close back above $1.00 (3.67 AED) alongside a Bitcoin recovery above $70,000 to avoid a deeper slide toward $0.95 or $0.80.
#sagateembinancesqure👍 #USPPIMissMayEaseBTCPressure #BitcoinCoreDisclosesTorTrafficVulnerability #Binance

796
·
--
Bearish
$XRP $BTC $DEXE
{spot}(XRPUSDT)
{spot}(BTCUSDT)
{spot}(DEXEUSDT)
XRP is currently facing intense downward pressure, hovering right around the critical $1.00 psychological support zone.
Key Technical & Market Breakdown
Price Action & Support: XRP has slid significantly over the past couple of weeks, dropping closer to the crucial $1.00 line. Breaching this level cleanly would risk retesting the year-to-date lows established back in August (~$0.99). Immediate overhead resistance sits near $1.08, with broader trend reversal hurdles higher up around $1.21–$1.27.
Momentum & Indicators:
RSI (Relative Strength Index): Sunk deep into oversold territory (dropping near the low 20s), signaling extreme short-term exhaustion among sellers.
MACD & MAs: Bearish structure remains intact as price trades well below key Exponential Moving Averages (EMAs), reflecting short-term control by sellers.
Market Sentiment & Supply Dynamics:
Spot ETF products have experienced cooling institutional demand with multi-million dollar net outflows and a lack of fresh inflows through November.
Exchange inflows have picked up (with hundreds of millions of coins moving to exchanges), keeping retail distribution pressure elevated.
Market-wide sentiment remains cautious ("fear" zone), putting a dampener on risk-on digital assets.#sagateembinancesqure👍 #BitcoinBreaksBelow200WeekMovingAverage #SpaceXTeslaMergerTalksWouldCombine30220BTC #Anthropic’s6xIPODemandSignalsPotentialRecordRaise #RippleRLUSDMarketCapSurpassesPayPalPYUSD
$XRP $BTC $DEXE
XRP is currently facing intense downward pressure, hovering right around the critical $1.00 psychological support zone.
Key Technical & Market Breakdown
Price Action & Support: XRP has slid significantly over the past couple of weeks, dropping closer to the crucial $1.00 line. Breaching this level cleanly would risk retesting the year-to-date lows established back in August (~$0.99). Immediate overhead resistance sits near $1.08, with broader trend reversal hurdles higher up around $1.21–$1.27.
Momentum & Indicators:
RSI (Relative Strength Index): Sunk deep into oversold territory (dropping near the low 20s), signaling extreme short-term exhaustion among sellers.
MACD & MAs: Bearish structure remains intact as price trades well below key Exponential Moving Averages (EMAs), reflecting short-term control by sellers.
Market Sentiment & Supply Dynamics:
Spot ETF products have experienced cooling institutional demand with multi-million dollar net outflows and a lack of fresh inflows through November.
Exchange inflows have picked up (with hundreds of millions of coins moving to exchanges), keeping retail distribution pressure elevated.
Market-wide sentiment remains cautious ("fear" zone), putting a dampener on risk-on digital assets.#sagateembinancesqure👍 #BitcoinBreaksBelow200WeekMovingAverage #SpaceXTeslaMergerTalksWouldCombine30220BTC #Anthropic’s6xIPODemandSignalsPotentialRecordRaise #RippleRLUSDMarketCapSurpassesPayPalPYUSD
XRP is currently facing intense downward pressure, hovering right around the critical $1.00 psychological support zone.
Key Technical & Market Breakdown
Price Action & Support: XRP has slid significantly over the past couple of weeks, dropping closer to the crucial $1.00 line. Breaching this level cleanly would risk retesting the year-to-date lows established back in August (~$0.99). Immediate overhead resistance sits near $1.08, with broader trend reversal hurdles higher up around $1.21–$1.27.
Momentum & Indicators:
RSI (Relative Strength Index): Sunk deep into oversold territory (dropping near the low 20s), signaling extreme short-term exhaustion among sellers.
MACD & MAs: Bearish structure remains intact as price trades well below key Exponential Moving Averages (EMAs), reflecting short-term control by sellers.
Market Sentiment & Supply Dynamics:
Spot ETF products have experienced cooling institutional demand with multi-million dollar net outflows and a lack of fresh inflows through November.
Exchange inflows have picked up (with hundreds of millions of coins moving to exchanges), keeping retail distribution pressure elevated.
Market-wide sentiment remains cautious ("fear" zone), putting a dampener on risk-on digital assets.#sagateembinancesqure👍 #BitcoinBreaksBelow200WeekMovingAverage #SpaceXTeslaMergerTalksWouldCombine30220BTC #Anthropic’s6xIPODemandSignalsPotentialRecordRaise #RippleRLUSDMarketCapSurpassesPayPalPYUSD

585
·
--
Bearish
Verified
$BTC $DEXE $SAGA
{spot}(BTCUSDT)
{spot}(DEXEUSDT)
{spot}(SAGAUSDT)
Bitcoin (BTC) Market Update — November 13, 2026
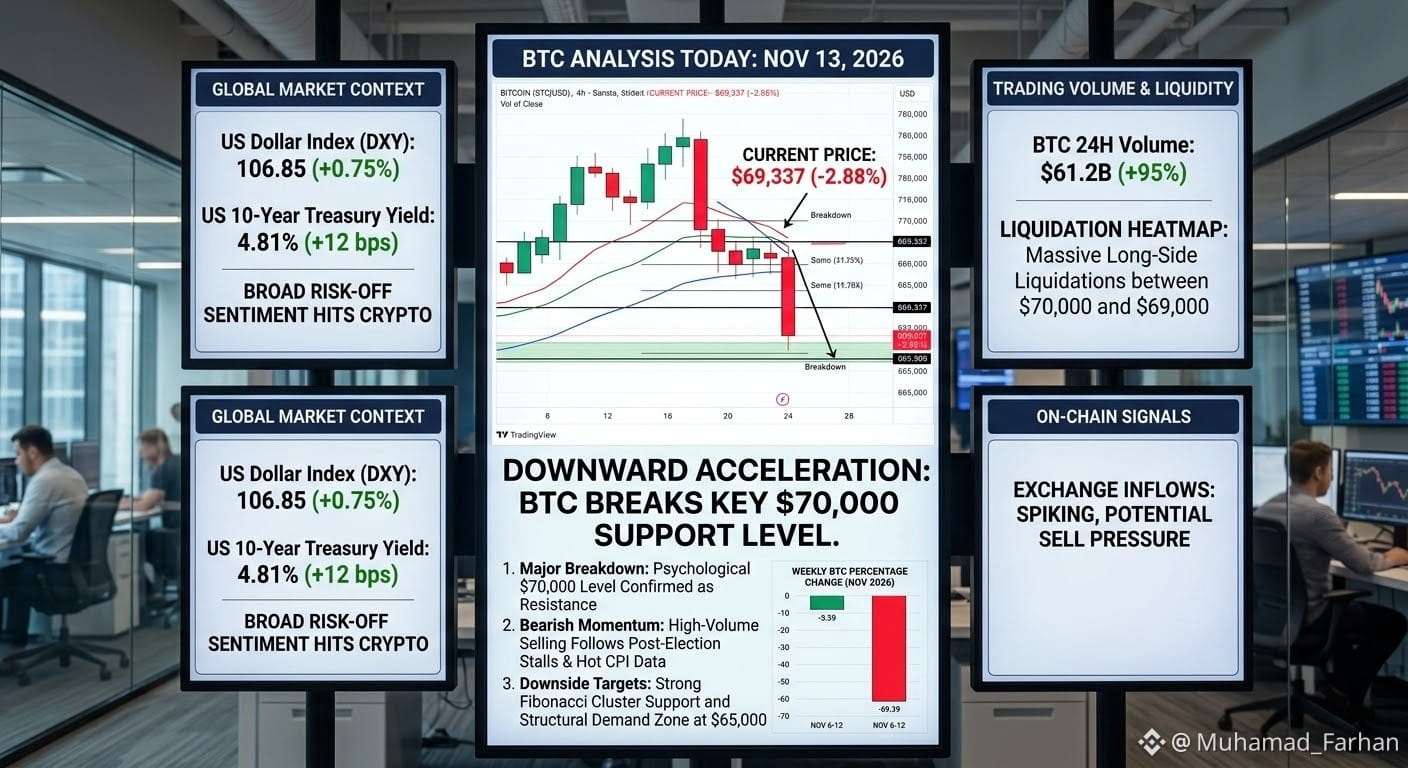
Current Price: $69,337 (~254,391 AED), sliding sharply below the $70,000 psychological threshold after opening the UTC session near $71,390 (-2.88% intraday).
Short-Term Trend: Strongly bearish across 1H and 4H timeframes, extending a five-week downtrend from early-November highs near $80,400 (295,284 AED).
Immediate Support: $68,500 – $69,000 is currently being tested; a confirmed breakdown exposes the major structural demand zone at $65,000.
Key Resistance: $70,800 – $71,400 (intraday breakdown zone), followed by heavier supply at $73,000 – $75,000, which bulls must reclaim to neutralize downside momentum.
Market Drivers: Broad risk-off sentiment driven by hotter-than-expected U.S. CPI data, surging Treasury yields, a hawkish Federal Reserve stance, and stalled U.S. crypto legislation following the midterm elections.
Outlook: Momentum favors sellers while price remains capped under $71,000; watch for volume-backed stabilization around $68,500 or a deeper liquidity sweep toward $65,000.
#Bitcoinsqurefaimly #TradFiForBeginners #ChipStocksExtendLossesAfterNvidiaCEOChange #binanacesquare #AnthropicRejectsIPODelayValuationinQuestion
$BTC $DEXE $SAGA
Bitcoin (BTC) Market Update — November 13, 2026
Current Price: $69,337 (~254,391 AED), sliding sharply below the $70,000 psychological threshold after opening the UTC session near $71,390 (-2.88% intraday).
Short-Term Trend: Strongly bearish across 1H and 4H timeframes, extending a five-week downtrend from early-November highs near $80,400 (295,284 AED).
Immediate Support: $68,500 – $69,000 is currently being tested; a confirmed breakdown exposes the major structural demand zone at $65,000.
Key Resistance: $70,800 – $71,400 (intraday breakdown zone), followed by heavier supply at $73,000 – $75,000, which bulls must reclaim to neutralize downside momentum.
Market Drivers: Broad risk-off sentiment driven by hotter-than-expected U.S. CPI data, surging Treasury yields, a hawkish Federal Reserve stance, and stalled U.S. crypto legislation following the midterm elections.
Outlook: Momentum favors sellers while price remains capped under $71,000; watch for volume-backed stabilization around $68,500 or a deeper liquidity sweep toward $65,000.
#Bitcoinsqurefaimly #TradFiForBeginners #ChipStocksExtendLossesAfterNvidiaCEOChange #binanacesquare #AnthropicRejectsIPODelayValuationinQuestion
Bitcoin (BTC) Market Update — November 13, 2026
Current Price: $69,337 (~254,391 AED), sliding sharply below the $70,000 psychological threshold after opening the UTC session near $71,390 (-2.88% intraday).
Short-Term Trend: Strongly bearish across 1H and 4H timeframes, extending a five-week downtrend from early-November highs near $80,400 (295,284 AED).
Immediate Support: $68,500 – $69,000 is currently being tested; a confirmed breakdown exposes the major structural demand zone at $65,000.
Key Resistance: $70,800 – $71,400 (intraday breakdown zone), followed by heavier supply at $73,000 – $75,000, which bulls must reclaim to neutralize downside momentum.
Market Drivers: Broad risk-off sentiment driven by hotter-than-expected U.S. CPI data, surging Treasury yields, a hawkish Federal Reserve stance, and stalled U.S. crypto legislation following the midterm elections.
Outlook: Momentum favors sellers while price remains capped under $71,000; watch for volume-backed stabilization around $68,500 or a deeper liquidity sweep toward $65,000.
#Bitcoinsqurefaimly #TradFiForBeginners #ChipStocksExtendLossesAfterNvidiaCEOChange #binanacesquare #AnthropicRejectsIPODelayValuationinQuestion
700
·
--
Bearish
Verified
$SAGA $BTC $DEXE
{spot}(SAGAUSDT)
{spot}(BTCUSDT)
{spot}(DEXEUSDT)
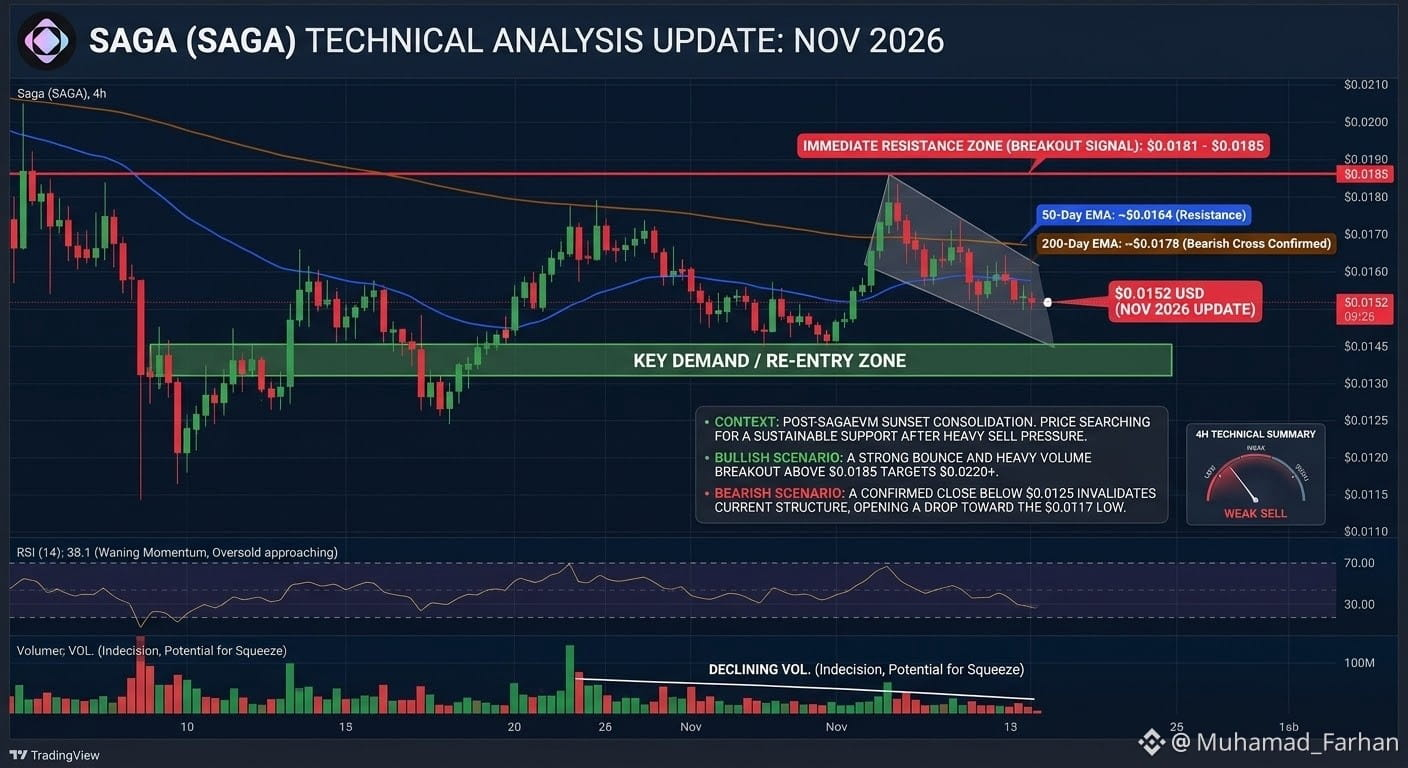
Saga (SAGA) Market & Technical Update (November 2026)
MetricCurrent ReadingSignal / ContextPrice Action~$0.0152 – $0.0157Bearish consolidation after failing to hold above $0.018014-Day RSI~38.1Neutral-to-weak momentum (approaching oversold territory)50-Day / 200-Day SMA$0.0220 / $0.0178Price trading below both major moving averages (Bearish structure)Key Support$0.0128 – $0.0130Primary demand floor; losing this opens a drop toward $0.0117Key Resistance$0.0178 – $0.0181Immediate breakout zone; needs to clear $0.0220 to flip mid-term trend
Fundamental & Market Catalysts
SagaEVM Sunset (Nov 23, 2026): Saga is deprecating its EVM chainlet environment on November 23 to focus resources on its core mainnet and Chainlet infrastructure. While streamlining development long-term, mandatory user asset migrations are creating near-term selling pressure.
Liquidity & Exchange Headwinds: Delistings of key spot pairs on major exchanges (such as Binance removing SAGA/FDUSD and Bitget delisting SAGA/USDT in September) have thinned order books, leaving the token vulnerable to sharper volatility on lower volume.
Ecosystem Recovery: Developer traction and TVL remain in recovery mode following the January 2026 SagaEVM exploit, though recent AI-agent infrastructure partnerships (such as KEX with Chrono Labs) aim to rebuild mainnet utility.#sagateembinancesqure👍 #TradFiForBeginners #USJoblessClaimsRise #MSCIRemovalMayCurbStrategy’sBitcoinBuying #CoreWeaveJumps10%On168%RevenueGrowth
$SAGA $BTC $DEXE
Saga (SAGA) Market & Technical Update (November 2026)
MetricCurrent ReadingSignal / ContextPrice Action~$0.0152 – $0.0157Bearish consolidation after failing to hold above $0.018014-Day RSI~38.1Neutral-to-weak momentum (approaching oversold territory)50-Day / 200-Day SMA$0.0220 / $0.0178Price trading below both major moving averages (Bearish structure)Key Support$0.0128 – $0.0130Primary demand floor; losing this opens a drop toward $0.0117Key Resistance$0.0178 – $0.0181Immediate breakout zone; needs to clear $0.0220 to flip mid-term trend
Fundamental & Market Catalysts
SagaEVM Sunset (Nov 23, 2026): Saga is deprecating its EVM chainlet environment on November 23 to focus resources on its core mainnet and Chainlet infrastructure. While streamlining development long-term, mandatory user asset migrations are creating near-term selling pressure.
Liquidity & Exchange Headwinds: Delistings of key spot pairs on major exchanges (such as Binance removing SAGA/FDUSD and Bitget delisting SAGA/USDT in September) have thinned order books, leaving the token vulnerable to sharper volatility on lower volume.
Ecosystem Recovery: Developer traction and TVL remain in recovery mode following the January 2026 SagaEVM exploit, though recent AI-agent infrastructure partnerships (such as KEX with Chrono Labs) aim to rebuild mainnet utility.#sagateembinancesqure👍 #TradFiForBeginners #USJoblessClaimsRise #MSCIRemovalMayCurbStrategy’sBitcoinBuying #CoreWeaveJumps10%On168%RevenueGrowth
Saga (SAGA) Market & Technical Update (November 2026)
MetricCurrent ReadingSignal / ContextPrice Action~$0.0152 – $0.0157Bearish consolidation after failing to hold above $0.018014-Day RSI~38.1Neutral-to-weak momentum (approaching oversold territory)50-Day / 200-Day SMA$0.0220 / $0.0178Price trading below both major moving averages (Bearish structure)Key Support$0.0128 – $0.0130Primary demand floor; losing this opens a drop toward $0.0117Key Resistance$0.0178 – $0.0181Immediate breakout zone; needs to clear $0.0220 to flip mid-term trend
Fundamental & Market Catalysts
SagaEVM Sunset (Nov 23, 2026): Saga is deprecating its EVM chainlet environment on November 23 to focus resources on its core mainnet and Chainlet infrastructure. While streamlining development long-term, mandatory user asset migrations are creating near-term selling pressure.
Liquidity & Exchange Headwinds: Delistings of key spot pairs on major exchanges (such as Binance removing SAGA/FDUSD and Bitget delisting SAGA/USDT in September) have thinned order books, leaving the token vulnerable to sharper volatility on lower volume.
Ecosystem Recovery: Developer traction and TVL remain in recovery mode following the January 2026 SagaEVM exploit, though recent AI-agent infrastructure partnerships (such as KEX with Chrono Labs) aim to rebuild mainnet utility.#sagateembinancesqure👍 #TradFiForBeginners #USJoblessClaimsRise #MSCIRemovalMayCurbStrategy’sBitcoinBuying #CoreWeaveJumps10%On168%RevenueGrowth
1
803
$SAGA $BTC $DEXE
{spot}(SAGAUSDT)
{spot}(BTCUSDT)
{spot}(DEXEUSDT)
(SAGA) is trading in a tight consolidation range near $0.0155–$0.0160 (market cap ~$6.5M–$7.1M, rank ~#1,042). After a steep year-to-date drawdown (~72%–75% YTD), price action is compressed near historical lows, creating a high-volatility setup around immediate micro-range boundaries.
Market & Technical Breakdown
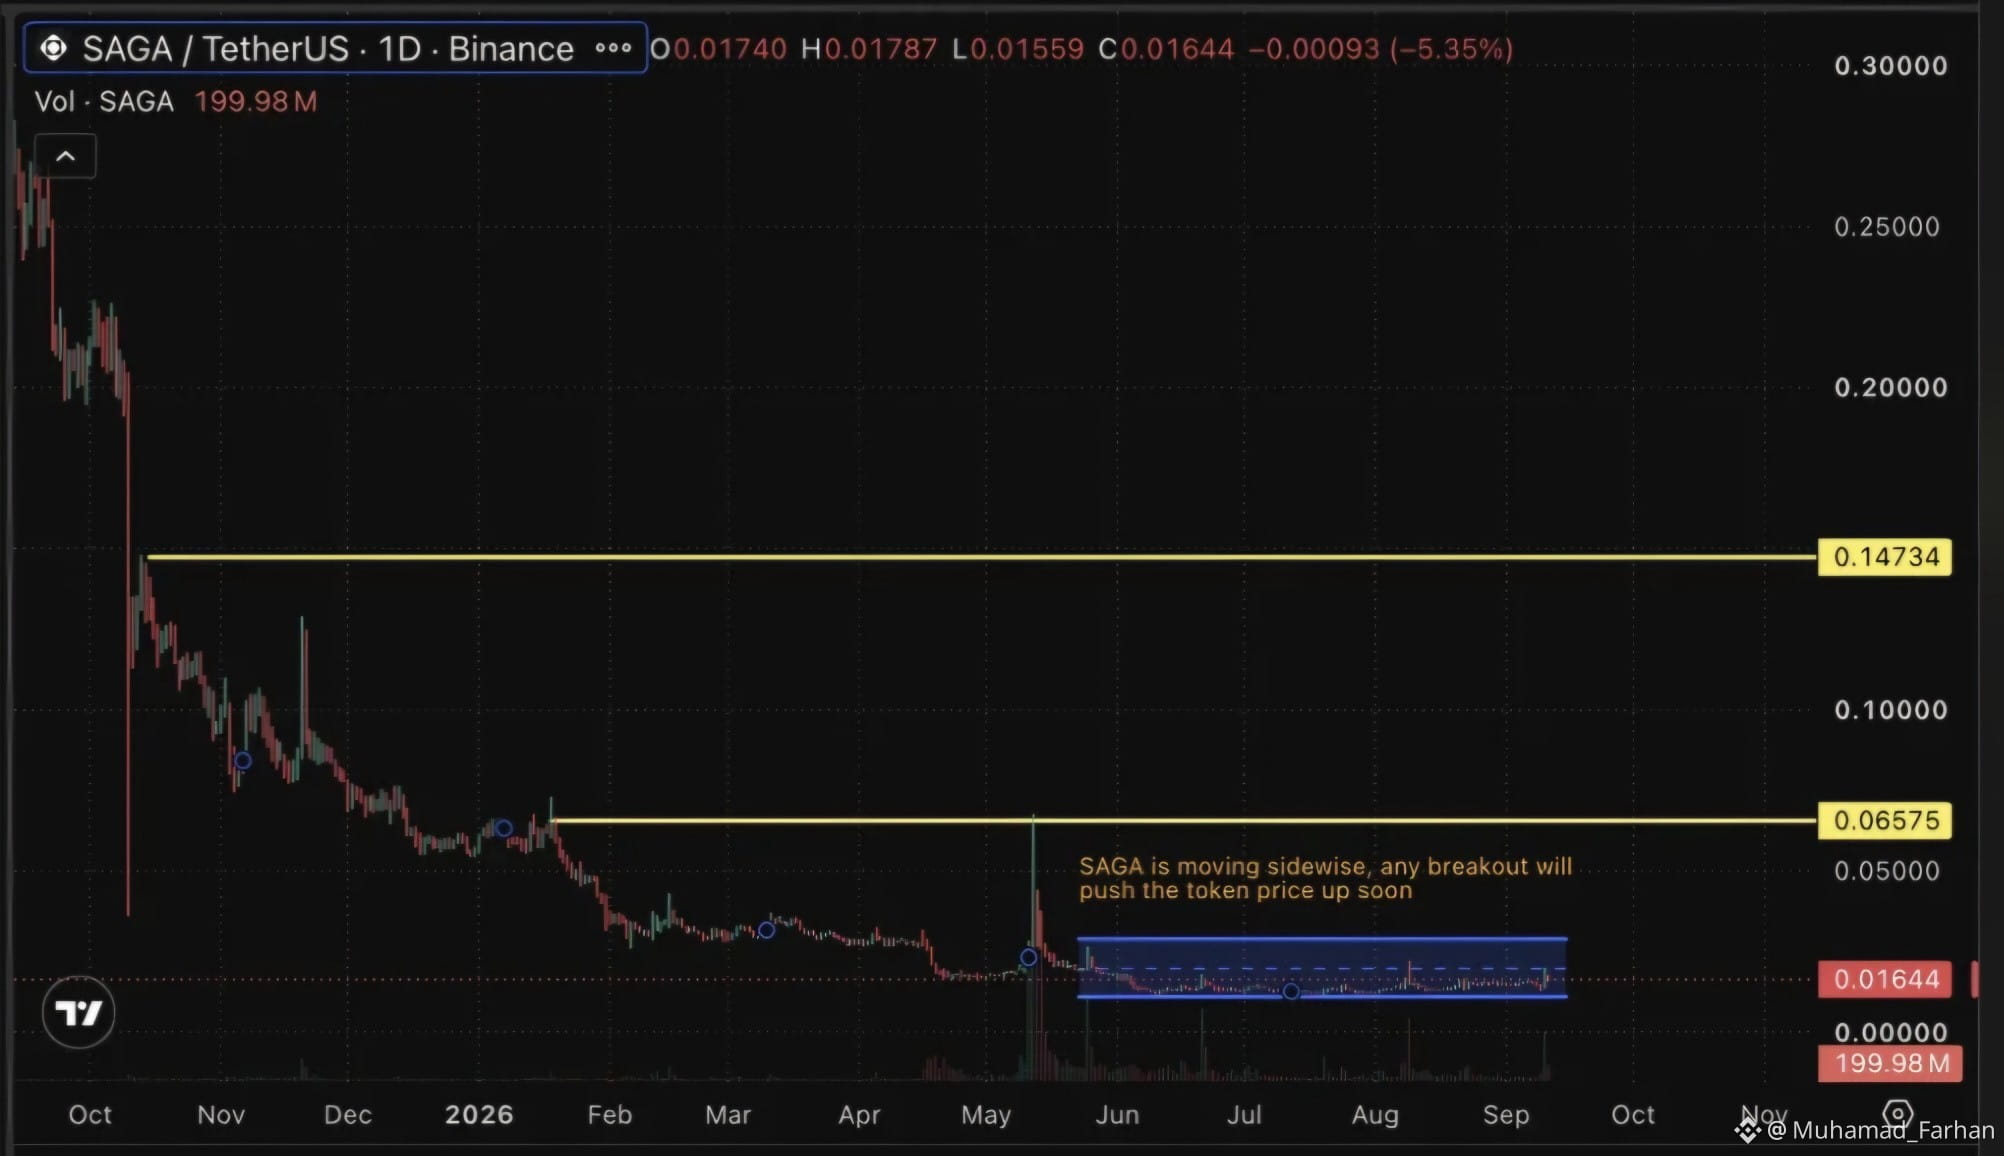
Macro Trend (1D / 1W): Strongly bearish overall. As shown on the daily structure, SAGA has compressed into a prolonged sideways base following its decline from the $0.147–$0.300 zone, leaving major overhead supply at $0.0657 and $0.1473.
Short-Term Structure (1H / 4H): Ranging between $0.0150 and $0.0182. Intraday oscillators frequently flash short-term bounces on volume spikes, while higher-timeframe moving averages (50-day at ~$0.0164 and 200-day) continue to cap sustained rallies.
Volume & Catalyst Watch: Daily spot volume fluctuates sharply ($3.5M–$9M baseline, with occasional spikes above $19M), signaling speculative rotation rather than steady accumulation. Traders are also monitoring ecosystem shifts, including the scheduled SagaEVM shutdown on November 23, 2026 (while core Chainlet mainnet operations continue) and AI-agent integrations via KEX.
Key Price Levels
Zone TypePrice LevelTechnical SignificanceMacro Resistance$0.0445 – $0.0658Major breakdown origin; requires sustained volume to reclaim.Range Resistance$0.0180 – $0.0185Immediate ceiling; breaking and holding above flips 4H structure bullish.Current Pivot$0.0155 – $0.016450-day MA and mid-range equilibrium.Immediate Support$0.0147 – $0.0150Short-term demand floor and recent swing low defense.Critical Floor$0.0117 – $0.012052-week low; losing this level opens price discovery to the downside.
Interactive Price Range & Position Visualizer
Explore how SAGA's current price sits relative to its immediate support/resistance levels and macro recovery targets:
#sagateembinancesqure👍 #AnthropicRejectsIPODelayValuationinQuestion #HotCPIDecemberHikePriced #CoreWeaveJumps10%On168%RevenueGrowth #Binance
$SAGA $BTC $DEXE
(SAGA) is trading in a tight consolidation range near $0.0155–$0.0160 (market cap ~$6.5M–$7.1M, rank ~#1,042). After a steep year-to-date drawdown (~72%–75% YTD), price action is compressed near historical lows, creating a high-volatility setup around immediate micro-range boundaries.
Market & Technical Breakdown
Macro Trend (1D / 1W): Strongly bearish overall. As shown on the daily structure, SAGA has compressed into a prolonged sideways base following its decline from the $0.147–$0.300 zone, leaving major overhead supply at $0.0657 and $0.1473.
Short-Term Structure (1H / 4H): Ranging between $0.0150 and $0.0182. Intraday oscillators frequently flash short-term bounces on volume spikes, while higher-timeframe moving averages (50-day at ~$0.0164 and 200-day) continue to cap sustained rallies.
Volume & Catalyst Watch: Daily spot volume fluctuates sharply ($3.5M–$9M baseline, with occasional spikes above $19M), signaling speculative rotation rather than steady accumulation. Traders are also monitoring ecosystem shifts, including the scheduled SagaEVM shutdown on November 23, 2026 (while core Chainlet mainnet operations continue) and AI-agent integrations via KEX.
Key Price Levels
Zone TypePrice LevelTechnical SignificanceMacro Resistance$0.0445 – $0.0658Major breakdown origin; requires sustained volume to reclaim.Range Resistance$0.0180 – $0.0185Immediate ceiling; breaking and holding above flips 4H structure bullish.Current Pivot$0.0155 – $0.016450-day MA and mid-range equilibrium.Immediate Support$0.0147 – $0.0150Short-term demand floor and recent swing low defense.Critical Floor$0.0117 – $0.012052-week low; losing this level opens price discovery to the downside.
Interactive Price Range & Position Visualizer
Explore how SAGA's current price sits relative to its immediate support/resistance levels and macro recovery targets:
#sagateembinancesqure👍 #AnthropicRejectsIPODelayValuationinQuestion #HotCPIDecemberHikePriced #CoreWeaveJumps10%On168%RevenueGrowth #Binance
(SAGA) is trading in a tight consolidation range near $0.0155–$0.0160 (market cap ~$6.5M–$7.1M, rank ~#1,042). After a steep year-to-date drawdown (~72%–75% YTD), price action is compressed near historical lows, creating a high-volatility setup around immediate micro-range boundaries.
Market & Technical Breakdown
Macro Trend (1D / 1W): Strongly bearish overall. As shown on the daily structure, SAGA has compressed into a prolonged sideways base following its decline from the $0.147–$0.300 zone, leaving major overhead supply at $0.0657 and $0.1473.
Short-Term Structure (1H / 4H): Ranging between $0.0150 and $0.0182. Intraday oscillators frequently flash short-term bounces on volume spikes, while higher-timeframe moving averages (50-day at ~$0.0164 and 200-day) continue to cap sustained rallies.
Volume & Catalyst Watch: Daily spot volume fluctuates sharply ($3.5M–$9M baseline, with occasional spikes above $19M), signaling speculative rotation rather than steady accumulation. Traders are also monitoring ecosystem shifts, including the scheduled SagaEVM shutdown on November 23, 2026 (while core Chainlet mainnet operations continue) and AI-agent integrations via KEX.
Key Price Levels
Zone TypePrice LevelTechnical SignificanceMacro Resistance$0.0445 – $0.0658Major breakdown origin; requires sustained volume to reclaim.Range Resistance$0.0180 – $0.0185Immediate ceiling; breaking and holding above flips 4H structure bullish.Current Pivot$0.0155 – $0.016450-day MA and mid-range equilibrium.Immediate Support$0.0147 – $0.0150Short-term demand floor and recent swing low defense.Critical Floor$0.0117 – $0.012052-week low; losing this level opens price discovery to the downside.
Interactive Price Range & Position Visualizer
Explore how SAGA's current price sits relative to its immediate support/resistance levels and macro recovery targets:
#sagateembinancesqure👍 #AnthropicRejectsIPODelayValuationinQuestion #HotCPIDecemberHikePriced #CoreWeaveJumps10%On168%RevenueGrowth #Binance
85
Verified
$SAGA $BTC $DEXE
{spot}(SAGAUSDT)
{spot}(BTCUSDT)
{spot}(DEXEUSDT)
Saga (SAGA) provides cloud-style blockchain provisioning by acting as an automated L1 layer that launches dedicated, VM-agnostic application chains.
Architectural & Economic Model
Automated Chainlets: Developers spin up single-tenant app-chains without having to manage their own consensus engines or validator sets.
Gas-Free End-User Experience: The tokenomics split user interaction from back-end infrastructure fees. Users do not pay network fees in SAGA; developers pay validators in SAGA to maintain their Chainlet, while retaining total freedom on front-end monetization.
Shared Cosmos Security: Powered by Cosmos SDK and Interchain Security, Chainlets inherit security from Saga Mainnet and maintain native interoperability via IBC.
Current Market & Token Distribution MetricsCore Strengths vs. Major Risks
Strengths:
Eliminates onboarding friction for Web3 gaming and consumer apps through invisible gas fees.
Elastic scaling prevents performance bottlenecks caused by activity on neighboring applications.
Risks:
Persistent structural sell pressure from multi-year linear unlocks across contributor and private investor tranches.
Direct competition from alternative modular deployment frameworks (e.g., Celestia rollups, Dymension, AltLayer).
#sagateembinancesqure👍 #AnthropicRejectsIPODelayValuationinQuestion #HotCPIDecemberHikePriced #TradFiForBeginners #CanNvidiaEarningsEaseMarketConcerns?
$SAGA $BTC $DEXE
Saga (SAGA) provides cloud-style blockchain provisioning by acting as an automated L1 layer that launches dedicated, VM-agnostic application chains.
Architectural & Economic Model
Automated Chainlets: Developers spin up single-tenant app-chains without having to manage their own consensus engines or validator sets.
Gas-Free End-User Experience: The tokenomics split user interaction from back-end infrastructure fees. Users do not pay network fees in SAGA; developers pay validators in SAGA to maintain their Chainlet, while retaining total freedom on front-end monetization.
Shared Cosmos Security: Powered by Cosmos SDK and Interchain Security, Chainlets inherit security from Saga Mainnet and maintain native interoperability via IBC.
Current Market & Token Distribution MetricsCore Strengths vs. Major Risks
Strengths:
Eliminates onboarding friction for Web3 gaming and consumer apps through invisible gas fees.
Elastic scaling prevents performance bottlenecks caused by activity on neighboring applications.
Risks:
Persistent structural sell pressure from multi-year linear unlocks across contributor and private investor tranches.
Direct competition from alternative modular deployment frameworks (e.g., Celestia rollups, Dymension, AltLayer).
#sagateembinancesqure👍 #AnthropicRejectsIPODelayValuationinQuestion #HotCPIDecemberHikePriced #TradFiForBeginners #CanNvidiaEarningsEaseMarketConcerns?
Saga (SAGA) provides cloud-style blockchain provisioning by acting as an automated L1 layer that launches dedicated, VM-agnostic application chains.
Architectural & Economic Model
Automated Chainlets: Developers spin up single-tenant app-chains without having to manage their own consensus engines or validator sets.
Gas-Free End-User Experience: The tokenomics split user interaction from back-end infrastructure fees. Users do not pay network fees in SAGA; developers pay validators in SAGA to maintain their Chainlet, while retaining total freedom on front-end monetization.
Shared Cosmos Security: Powered by Cosmos SDK and Interchain Security, Chainlets inherit security from Saga Mainnet and maintain native interoperability via IBC.
Current Market & Token Distribution MetricsCore Strengths vs. Major Risks
Strengths:
Eliminates onboarding friction for Web3 gaming and consumer apps through invisible gas fees.
Elastic scaling prevents performance bottlenecks caused by activity on neighboring applications.
Risks:
Persistent structural sell pressure from multi-year linear unlocks across contributor and private investor tranches.
Direct competition from alternative modular deployment frameworks (e.g., Celestia rollups, Dymension, AltLayer).
#sagateembinancesqure👍 #AnthropicRejectsIPODelayValuationinQuestion #HotCPIDecemberHikePriced #TradFiForBeginners #CanNvidiaEarningsEaseMarketConcerns?

704
$PEPE $BTC $SAGA
{spot}(PEPEUSDT)
{spot}(BTCUSDT)
{spot}(SAGAUSDT)
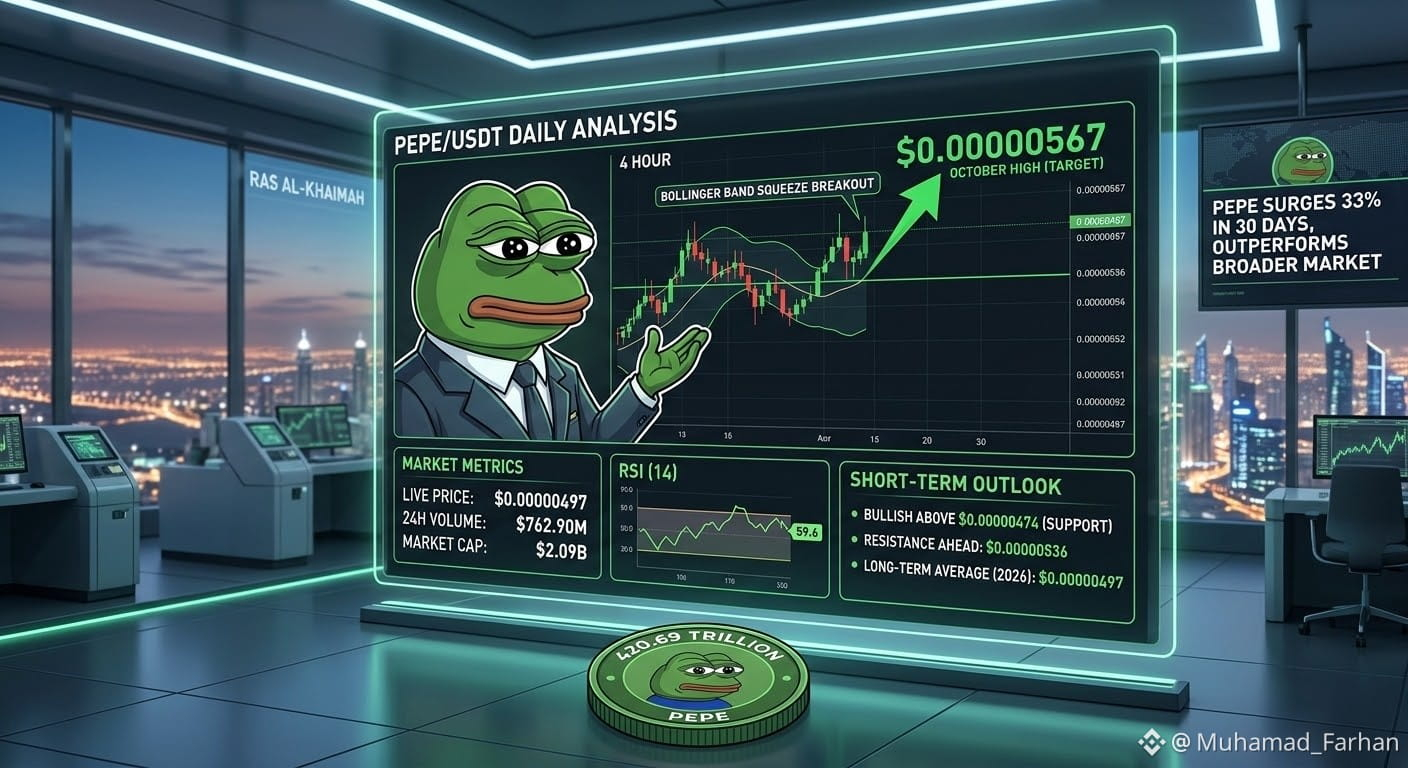
PEPE Technical Analysis Update (November 2026)
Current Price & Performance: PEPE is trading around $0.00000497 – $0.00000529, maintaining an overall +18% to +25% gain over the past 30 days despite short-term pullbacks.
Primary Support Confluence: The immediate line in the sand sits at $0.00000474 (the 20-day EMA). Secondary key structural support lies at $0.00000441 (50-day EMA).
Key Overhead Resistance: Multi-week resistance remains clustered between $0.00000536 and $0.00000540, with a major breakout target set at the late-October high of $0.00000567.
Market Dynamics: Derivatives volume has surged (up ~95%), accompanied by open interest around $317M–$372M. Short-term long liquidations have generated brief dips, but buyer demand continues to absorb corrections near the rising support trendline.
Bullish/Bearish Scenarios: Holding above $0.00000474 supports a retest of $0.00000567 and potentially psychological targets at $0.00000600. A daily close below $0.00000474 risks tests of lower trendline boundaries near $0.00000426 and $0.00000406 (100-day EMA).
#sagateembinancesqure👍 #HotCPIDecemberHikePriced #AnthropicRejectsIPODelayValuationinQuestion #CanNvidiaEarningsEaseMarketConcerns? #binanacesquarenews
$PEPE $BTC $SAGA
PEPE Technical Analysis Update (November 2026)
Current Price & Performance: PEPE is trading around $0.00000497 – $0.00000529, maintaining an overall +18% to +25% gain over the past 30 days despite short-term pullbacks.
Primary Support Confluence: The immediate line in the sand sits at $0.00000474 (the 20-day EMA). Secondary key structural support lies at $0.00000441 (50-day EMA).
Key Overhead Resistance: Multi-week resistance remains clustered between $0.00000536 and $0.00000540, with a major breakout target set at the late-October high of $0.00000567.
Market Dynamics: Derivatives volume has surged (up ~95%), accompanied by open interest around $317M–$372M. Short-term long liquidations have generated brief dips, but buyer demand continues to absorb corrections near the rising support trendline.
Bullish/Bearish Scenarios: Holding above $0.00000474 supports a retest of $0.00000567 and potentially psychological targets at $0.00000600. A daily close below $0.00000474 risks tests of lower trendline boundaries near $0.00000426 and $0.00000406 (100-day EMA).
#sagateembinancesqure👍 #HotCPIDecemberHikePriced #AnthropicRejectsIPODelayValuationinQuestion #CanNvidiaEarningsEaseMarketConcerns? #binanacesquarenews
PEPE Technical Analysis Update (November 2026)
Current Price & Performance: PEPE is trading around $0.00000497 – $0.00000529, maintaining an overall +18% to +25% gain over the past 30 days despite short-term pullbacks.
Primary Support Confluence: The immediate line in the sand sits at $0.00000474 (the 20-day EMA). Secondary key structural support lies at $0.00000441 (50-day EMA).
Key Overhead Resistance: Multi-week resistance remains clustered between $0.00000536 and $0.00000540, with a major breakout target set at the late-October high of $0.00000567.
Market Dynamics: Derivatives volume has surged (up ~95%), accompanied by open interest around $317M–$372M. Short-term long liquidations have generated brief dips, but buyer demand continues to absorb corrections near the rising support trendline.
Bullish/Bearish Scenarios: Holding above $0.00000474 supports a retest of $0.00000567 and potentially psychological targets at $0.00000600. A daily close below $0.00000474 risks tests of lower trendline boundaries near $0.00000426 and $0.00000406 (100-day EMA).
#sagateembinancesqure👍 #HotCPIDecemberHikePriced #AnthropicRejectsIPODelayValuationinQuestion #CanNvidiaEarningsEaseMarketConcerns? #binanacesquarenews
478
$PEPE $BTC $SAGA
{spot}(PEPEUSDT)
{spot}(BTCUSDT)
{spot}(SAGAUSDT)
PEPE is demonstrating relative strength against the broader crypto market. While major assets like Bitcoin have experienced short-term pullbacks, PEPE has posted a ~22% to 30% gain over the past month, outperforming top memecoin rivals like Dogecoin and Shiba Inu.
Key Technical Levels & Indicators
Current Price: Floating between $0.00000520 and $0.00000552 with a 24-hour trading volume surging past $680 million.
Immediate Support: $0.00000474 (20-day EMA). A daily close above this level keeps the near-term structure bullish.
Secondary Support: $0.00000441 (50-day EMA), followed by lower structural support around $0.00000406–$0.00000426.
Major Resistance: $0.00000565 – $0.00000567 (October high / upper trendline boundary).
Upside Target: Clearing resistance opens the path toward the $0.00000600 psychological boundary.
Core Catalysts & On-Chain Drivers
Whale Accumulation & Liquidity Resilience: Despite notable sell-offs—including a $31.7M sale linked to breach funds—buyers rapidly absorbed the supply, driving a sharp recovery. Heavy wallet transfers tied to major crypto entities (e.g., Justin Sun-linked addresses holding ~3% of supply) highlight significant whale participation.
Memecoin Capital Rotation: Capital is actively rotating away from lagging memecoins (SHIB, DOGE) directly into PEPE, driving PEPE’s 24-hour spot volume to temporarily flip Dogecoin.
ETF Speculation: Speculative interest remains supported by Canary Capital's spot PEPE ETF filing (under ongoing SEC review windows), serving as a medium-term narrative driver.
Summary Outlook
Bullish Scenario: Sustained closes above $0.00000474 pave the way for a retest of $0.00000567. Breaking this opens targets near $0.00000600+.
Bearish Scenario: Slipping below $0.00000474 signals loss of short-term momentum, exposing the $0.00000441 and $0.00000406 support zones.#sagateembinancesqure👍 #TrumpMediaAdds1510BTCInQ3 #BitcoinFiveWeeklyLosses #CanNvidiaEarningsEaseMarketConcerns? #HotCPIDecemberHikePriced
$PEPE $BTC $SAGA
PEPE is demonstrating relative strength against the broader crypto market. While major assets like Bitcoin have experienced short-term pullbacks, PEPE has posted a ~22% to 30% gain over the past month, outperforming top memecoin rivals like Dogecoin and Shiba Inu.
Key Technical Levels & Indicators
Current Price: Floating between $0.00000520 and $0.00000552 with a 24-hour trading volume surging past $680 million.
Immediate Support: $0.00000474 (20-day EMA). A daily close above this level keeps the near-term structure bullish.
Secondary Support: $0.00000441 (50-day EMA), followed by lower structural support around $0.00000406–$0.00000426.
Major Resistance: $0.00000565 – $0.00000567 (October high / upper trendline boundary).
Upside Target: Clearing resistance opens the path toward the $0.00000600 psychological boundary.
Core Catalysts & On-Chain Drivers
Whale Accumulation & Liquidity Resilience: Despite notable sell-offs—including a $31.7M sale linked to breach funds—buyers rapidly absorbed the supply, driving a sharp recovery. Heavy wallet transfers tied to major crypto entities (e.g., Justin Sun-linked addresses holding ~3% of supply) highlight significant whale participation.
Memecoin Capital Rotation: Capital is actively rotating away from lagging memecoins (SHIB, DOGE) directly into PEPE, driving PEPE’s 24-hour spot volume to temporarily flip Dogecoin.
ETF Speculation: Speculative interest remains supported by Canary Capital's spot PEPE ETF filing (under ongoing SEC review windows), serving as a medium-term narrative driver.
Summary Outlook
Bullish Scenario: Sustained closes above $0.00000474 pave the way for a retest of $0.00000567. Breaking this opens targets near $0.00000600+.
Bearish Scenario: Slipping below $0.00000474 signals loss of short-term momentum, exposing the $0.00000441 and $0.00000406 support zones.#sagateembinancesqure👍 #TrumpMediaAdds1510BTCInQ3 #BitcoinFiveWeeklyLosses #CanNvidiaEarningsEaseMarketConcerns? #HotCPIDecemberHikePriced
PEPE is demonstrating relative strength against the broader crypto market. While major assets like Bitcoin have experienced short-term pullbacks, PEPE has posted a ~22% to 30% gain over the past month, outperforming top memecoin rivals like Dogecoin and Shiba Inu.
Key Technical Levels & Indicators
Current Price: Floating between $0.00000520 and $0.00000552 with a 24-hour trading volume surging past $680 million.
Immediate Support: $0.00000474 (20-day EMA). A daily close above this level keeps the near-term structure bullish.
Secondary Support: $0.00000441 (50-day EMA), followed by lower structural support around $0.00000406–$0.00000426.
Major Resistance: $0.00000565 – $0.00000567 (October high / upper trendline boundary).
Upside Target: Clearing resistance opens the path toward the $0.00000600 psychological boundary.
Core Catalysts & On-Chain Drivers
Whale Accumulation & Liquidity Resilience: Despite notable sell-offs—including a $31.7M sale linked to breach funds—buyers rapidly absorbed the supply, driving a sharp recovery. Heavy wallet transfers tied to major crypto entities (e.g., Justin Sun-linked addresses holding ~3% of supply) highlight significant whale participation.
Memecoin Capital Rotation: Capital is actively rotating away from lagging memecoins (SHIB, DOGE) directly into PEPE, driving PEPE’s 24-hour spot volume to temporarily flip Dogecoin.
ETF Speculation: Speculative interest remains supported by Canary Capital's spot PEPE ETF filing (under ongoing SEC review windows), serving as a medium-term narrative driver.
Summary Outlook
Bullish Scenario: Sustained closes above $0.00000474 pave the way for a retest of $0.00000567. Breaking this opens targets near $0.00000600+.
Bearish Scenario: Slipping below $0.00000474 signals loss of short-term momentum, exposing the $0.00000441 and $0.00000406 support zones.#sagateembinancesqure👍 #TrumpMediaAdds1510BTCInQ3 #BitcoinFiveWeeklyLosses #CanNvidiaEarningsEaseMarketConcerns? #HotCPIDecemberHikePriced

2
730
$PEPE $BTC $SAGA
{spot}(PEPEUSDT)
{spot}(BTCUSDT)
{spot}(SAGAUSDT)
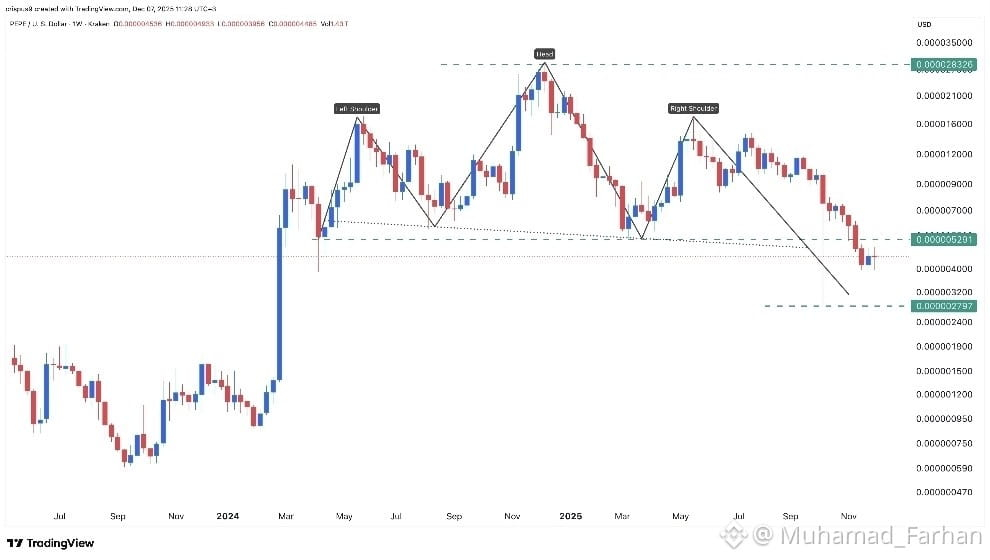
PEPE is showing relative strength against the broader crypto market slump. While major assets faced downside pressure, PEPE rebounded back above key moving averages, supported by derivatives volume and whale holding activity.
Key Technical Levels
Metric / LevelPrice / ValueContext & SignificanceCurrent Price~$0.00000506 – $0.00000530Holding above short-term EMAsPrimary Support$0.0000047420-day EMA; crucial level to keep bullish structure intactSecondary Support$0.0000044150-day EMA safety netImmediate Resistance$0.00000536September high breakout pointMajor Target$0.00000567Late-October wick high / upper boundary
Key Takeaways
Bullish Setup Above $0.00000474: The short-term structure remains positive as long as daily closes stay above the 20-day EMA ($0.00000474). A confirmed breakout above $0.00000536 opens the path to testing $0.00000567.
Elevated Derivatives Volume: Short-term liquidations tilted toward short positions during the recent push, signaling leverage-driven momentum.
Whale Cushion & External Catalysts: Spot market exchange netflows remain light compared to prior high-volatility waves, while pending external catalysts (such as spot ETF proposals under SEC review window) continue to act as speculative background drivers.
#sagateembinancesqure👍 #BitcoinFiveWeeklyLosses #TradFiForBeginners #ADPWeeklyEstimateShowsUSPrivatePayrollsUp19750 #ETH
$PEPE $BTC $SAGA
PEPE is showing relative strength against the broader crypto market slump. While major assets faced downside pressure, PEPE rebounded back above key moving averages, supported by derivatives volume and whale holding activity.
Key Technical Levels
Metric / LevelPrice / ValueContext & SignificanceCurrent Price~$0.00000506 – $0.00000530Holding above short-term EMAsPrimary Support$0.0000047420-day EMA; crucial level to keep bullish structure intactSecondary Support$0.0000044150-day EMA safety netImmediate Resistance$0.00000536September high breakout pointMajor Target$0.00000567Late-October wick high / upper boundary
Key Takeaways
Bullish Setup Above $0.00000474: The short-term structure remains positive as long as daily closes stay above the 20-day EMA ($0.00000474). A confirmed breakout above $0.00000536 opens the path to testing $0.00000567.
Elevated Derivatives Volume: Short-term liquidations tilted toward short positions during the recent push, signaling leverage-driven momentum.
Whale Cushion & External Catalysts: Spot market exchange netflows remain light compared to prior high-volatility waves, while pending external catalysts (such as spot ETF proposals under SEC review window) continue to act as speculative background drivers.
#sagateembinancesqure👍 #BitcoinFiveWeeklyLosses #TradFiForBeginners #ADPWeeklyEstimateShowsUSPrivatePayrollsUp19750 #ETH
PEPE is showing relative strength against the broader crypto market slump. While major assets faced downside pressure, PEPE rebounded back above key moving averages, supported by derivatives volume and whale holding activity.
Key Technical Levels
Metric / LevelPrice / ValueContext & SignificanceCurrent Price~$0.00000506 – $0.00000530Holding above short-term EMAsPrimary Support$0.0000047420-day EMA; crucial level to keep bullish structure intactSecondary Support$0.0000044150-day EMA safety netImmediate Resistance$0.00000536September high breakout pointMajor Target$0.00000567Late-October wick high / upper boundary
Key Takeaways
Bullish Setup Above $0.00000474: The short-term structure remains positive as long as daily closes stay above the 20-day EMA ($0.00000474). A confirmed breakout above $0.00000536 opens the path to testing $0.00000567.
Elevated Derivatives Volume: Short-term liquidations tilted toward short positions during the recent push, signaling leverage-driven momentum.
Whale Cushion & External Catalysts: Spot market exchange netflows remain light compared to prior high-volatility waves, while pending external catalysts (such as spot ETF proposals under SEC review window) continue to act as speculative background drivers.
#sagateembinancesqure👍 #BitcoinFiveWeeklyLosses #TradFiForBeginners #ADPWeeklyEstimateShowsUSPrivatePayrollsUp19750 #ETH
3
772
$DEXE $BTC $PEPE
{spot}(DEXEUSDT)
{spot}(BTCUSDT)
{spot}(PEPEUSDT)
DeXe ($DEXE) is consolidating in a lower range near $1.25 – $1.30 following a heavy structural distribution earlier in the year.
Technical Overview
Current Range & Momentum: Price action is consolidating between immediate local support at $1.23 – $1.25 and near-term overhead resistance around $1.34 – $1.35 (200-day SMA level). The 14-day RSI is sitting near neutral (~48–50), indicating a lack of directional bias on medium-to-high timeframes.
Volume Profile: 24-hour trading volume remains thin (~$2.5M – $6.5M across major exchanges), pointing to low institutional participation and heightened risk of slippage or sudden volatility spikes.
Macro Structure: DEXE remains down significantly (~80–90% lower) from its previous high timeframe swings. Higher timeframe simple moving averages (50-day SMA ~$1.55 – $1.69, 200-day SMA ~$9.89) reflect heavy structural overhead#sagateembinancesqure👍 #AIChipSlumpNasdaq #US-IranTalksFuelStrongStockMarketRebound #CanNvidiaEarningsEaseMarketConcerns? #Binance
$DEXE $BTC $PEPE
DeXe ($DEXE ) is consolidating in a lower range near $1.25 – $1.30 following a heavy structural distribution earlier in the year.
Technical Overview
Current Range & Momentum: Price action is consolidating between immediate local support at $1.23 – $1.25 and near-term overhead resistance around $1.34 – $1.35 (200-day SMA level). The 14-day RSI is sitting near neutral (~48–50), indicating a lack of directional bias on medium-to-high timeframes.
Volume Profile: 24-hour trading volume remains thin (~$2.5M – $6.5M across major exchanges), pointing to low institutional participation and heightened risk of slippage or sudden volatility spikes.
Macro Structure: DEXE remains down significantly (~80–90% lower) from its previous high timeframe swings. Higher timeframe simple moving averages (50-day SMA ~$1.55 – $1.69, 200-day SMA ~$9.89) reflect heavy structural overhead#sagateembinancesqure👍 #AIChipSlumpNasdaq #US-IranTalksFuelStrongStockMarketRebound #CanNvidiaEarningsEaseMarketConcerns? #Binance
DeXe ($DEXE ) is consolidating in a lower range near $1.25 – $1.30 following a heavy structural distribution earlier in the year.
Technical Overview
Current Range & Momentum: Price action is consolidating between immediate local support at $1.23 – $1.25 and near-term overhead resistance around $1.34 – $1.35 (200-day SMA level). The 14-day RSI is sitting near neutral (~48–50), indicating a lack of directional bias on medium-to-high timeframes.
Volume Profile: 24-hour trading volume remains thin (~$2.5M – $6.5M across major exchanges), pointing to low institutional participation and heightened risk of slippage or sudden volatility spikes.
Macro Structure: DEXE remains down significantly (~80–90% lower) from its previous high timeframe swings. Higher timeframe simple moving averages (50-day SMA ~$1.55 – $1.69, 200-day SMA ~$9.89) reflect heavy structural overhead#sagateembinancesqure👍 #AIChipSlumpNasdaq #US-IranTalksFuelStrongStockMarketRebound #CanNvidiaEarningsEaseMarketConcerns? #Binance

413
$DEXE $BTC $PEPE
{spot}(DEXEUSDT)
{spot}(BTCUSDT)
{spot}(PEPEUSDT)
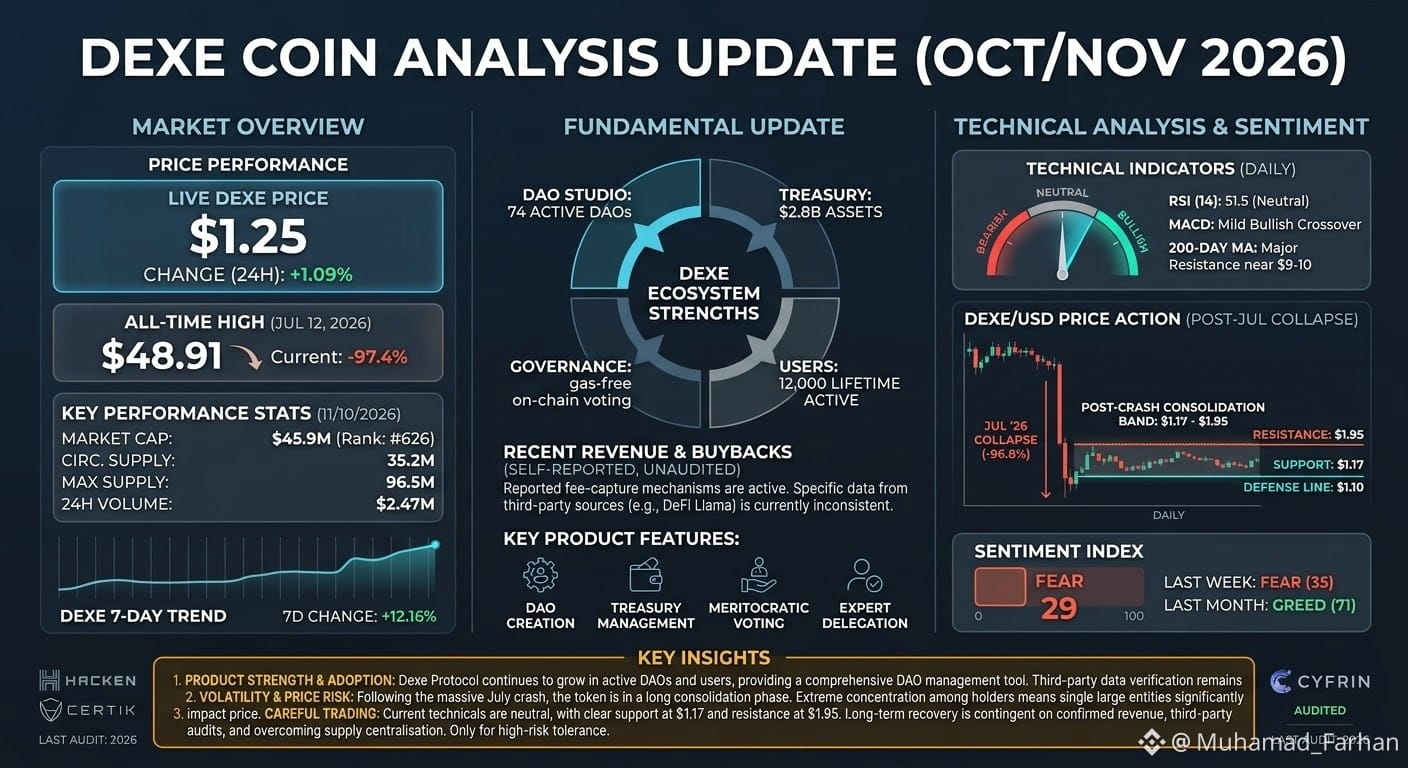
#AnthropicRejectsIPODelayValuationinQuestion Current Market & Technical Breakdown
Live Price Action: DEXE is currently consolidating around $1.24 - $1.25.
Macro Posture: The token remains in a severe post-crash consolidation band, trading ~97.4% down from its all-time high of $48.91 set on July 12, 2026 (sparked by massive institutional token transfers to exchanges).
Key Support: $1.17 serves as the primary daily defense line; losing this level risks a breakdown toward $1.10–$1.02.
Key Resistance: Immediate cap sits at $1.95, with major long-term overhead resistance around the 200-day moving average near $9.00–$10.00.
Technical Indicators: Daily RSI sits neutral (~51.5) with a mild bullish MACD crossover, though overall momentum signals remain cautious due to low 24h volume (~$2.47M–$4.5M).
Supply Dynamics: Circulating supply is 35.26M DEXE out of a 96.5M total supply (~36.5% circulating), presenting ongoing long-term token dilution risk.
Risk Rating: Independent security evaluations rate the asset as High Risk due to holder concentration and unverified third-party revenue metrics.#sagateembinancesqure👍 #StrategyBuys1037BTCLastWeek #AIChipSlumpNasdaq #BitcoinFiveWeeklyLosses
$DEXE $BTC $PEPE
#AnthropicRejectsIPODelayValuationinQuestion Current Market & Technical Breakdown
Live Price Action: DEXE is currently consolidating around $1.24 - $1.25.
Macro Posture: The token remains in a severe post-crash consolidation band, trading ~97.4% down from its all-time high of $48.91 set on July 12, 2026 (sparked by massive institutional token transfers to exchanges).
Key Support: $1.17 serves as the primary daily defense line; losing this level risks a breakdown toward $1.10–$1.02.
Key Resistance: Immediate cap sits at $1.95, with major long-term overhead resistance around the 200-day moving average near $9.00–$10.00.
Technical Indicators: Daily RSI sits neutral (~51.5) with a mild bullish MACD crossover, though overall momentum signals remain cautious due to low 24h volume (~$2.47M–$4.5M).
Supply Dynamics: Circulating supply is 35.26M DEXE out of a 96.5M total supply (~36.5% circulating), presenting ongoing long-term token dilution risk.
Risk Rating: Independent security evaluations rate the asset as High Risk due to holder concentration and unverified third-party revenue metrics.#sagateembinancesqure👍 #StrategyBuys1037BTCLastWeek #AIChipSlumpNasdaq #BitcoinFiveWeeklyLosses
#AnthropicRejectsIPODelayValuationinQuestion Current Market & Technical Breakdown
Live Price Action: DEXE is currently consolidating around $1.24 - $1.25.
Macro Posture: The token remains in a severe post-crash consolidation band, trading ~97.4% down from its all-time high of $48.91 set on July 12, 2026 (sparked by massive institutional token transfers to exchanges).
Key Support: $1.17 serves as the primary daily defense line; losing this level risks a breakdown toward $1.10–$1.02.
Key Resistance: Immediate cap sits at $1.95, with major long-term overhead resistance around the 200-day moving average near $9.00–$10.00.
Technical Indicators: Daily RSI sits neutral (~51.5) with a mild bullish MACD crossover, though overall momentum signals remain cautious due to low 24h volume (~$2.47M–$4.5M).
Supply Dynamics: Circulating supply is 35.26M DEXE out of a 96.5M total supply (~36.5% circulating), presenting ongoing long-term token dilution risk.
Risk Rating: Independent security evaluations rate the asset as High Risk due to holder concentration and unverified third-party revenue metrics.#sagateembinancesqure👍 #StrategyBuys1037BTCLastWeek #AIChipSlumpNasdaq #BitcoinFiveWeeklyLosses
328
$DEXE $BTC $PEPE
{spot}(DEXEUSDT)
{spot}(BTCUSDT)
{spot}(PEPEUSDT)
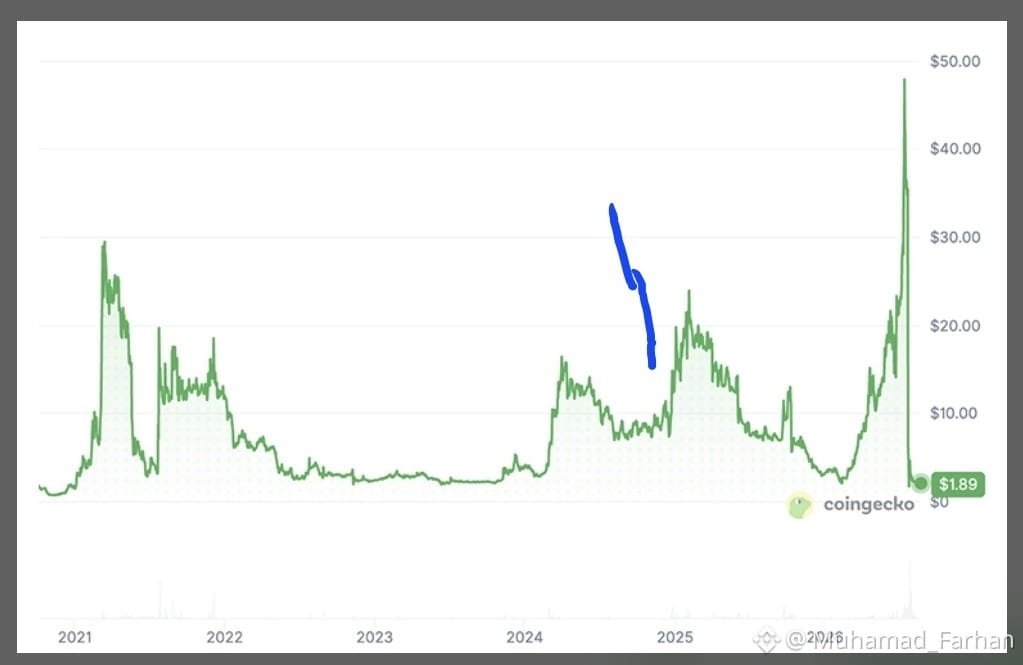
DeXe (DEXE) is currently trading in a low-liquidity consolidation phase following a broader macro and technical correction from its mid-year highs.
Market & Price Overview
Current Price: ~$1.24 – $1.28 USD
Market Capitalization: ~$105M – $107M USD
24-Hour Trading Volume: ~$4.5M – $6.6M USD (reflecting lighter market participation and thin order books)
All-Time Peak: Reached an all-time high of ~$48.91 USD, meaning the token has experienced a deep multi-month correction of over 97% from those peaks.
Technical Outlook & Key Levels
Immediate Support Zone: $1.17 – $1.20. Holding this floor is critical for preventing a slide toward psychological support near $1.10 or lower yearly floors.
Resistance / Overhead Supply: $1.40 – $1.50. A decisive move and sustained volume expansion above this zone would be needed to signal a shift away from the prevailing short-term bearish/neutral trend.
Market Sentiment: Cautious and risk-off. Price movements are heavily dictated by low-liquidity spikes or broader altcoin market drift rather than major protocol-specific catalysts.
Visual Reference
Because direct image embedding relies on live external feeds, you can instantly review live, interactive candlestick charts, order books, and multi-timeframe technical indicators directly on major tracking platforms:
DeXe Live Price Chart on CoinGecko
DEXE/USD Chart on TradingView
#sagateembinancesqure👍 #CPITestsDecemberRateOutlook #TradFiForBeginners #BitcoinFiveWeeklyLosses #AIChipSlumpNasdaq
$DEXE $BTC $PEPE
DeXe (DEXE) is currently trading in a low-liquidity consolidation phase following a broader macro and technical correction from its mid-year highs.
Market & Price Overview
Current Price: ~$1.24 – $1.28 USD
Market Capitalization: ~$105M – $107M USD
24-Hour Trading Volume: ~$4.5M – $6.6M USD (reflecting lighter market participation and thin order books)
All-Time Peak: Reached an all-time high of ~$48.91 USD, meaning the token has experienced a deep multi-month correction of over 97% from those peaks.
Technical Outlook & Key Levels
Immediate Support Zone: $1.17 – $1.20. Holding this floor is critical for preventing a slide toward psychological support near $1.10 or lower yearly floors.
Resistance / Overhead Supply: $1.40 – $1.50. A decisive move and sustained volume expansion above this zone would be needed to signal a shift away from the prevailing short-term bearish/neutral trend.
Market Sentiment: Cautious and risk-off. Price movements are heavily dictated by low-liquidity spikes or broader altcoin market drift rather than major protocol-specific catalysts.
Visual Reference
Because direct image embedding relies on live external feeds, you can instantly review live, interactive candlestick charts, order books, and multi-timeframe technical indicators directly on major tracking platforms:
DeXe Live Price Chart on CoinGecko
DEXE/USD Chart on TradingView
#sagateembinancesqure👍 #CPITestsDecemberRateOutlook #TradFiForBeginners #BitcoinFiveWeeklyLosses #AIChipSlumpNasdaq
DeXe (DEXE) is currently trading in a low-liquidity consolidation phase following a broader macro and technical correction from its mid-year highs.
Market & Price Overview
Current Price: ~$1.24 – $1.28 USD
Market Capitalization: ~$105M – $107M USD
24-Hour Trading Volume: ~$4.5M – $6.6M USD (reflecting lighter market participation and thin order books)
All-Time Peak: Reached an all-time high of ~$48.91 USD, meaning the token has experienced a deep multi-month correction of over 97% from those peaks.
Technical Outlook & Key Levels
Immediate Support Zone: $1.17 – $1.20. Holding this floor is critical for preventing a slide toward psychological support near $1.10 or lower yearly floors.
Resistance / Overhead Supply: $1.40 – $1.50. A decisive move and sustained volume expansion above this zone would be needed to signal a shift away from the prevailing short-term bearish/neutral trend.
Market Sentiment: Cautious and risk-off. Price movements are heavily dictated by low-liquidity spikes or broader altcoin market drift rather than major protocol-specific catalysts.
Visual Reference
Because direct image embedding relies on live external feeds, you can instantly review live, interactive candlestick charts, order books, and multi-timeframe technical indicators directly on major tracking platforms:
DeXe Live Price Chart on CoinGecko
DEXE/USD Chart on TradingView
#sagateembinancesqure👍 #CPITestsDecemberRateOutlook #TradFiForBeginners #BitcoinFiveWeeklyLosses #AIChipSlumpNasdaq
447
·
--
Bearish
$SAGA $BTC $DEXE
{spot}(SAGAUSDT)
{spot}(BTCUSDT)
{spot}(DEXEUSDT)
Technical & Market Overview
Metric / LevelCurrent Value / RangeKey Technical ImplicationCurrent Price Range~$0.0156 – $0.0168Consolidated near key horizontal supportImmediate Support$0.0160 – $0.0166Critical holding floor to avoid further downsideImmediate Resistance$0.0181 – $0.0183Major breakout barrier for bullsRSI (14)~40 – 42 (Neutral to Weak)Sellers hold modest control; no deep oversold bounce yetBollinger BandsContracting / Neutral-SellPreceding volatility expansion; watching for momentum breakoutKDJ (9,3,3)Positive K-D SpreadEarly short-term momentum attempt trying to cross upward
Key Technical Scenarios
Bullish Case (Breakout): A volume-backed recovery push above $0.0181 opens the target corridor toward $0.0200–$0.0205. Expanding 24-hour volume will be necessary to sustain any break above daily resistance.
Bearish Case (Breakdown): Failing to retain the $0.0160 support line increases the risk of a secondary pullback toward lower support bounds around $0.0140–$0.0150.
#sagateembinancesqure👍 #CPITestsDecemberRateOutlook #TradFiForBeginners #BinanceSquareFamily #BTC
$SAGA $BTC $DEXE
Technical & Market Overview
Metric / LevelCurrent Value / RangeKey Technical ImplicationCurrent Price Range~$0.0156 – $0.0168Consolidated near key horizontal supportImmediate Support$0.0160 – $0.0166Critical holding floor to avoid further downsideImmediate Resistance$0.0181 – $0.0183Major breakout barrier for bullsRSI (14)~40 – 42 (Neutral to Weak)Sellers hold modest control; no deep oversold bounce yetBollinger BandsContracting / Neutral-SellPreceding volatility expansion; watching for momentum breakoutKDJ (9,3,3)Positive K-D SpreadEarly short-term momentum attempt trying to cross upward
Key Technical Scenarios
Bullish Case (Breakout): A volume-backed recovery push above $0.0181 opens the target corridor toward $0.0200–$0.0205. Expanding 24-hour volume will be necessary to sustain any break above daily resistance.
Bearish Case (Breakdown): Failing to retain the $0.0160 support line increases the risk of a secondary pullback toward lower support bounds around $0.0140–$0.0150.
#sagateembinancesqure👍 #CPITestsDecemberRateOutlook #TradFiForBeginners #BinanceSquareFamily #BTC
Technical & Market Overview
Metric / LevelCurrent Value / RangeKey Technical ImplicationCurrent Price Range~$0.0156 – $0.0168Consolidated near key horizontal supportImmediate Support$0.0160 – $0.0166Critical holding floor to avoid further downsideImmediate Resistance$0.0181 – $0.0183Major breakout barrier for bullsRSI (14)~40 – 42 (Neutral to Weak)Sellers hold modest control; no deep oversold bounce yetBollinger BandsContracting / Neutral-SellPreceding volatility expansion; watching for momentum breakoutKDJ (9,3,3)Positive K-D SpreadEarly short-term momentum attempt trying to cross upward
Key Technical Scenarios
Bullish Case (Breakout): A volume-backed recovery push above $0.0181 opens the target corridor toward $0.0200–$0.0205. Expanding 24-hour volume will be necessary to sustain any break above daily resistance.
Bearish Case (Breakdown): Failing to retain the $0.0160 support line increases the risk of a secondary pullback toward lower support bounds around $0.0140–$0.0150.
#sagateembinancesqure👍 #CPITestsDecemberRateOutlook #TradFiForBeginners #BinanceSquareFamily #BTC

882
$SAGA $BTC $DEXE
{spot}(SAGAUSDT)
{spot}(BTCUSDT)
{spot}(DEXEUSDT)
SAGA Technical & Market Update
SAGA is currently consolidating in a tight lower-bound range following high daily trading volume spikes, with price action contending with short-term resistance near $0.0180.
1. Key Levels & Price Structure
Current Spot Range: ~$0.0156 – $0.0168
Immediate Support Zone: $0.0140 – $0.0150 (Base accumulation zone prior to recent volume expansion)
Major Support: $0.0128 – $0.0135 (Critical structural floor)
Primary Resistance: $0.0181 – $0.0183 (200-period EMA / local liquidity node)
Breakout Target: $0.0295 – $0.0310
2. Indicator Profile
RSI (14-period): ~40.7 – Hovering in neutral-to-oversold territory, reflecting reduced momentum after brief relief surges.
Moving Averages: Price is testing short-term EMAs; holding above $0.0160 keeps local buyers active, while a drop under $0.0150 risks retesting year-to-date lows.
Volume Dynamics: Spikes in turnover indicate active short-term speculative interest, though sustained buyer accumulation is required to break upper structural overhead.
3. Multi-Timeframe Outlook
Short-Term (Intraday / Daily): Neutral-to-Bearish within the $0.0140 – $0.0180 range. A clean daily close above $0.0183 signals a potential push toward $0.0290.
Medium-Term: Macro performance relies heavily on ecosystem adoption of dedicated Chainlets and Web3 gaming integration. Losing $0.0140 shifts focus back to defensive support around $0.0128
#sagateembinancesqure👍 #JobsReportRaisesHikeOdds #CPITestsDecemberRateOutlook #TradFiForBeginners #SouthKoreaDraftLawTargets15To20%ShareholderCap
$SAGA $BTC $DEXE
SAGA Technical & Market Update
SAGA is currently consolidating in a tight lower-bound range following high daily trading volume spikes, with price action contending with short-term resistance near $0.0180.
1. Key Levels & Price Structure
Current Spot Range: ~$0.0156 – $0.0168
Immediate Support Zone: $0.0140 – $0.0150 (Base accumulation zone prior to recent volume expansion)
Major Support: $0.0128 – $0.0135 (Critical structural floor)
Primary Resistance: $0.0181 – $0.0183 (200-period EMA / local liquidity node)
Breakout Target: $0.0295 – $0.0310
2. Indicator Profile
RSI (14-period): ~40.7 – Hovering in neutral-to-oversold territory, reflecting reduced momentum after brief relief surges.
Moving Averages: Price is testing short-term EMAs; holding above $0.0160 keeps local buyers active, while a drop under $0.0150 risks retesting year-to-date lows.
Volume Dynamics: Spikes in turnover indicate active short-term speculative interest, though sustained buyer accumulation is required to break upper structural overhead.
3. Multi-Timeframe Outlook
Short-Term (Intraday / Daily): Neutral-to-Bearish within the $0.0140 – $0.0180 range. A clean daily close above $0.0183 signals a potential push toward $0.0290.
Medium-Term: Macro performance relies heavily on ecosystem adoption of dedicated Chainlets and Web3 gaming integration. Losing $0.0140 shifts focus back to defensive support around $0.0128
#sagateembinancesqure👍 #JobsReportRaisesHikeOdds #CPITestsDecemberRateOutlook #TradFiForBeginners #SouthKoreaDraftLawTargets15To20%ShareholderCap
SAGA Technical & Market Update
SAGA is currently consolidating in a tight lower-bound range following high daily trading volume spikes, with price action contending with short-term resistance near $0.0180.
1. Key Levels & Price Structure
Current Spot Range: ~$0.0156 – $0.0168
Immediate Support Zone: $0.0140 – $0.0150 (Base accumulation zone prior to recent volume expansion)
Major Support: $0.0128 – $0.0135 (Critical structural floor)
Primary Resistance: $0.0181 – $0.0183 (200-period EMA / local liquidity node)
Breakout Target: $0.0295 – $0.0310
2. Indicator Profile
RSI (14-period): ~40.7 – Hovering in neutral-to-oversold territory, reflecting reduced momentum after brief relief surges.
Moving Averages: Price is testing short-term EMAs; holding above $0.0160 keeps local buyers active, while a drop under $0.0150 risks retesting year-to-date lows.
Volume Dynamics: Spikes in turnover indicate active short-term speculative interest, though sustained buyer accumulation is required to break upper structural overhead.
3. Multi-Timeframe Outlook
Short-Term (Intraday / Daily): Neutral-to-Bearish within the $0.0140 – $0.0180 range. A clean daily close above $0.0183 signals a potential push toward $0.0290.
Medium-Term: Macro performance relies heavily on ecosystem adoption of dedicated Chainlets and Web3 gaming integration. Losing $0.0140 shifts focus back to defensive support around $0.0128
#sagateembinancesqure👍 #JobsReportRaisesHikeOdds #CPITestsDecemberRateOutlook #TradFiForBeginners #SouthKoreaDraftLawTargets15To20%ShareholderCap

1
833
$SAGA $BTC $DEXE
{spot}(SAGAUSDT)
{spot}(BTCUSDT)
{spot}(DEXEUSDT)
Saga (SAGA) Market & Technical Update
Current Price: ~$0.0160 – $0.0165 USD (-3.1% in the last 24h)
24-Hour Volume: ~$4.1M USD
Market Sentiment: Bearish pressure with range-bound consolidation
Relative Strength Index (RSI): ~40.7 (neutral/oversold territory)
Key Support Zone: $0.0157 – $0.0160
Immediate Resistance: $0.0181 – $0.0185
Technical Analysis Summary: SAGA is currently testing localized support near the $0.0160 mark following short-term downward momentum. The RSI remains in lower-neutral territory, reflecting cautious trading volume across spot and futures markets. A sustained hold above $0.0160 could allow a retest of resistance near $0.0181, while a breakdown below $0.0157 may open downside risk toward lower historical liquidity levels.#sagateembinancesqure👍 #JobsReportRaisesHikeOdds #CPITestsDecemberRateOutlook #KeplrAdvisesSocialLoginUsersToTransferAssets #TetherPlans€28.8MForJuventusCapitalIncrease
$SAGA $BTC $DEXE
Saga (SAGA) Market & Technical Update
Current Price: ~$0.0160 – $0.0165 USD (-3.1% in the last 24h)
24-Hour Volume: ~$4.1M USD
Market Sentiment: Bearish pressure with range-bound consolidation
Relative Strength Index (RSI): ~40.7 (neutral/oversold territory)
Key Support Zone: $0.0157 – $0.0160
Immediate Resistance: $0.0181 – $0.0185
Technical Analysis Summary: SAGA is currently testing localized support near the $0.0160 mark following short-term downward momentum. The RSI remains in lower-neutral territory, reflecting cautious trading volume across spot and futures markets. A sustained hold above $0.0160 could allow a retest of resistance near $0.0181, while a breakdown below $0.0157 may open downside risk toward lower historical liquidity levels.#sagateembinancesqure👍 #JobsReportRaisesHikeOdds #CPITestsDecemberRateOutlook #KeplrAdvisesSocialLoginUsersToTransferAssets #TetherPlans€28.8MForJuventusCapitalIncrease
Saga (SAGA) Market & Technical Update
Current Price: ~$0.0160 – $0.0165 USD (-3.1% in the last 24h)
24-Hour Volume: ~$4.1M USD
Market Sentiment: Bearish pressure with range-bound consolidation
Relative Strength Index (RSI): ~40.7 (neutral/oversold territory)
Key Support Zone: $0.0157 – $0.0160
Immediate Resistance: $0.0181 – $0.0185
Technical Analysis Summary: SAGA is currently testing localized support near the $0.0160 mark following short-term downward momentum. The RSI remains in lower-neutral territory, reflecting cautious trading volume across spot and futures markets. A sustained hold above $0.0160 could allow a retest of resistance near $0.0181, while a breakdown below $0.0157 may open downside risk toward lower historical liquidity levels.#sagateembinancesqure👍 #JobsReportRaisesHikeOdds #CPITestsDecemberRateOutlook #KeplrAdvisesSocialLoginUsersToTransferAssets #TetherPlans€28.8MForJuventusCapitalIncrease

710
$XRP $BTC $SAGA
{spot}(XRPUSDT)
{spot}(BTCUSDT)
{spot}(SAGAUSDT)
Technical & Moving Average Structure
Price & Trend Alignment: XRP is trading in the $1.20–$1.27 consolidation range, recovering slightly from recent pullbacks. Short-to-medium EMAs form a layered resistance overhang overhead:
20-day EMA: ~$1.30
100-day EMA: ~$1.32
200-day EMA: ~$1.36
Oscillators (RSI & Momentum): Daily RSI (14) sits in neutral-to-soft territory at 42–43, crossing above its short-term signal line. Volume remains moderate (~$1.7B 24-hour volume), pointing to consolidation rather than aggressive aggressive distribution or impulsive buying.
Support & Resistance Key Levels
Immediate Resistance: $1.28–$1.30 (20-day EMA pivot threshold).
Major Overhead Resistance: $1.36–$1.40 (Confluence of the 200-day EMA and October breakdown level).
Immediate Support: $1.20–$1.24 (Current demand zone/Bollinger lower bound).
Major Downside Support: $1.10–$1.12 (Structural macro support node).
On-Chain & Fundamental Drivers
Ripple Escrow Release Mechanics: Following the standard 1B XRP monthly release on the 1st of the month, market supply dynamic heavily depends on Ripple’s re-lock rate (~70% re-locked in recent months). Unlocked liquidity continues to absorb baseline demand.
Institutional & ETF Flows: Net inflows via spot ETF instruments remain active but modest, balancing sell-side spot volume without creating an immediate supply-squeeze trigger.
Scenario Breakdown
Bullish Breakout Scenario: A sustained daily close above $1.30 signals a test of $1.36–$1.40. Reclaiming $1.40 on rising volume opens a path toward broader Q4 targets ($1.50+).
Bearish Continuation Scenario: Rejection at $1.28 followed by a breakdown below $1.20 exposes the structural support zone at $1.10, with risks of testing the $1.00 psychological level if BTC/altcoin macro weakness persists.
#sagateembinancesqure👍 #JobsReportRaisesHikeOdds #CPITestsDecemberRateOutlook #WillAnthropicListOnTime #KeplrAdvisesSocialLoginUsersToTransferAssets
$XRP $BTC $SAGA
Technical & Moving Average Structure
Price & Trend Alignment: XRP is trading in the $1.20–$1.27 consolidation range, recovering slightly from recent pullbacks. Short-to-medium EMAs form a layered resistance overhang overhead:
20-day EMA: ~$1.30
100-day EMA: ~$1.32
200-day EMA: ~$1.36
Oscillators (RSI & Momentum): Daily RSI (14) sits in neutral-to-soft territory at 42–43, crossing above its short-term signal line. Volume remains moderate (~$1.7B 24-hour volume), pointing to consolidation rather than aggressive aggressive distribution or impulsive buying.
Support & Resistance Key Levels
Immediate Resistance: $1.28–$1.30 (20-day EMA pivot threshold).
Major Overhead Resistance: $1.36–$1.40 (Confluence of the 200-day EMA and October breakdown level).
Immediate Support: $1.20–$1.24 (Current demand zone/Bollinger lower bound).
Major Downside Support: $1.10–$1.12 (Structural macro support node).
On-Chain & Fundamental Drivers
Ripple Escrow Release Mechanics: Following the standard 1B XRP monthly release on the 1st of the month, market supply dynamic heavily depends on Ripple’s re-lock rate (~70% re-locked in recent months). Unlocked liquidity continues to absorb baseline demand.
Institutional & ETF Flows: Net inflows via spot ETF instruments remain active but modest, balancing sell-side spot volume without creating an immediate supply-squeeze trigger.
Scenario Breakdown
Bullish Breakout Scenario: A sustained daily close above $1.30 signals a test of $1.36–$1.40. Reclaiming $1.40 on rising volume opens a path toward broader Q4 targets ($1.50+).
Bearish Continuation Scenario: Rejection at $1.28 followed by a breakdown below $1.20 exposes the structural support zone at $1.10, with risks of testing the $1.00 psychological level if BTC/altcoin macro weakness persists.
#sagateembinancesqure👍 #JobsReportRaisesHikeOdds #CPITestsDecemberRateOutlook #WillAnthropicListOnTime #KeplrAdvisesSocialLoginUsersToTransferAssets
Technical & Moving Average Structure
Price & Trend Alignment: XRP is trading in the $1.20–$1.27 consolidation range, recovering slightly from recent pullbacks. Short-to-medium EMAs form a layered resistance overhang overhead:
20-day EMA: ~$1.30
100-day EMA: ~$1.32
200-day EMA: ~$1.36
Oscillators (RSI & Momentum): Daily RSI (14) sits in neutral-to-soft territory at 42–43, crossing above its short-term signal line. Volume remains moderate (~$1.7B 24-hour volume), pointing to consolidation rather than aggressive aggressive distribution or impulsive buying.
Support & Resistance Key Levels
Immediate Resistance: $1.28–$1.30 (20-day EMA pivot threshold).
Major Overhead Resistance: $1.36–$1.40 (Confluence of the 200-day EMA and October breakdown level).
Immediate Support: $1.20–$1.24 (Current demand zone/Bollinger lower bound).
Major Downside Support: $1.10–$1.12 (Structural macro support node).
On-Chain & Fundamental Drivers
Ripple Escrow Release Mechanics: Following the standard 1B XRP monthly release on the 1st of the month, market supply dynamic heavily depends on Ripple’s re-lock rate (~70% re-locked in recent months). Unlocked liquidity continues to absorb baseline demand.
Institutional & ETF Flows: Net inflows via spot ETF instruments remain active but modest, balancing sell-side spot volume without creating an immediate supply-squeeze trigger.
Scenario Breakdown
Bullish Breakout Scenario: A sustained daily close above $1.30 signals a test of $1.36–$1.40. Reclaiming $1.40 on rising volume opens a path toward broader Q4 targets ($1.50+).
Bearish Continuation Scenario: Rejection at $1.28 followed by a breakdown below $1.20 exposes the structural support zone at $1.10, with risks of testing the $1.00 psychological level if BTC/altcoin macro weakness persists.
#sagateembinancesqure👍 #JobsReportRaisesHikeOdds #CPITestsDecemberRateOutlook #WillAnthropicListOnTime #KeplrAdvisesSocialLoginUsersToTransferAssets

1
325
Log in to explore more content
Join global crypto users on Binance Square
⚡️ Get latest and useful information about crypto.
💬 Trusted by the world’s largest crypto exchange.
👍 Discover real insights from verified creators.
Email / Phone number
Trending Topics
A Packed Week of Earnings and Data Tests Markets
38,399 views
273 Discussing
🚨🇺🇸 BIG WEEK AHEAD FOR THE MARKETS!
Markets are pricing in a Fed rate hike in December and $BTC could see some big moves next week.
Here's what's coming:
• Monday: Fed Chair Warsh speaks
• Tuesday: US Retail Sales + $NVDA earnings
• Wednesday: FOMC Minutes
• Thursday: Jobless Claims + Philly Fed Index
• Friday: Consumer Sentiment + Fed speeches
All eyes on $BTC as another important week begins.
#bitcoin
Mookie
·10 Likes
·5.4k views
AnthropicIPOTestsInvestorAppetiteForAI
47,127 views
859 Discussing
BitcoinExtendsLosingStreakToSixWeeks
8,187 views
214 Discussing