

Lauramelissa86
1.5k Posts

Lauramelissa86
Report
Block User
1.4K+ Following
466 Followers
1.2K+ Liked
Posts
All
Quotes
Videos
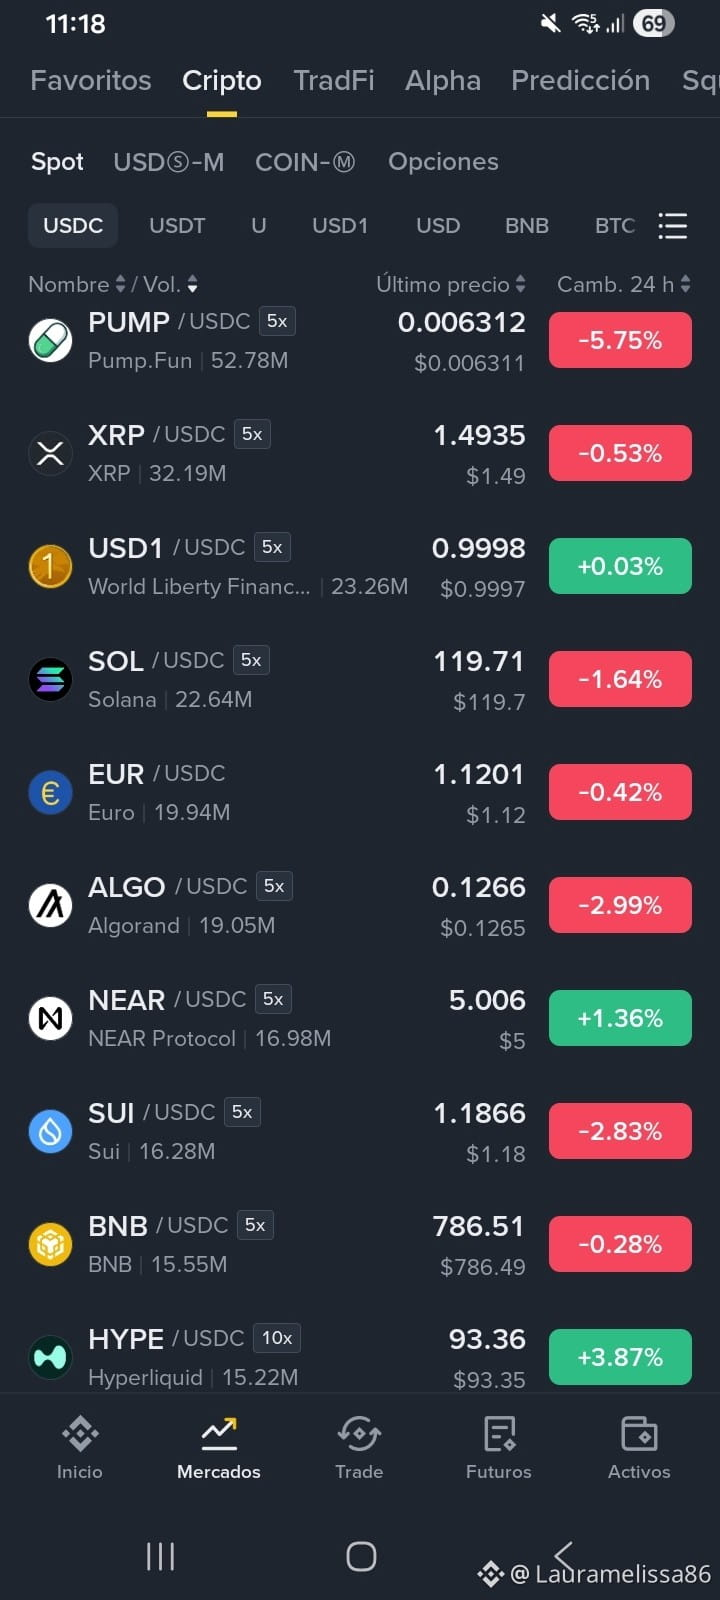
The Spot board (USDC pairs) is entering a brief consolidation and profit-taking phase. After the initial morning rally, most major assets are giving back some ground, while NEAR manages to hold above the key psychological resistance at $5.00 and HYPE stands out in positive territory.
Board highlights (11:18)
PUMP leads market liquidity: It continues to lead the board in total volume, with 52.78M USDC traded, although it has pulled back -5.75% to $0.006312 USDC after the earlier rally.
NEAR holds key support: It has managed to consolidate above $5.00, trading at $5.006 USDC (+1.36%) with 16.98M in volume.
The Spot board (USDC pairs) is entering a brief consolidation and profit-taking phase. After the initial morning rally, most major assets are giving back some ground, while NEAR manages to hold above the key psychological resistance at $5.00 and HYPE stands out in positive territory.
Board highlights (11:18)
PUMP leads market liquidity: It continues to lead the board in total volume, with 52.78M USDC traded, although it has pulled back -5.75% to $0.006312 USDC after the earlier rally.
NEAR holds key support: It has managed to consolidate above $5.00, trading at $5.006 USDC (+1.36%) with 16.98M in volume.
Board highlights (11:18)
PUMP leads market liquidity: It continues to lead the board in total volume, with 52.78M USDC traded, although it has pulled back -5.75% to $0.006312 USDC after the earlier rally.
NEAR holds key support: It has managed to consolidate above $5.00, trading at $5.006 USDC (+1.36%) with 16.98M in volume.
257
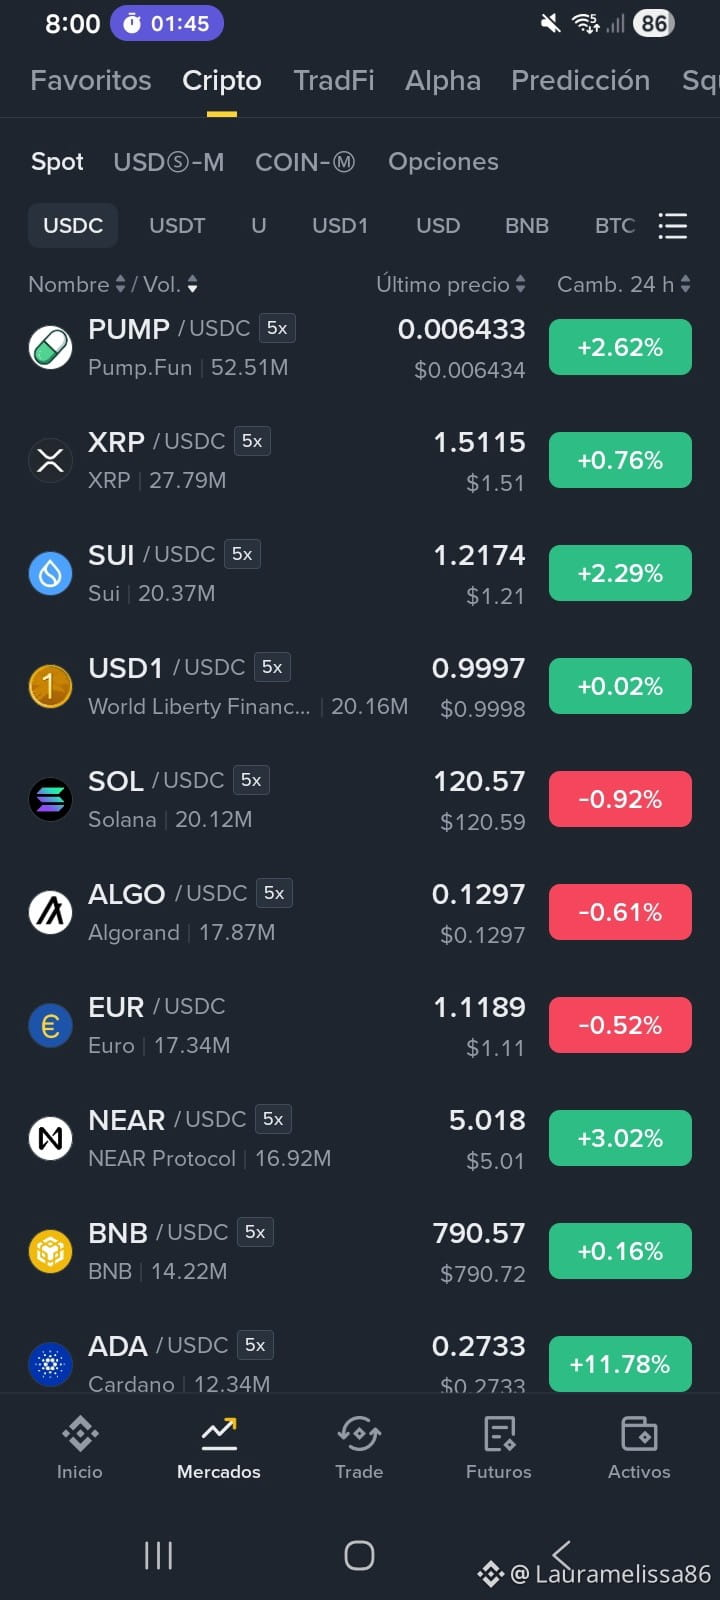
At 8:00, the Spot board (USDC pairs) kicks off the day with clear buying momentum, led by a strong breakout in ADA (+11.78%), NEAR consolidating above $5.00, and massive liquidity accumulation in PUMP, with over 52M USDC traded.
At 8:00, the Spot board (USDC pairs) kicks off the day with clear buying momentum, led by a strong breakout in ADA (+11.78%), NEAR consolidating above $5.00, and massive liquidity accumulation in PUMP, with over 52M USDC traded.
1.1k
Blood-dyed board! 🙄😊🤔
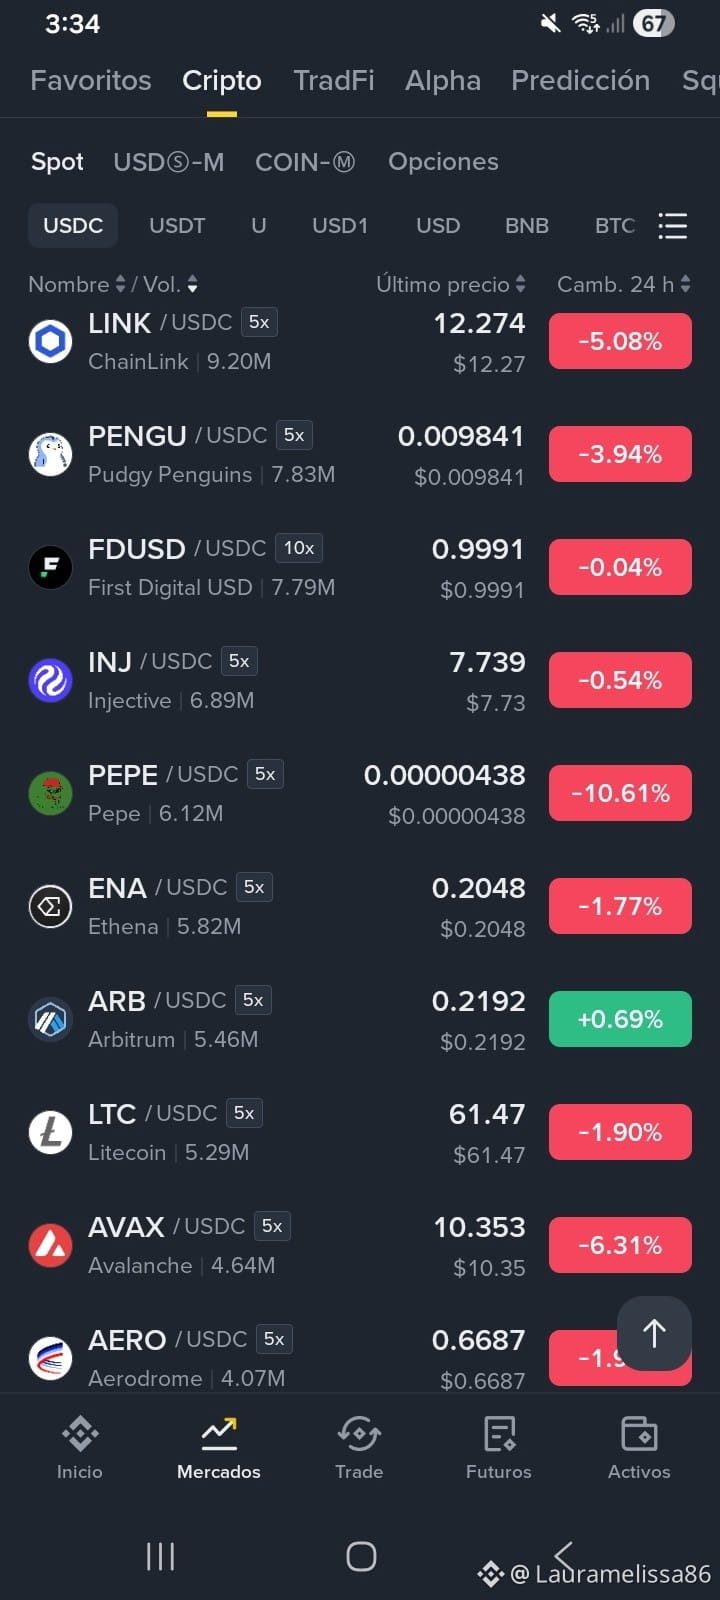
The mid-lower band of the Spot (USDC) board turns red. For the untrained eye this creates panic, but for those of us who read charts and liquidity, we know that aggressive pullbacks are part of the breathing space the market needs to clear excess leverage.
Let’s analyze the technical “X-ray” of the block at this hour:
1️⃣ 📉 $PEPE (0.00000438, -10.61\%) andAVAX ($10.353, -6.31%): They lead the deepest adjustments in this leg. Since they’re higher-beta assets, profit-taking happens faster. The key now is to locate the buy-side order blocks on the 1H and 4H timeframes.
2️⃣ 🟢 $ARB against the current ($0.2192, +0.69%): It manages to hold in green with 5.4M in volume, showing consistent buy absorption in the lower part of the range.
3️⃣ 🛡️ $INJ (7.739, -0.54\%) andLTC ($61.47, -1.90%) with moderate drops: They show less selling volatility than the rest of the market, which often indicates institutional strength holding the floors.
4️⃣ 📊 $LINK leads liquidity ($12.274, -5.08%): It moves more than 9.2M of USDC, testing prior supports to assess whether it consolidates as a re-accumulation zone.
💡 Technical Analysis and Reflection:
When the board turns blood red, discipline in trading becomes our best tool. Instead of chasing price in panic, we look for divergences in indicators like StochRSI or in the readings of the MAs (Moving Averages) to identify the levels where the sell-side runs out and buyers reappear.
💬 How do they approach these sweeping phases in Spot: do they prefer to wait for price to confirm a floor, or do they track key supports in assets like LINK andINJ? ☕📊
Blood-dyed board! 🙄😊🤔
The mid-lower band of the Spot (USDC) board turns red. For the untrained eye this creates panic, but for those of us who read charts and liquidity, we know that aggressive pullbacks are part of the breathing space the market needs to clear excess leverage.
Let’s analyze the technical “X-ray” of the block at this hour:
1️⃣ 📉 $PEPE (0.00000438, -10.61\%) andAVAX ($10.353, -6.31%): They lead the deepest adjustments in this leg. Since they’re higher-beta assets, profit-taking happens faster. The key now is to locate the buy-side order blocks on the 1H and 4H timeframes.
2️⃣ 🟢 $ARB against the current ($0.2192, +0.69%): It manages to hold in green with 5.4M in volume, showing consistent buy absorption in the lower part of the range.
3️⃣ 🛡️ $INJ (7.739, -0.54\%) andLTC ($61.47, -1.90%) with moderate drops: They show less selling volatility than the rest of the market, which often indicates institutional strength holding the floors.
4️⃣ 📊 $LINK leads liquidity ($12.274, -5.08%): It moves more than 9.2M of USDC, testing prior supports to assess whether it consolidates as a re-accumulation zone.
💡 Technical Analysis and Reflection:
When the board turns blood red, discipline in trading becomes our best tool. Instead of chasing price in panic, we look for divergences in indicators like StochRSI or in the readings of the MAs (Moving Averages) to identify the levels where the sell-side runs out and buyers reappear.
💬 How do they approach these sweeping phases in Spot: do they prefer to wait for price to confirm a floor, or do they track key supports in assets like LINK andINJ? ☕📊
The mid-lower band of the Spot (USDC) board turns red. For the untrained eye this creates panic, but for those of us who read charts and liquidity, we know that aggressive pullbacks are part of the breathing space the market needs to clear excess leverage.
Let’s analyze the technical “X-ray” of the block at this hour:
1️⃣ 📉 $PEPE (0.00000438, -10.61\%) andAVAX ($10.353, -6.31%): They lead the deepest adjustments in this leg. Since they’re higher-beta assets, profit-taking happens faster. The key now is to locate the buy-side order blocks on the 1H and 4H timeframes.
2️⃣ 🟢 $ARB against the current ($0.2192, +0.69%): It manages to hold in green with 5.4M in volume, showing consistent buy absorption in the lower part of the range.
3️⃣ 🛡️ $INJ (7.739, -0.54\%) andLTC ($61.47, -1.90%) with moderate drops: They show less selling volatility than the rest of the market, which often indicates institutional strength holding the floors.
4️⃣ 📊 $LINK leads liquidity ($12.274, -5.08%): It moves more than 9.2M of USDC, testing prior supports to assess whether it consolidates as a re-accumulation zone.
💡 Technical Analysis and Reflection:
When the board turns blood red, discipline in trading becomes our best tool. Instead of chasing price in panic, we look for divergences in indicators like StochRSI or in the readings of the MAs (Moving Averages) to identify the levels where the sell-side runs out and buyers reappear.
💬 How do they approach these sweeping phases in Spot: do they prefer to wait for price to confirm a floor, or do they track key supports in assets like LINK andINJ? ☕📊
1
2
900
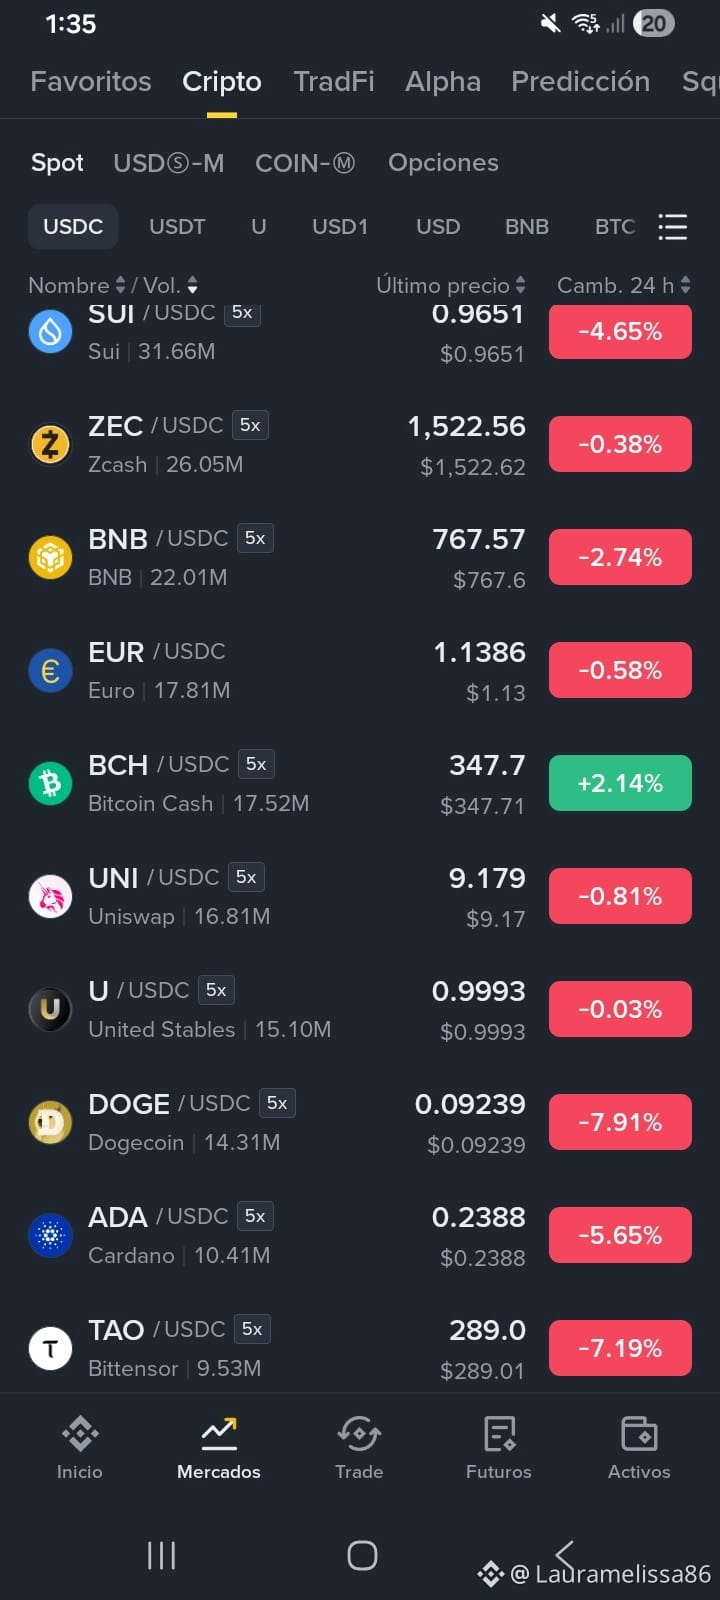
intra-day cooling phase with moderate pullbacks across most pairs, while SUI is placed first in total volume, ZEC keeps in a constant way the important support of $1,520 with a high buy-side flow, and BCH consolidates as the only coin in the group maintaining green momentum (+2.14%).
Highlights from the board (1:35)
SUI leads market liquidity: It ranks first with 31.66M USDC traded, quoting at $0.9651 USDC (-4.65%) in a clear phase of support retesting.
ZEC absorbs volume at support: It holds the second spot in liquidity with 26.05M USDC traded, keeping impeccably the band around $1,522.56 USDC (-0.38%).
BCH sustains relative strength: It remains the only green asset within the main list, trading at $347.7 USDC (+2.14%) with 17.52M traded.
intra-day cooling phase with moderate pullbacks across most pairs, while SUI is placed first in total volume, ZEC keeps in a constant way the important support of $1,520 with a high buy-side flow, and BCH consolidates as the only coin in the group maintaining green momentum (+2.14%).
Highlights from the board (1:35)
SUI leads market liquidity: It ranks first with 31.66M USDC traded, quoting at $0.9651 USDC (-4.65%) in a clear phase of support retesting.
ZEC absorbs volume at support: It holds the second spot in liquidity with 26.05M USDC traded, keeping impeccably the band around $1,522.56 USDC (-0.38%).
BCH sustains relative strength: It remains the only green asset within the main list, trading at $347.7 USDC (+2.14%) with 17.52M traded.
Highlights from the board (1:35)
SUI leads market liquidity: It ranks first with 31.66M USDC traded, quoting at $0.9651 USDC (-4.65%) in a clear phase of support retesting.
ZEC absorbs volume at support: It holds the second spot in liquidity with 26.05M USDC traded, keeping impeccably the band around $1,522.56 USDC (-0.38%).
BCH sustains relative strength: It remains the only green asset within the main list, trading at $347.7 USDC (+2.14%) with 17.52M traded.

1
1
402
Studying GPS
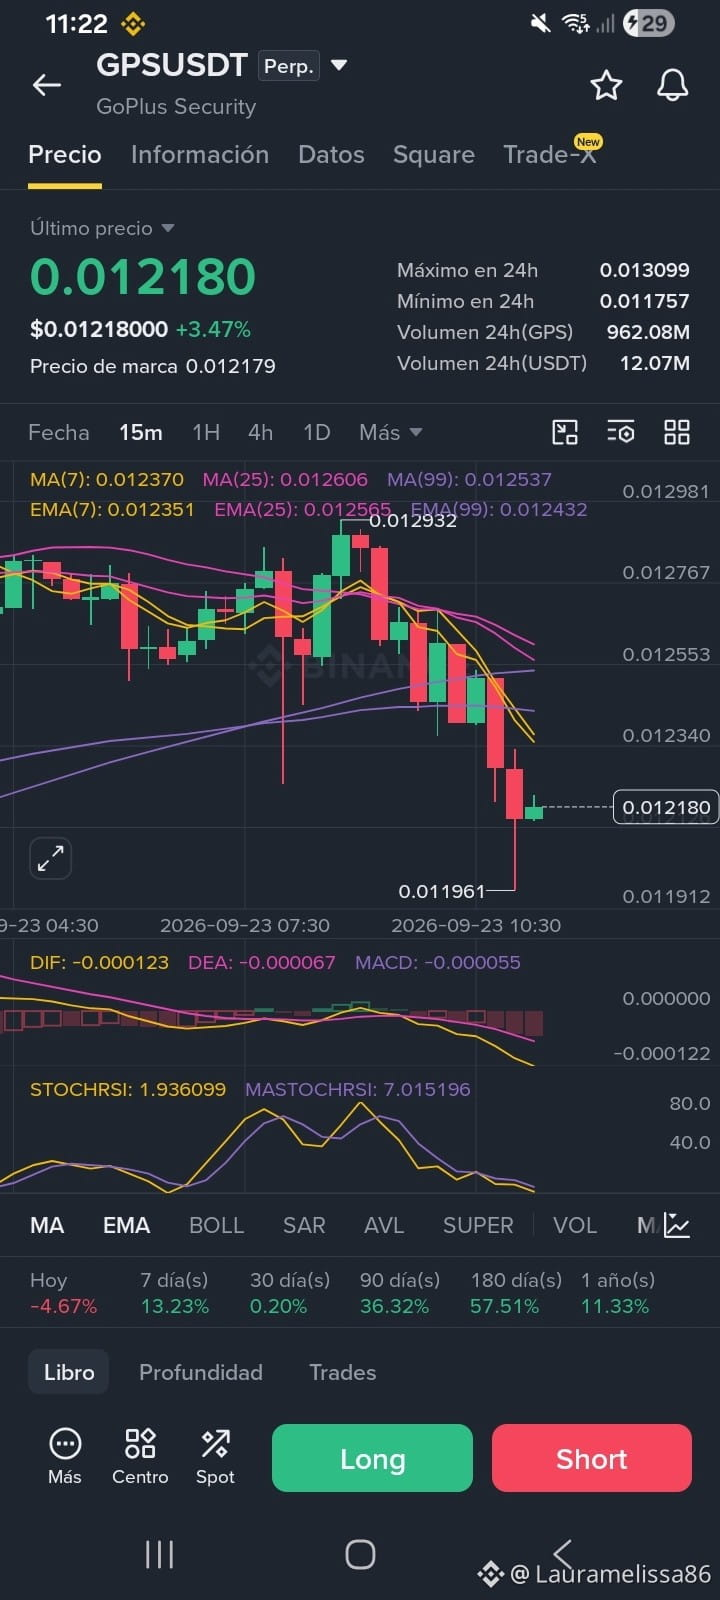
In this GPSUSDT chart (15 minutes), a didactic scenario is shown to analyze the behavior of the Exponential Moving Averages (EMA).
1. Status of the Moving Averages
EMA (7) = 0.012351 (Fast line, yellow color)
EMA (25) = 0.012565 (Intermediate line, pink/purple color)
EMA (99) = 0.012432 (Slow/long-term line, violet color)
2. Key Points
A. Alignment and Bearish Crossover (Death Cross on a smaller timeframe)
Crossover of the fast line over the intermediate line: EMA(7) has clearly crossed below EMA(25).
Crossover with the main trend: The price and the fast averages broke strongly downward below the EMA(99), confirming a change in structure on this timeframe.
Bearish ordering: The moving averages are arranged in descending order (the slowest on top and the fastest below), which validates prevailing selling pressure.
B. Distance from the price (Overextension)
The current price (0.012180) has fallen in an accelerated manner, trading significantly below the EMA(7) [0.012351].
In technical analysis, when the price moves too far away from the fast EMA, the EMAs act like a "magnet." This often leads to a technical pullback bounce or sideways consolidation to get closer to the EMA(7) before continuing its move.
C. EMAs as Dynamic Resistances
As the price tries to regain ground, the exponential averages no longer act as supports but as dynamic resistances.
For the structure to regain bullish strength, the price would first need to break above the EMA(7) and subsequently consolidate above the EMA(25) and the EMA(99).
Studying GPS
In this GPSUSDT chart (15 minutes), a didactic scenario is shown to analyze the behavior of the Exponential Moving Averages (EMA).
1. Status of the Moving Averages
EMA (7) = 0.012351 (Fast line, yellow color)
EMA (25) = 0.012565 (Intermediate line, pink/purple color)
EMA (99) = 0.012432 (Slow/long-term line, violet color)
2. Key Points
A. Alignment and Bearish Crossover (Death Cross on a smaller timeframe)
Crossover of the fast line over the intermediate line: EMA(7) has clearly crossed below EMA(25).
Crossover with the main trend: The price and the fast averages broke strongly downward below the EMA(99), confirming a change in structure on this timeframe.
Bearish ordering: The moving averages are arranged in descending order (the slowest on top and the fastest below), which validates prevailing selling pressure.
B. Distance from the price (Overextension)
The current price (0.012180) has fallen in an accelerated manner, trading significantly below the EMA(7) [0.012351].
In technical analysis, when the price moves too far away from the fast EMA, the EMAs act like a "magnet." This often leads to a technical pullback bounce or sideways consolidation to get closer to the EMA(7) before continuing its move.
C. EMAs as Dynamic Resistances
As the price tries to regain ground, the exponential averages no longer act as supports but as dynamic resistances.
For the structure to regain bullish strength, the price would first need to break above the EMA(7) and subsequently consolidate above the EMA(25) and the EMA(99).
In this GPSUSDT chart (15 minutes), a didactic scenario is shown to analyze the behavior of the Exponential Moving Averages (EMA).
1. Status of the Moving Averages
EMA (7) = 0.012351 (Fast line, yellow color)
EMA (25) = 0.012565 (Intermediate line, pink/purple color)
EMA (99) = 0.012432 (Slow/long-term line, violet color)
2. Key Points
A. Alignment and Bearish Crossover (Death Cross on a smaller timeframe)
Crossover of the fast line over the intermediate line: EMA(7) has clearly crossed below EMA(25).
Crossover with the main trend: The price and the fast averages broke strongly downward below the EMA(99), confirming a change in structure on this timeframe.
Bearish ordering: The moving averages are arranged in descending order (the slowest on top and the fastest below), which validates prevailing selling pressure.
B. Distance from the price (Overextension)
The current price (0.012180) has fallen in an accelerated manner, trading significantly below the EMA(7) [0.012351].
In technical analysis, when the price moves too far away from the fast EMA, the EMAs act like a "magnet." This often leads to a technical pullback bounce or sideways consolidation to get closer to the EMA(7) before continuing its move.
C. EMAs as Dynamic Resistances
As the price tries to regain ground, the exponential averages no longer act as supports but as dynamic resistances.
For the structure to regain bullish strength, the price would first need to break above the EMA(7) and subsequently consolidate above the EMA(25) and the EMA(99).

1
2
197
The resilience of BCH and PENGU:
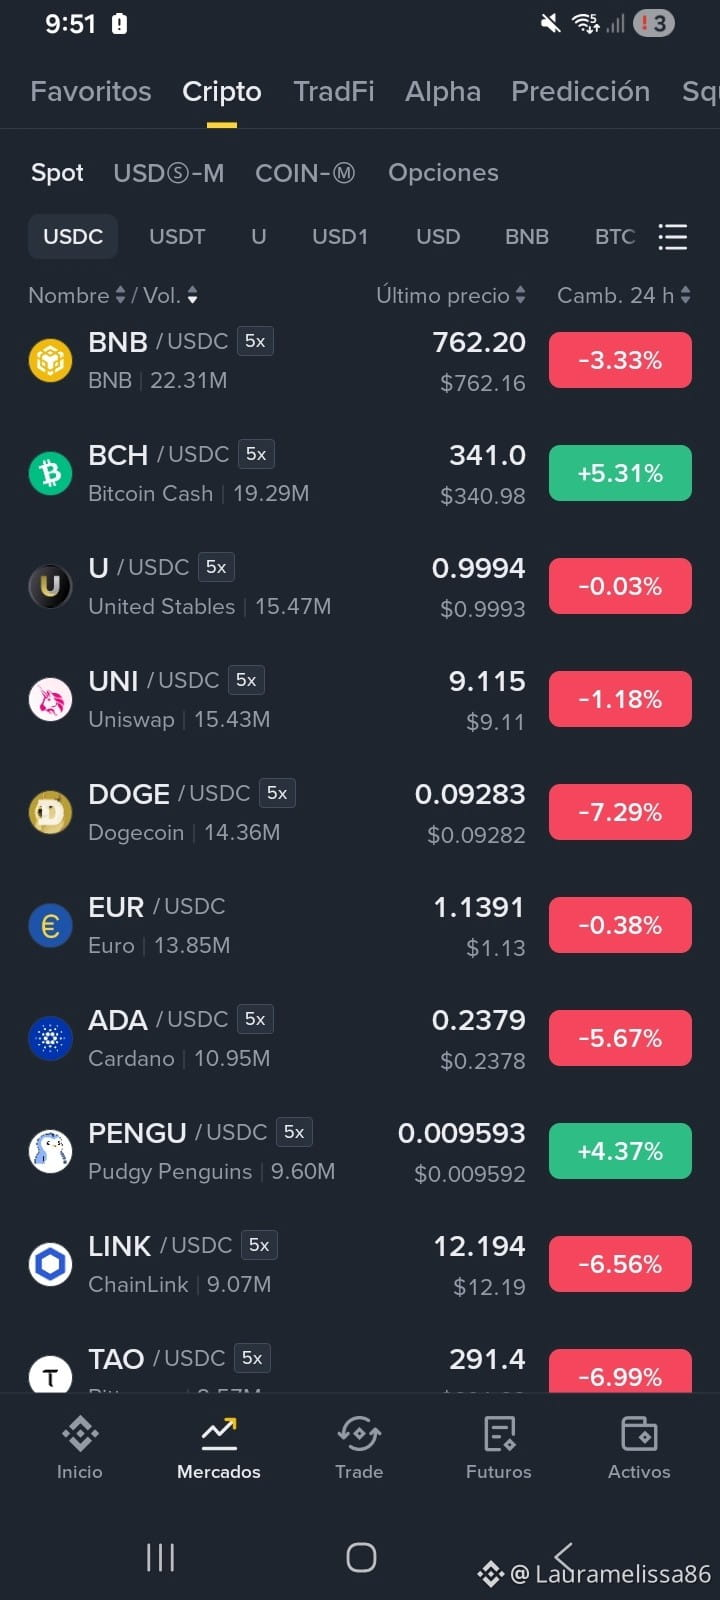
$BCH ($341.0, +5.31%): Continues to show notable strength by defending the $340 range with more than 19.2M in volume.
$PENGU ($0.0009593, +4.37%): Shows buy-side interest on a smaller market cap by accumulating 9.6M traded.
2️⃣ 📉 Pullbacks and healthy dips in altcoins:
$DOGE ($0.09283, -7.29%) and $TAO ($291.4, -6.99%): After reaching high zones, they give up ground while trying to test prior support levels.
$LINK ($12.194, -6.56%) and $ADA ($0.2379, -5.67%): Enter technical adjustment phases, losing the resistances they had just broken through.
3️⃣ 🛡️ $BNB absorbs the most liquidity ($762.20, -3.33%): Leads the list with 22.3M of USDC in volume, trading within a reaccumulation range above $760.
Corrections are not enemies of the trader; on the contrary, when selling volume declines during pullbacks, these moves help identify where the buy order blocks are positioned in order to assess new confirmations.
The resilience of BCH and PENGU:
$BCH ($341.0, +5.31%): Continues to show notable strength by defending the $340 range with more than 19.2M in volume.
$PENGU ($0.0009593, +4.37%): Shows buy-side interest on a smaller market cap by accumulating 9.6M traded.
2️⃣ 📉 Pullbacks and healthy dips in altcoins:
$DOGE ($0.09283, -7.29%) and $TAO ($291.4, -6.99%): After reaching high zones, they give up ground while trying to test prior support levels.
$LINK ($12.194, -6.56%) and $ADA ($0.2379, -5.67%): Enter technical adjustment phases, losing the resistances they had just broken through.
3️⃣ 🛡️ $BNB absorbs the most liquidity ($762.20, -3.33%): Leads the list with 22.3M of USDC in volume, trading within a reaccumulation range above $760.
Corrections are not enemies of the trader; on the contrary, when selling volume declines during pullbacks, these moves help identify where the buy order blocks are positioned in order to assess new confirmations.
$BCH ($341.0, +5.31%): Continues to show notable strength by defending the $340 range with more than 19.2M in volume.
$PENGU ($0.0009593, +4.37%): Shows buy-side interest on a smaller market cap by accumulating 9.6M traded.
2️⃣ 📉 Pullbacks and healthy dips in altcoins:
$DOGE ($0.09283, -7.29%) and $TAO ($291.4, -6.99%): After reaching high zones, they give up ground while trying to test prior support levels.
$LINK ($12.194, -6.56%) and $ADA ($0.2379, -5.67%): Enter technical adjustment phases, losing the resistances they had just broken through.
3️⃣ 🛡️ $BNB absorbs the most liquidity ($762.20, -3.33%): Leads the list with 22.3M of USDC in volume, trading within a reaccumulation range above $760.
Corrections are not enemies of the trader; on the contrary, when selling volume declines during pullbacks, these moves help identify where the buy order blocks are positioned in order to assess new confirmations.
1
1
639
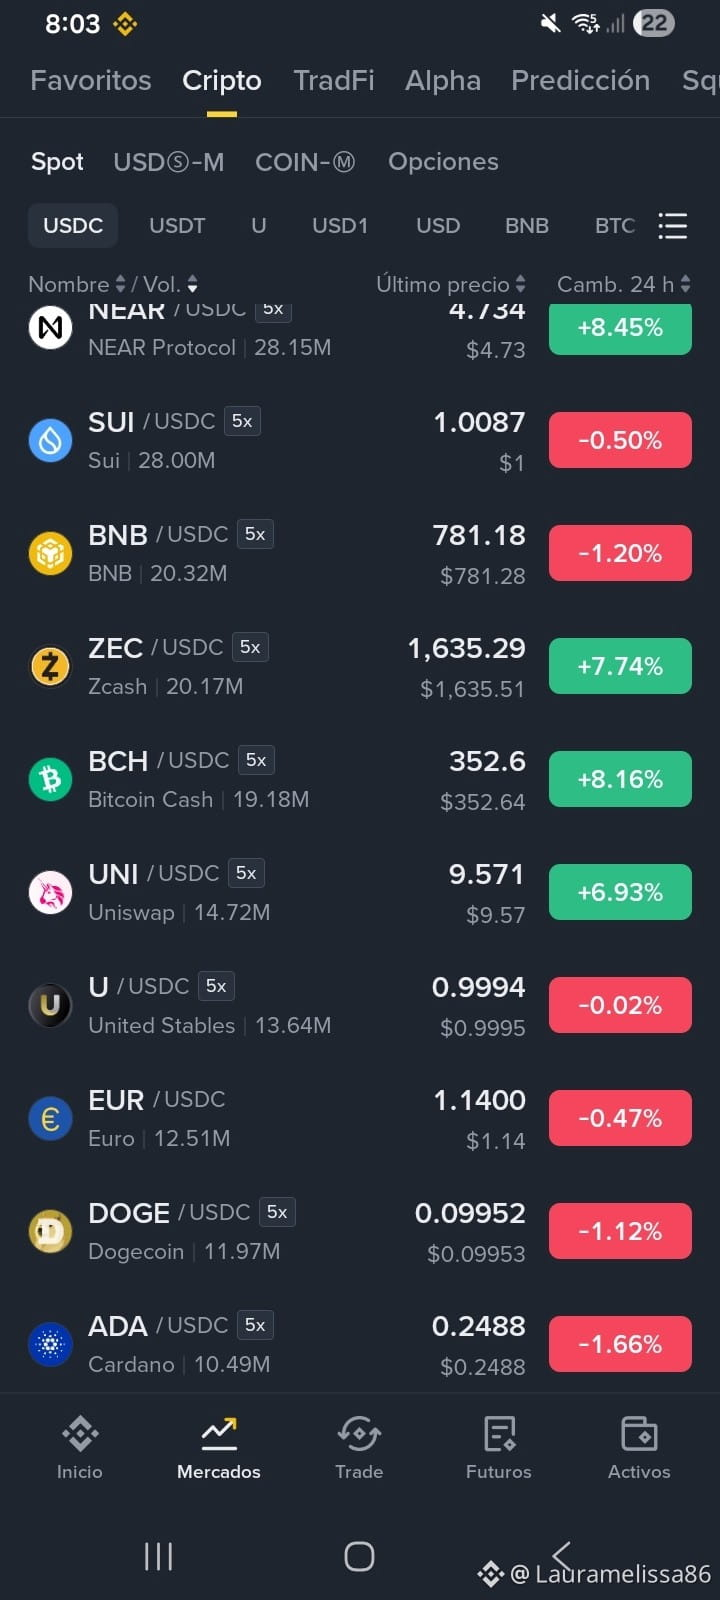
the board in Spot (USDC pairs) shows a clear bullish momentum led by ZEC, which breaks strongly by surpassing $1,630, while NEAR leads overall liquidity, hovering around $4.75, and BCH extends its rally above $350.
Highlights from the board (8:03)
NEAR dominates global volume: It takes the top spot on the list with 28.15M USDC traded and an advance of +8.45% ($4.734 USDC).
ZEC accelerates strongly: It breaks the previous resistance, rising +7.74% ($1,635.29 USDC) with a cumulative volume of 20.17M.
the board in Spot (USDC pairs) shows a clear bullish momentum led by ZEC, which breaks strongly by surpassing $1,630, while NEAR leads overall liquidity, hovering around $4.75, and BCH extends its rally above $350.
Highlights from the board (8:03)
NEAR dominates global volume: It takes the top spot on the list with 28.15M USDC traded and an advance of +8.45% ($4.734 USDC).
ZEC accelerates strongly: It breaks the previous resistance, rising +7.74% ($1,635.29 USDC) with a cumulative volume of 20.17M.
Highlights from the board (8:03)
NEAR dominates global volume: It takes the top spot on the list with 28.15M USDC traded and an advance of +8.45% ($4.734 USDC).
ZEC accelerates strongly: It breaks the previous resistance, rising +7.74% ($1,635.29 USDC) with a cumulative volume of 20.17M.
258
Why is it so important to read charts?
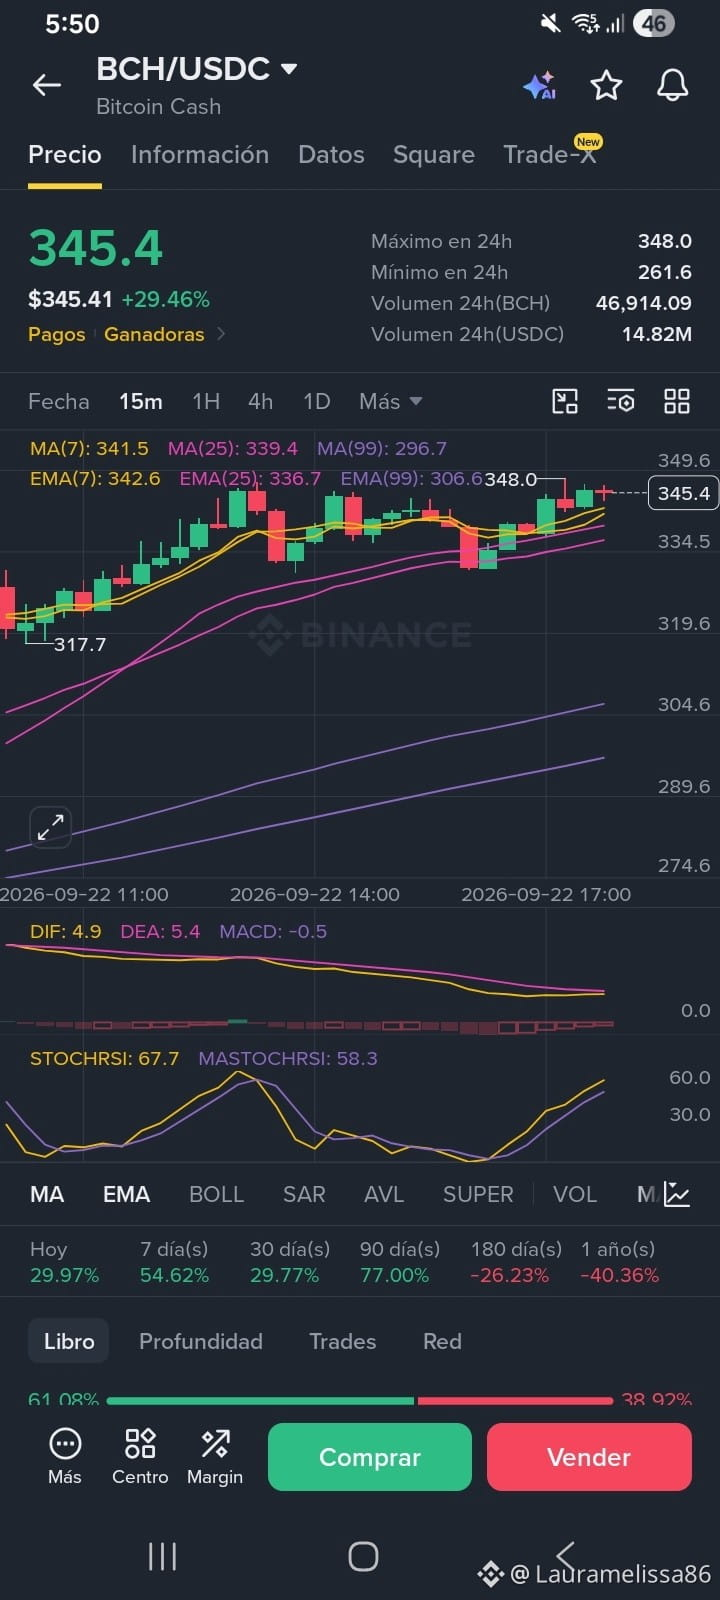
Reading charts—what we technically call Technical Analysis—is essential because it lets you make decisions based on data and the market’s real behavior, reducing improvisation and emotions when trading.
When you look at a chart, you’re not just seeing lines or candles going up and down; you’re seeing the collective psychology of all market participants projected over time.
1. Discover who has control (Trend)
The most basic principle of the market is to trade in the direction of the current.
Bullish trend: You spot higher highs and higher lows.
Bearish trend: You spot lower highs and lower lows, alerting you not to enter blindly while looking for a "floor."
2. Identify key supply and demand zones (Support and Resistance)
Charts reveal levels where price has historically reacted.
Supports: "Floor" zones where buyers often step in with strength because they believe the price is cheap.
Resistances: "Ceiling" zones where supply (sellers) usually stops the price from rising.
Knowing where these levels are prevents you from making the classic mistake of buying right at a resistance or selling right at a support.
3. Manage risk in a mathematical way
A chart gives you the structure you need to define your risk management plan.
Entry point: Wait for the price to confirm a structure instead of entering on impulse.
Stop-Loss: Identify the exact technical level where your analysis hypothesis is no longer valid, so you can close the trade with a small, controlled loss.
Take-Profit target: Project how far the price can go based on the next resistance or technical extension...
$BCH #XRP
Why is it so important to read charts?
Reading charts—what we technically call Technical Analysis—is essential because it lets you make decisions based on data and the market’s real behavior, reducing improvisation and emotions when trading.
When you look at a chart, you’re not just seeing lines or candles going up and down; you’re seeing the collective psychology of all market participants projected over time.
1. Discover who has control (Trend)
The most basic principle of the market is to trade in the direction of the current.
Bullish trend: You spot higher highs and higher lows.
Bearish trend: You spot lower highs and lower lows, alerting you not to enter blindly while looking for a "floor."
2. Identify key supply and demand zones (Support and Resistance)
Charts reveal levels where price has historically reacted.
Supports: "Floor" zones where buyers often step in with strength because they believe the price is cheap.
Resistances: "Ceiling" zones where supply (sellers) usually stops the price from rising.
Knowing where these levels are prevents you from making the classic mistake of buying right at a resistance or selling right at a support.
3. Manage risk in a mathematical way
A chart gives you the structure you need to define your risk management plan.
Entry point: Wait for the price to confirm a structure instead of entering on impulse.
Stop-Loss: Identify the exact technical level where your analysis hypothesis is no longer valid, so you can close the trade with a small, controlled loss.
Take-Profit target: Project how far the price can go based on the next resistance or technical extension...
$BCH #XRP
Reading charts—what we technically call Technical Analysis—is essential because it lets you make decisions based on data and the market’s real behavior, reducing improvisation and emotions when trading.
When you look at a chart, you’re not just seeing lines or candles going up and down; you’re seeing the collective psychology of all market participants projected over time.
1. Discover who has control (Trend)
The most basic principle of the market is to trade in the direction of the current.
Bullish trend: You spot higher highs and higher lows.
Bearish trend: You spot lower highs and lower lows, alerting you not to enter blindly while looking for a "floor."
2. Identify key supply and demand zones (Support and Resistance)
Charts reveal levels where price has historically reacted.
Supports: "Floor" zones where buyers often step in with strength because they believe the price is cheap.
Resistances: "Ceiling" zones where supply (sellers) usually stops the price from rising.
Knowing where these levels are prevents you from making the classic mistake of buying right at a resistance or selling right at a support.
3. Manage risk in a mathematical way
A chart gives you the structure you need to define your risk management plan.
Entry point: Wait for the price to confirm a structure instead of entering on impulse.
Stop-Loss: Identify the exact technical level where your analysis hypothesis is no longer valid, so you can close the trade with a small, controlled loss.
Take-Profit target: Project how far the price can go based on the next resistance or technical extension...
$BCH #XRP

1
2
712
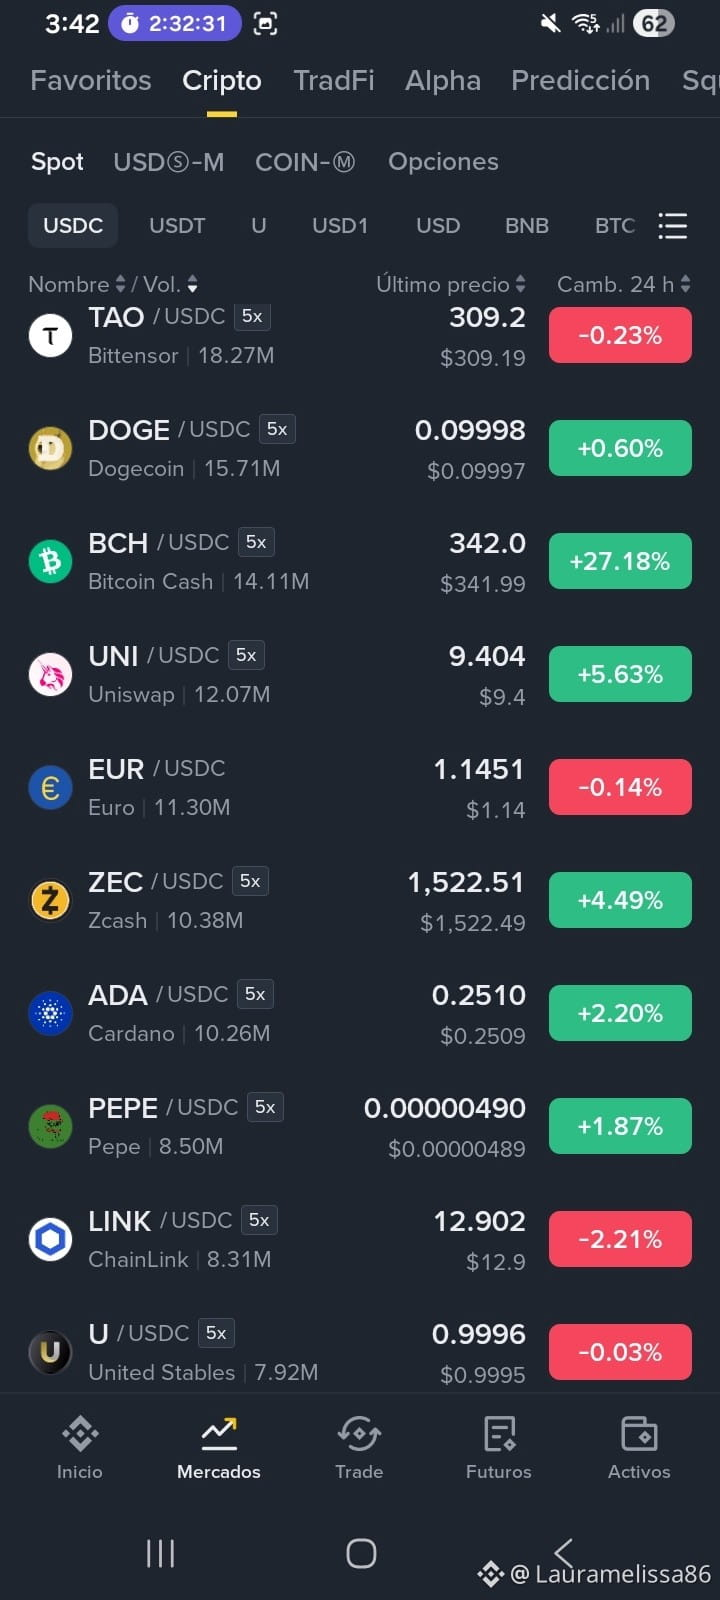
We look again at this segment of the Spot board (USDC) at midday. The reading is very clear: the capital that entered the intraday moves is successfully defending key support zones without generating panic selling.
Let’s review the key points for the group’s analysis:
1️⃣ 🚀 $BCH unstoppable in leadership (+27.18%, $342.0): It has accumulated more than 14M USDC in volume. Holding above $340 after a candle of such magnitude shows active buy absorption.
2️⃣ 🛡️ $ZEC consolidates support ($1,522.51, +4.49%): It continues doing the correct technical work. It absorbed the prior test and stays comfortably above $1,500 with a steady flow of 10.3M traded.
3️⃣ 🟢 ADA and UNI confirm acceleration:
$ADA ($0.2510, +2.20%): Breaks through the psychological barrier of $0.25, accumulating 10.2M in volume.
$UNI ($9.404, +5.63%): Continues to set higher lows and aims to consolidate the $9.40 band supported by 12M traded.
4️⃣ 🧘♂️ Pause in $TAO (309.2, -0.23\%) and $DOGE ($0.09998, +0.60%): Both assets enter a sideways accumulation range, moving about 34M together while processing liquidity in the upper zones.
When we see assets with double-digit gains like BCH and projects like ZEC holding clean floors, the Spot market sentiment reflects patience and confidence in the overall structure.
💬 What do you think about $ADA breaking above 0.25 and ZEC’s behavior holding $1,520?
We look again at this segment of the Spot board (USDC) at midday. The reading is very clear: the capital that entered the intraday moves is successfully defending key support zones without generating panic selling.
Let’s review the key points for the group’s analysis:
1️⃣ 🚀 $BCH unstoppable in leadership (+27.18%, $342.0): It has accumulated more than 14M USDC in volume. Holding above $340 after a candle of such magnitude shows active buy absorption.
2️⃣ 🛡️ $ZEC consolidates support ($1,522.51, +4.49%): It continues doing the correct technical work. It absorbed the prior test and stays comfortably above $1,500 with a steady flow of 10.3M traded.
3️⃣ 🟢 ADA and UNI confirm acceleration:
$ADA ($0.2510, +2.20%): Breaks through the psychological barrier of $0.25, accumulating 10.2M in volume.
$UNI ($9.404, +5.63%): Continues to set higher lows and aims to consolidate the $9.40 band supported by 12M traded.
4️⃣ 🧘♂️ Pause in $TAO (309.2, -0.23\%) and $DOGE ($0.09998, +0.60%): Both assets enter a sideways accumulation range, moving about 34M together while processing liquidity in the upper zones.
When we see assets with double-digit gains like BCH and projects like ZEC holding clean floors, the Spot market sentiment reflects patience and confidence in the overall structure.
💬 What do you think about $ADA breaking above 0.25 and ZEC’s behavior holding $1,520?
Let’s review the key points for the group’s analysis:
1️⃣ 🚀 $BCH unstoppable in leadership (+27.18%, $342.0): It has accumulated more than 14M USDC in volume. Holding above $340 after a candle of such magnitude shows active buy absorption.
2️⃣ 🛡️ $ZEC consolidates support ($1,522.51, +4.49%): It continues doing the correct technical work. It absorbed the prior test and stays comfortably above $1,500 with a steady flow of 10.3M traded.
3️⃣ 🟢 ADA and UNI confirm acceleration:
$ADA ($0.2510, +2.20%): Breaks through the psychological barrier of $0.25, accumulating 10.2M in volume.
$UNI ($9.404, +5.63%): Continues to set higher lows and aims to consolidate the $9.40 band supported by 12M traded.
4️⃣ 🧘♂️ Pause in $TAO (309.2, -0.23\%) and $DOGE ($0.09998, +0.60%): Both assets enter a sideways accumulation range, moving about 34M together while processing liquidity in the upper zones.
When we see assets with double-digit gains like BCH and projects like ZEC holding clean floors, the Spot market sentiment reflects patience and confidence in the overall structure.
💬 What do you think about $ADA breaking above 0.25 and ZEC’s behavior holding $1,520?
294
FUTUROS
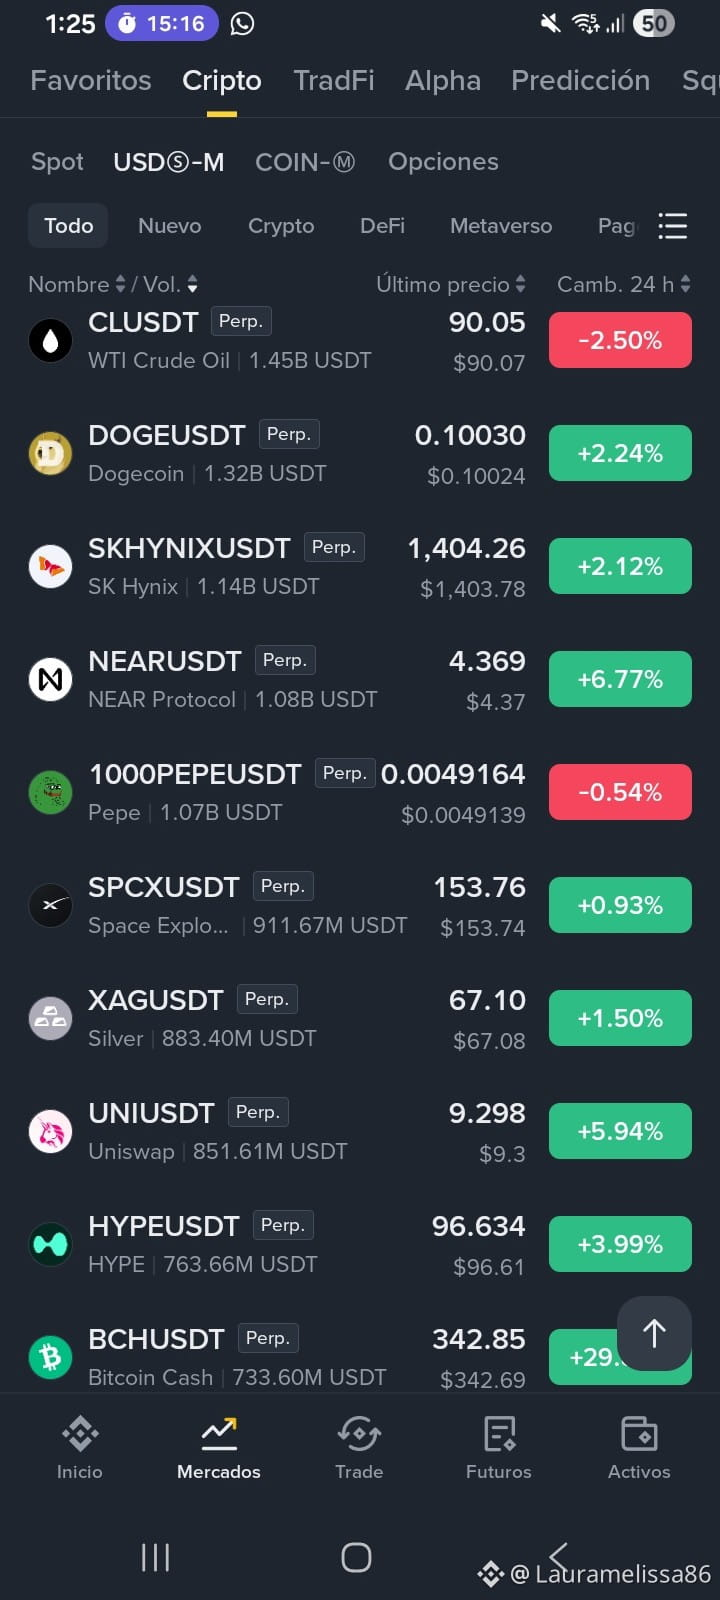
Switching to the USDⓈ-M Futures screen allows us to measure in real time the pulse of leverage, institutional liquidity, and the speed at which positions are being liquidated or opened within key ranges.
High-value points in Derivatives right now:
1️⃣ 🛢️ TradFi and Commodities dominate volume ($CL, $SKHYNIX,$XAG): The Crude Oil contract $CL ($90.05, -2.50%) leads with 1.45 billion USDT, while Silver $XAG ($67.10, +1.50%) absorbs 883M—showing that tokenized macroeconomics is pulling a large share of today’s arbitrage.
2️⃣ ⚡ $BCH unstoppable on leverage ($342.85, +29.21%): It’s the highest-return position on the board. It broke above $340, accumulating more than 733M in volume, where short liquidations are fueling the pace of the move.
3️⃣ 🟢 NEAR and UNI accelerate the trend: $NEAR ($4.369, +6.77%) surpasses 1.08B traded, confirming the breakout we’ve been watching in Spot, while $UNI ($9.298, +5.94%) is looking to establish a floor above $9.30, backed by 851M.
4️⃣ 🐕 $DOGE holds the $0.10 barrier ($0.10030, +2.24%): With 1.32 billion USDT traded, it absorbs short-term sell-side liquidity, maintaining a clean support structure.
💡 Risk Management:
Trading Futures requires discipline: when we see volume surges above 1B in high-beta assets or commodity contracts, intraday volatility increases drastically. Using moderate leverage and placing the Stop-Loss outside the wick/barrier zones (liquidation pools) is essential to protect capital while we follow the trend.
FUTUROS
Switching to the USDⓈ-M Futures screen allows us to measure in real time the pulse of leverage, institutional liquidity, and the speed at which positions are being liquidated or opened within key ranges.
High-value points in Derivatives right now:
1️⃣ 🛢️ TradFi and Commodities dominate volume ($CL, $SKHYNIX,$XAG): The Crude Oil contract $CL ($90.05, -2.50%) leads with 1.45 billion USDT, while Silver $XAG ($67.10, +1.50%) absorbs 883M—showing that tokenized macroeconomics is pulling a large share of today’s arbitrage.
2️⃣ ⚡ $BCH unstoppable on leverage ($342.85, +29.21%): It’s the highest-return position on the board. It broke above $340, accumulating more than 733M in volume, where short liquidations are fueling the pace of the move.
3️⃣ 🟢 NEAR and UNI accelerate the trend: $NEAR ($4.369, +6.77%) surpasses 1.08B traded, confirming the breakout we’ve been watching in Spot, while $UNI ($9.298, +5.94%) is looking to establish a floor above $9.30, backed by 851M.
4️⃣ 🐕 $DOGE holds the $0.10 barrier ($0.10030, +2.24%): With 1.32 billion USDT traded, it absorbs short-term sell-side liquidity, maintaining a clean support structure.
💡 Risk Management:
Trading Futures requires discipline: when we see volume surges above 1B in high-beta assets or commodity contracts, intraday volatility increases drastically. Using moderate leverage and placing the Stop-Loss outside the wick/barrier zones (liquidation pools) is essential to protect capital while we follow the trend.
Switching to the USDⓈ-M Futures screen allows us to measure in real time the pulse of leverage, institutional liquidity, and the speed at which positions are being liquidated or opened within key ranges.
High-value points in Derivatives right now:
1️⃣ 🛢️ TradFi and Commodities dominate volume ($CL, $SKHYNIX,$XAG): The Crude Oil contract $CL ($90.05, -2.50%) leads with 1.45 billion USDT, while Silver $XAG ($67.10, +1.50%) absorbs 883M—showing that tokenized macroeconomics is pulling a large share of today’s arbitrage.
2️⃣ ⚡ $BCH unstoppable on leverage ($342.85, +29.21%): It’s the highest-return position on the board. It broke above $340, accumulating more than 733M in volume, where short liquidations are fueling the pace of the move.
3️⃣ 🟢 NEAR and UNI accelerate the trend: $NEAR ($4.369, +6.77%) surpasses 1.08B traded, confirming the breakout we’ve been watching in Spot, while $UNI ($9.298, +5.94%) is looking to establish a floor above $9.30, backed by 851M.
4️⃣ 🐕 $DOGE holds the $0.10 barrier ($0.10030, +2.24%): With 1.32 billion USDT traded, it absorbs short-term sell-side liquidity, maintaining a clean support structure.
💡 Risk Management:
Trading Futures requires discipline: when we see volume surges above 1B in high-beta assets or commodity contracts, intraday volatility increases drastically. Using moderate leverage and placing the Stop-Loss outside the wick/barrier zones (liquidation pools) is essential to protect capital while we follow the trend.
1
1
219
🙊🙊
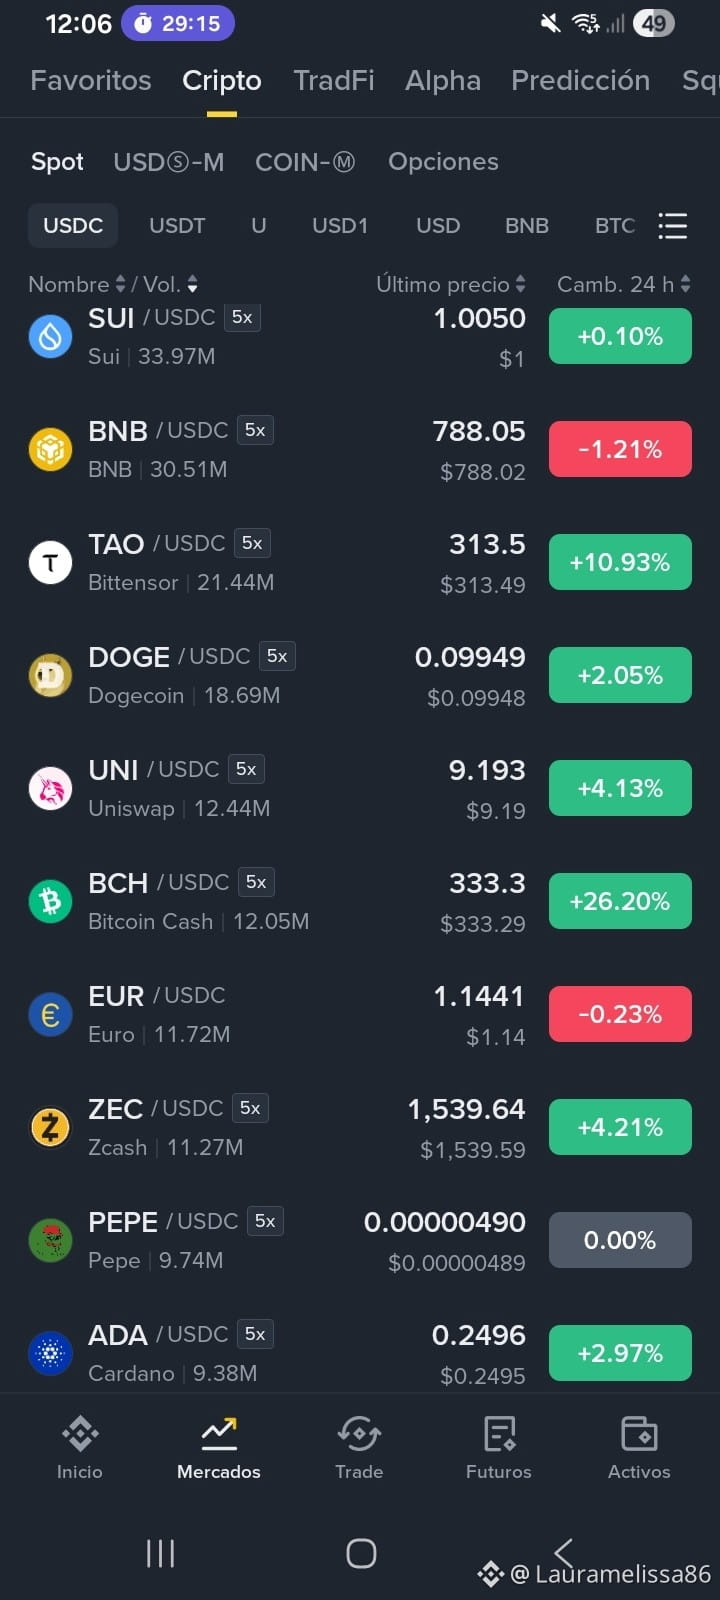
We see how capital does not leave the market, but rather migrates into assets that were already building accumulation to trigger strong breakouts.
Key points for the community analysis:
1️⃣ 🚀 Explosion in $BCH ($333.3, +26.20%): It’s the big surprise on the board right now. With 12M traded, it breaks medium-term resistances, showing massive buying inflow.
2️⃣ 🥇 $SUI defends leadership in volume ($1.0050, +0.10%): It leads the board’s liquidity with 33.97M USDC. It absorbs short-term sell pressure while maintaining dollar parity as a new support zone.
3️⃣ 🔥 TAO and ZEC resume their uptrend:
$TAO ($313.5, +10.93%): Firmly holds the $310 barrier, backed by 21.4M in volume.
$ZEC ($1,539.64, +4.21%): Fully absorbed the previous pullback and turns green again, showing steady reaccumulation around $1,500.
4️⃣ 🟢 $UNI, DOGE, and ADA back the strength: $UNI ($9.193, +4.13%) breaks toward $9.20, while $ADA ($0.2496, +2.97%) looks to test the psychological zone of $0.25.
💡
$ZEC recovering $1,539 together with the breakout of $BCH to +26% shows a clear pattern: Spot traders are using local supports to reaccumulate positions instead of liquidating.
💬 How do you see the momentum of $BCH targeting 340, or do you prefer the consolidated structure shown by $ZEC recovering the upper zone?
🙊🙊
We see how capital does not leave the market, but rather migrates into assets that were already building accumulation to trigger strong breakouts.
Key points for the community analysis:
1️⃣ 🚀 Explosion in $BCH ($333.3, +26.20%): It’s the big surprise on the board right now. With 12M traded, it breaks medium-term resistances, showing massive buying inflow.
2️⃣ 🥇 $SUI defends leadership in volume ($1.0050, +0.10%): It leads the board’s liquidity with 33.97M USDC. It absorbs short-term sell pressure while maintaining dollar parity as a new support zone.
3️⃣ 🔥 TAO and ZEC resume their uptrend:
$TAO ($313.5, +10.93%): Firmly holds the $310 barrier, backed by 21.4M in volume.
$ZEC ($1,539.64, +4.21%): Fully absorbed the previous pullback and turns green again, showing steady reaccumulation around $1,500.
4️⃣ 🟢 $UNI, DOGE, and ADA back the strength: $UNI ($9.193, +4.13%) breaks toward $9.20, while $ADA ($0.2496, +2.97%) looks to test the psychological zone of $0.25.
💡
$ZEC recovering $1,539 together with the breakout of $BCH to +26% shows a clear pattern: Spot traders are using local supports to reaccumulate positions instead of liquidating.
💬 How do you see the momentum of $BCH targeting 340, or do you prefer the consolidated structure shown by $ZEC recovering the upper zone?
We see how capital does not leave the market, but rather migrates into assets that were already building accumulation to trigger strong breakouts.
Key points for the community analysis:
1️⃣ 🚀 Explosion in $BCH ($333.3, +26.20%): It’s the big surprise on the board right now. With 12M traded, it breaks medium-term resistances, showing massive buying inflow.
2️⃣ 🥇 $SUI defends leadership in volume ($1.0050, +0.10%): It leads the board’s liquidity with 33.97M USDC. It absorbs short-term sell pressure while maintaining dollar parity as a new support zone.
3️⃣ 🔥 TAO and ZEC resume their uptrend:
$TAO ($313.5, +10.93%): Firmly holds the $310 barrier, backed by 21.4M in volume.
$ZEC ($1,539.64, +4.21%): Fully absorbed the previous pullback and turns green again, showing steady reaccumulation around $1,500.
4️⃣ 🟢 $UNI, DOGE, and ADA back the strength: $UNI ($9.193, +4.13%) breaks toward $9.20, while $ADA ($0.2496, +2.97%) looks to test the psychological zone of $0.25.
💡
$ZEC recovering $1,539 together with the breakout of $BCH to +26% shows a clear pattern: Spot traders are using local supports to reaccumulate positions instead of liquidating.
💬 How do you see the momentum of $BCH targeting 340, or do you prefer the consolidated structure shown by $ZEC recovering the upper zone?
1
1
534
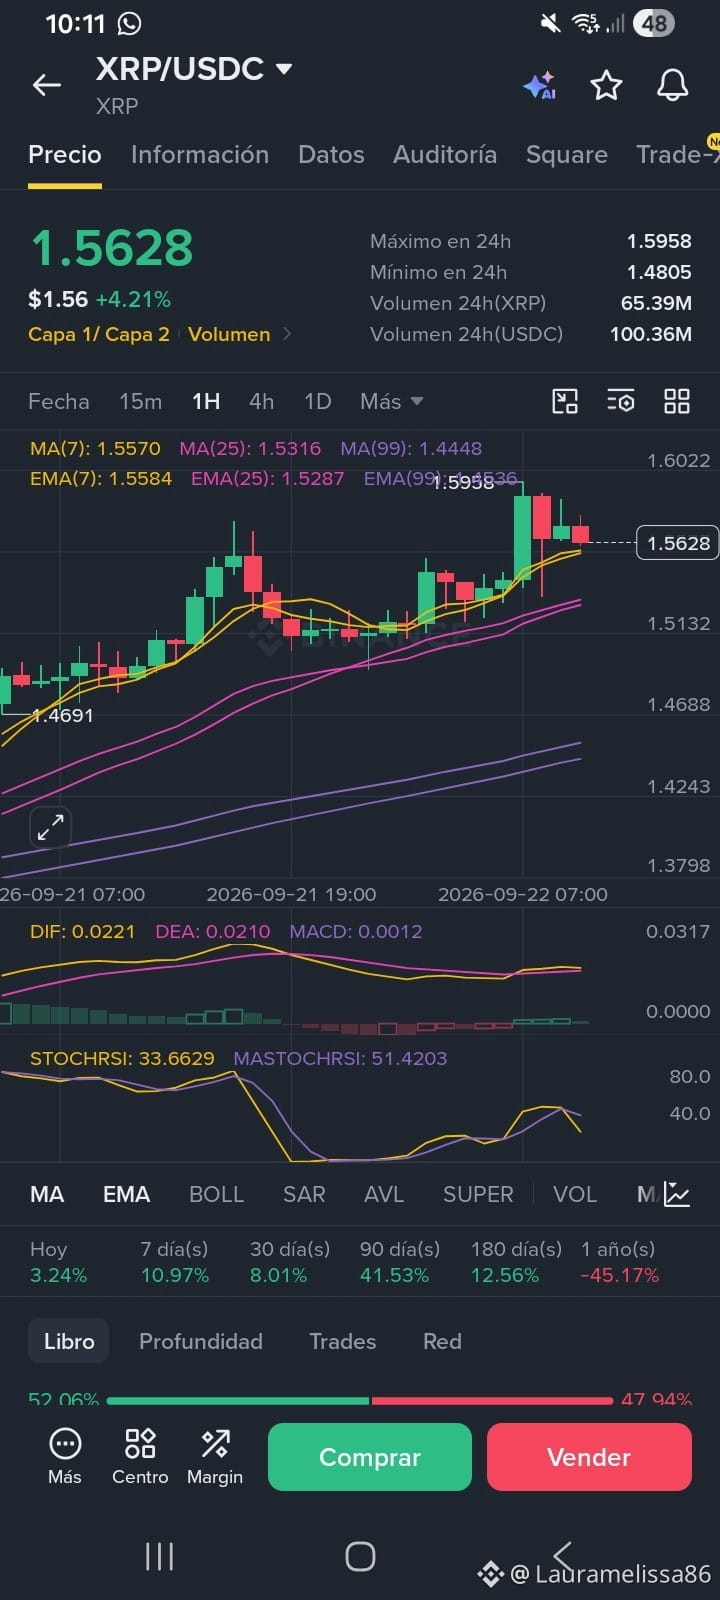
XRP we continue studying..
We have:
1H Trend: 🟢 bullish
Price vs EMAs: 🟢
EMA7 > EMA25 > EMA99: 🟢
MACD: 🟢 positive
StochRSI: 🟡 cooling down
Resistance: 🔴 1.5958–1.60
Short support: 🟡 1.55–1.558
Important support: 🟢 1.528–1.532
So I would NOT chase XRP at 1.5628.
I would wait to see what it does.
Scenario A 🟢
1.5958 → breaks with volume → holds the zone
There we would need to study a possible continuation.
Scenario B 🟡
1.5628 → pulls back → reaches 1.55–1.558 → finds buyers
That would give us another interesting structure to watch.
Scenario C 🔴
It loses 1.55 and then 1.528–1.532 with strength.
At that point we wouldn’t assume the uptrend continues.
😁😁question as an exercise, 😏
Without me telling you the answer:
If you had to mark it right now in the screenshot:
Where would you place the resistance?
Where would you place the first support?
Do you see the 1H trend as bullish or bearish?
And most importantly: would you enter LONG right now at 1.5628 or would you wait?
answer...
XRP we continue studying..
We have:
1H Trend: 🟢 bullish
Price vs EMAs: 🟢
EMA7 > EMA25 > EMA99: 🟢
MACD: 🟢 positive
StochRSI: 🟡 cooling down
Resistance: 🔴 1.5958–1.60
Short support: 🟡 1.55–1.558
Important support: 🟢 1.528–1.532
So I would NOT chase XRP at 1.5628.
I would wait to see what it does.
Scenario A 🟢
1.5958 → breaks with volume → holds the zone
There we would need to study a possible continuation.
Scenario B 🟡
1.5628 → pulls back → reaches 1.55–1.558 → finds buyers
That would give us another interesting structure to watch.
Scenario C 🔴
It loses 1.55 and then 1.528–1.532 with strength.
At that point we wouldn’t assume the uptrend continues.
😁😁question as an exercise, 😏
Without me telling you the answer:
If you had to mark it right now in the screenshot:
Where would you place the resistance?
Where would you place the first support?
Do you see the 1H trend as bullish or bearish?
And most importantly: would you enter LONG right now at 1.5628 or would you wait?
answer...
We have:
1H Trend: 🟢 bullish
Price vs EMAs: 🟢
EMA7 > EMA25 > EMA99: 🟢
MACD: 🟢 positive
StochRSI: 🟡 cooling down
Resistance: 🔴 1.5958–1.60
Short support: 🟡 1.55–1.558
Important support: 🟢 1.528–1.532
So I would NOT chase XRP at 1.5628.
I would wait to see what it does.
Scenario A 🟢
1.5958 → breaks with volume → holds the zone
There we would need to study a possible continuation.
Scenario B 🟡
1.5628 → pulls back → reaches 1.55–1.558 → finds buyers
That would give us another interesting structure to watch.
Scenario C 🔴
It loses 1.55 and then 1.528–1.532 with strength.
At that point we wouldn’t assume the uptrend continues.
😁😁question as an exercise, 😏
Without me telling you the answer:
If you had to mark it right now in the screenshot:
Where would you place the resistance?
Where would you place the first support?
Do you see the 1H trend as bullish or bearish?
And most importantly: would you enter LONG right now at 1.5628 or would you wait?
answer...
1
1
506
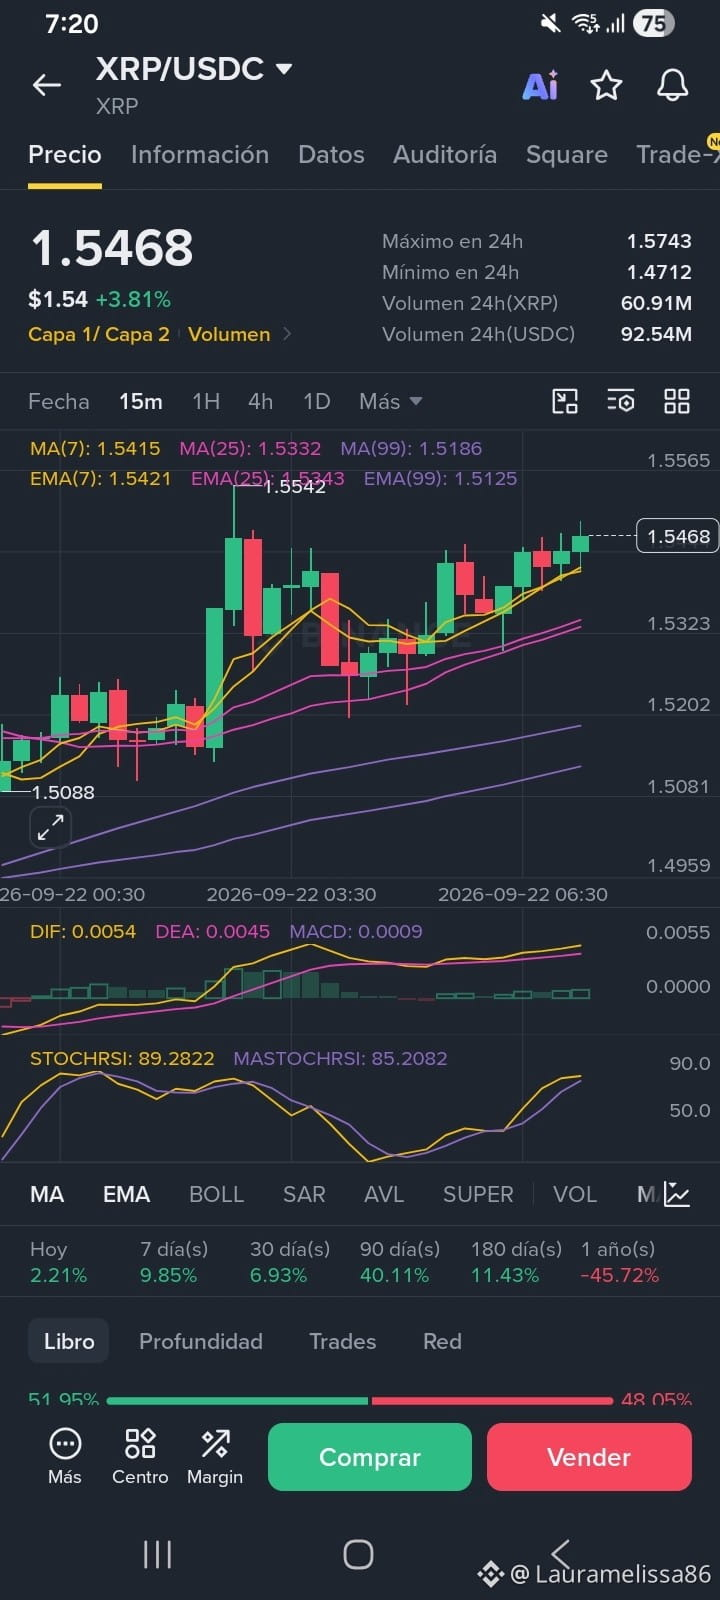
Where is the price relative to the Moving Averages (EMAs)?
Current price: 1.5468.
EMA 7 (Yellow Line): 1.5421.
EMA 25 (Purple Line): 1.5343.
EMA 99 (Lower Blue/Violet Line): 1.5125.
Structure: The price is trading above the EMA 7 and the EMA 25, keeping a clear bullish alignment in the short term (EMA 7 > EMA 25 > EMA 99).
2. Where is the Floor (Support) and the Ceiling (Resistance)?
Immediate Ceiling (Resistance): The 1.5542 - 1.5565 zone (where the previous upper wick was). The 24h high is at 1.5743.
Immediate Floor (Support): The crossover with EMA 7 at 1.5421 and EMA 25 at 1.5343.
Floor support: The local low at 1.5088.
3. What do the auxiliary indicators say?
MACD: It’s green and with a positive histogram above zero (0.0009), confirming buying momentum on the 15m timeframe.
StochRSI (Stochastic): It’s very high in the overbought zone (89.28). This means there’s little “fuel” left immediately for this micro-rally without first pausing.
🎯 Detective’s Verdict: Wait / Wait for a retest
❌ Don’t go Long at the top: Even though the 15m trend is rising, StochRSI is brushing the ceiling (89 points) and the price is hitting near the 1.5542 resistance. Entering now means buying expensive.
❌ Don’t go Short against the trend: Shorting when price is above the EMA 7/25 and MACD is positive is going against the current in this timeframe.
✅ The smart play (Wait):
If you want to look for a Long: Wait for the price to make a small pullback to find support at EMA 7 (1.5420) or EMA 25 (1.5340), and for StochRSI to drop to give room for the rebound.
If the price strongly rejects 1.5542 and breaks below the EMA 7 with a red volume candle, only then could you evaluate a correction.
How do you see that 1.5542 resistance—do you notice how it’s struggling to break it on this last candle?
Where is the price relative to the Moving Averages (EMAs)?
Current price: 1.5468.
EMA 7 (Yellow Line): 1.5421.
EMA 25 (Purple Line): 1.5343.
EMA 99 (Lower Blue/Violet Line): 1.5125.
Structure: The price is trading above the EMA 7 and the EMA 25, keeping a clear bullish alignment in the short term (EMA 7 > EMA 25 > EMA 99).
2. Where is the Floor (Support) and the Ceiling (Resistance)?
Immediate Ceiling (Resistance): The 1.5542 - 1.5565 zone (where the previous upper wick was). The 24h high is at 1.5743.
Immediate Floor (Support): The crossover with EMA 7 at 1.5421 and EMA 25 at 1.5343.
Floor support: The local low at 1.5088.
3. What do the auxiliary indicators say?
MACD: It’s green and with a positive histogram above zero (0.0009), confirming buying momentum on the 15m timeframe.
StochRSI (Stochastic): It’s very high in the overbought zone (89.28). This means there’s little “fuel” left immediately for this micro-rally without first pausing.
🎯 Detective’s Verdict: Wait / Wait for a retest
❌ Don’t go Long at the top: Even though the 15m trend is rising, StochRSI is brushing the ceiling (89 points) and the price is hitting near the 1.5542 resistance. Entering now means buying expensive.
❌ Don’t go Short against the trend: Shorting when price is above the EMA 7/25 and MACD is positive is going against the current in this timeframe.
✅ The smart play (Wait):
If you want to look for a Long: Wait for the price to make a small pullback to find support at EMA 7 (1.5420) or EMA 25 (1.5340), and for StochRSI to drop to give room for the rebound.
If the price strongly rejects 1.5542 and breaks below the EMA 7 with a red volume candle, only then could you evaluate a correction.
How do you see that 1.5542 resistance—do you notice how it’s struggling to break it on this last candle?
Current price: 1.5468.
EMA 7 (Yellow Line): 1.5421.
EMA 25 (Purple Line): 1.5343.
EMA 99 (Lower Blue/Violet Line): 1.5125.
Structure: The price is trading above the EMA 7 and the EMA 25, keeping a clear bullish alignment in the short term (EMA 7 > EMA 25 > EMA 99).
2. Where is the Floor (Support) and the Ceiling (Resistance)?
Immediate Ceiling (Resistance): The 1.5542 - 1.5565 zone (where the previous upper wick was). The 24h high is at 1.5743.
Immediate Floor (Support): The crossover with EMA 7 at 1.5421 and EMA 25 at 1.5343.
Floor support: The local low at 1.5088.
3. What do the auxiliary indicators say?
MACD: It’s green and with a positive histogram above zero (0.0009), confirming buying momentum on the 15m timeframe.
StochRSI (Stochastic): It’s very high in the overbought zone (89.28). This means there’s little “fuel” left immediately for this micro-rally without first pausing.
🎯 Detective’s Verdict: Wait / Wait for a retest
❌ Don’t go Long at the top: Even though the 15m trend is rising, StochRSI is brushing the ceiling (89 points) and the price is hitting near the 1.5542 resistance. Entering now means buying expensive.
❌ Don’t go Short against the trend: Shorting when price is above the EMA 7/25 and MACD is positive is going against the current in this timeframe.
✅ The smart play (Wait):
If you want to look for a Long: Wait for the price to make a small pullback to find support at EMA 7 (1.5420) or EMA 25 (1.5340), and for StochRSI to drop to give room for the rebound.
If the price strongly rejects 1.5542 and breaks below the EMA 7 with a red volume candle, only then could you evaluate a correction.
How do you see that 1.5542 resistance—do you notice how it’s struggling to break it on this last candle?

1
3
1.3k
VERY GOOD MORNING 😍😘
We open this new review of the Spot board (USDC), observing a clear digestion of gains in some pairs, while capital rotates into assets that continue marking structure breakouts.
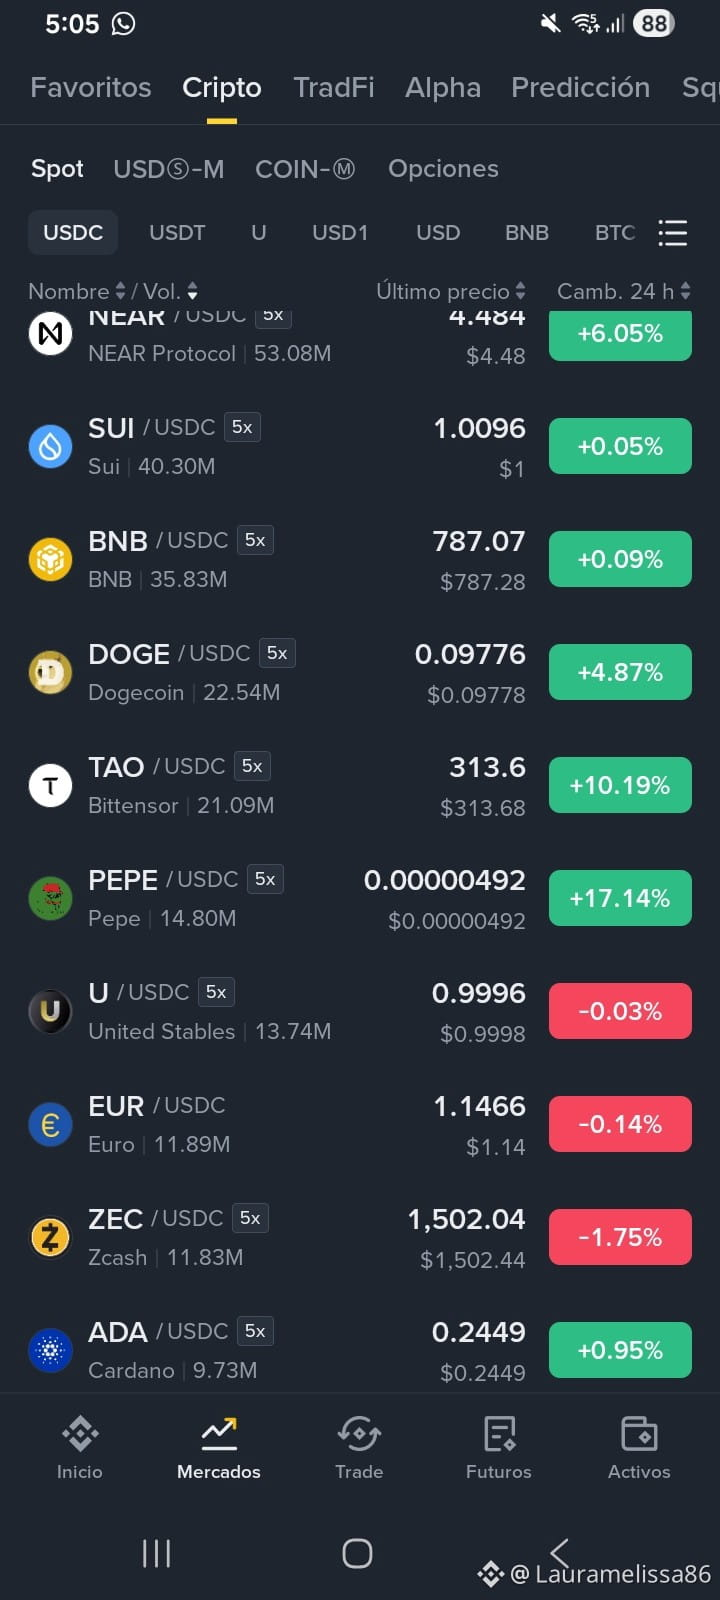
Let’s analyze the most relevant from the screen at this hour:
1️⃣ 🚀 $NEAR takes command of liquidity ($4.484, +6.05%): It leads the board’s total volume, surpassing 53M USDC traded. After the previous breakout, it doesn’t ease off and marks a very clean buying structure.
2️⃣ 🔥 PEPE and TAO accelerate strongly:
$PEPE ($0.00000492, +17.14%): Leads the board’s percentage gains with 14.8M in volume.
$TAO ($313.6, +10.19%): Manages to hold the upper range above $310, supported by 21M traded.
3️⃣ 🛡️ $ZEC defends a key zone ($1,502.04, -1.75%): After the intraday adjustment, it shows absorption right at the psychological barrier of $1,500—an area where demand often appears to build new ranges.
4️⃣ 🧘♂️ Pause and consolidation in SUI and BNB: $SUI ($1.0096, +0.05%) and $BNB ($787.07, +0.09%) move into a sideways range, absorbing sell orders and moving between both about 76M USDC.
Seeing how NEAR takes the lead in volume while ZEC defends key supports reminds us that liquidity within the Spot market is still very much alive. Consolidations in major assets often set the stage for the next moves of the block.
Watch how $ZEC behaves above $1,500 and how far they think the buying strength of $NEAR will reach in the coming hours? 🤔🤔🤭🤭
VERY GOOD MORNING 😍😘
We open this new review of the Spot board (USDC), observing a clear digestion of gains in some pairs, while capital rotates into assets that continue marking structure breakouts.
Let’s analyze the most relevant from the screen at this hour:
1️⃣ 🚀 $NEAR takes command of liquidity ($4.484, +6.05%): It leads the board’s total volume, surpassing 53M USDC traded. After the previous breakout, it doesn’t ease off and marks a very clean buying structure.
2️⃣ 🔥 PEPE and TAO accelerate strongly:
$PEPE ($0.00000492, +17.14%): Leads the board’s percentage gains with 14.8M in volume.
$TAO ($313.6, +10.19%): Manages to hold the upper range above $310, supported by 21M traded.
3️⃣ 🛡️ $ZEC defends a key zone ($1,502.04, -1.75%): After the intraday adjustment, it shows absorption right at the psychological barrier of $1,500—an area where demand often appears to build new ranges.
4️⃣ 🧘♂️ Pause and consolidation in SUI and BNB: $SUI ($1.0096, +0.05%) and $BNB ($787.07, +0.09%) move into a sideways range, absorbing sell orders and moving between both about 76M USDC.
Seeing how NEAR takes the lead in volume while ZEC defends key supports reminds us that liquidity within the Spot market is still very much alive. Consolidations in major assets often set the stage for the next moves of the block.
Watch how $ZEC behaves above $1,500 and how far they think the buying strength of $NEAR will reach in the coming hours? 🤔🤔🤭🤭
We open this new review of the Spot board (USDC), observing a clear digestion of gains in some pairs, while capital rotates into assets that continue marking structure breakouts.
Let’s analyze the most relevant from the screen at this hour:
1️⃣ 🚀 $NEAR takes command of liquidity ($4.484, +6.05%): It leads the board’s total volume, surpassing 53M USDC traded. After the previous breakout, it doesn’t ease off and marks a very clean buying structure.
2️⃣ 🔥 PEPE and TAO accelerate strongly:
$PEPE ($0.00000492, +17.14%): Leads the board’s percentage gains with 14.8M in volume.
$TAO ($313.6, +10.19%): Manages to hold the upper range above $310, supported by 21M traded.
3️⃣ 🛡️ $ZEC defends a key zone ($1,502.04, -1.75%): After the intraday adjustment, it shows absorption right at the psychological barrier of $1,500—an area where demand often appears to build new ranges.
4️⃣ 🧘♂️ Pause and consolidation in SUI and BNB: $SUI ($1.0096, +0.05%) and $BNB ($787.07, +0.09%) move into a sideways range, absorbing sell orders and moving between both about 76M USDC.
Seeing how NEAR takes the lead in volume while ZEC defends key supports reminds us that liquidity within the Spot market is still very much alive. Consolidations in major assets often set the stage for the next moves of the block.
Watch how $ZEC behaves above $1,500 and how far they think the buying strength of $NEAR will reach in the coming hours? 🤔🤔🤭🤭
2
931
Massive rotation on Spot! $XRP and $SOL lead liquidity, $TAO rockets to 316 (+19\%) and $DOGE breaks $0.10 🚀🟢
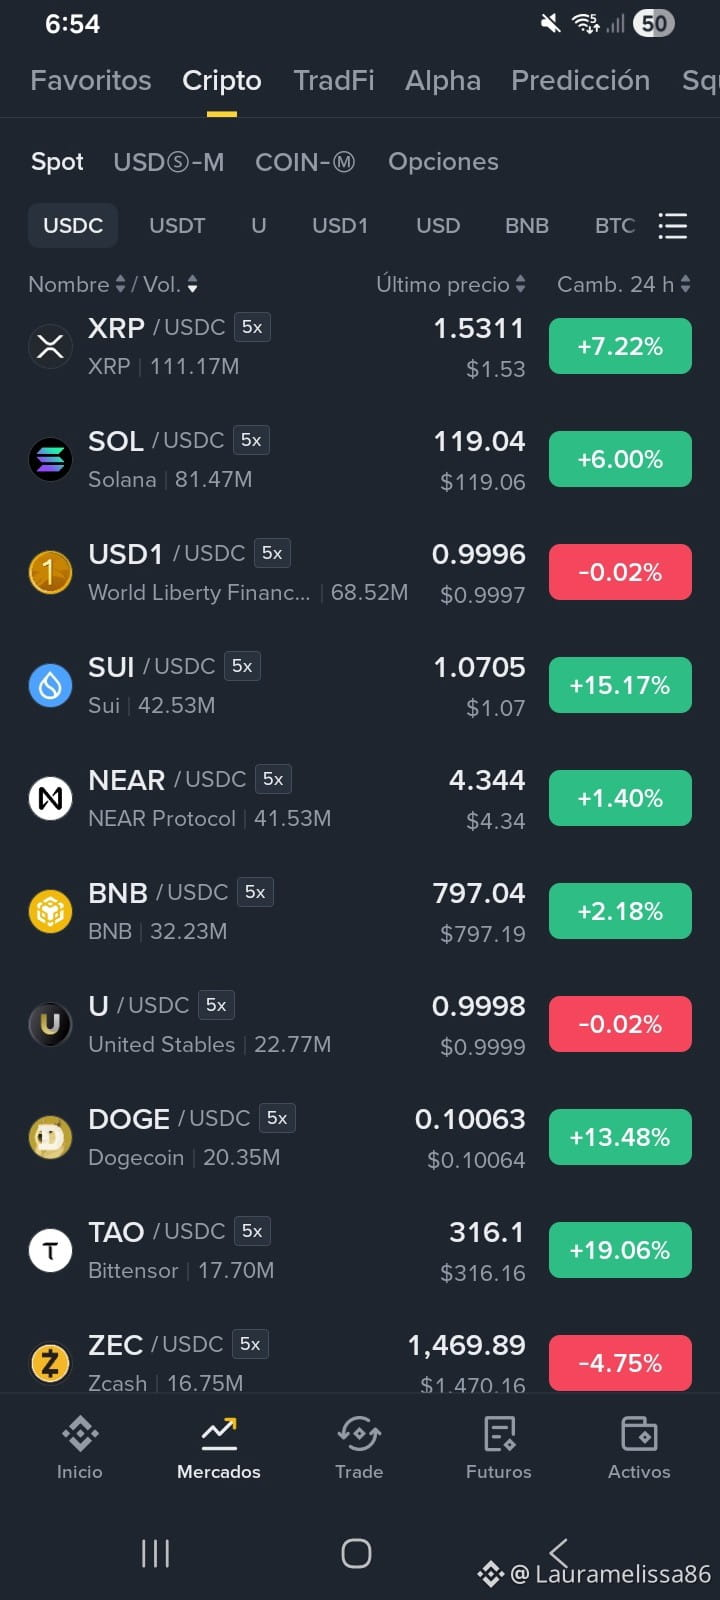
The Spot market dynamics (USDC) give us a clear lesson in capital rotation: the flow doesn’t stop—it migrates from assets that have already extended their move toward projects that started their breakout with volume.
Let’s review the key points on the screen at this hour:
1️⃣ 🌊 XRP andSOL take the most liquidity:
$XRP ($1.5311, +7.22%): Tops the board, accumulating more than 111M in volume.
$SOL ($119.04, +6.00%): Accelerates, aiming for the $120.00 range with 81.4M traded.
2️⃣ 🚀 Explosion in TAO and breakout in DOGE:
$TAO ($316.1, +19.06%): Marks one of the strongest performances on the list, breaking through the $310 barrier with 17.7M.
$DOGE ($0.10063, +13.48%): Decisively surpasses the psychological level of $0.10, backed by 20.3M in volume.
3️⃣ 🛡️ $SUI, NEAR and BNB hold high structures: $SUI ($1.0705, +15.17%) and $NEAR ($4.344, +1.40%) absorb more than 40M each, maintaining rising floors, while $BNB ($797.04, +2.18%) is just a step away from $800.
4️⃣ 📉 Pause in $ZEC ($1,469.89, -4.75%): Moves into a natural profit-taking phase after searching high zones, testing key supports to consolidate the chart’s structure.
💡
Watch how liquidity rotates from $ZEC or NEAR into XRP, SOL and TAO—an excellent example of market efficiency. Gains made in some assets feed buying strength in the next.
💬 Which of these breakouts do you think will hold the best structure for the next few hours: the strength of $SOL aiming for $120, or the acceleration of $TAO?
Massive rotation on Spot! $XRP and $SOL lead liquidity, $TAO rockets to 316 (+19\%) and $DOGE breaks $0.10 🚀🟢
The Spot market dynamics (USDC) give us a clear lesson in capital rotation: the flow doesn’t stop—it migrates from assets that have already extended their move toward projects that started their breakout with volume.
Let’s review the key points on the screen at this hour:
1️⃣ 🌊 XRP andSOL take the most liquidity:
$XRP ($1.5311, +7.22%): Tops the board, accumulating more than 111M in volume.
$SOL ($119.04, +6.00%): Accelerates, aiming for the $120.00 range with 81.4M traded.
2️⃣ 🚀 Explosion in TAO and breakout in DOGE:
$TAO ($316.1, +19.06%): Marks one of the strongest performances on the list, breaking through the $310 barrier with 17.7M.
$DOGE ($0.10063, +13.48%): Decisively surpasses the psychological level of $0.10, backed by 20.3M in volume.
3️⃣ 🛡️ $SUI, NEAR and BNB hold high structures: $SUI ($1.0705, +15.17%) and $NEAR ($4.344, +1.40%) absorb more than 40M each, maintaining rising floors, while $BNB ($797.04, +2.18%) is just a step away from $800.
4️⃣ 📉 Pause in $ZEC ($1,469.89, -4.75%): Moves into a natural profit-taking phase after searching high zones, testing key supports to consolidate the chart’s structure.
💡
Watch how liquidity rotates from $ZEC or NEAR into XRP, SOL and TAO—an excellent example of market efficiency. Gains made in some assets feed buying strength in the next.
💬 Which of these breakouts do you think will hold the best structure for the next few hours: the strength of $SOL aiming for $120, or the acceleration of $TAO?
The Spot market dynamics (USDC) give us a clear lesson in capital rotation: the flow doesn’t stop—it migrates from assets that have already extended their move toward projects that started their breakout with volume.
Let’s review the key points on the screen at this hour:
1️⃣ 🌊 XRP andSOL take the most liquidity:
$XRP ($1.5311, +7.22%): Tops the board, accumulating more than 111M in volume.
$SOL ($119.04, +6.00%): Accelerates, aiming for the $120.00 range with 81.4M traded.
2️⃣ 🚀 Explosion in TAO and breakout in DOGE:
$TAO ($316.1, +19.06%): Marks one of the strongest performances on the list, breaking through the $310 barrier with 17.7M.
$DOGE ($0.10063, +13.48%): Decisively surpasses the psychological level of $0.10, backed by 20.3M in volume.
3️⃣ 🛡️ $SUI, NEAR and BNB hold high structures: $SUI ($1.0705, +15.17%) and $NEAR ($4.344, +1.40%) absorb more than 40M each, maintaining rising floors, while $BNB ($797.04, +2.18%) is just a step away from $800.
4️⃣ 📉 Pause in $ZEC ($1,469.89, -4.75%): Moves into a natural profit-taking phase after searching high zones, testing key supports to consolidate the chart’s structure.
💡
Watch how liquidity rotates from $ZEC or NEAR into XRP, SOL and TAO—an excellent example of market efficiency. Gains made in some assets feed buying strength in the next.
💬 Which of these breakouts do you think will hold the best structure for the next few hours: the strength of $SOL aiming for $120, or the acceleration of $TAO?
3
994
When the Spot volume shifts from seeking support into confirming new intraday highs (as we see in SUI and TAO), the market sends a clear signal of continuity. Maintaining discipline in monitoring local supports remains the best tool for managing risk.
When the Spot volume shifts from seeking support into confirming new intraday highs (as we see in SUI and TAO), the market sends a clear signal of continuity. Maintaining discipline in monitoring local supports remains the best tool for managing risk.

1
489
Let’s start the week..
Explosion in Spot! $SUI is up over +26% ($1.03), $NEAR leads the volume above 4.18, and $ZEC soars to $1,542 🚀🟢
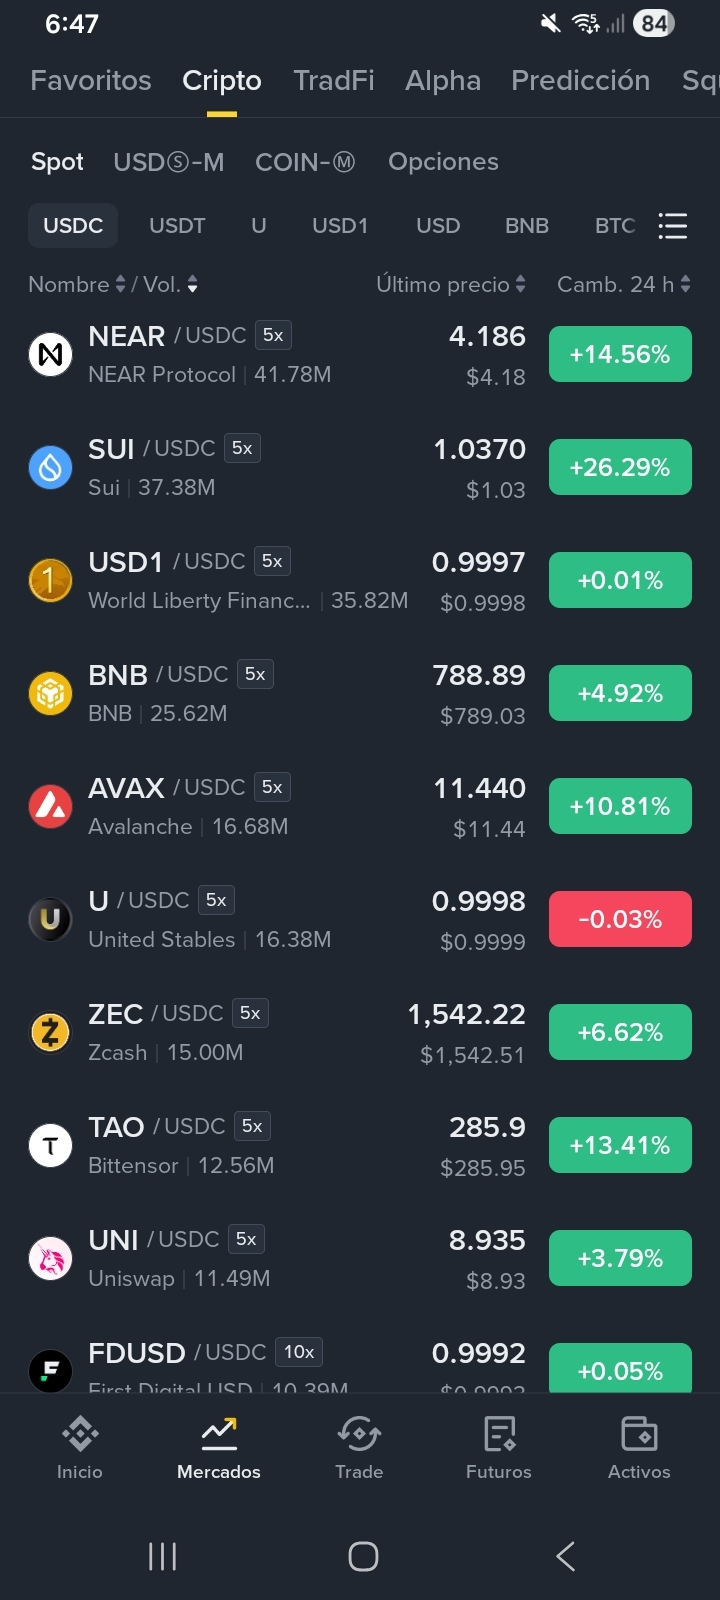
What a way to move forward in the session. The buy-side absorption we’d been seeing has paid off, and the Spot board (USDC) is fully boosted by bullish continuations and key breakouts.
Let’s analyze the most relevant parts of the market at this time:
1️⃣ 🚀 $SUI breaks above the $1 barrier ($1.0370, +26.29%): It’s the main protagonist of the session, accelerating with more than 37M in volume and confirming an aggressive buy rotation.
2️⃣ ⚡ $NEAR perfect in leading liquidity ($4.186, +14.56%): It tops the total board volume with 41.78M. After breaking $4.00, it hasn’t shown weakness and keeps marking local highs.
3️⃣ 🛡️ $ZEC decisively recovers $1,500 ($1,542.22, +6.62%): With 15M traded, it fully absorbed the previous pullback and is back to setting the pace among projects in its category.
4️⃣ 🟢 $TAO, AVAX, and $BNB join the move: $TAO ($285.9, +13.41%) and $AVAX ($11.440, +10.81%) confirm the sector’s strength, while $BNB ($788.89, +4.92%) is approaching the key $790.00 zone.
🤑🤑🤑🤑🤑
When we see this kind of synchronized impulse with high Spot capital volume, it confirms that liquidity isn’t just speculating in the short term, but is backed by real accumulation demand.
🔥🔥🔥🔥🔥🔥🔥🔥🔥🔥🔥
Let’s start the week..
Explosion in Spot! $SUI is up over +26% ($1.03), $NEAR leads the volume above 4.18, and $ZEC soars to $1,542 🚀🟢
What a way to move forward in the session. The buy-side absorption we’d been seeing has paid off, and the Spot board (USDC) is fully boosted by bullish continuations and key breakouts.
Let’s analyze the most relevant parts of the market at this time:
1️⃣ 🚀 $SUI breaks above the $1 barrier ($1.0370, +26.29%): It’s the main protagonist of the session, accelerating with more than 37M in volume and confirming an aggressive buy rotation.
2️⃣ ⚡ $NEAR perfect in leading liquidity ($4.186, +14.56%): It tops the total board volume with 41.78M. After breaking $4.00, it hasn’t shown weakness and keeps marking local highs.
3️⃣ 🛡️ $ZEC decisively recovers $1,500 ($1,542.22, +6.62%): With 15M traded, it fully absorbed the previous pullback and is back to setting the pace among projects in its category.
4️⃣ 🟢 $TAO, AVAX, and $BNB join the move: $TAO ($285.9, +13.41%) and $AVAX ($11.440, +10.81%) confirm the sector’s strength, while $BNB ($788.89, +4.92%) is approaching the key $790.00 zone.
🤑🤑🤑🤑🤑
When we see this kind of synchronized impulse with high Spot capital volume, it confirms that liquidity isn’t just speculating in the short term, but is backed by real accumulation demand.
🔥🔥🔥🔥🔥🔥🔥🔥🔥🔥🔥
Explosion in Spot! $SUI is up over +26% ($1.03), $NEAR leads the volume above 4.18, and $ZEC soars to $1,542 🚀🟢
What a way to move forward in the session. The buy-side absorption we’d been seeing has paid off, and the Spot board (USDC) is fully boosted by bullish continuations and key breakouts.
Let’s analyze the most relevant parts of the market at this time:
1️⃣ 🚀 $SUI breaks above the $1 barrier ($1.0370, +26.29%): It’s the main protagonist of the session, accelerating with more than 37M in volume and confirming an aggressive buy rotation.
2️⃣ ⚡ $NEAR perfect in leading liquidity ($4.186, +14.56%): It tops the total board volume with 41.78M. After breaking $4.00, it hasn’t shown weakness and keeps marking local highs.
3️⃣ 🛡️ $ZEC decisively recovers $1,500 ($1,542.22, +6.62%): With 15M traded, it fully absorbed the previous pullback and is back to setting the pace among projects in its category.
4️⃣ 🟢 $TAO, AVAX, and $BNB join the move: $TAO ($285.9, +13.41%) and $AVAX ($11.440, +10.81%) confirm the sector’s strength, while $BNB ($788.89, +4.92%) is approaching the key $790.00 zone.
🤑🤑🤑🤑🤑
When we see this kind of synchronized impulse with high Spot capital volume, it confirms that liquidity isn’t just speculating in the short term, but is backed by real accumulation demand.
🔥🔥🔥🔥🔥🔥🔥🔥🔥🔥🔥

3
4
1.3k
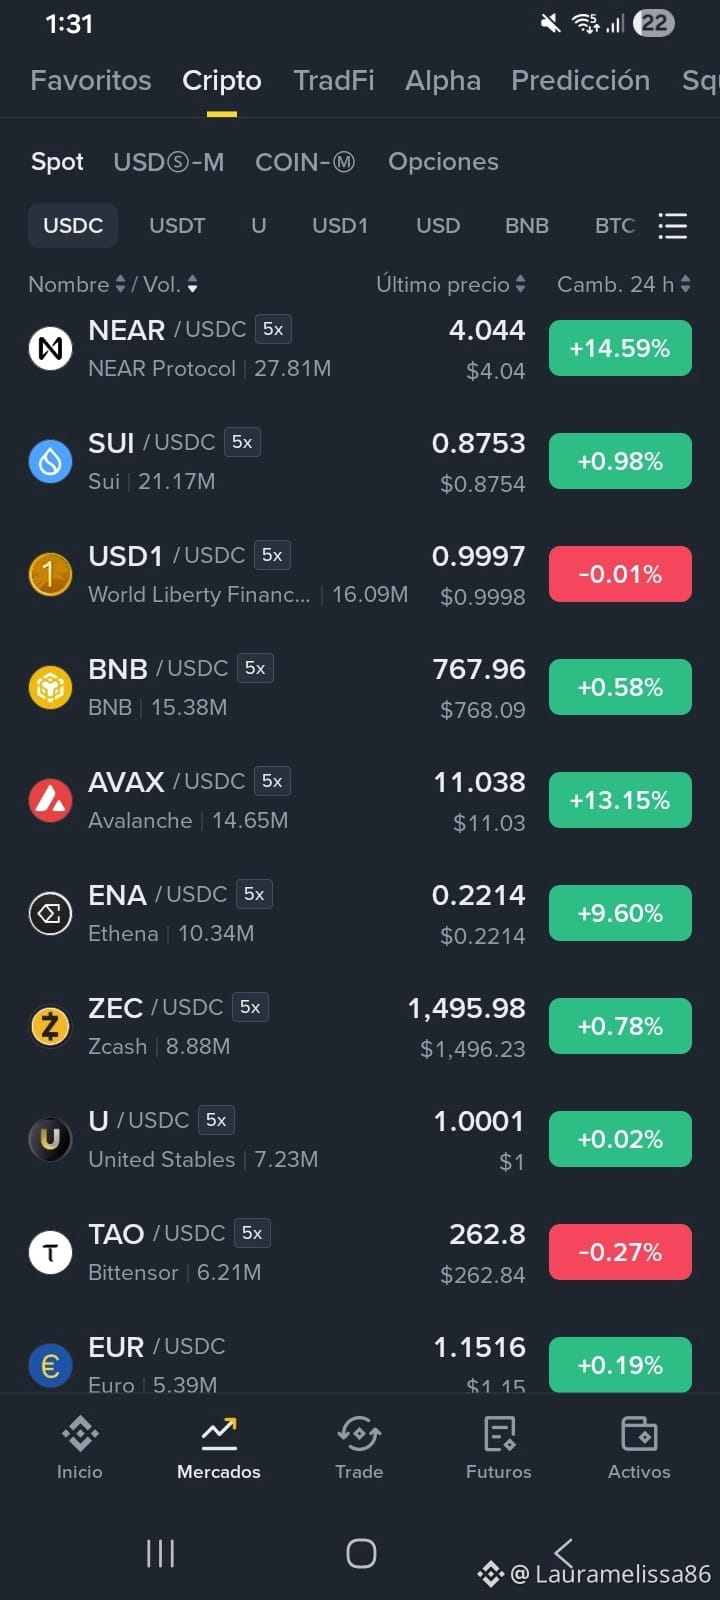
The defensive pause we observed in the middle of the day has run its course. As we usually analyze in the charts, the profit-taking was absorbed in local support zones and liquidity returned with force to resume the momentum.
Key Spot board (USDC) points at this hour:
1️⃣ 🚀 $NEAR is the main protagonist ($4.044, +14.59%): It leads total screen liquidity with 27.81M traded, breaking through the psychological barrier of $4.00 with very strong buy-side momentum.
2️⃣ 🔥 AVAX andENA sustain the acceleration: $AVAX ($11.038, +13.15%) confirms a breakout above $11.00 with 14.65M in volume, while $ENA ($0.2214, +9.60%) is looking for new day highs.
3️⃣ 🛡️ $ZEC recovers the upper zone ($1,495.98, +0.78%): After the morning pullback, it again shows buyer reaccumulation, lurking once more around $1,500.
4️⃣ 🟢 SUI andBNB support the trend: $SUI ($0.8753, +0.98%) absorbs 21.17M while maintaining higher lows, whereas $BNB ($767.96, +0.58%) recovers ground lost in the previous session.
This pattern highlights the importance of not overreacting to intraday corrections. When the Spot market picks back up with volume led by assets that break key levels (like NEAR pushing above $4.00), it confirms that the overall bullish structure remains intact
🤑🤑🤑🤑🤑.
The defensive pause we observed in the middle of the day has run its course. As we usually analyze in the charts, the profit-taking was absorbed in local support zones and liquidity returned with force to resume the momentum.
Key Spot board (USDC) points at this hour:
1️⃣ 🚀 $NEAR is the main protagonist ($4.044, +14.59%): It leads total screen liquidity with 27.81M traded, breaking through the psychological barrier of $4.00 with very strong buy-side momentum.
2️⃣ 🔥 AVAX andENA sustain the acceleration: $AVAX ($11.038, +13.15%) confirms a breakout above $11.00 with 14.65M in volume, while $ENA ($0.2214, +9.60%) is looking for new day highs.
3️⃣ 🛡️ $ZEC recovers the upper zone ($1,495.98, +0.78%): After the morning pullback, it again shows buyer reaccumulation, lurking once more around $1,500.
4️⃣ 🟢 SUI andBNB support the trend: $SUI ($0.8753, +0.98%) absorbs 21.17M while maintaining higher lows, whereas $BNB ($767.96, +0.58%) recovers ground lost in the previous session.
This pattern highlights the importance of not overreacting to intraday corrections. When the Spot market picks back up with volume led by assets that break key levels (like NEAR pushing above $4.00), it confirms that the overall bullish structure remains intact
🤑🤑🤑🤑🤑.
Key Spot board (USDC) points at this hour:
1️⃣ 🚀 $NEAR is the main protagonist ($4.044, +14.59%): It leads total screen liquidity with 27.81M traded, breaking through the psychological barrier of $4.00 with very strong buy-side momentum.
2️⃣ 🔥 AVAX andENA sustain the acceleration: $AVAX ($11.038, +13.15%) confirms a breakout above $11.00 with 14.65M in volume, while $ENA ($0.2214, +9.60%) is looking for new day highs.
3️⃣ 🛡️ $ZEC recovers the upper zone ($1,495.98, +0.78%): After the morning pullback, it again shows buyer reaccumulation, lurking once more around $1,500.
4️⃣ 🟢 SUI andBNB support the trend: $SUI ($0.8753, +0.98%) absorbs 21.17M while maintaining higher lows, whereas $BNB ($767.96, +0.58%) recovers ground lost in the previous session.
This pattern highlights the importance of not overreacting to intraday corrections. When the Spot market picks back up with volume led by assets that break key levels (like NEAR pushing above $4.00), it confirms that the overall bullish structure remains intact
🤑🤑🤑🤑🤑.
1
1
1
1.7k
I like studying both markets...
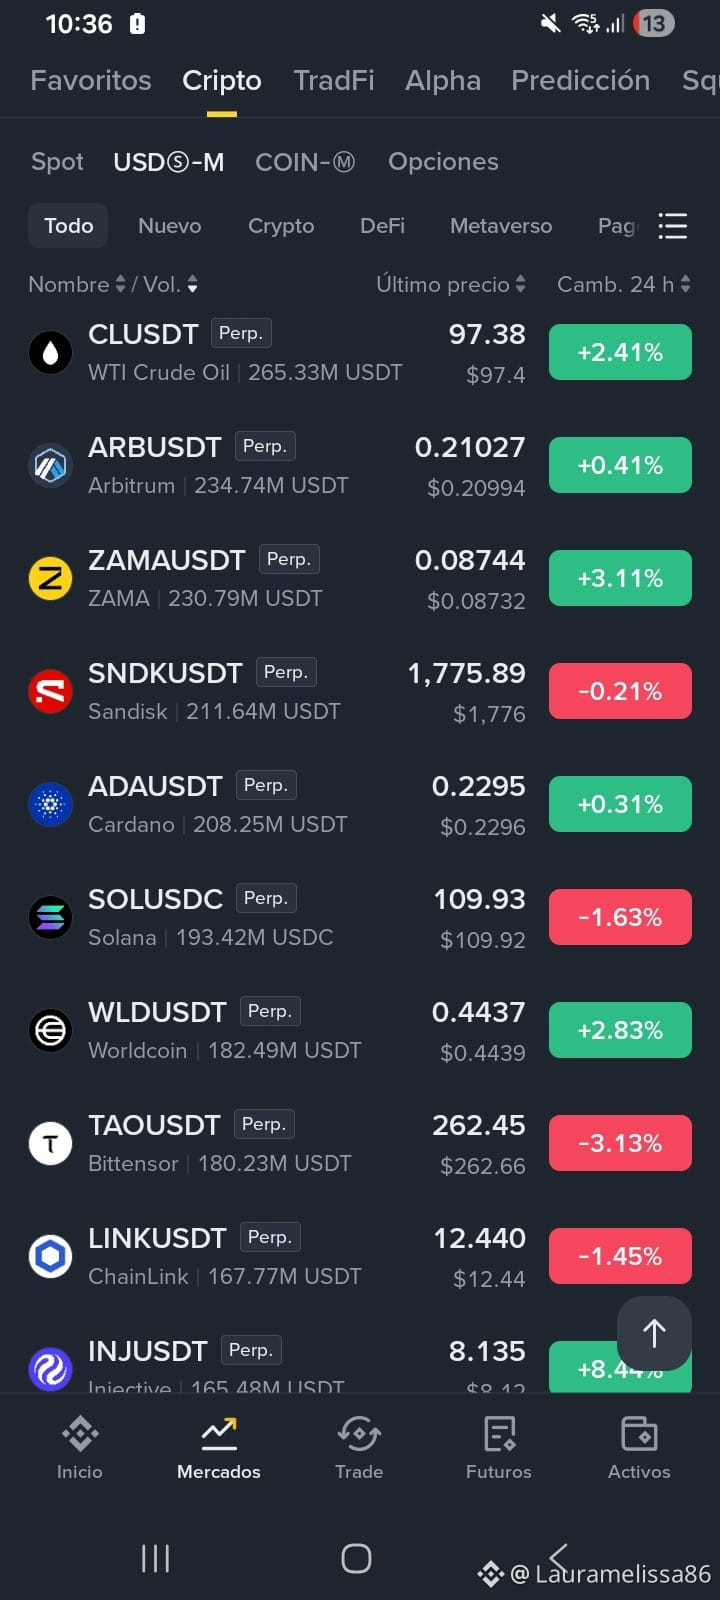
It’s key to monitor both sides of the coin: while Spot reflects the real accumulation demand, the USDⓈ-M Futures screen shows where leverage and short-term trading are heading.
Key points from Derivatives reading at this time:
1️⃣ 🛢️ Oil ($CL) attracts the highest liquidity ($97.38, +2.41%): It leads the board by volume with more than 265M USDT traded, showing that macro/TradFi interest is absorbing significant flow during the session.
2️⃣ ⚡ $INJ stands out among altcoins ($8.135, +8.44%): It consolidates as the position with the highest acceleration on the list, breaking above the $8.10 barrier with 165M in volume.
3️⃣ 🟢 $ZAMA, WLD, and ADA maintain a bullish structure: $ZAMA ($0.08744, +3.11%) and $WLD ($0.4437, +2.83%) hold higher intraday lows, while $ADA ($0.2295, +0.31%) firmly defends support at $0.2290.
4️⃣ 🧘♂️ Pause and breathing room in $TAO, SOL, and LINK: High-beta assets like $TAO ($262.45, -3.13%), $SOL ($109.93, -1.63%), and $LINK ($12.440, -1.45%) are carrying out retests of local support after the prior volatility.
When comparing Spot vs. Futures, we see an interesting pattern: leverage isn’t out of control; it’s in a cooling-off phase. Projects like INJ or ADA keeping liquidity above 160M–200M indicates that sell-side interest is being absorbed by limit buys.
I like studying both markets...
It’s key to monitor both sides of the coin: while Spot reflects the real accumulation demand, the USDⓈ-M Futures screen shows where leverage and short-term trading are heading.
Key points from Derivatives reading at this time:
1️⃣ 🛢️ Oil ($CL) attracts the highest liquidity ($97.38, +2.41%): It leads the board by volume with more than 265M USDT traded, showing that macro/TradFi interest is absorbing significant flow during the session.
2️⃣ ⚡ $INJ stands out among altcoins ($8.135, +8.44%): It consolidates as the position with the highest acceleration on the list, breaking above the $8.10 barrier with 165M in volume.
3️⃣ 🟢 $ZAMA, WLD, and ADA maintain a bullish structure: $ZAMA ($0.08744, +3.11%) and $WLD ($0.4437, +2.83%) hold higher intraday lows, while $ADA ($0.2295, +0.31%) firmly defends support at $0.2290.
4️⃣ 🧘♂️ Pause and breathing room in $TAO, SOL, and LINK: High-beta assets like $TAO ($262.45, -3.13%), $SOL ($109.93, -1.63%), and $LINK ($12.440, -1.45%) are carrying out retests of local support after the prior volatility.
When comparing Spot vs. Futures, we see an interesting pattern: leverage isn’t out of control; it’s in a cooling-off phase. Projects like INJ or ADA keeping liquidity above 160M–200M indicates that sell-side interest is being absorbed by limit buys.
It’s key to monitor both sides of the coin: while Spot reflects the real accumulation demand, the USDⓈ-M Futures screen shows where leverage and short-term trading are heading.
Key points from Derivatives reading at this time:
1️⃣ 🛢️ Oil ($CL) attracts the highest liquidity ($97.38, +2.41%): It leads the board by volume with more than 265M USDT traded, showing that macro/TradFi interest is absorbing significant flow during the session.
2️⃣ ⚡ $INJ stands out among altcoins ($8.135, +8.44%): It consolidates as the position with the highest acceleration on the list, breaking above the $8.10 barrier with 165M in volume.
3️⃣ 🟢 $ZAMA, WLD, and ADA maintain a bullish structure: $ZAMA ($0.08744, +3.11%) and $WLD ($0.4437, +2.83%) hold higher intraday lows, while $ADA ($0.2295, +0.31%) firmly defends support at $0.2290.
4️⃣ 🧘♂️ Pause and breathing room in $TAO, SOL, and LINK: High-beta assets like $TAO ($262.45, -3.13%), $SOL ($109.93, -1.63%), and $LINK ($12.440, -1.45%) are carrying out retests of local support after the prior volatility.
When comparing Spot vs. Futures, we see an interesting pattern: leverage isn’t out of control; it’s in a cooling-off phase. Projects like INJ or ADA keeping liquidity above 160M–200M indicates that sell-side interest is being absorbed by limit buys.
263
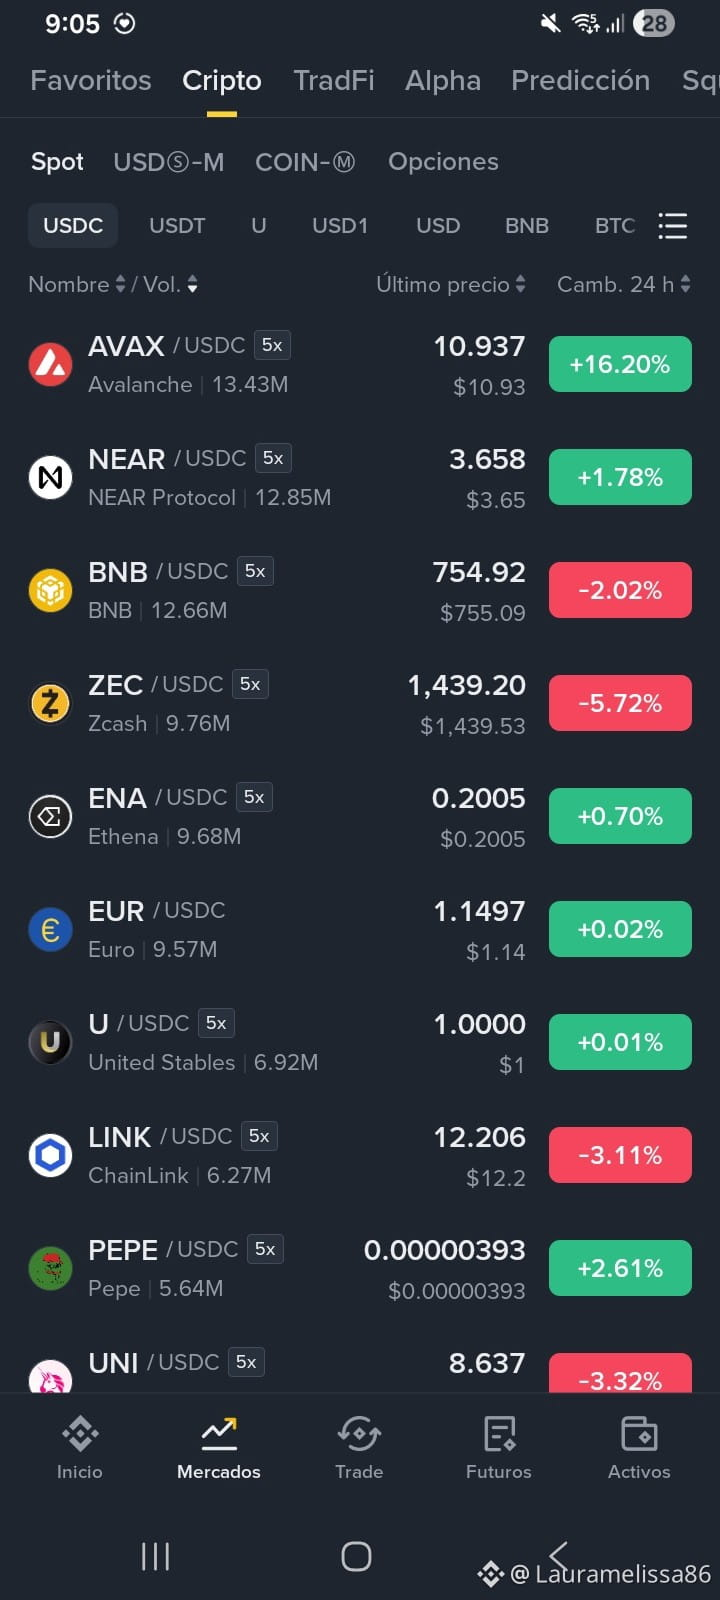
We open this review block on the Spot board (USDC), observing a very clear defensive rotation. While some projects move into a discount phase after their intraday highs, liquidity is strongly concentrated in assets with active breakout.
Quick screen analysis at this moment:
1️⃣ 🚀 $AVAX leads ($10,937, +16.20%): It stands as the most sought-after coin right now, leading the board’s liquidity with $13.43M traded, and confidently holding the upper end of the range.
2️⃣ 🟢 $NEAR regains strength ($3,658, +1.78%): It cleanly absorbed the prior profit-taking and is back to showing buyer volume, registering nearly $13M in movement.
3️⃣ 📉 Pullback and searching for a floor in $ZEC, LINK, and UNI:
$ZEC ($1,439.20, -5.72%): After the attempt to break above $1,500, it enters a normal correction, seeking previous demand zones.
$LINK ($12.206, -3.11%) and $UNI ($8.637, -3.32%): They retreat toward short-term averages while assessing local supports.
4️⃣ 🛡️ $ENA consolidates gains ($0.2005, +0.70%): It manages to hold the key level around $0.20, staying close to $10M in movement.
The adjustment phases on the board are where the best technical structures are built. Seeing assets like AVAX and NEAR absorbing liquidity while others correct shows that the capital mass remains within the Spot market, alternating entries according to discount zones.
We open this review block on the Spot board (USDC), observing a very clear defensive rotation. While some projects move into a discount phase after their intraday highs, liquidity is strongly concentrated in assets with active breakout.
Quick screen analysis at this moment:
1️⃣ 🚀 $AVAX leads ($10,937, +16.20%): It stands as the most sought-after coin right now, leading the board’s liquidity with $13.43M traded, and confidently holding the upper end of the range.
2️⃣ 🟢 $NEAR regains strength ($3,658, +1.78%): It cleanly absorbed the prior profit-taking and is back to showing buyer volume, registering nearly $13M in movement.
3️⃣ 📉 Pullback and searching for a floor in $ZEC, LINK, and UNI:
$ZEC ($1,439.20, -5.72%): After the attempt to break above $1,500, it enters a normal correction, seeking previous demand zones.
$LINK ($12.206, -3.11%) and $UNI ($8.637, -3.32%): They retreat toward short-term averages while assessing local supports.
4️⃣ 🛡️ $ENA consolidates gains ($0.2005, +0.70%): It manages to hold the key level around $0.20, staying close to $10M in movement.
The adjustment phases on the board are where the best technical structures are built. Seeing assets like AVAX and NEAR absorbing liquidity while others correct shows that the capital mass remains within the Spot market, alternating entries according to discount zones.
Quick screen analysis at this moment:
1️⃣ 🚀 $AVAX leads ($10,937, +16.20%): It stands as the most sought-after coin right now, leading the board’s liquidity with $13.43M traded, and confidently holding the upper end of the range.
2️⃣ 🟢 $NEAR regains strength ($3,658, +1.78%): It cleanly absorbed the prior profit-taking and is back to showing buyer volume, registering nearly $13M in movement.
3️⃣ 📉 Pullback and searching for a floor in $ZEC, LINK, and UNI:
$ZEC ($1,439.20, -5.72%): After the attempt to break above $1,500, it enters a normal correction, seeking previous demand zones.
$LINK ($12.206, -3.11%) and $UNI ($8.637, -3.32%): They retreat toward short-term averages while assessing local supports.
4️⃣ 🛡️ $ENA consolidates gains ($0.2005, +0.70%): It manages to hold the key level around $0.20, staying close to $10M in movement.
The adjustment phases on the board are where the best technical structures are built. Seeing assets like AVAX and NEAR absorbing liquidity while others correct shows that the capital mass remains within the Spot market, alternating entries according to discount zones.
1
3
1.5k
Log in to explore more content
Join global crypto users on Binance Square
⚡️ Get latest and useful information about crypto.
💬 Trusted by the world’s largest crypto exchange.
👍 Discover real insights from verified creators.
Email / Phone number
Trending Topics
ADAGains10%Above$0.27
5,113 views
123 Discussing
$ADA is making a strong move today jumping over 10 percent to around 027 and breaking into a new 90 day high
Trading volume has also surged above 1 billion showing strong market activity
The move comes as $ADA continues its recovery from the June lows while its recent technical structure has turned more bullish
The 027 to 028 zone is now the key area to watch A sustained breakout could open the door toward higher resistance levels
But after such a sharp daily move volatility could remain high
#ADAGains10%Above$0.27 #crypto #ADA #Cardano #crypto #Write2Earn
AbdullahAbid_7
·0 Likes
·240 views
ETHUp70%InQ3ButLiquidityFalls
62,967 views
700 Discussing
EthStakingExitQueueHits2026High
23,106 views
562 Discussing