Studying GPS
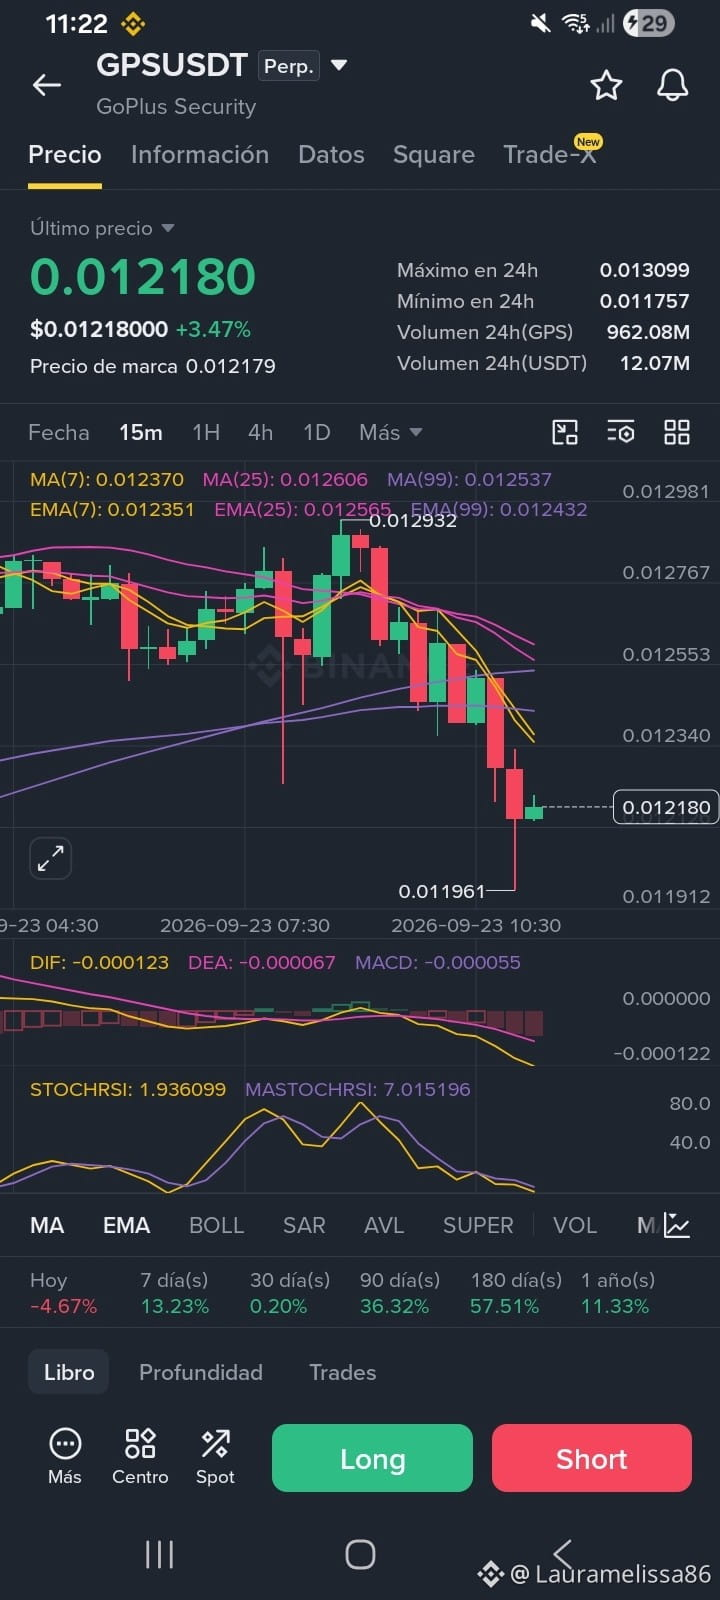
In this GPSUSDT chart (15 minutes), a didactic scenario is shown to analyze the behavior of the Exponential Moving Averages (EMA).
1. Status of the Moving Averages
EMA (7) = 0.012351 (Fast line, yellow color)
EMA (25) = 0.012565 (Intermediate line, pink/purple color)
EMA (99) = 0.012432 (Slow/long-term line, violet color)
2. Key Points
A. Alignment and Bearish Crossover (Death Cross on a smaller timeframe)
Crossover of the fast line over the intermediate line: EMA(7) has clearly crossed below EMA(25).
Crossover with the main trend: The price and the fast averages broke strongly downward below the EMA(99), confirming a change in structure on this timeframe.
Bearish ordering: The moving averages are arranged in descending order (the slowest on top and the fastest below), which validates prevailing selling pressure.
B. Distance from the price (Overextension)
The current price (0.012180) has fallen in an accelerated manner, trading significantly below the EMA(7) [0.012351].
In technical analysis, when the price moves too far away from the fast EMA, the EMAs act like a "magnet." This often leads to a technical pullback bounce or sideways consolidation to get closer to the EMA(7) before continuing its move.
C. EMAs as Dynamic Resistances
As the price tries to regain ground, the exponential averages no longer act as supports but as dynamic resistances.
For the structure to regain bullish strength, the price would first need to break above the EMA(7) and subsequently consolidate above the EMA(25) and the EMA(99).
In this GPSUSDT chart (15 minutes), a didactic scenario is shown to analyze the behavior of the Exponential Moving Averages (EMA).
1. Status of the Moving Averages
EMA (7) = 0.012351 (Fast line, yellow color)
EMA (25) = 0.012565 (Intermediate line, pink/purple color)
EMA (99) = 0.012432 (Slow/long-term line, violet color)
2. Key Points
A. Alignment and Bearish Crossover (Death Cross on a smaller timeframe)
Crossover of the fast line over the intermediate line: EMA(7) has clearly crossed below EMA(25).
Crossover with the main trend: The price and the fast averages broke strongly downward below the EMA(99), confirming a change in structure on this timeframe.
Bearish ordering: The moving averages are arranged in descending order (the slowest on top and the fastest below), which validates prevailing selling pressure.
B. Distance from the price (Overextension)
The current price (0.012180) has fallen in an accelerated manner, trading significantly below the EMA(7) [0.012351].
In technical analysis, when the price moves too far away from the fast EMA, the EMAs act like a "magnet." This often leads to a technical pullback bounce or sideways consolidation to get closer to the EMA(7) before continuing its move.
C. EMAs as Dynamic Resistances
As the price tries to regain ground, the exponential averages no longer act as supports but as dynamic resistances.
For the structure to regain bullish strength, the price would first need to break above the EMA(7) and subsequently consolidate above the EMA(25) and the EMA(99).