
宋锦安
1.3k Posts

宋锦安
公众号:宋锦安 微博:-宋锦安 币安聊天室ID:soon2gw
1 Following
3.5K+ Followers
1.8K+ Liked
Posts
All
Quotes
Videos
Live
PINNED
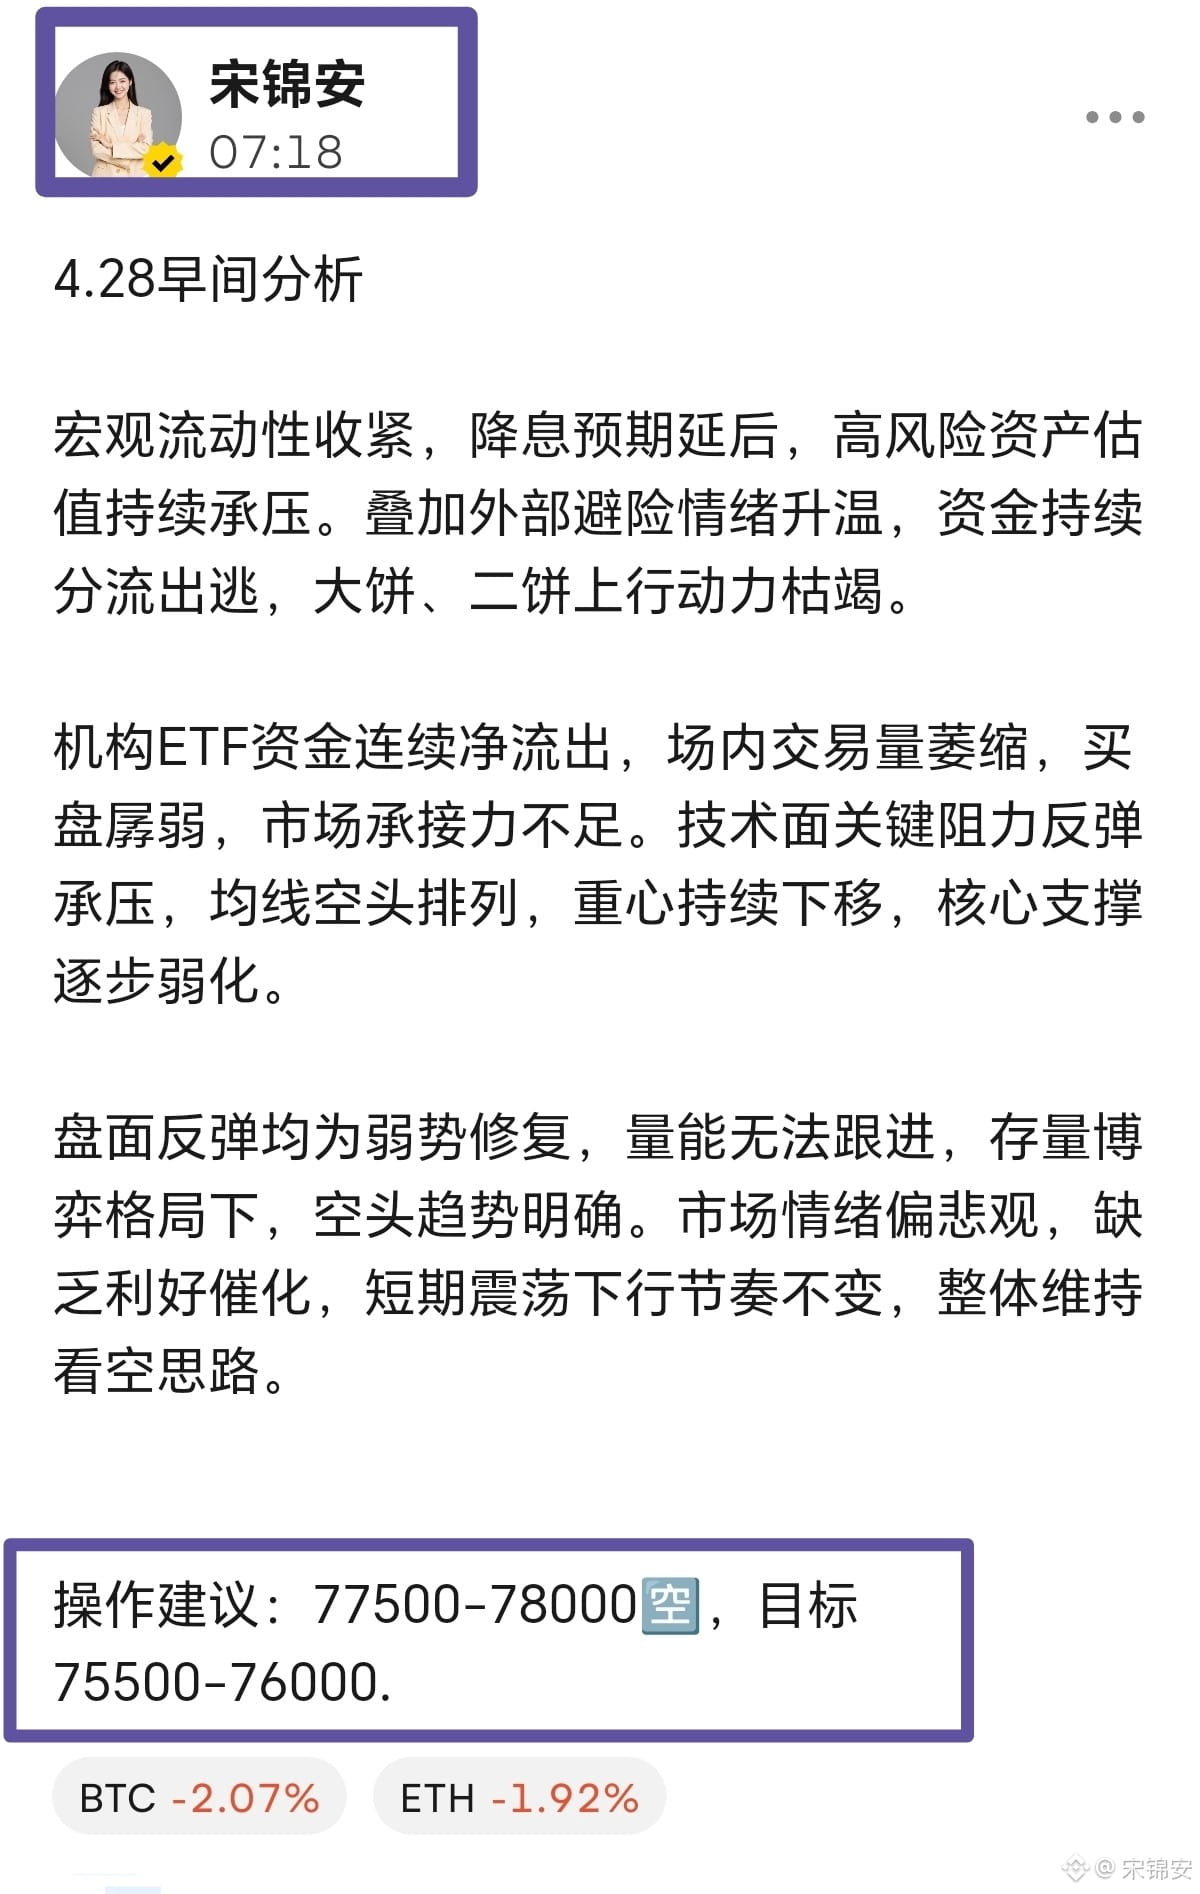
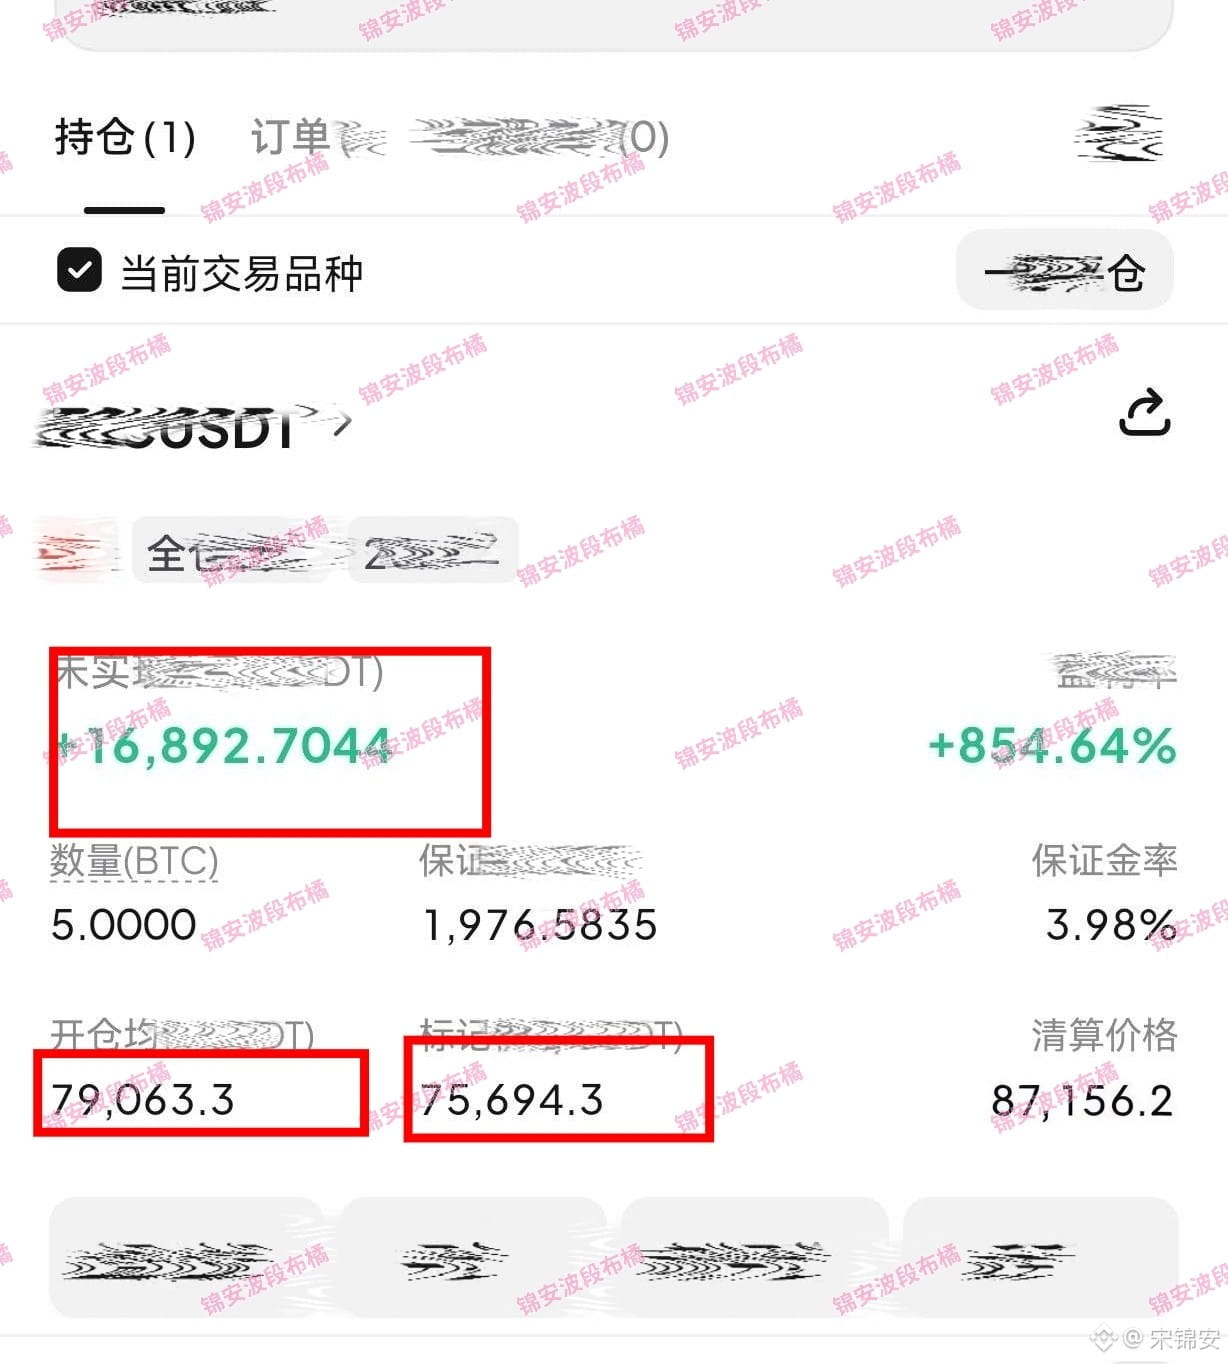
Are you willing to take 1.2 days to ride the wave with Jin'an and trade over 3000 pips?!
Jin'an has once again snagged over 3000 pips on the swings!!
When the market was ripe, you chose to let go, and when it was time to hold, you decided to stubbornly hang on!
This is why some folks are stacking 20000 ETH, while you’re getting margin call emails left and right!
A little patience can save your broader strategy. Jin'an is firmly at the helm, and we sincerely invite you, the ones with vision and capability, to join us in trading!! The next leaderboard could be yours!!
$BNB $BTC $XRP #Strategy增持比特币 #币安推出黄金vsBTC未来资产对决活动 #ArthurHayes latest speech
Jin'an has once again snagged over 3000 pips on the swings!!
When the market was ripe, you chose to let go, and when it was time to hold, you decided to stubbornly hang on!
This is why some folks are stacking 20000 ETH, while you’re getting margin call emails left and right!
A little patience can save your broader strategy. Jin'an is firmly at the helm, and we sincerely invite you, the ones with vision and capability, to join us in trading!! The next leaderboard could be yours!!
$BNB $BTC $XRP #Strategy增持比特币 #币安推出黄金vsBTC未来资产对决活动 #ArthurHayes latest speech


PINNED
Friends! This is my chat room—unlocking strategies, recovering health, flipping decks. If you have any questions, you can come to the chat room and find me!$BNB $GOOGLB $AVGOB

8.26 BTC morning analysis
Yesterday, if BTC on the 4H timeframe failed to hold above 81,000, it would be a fake breakout and trigger a pullback in the current phase. Current price is getting a valid bounce in the prior low area, printing a long lower wick and forming a piercing pattern. Bearish momentum in this zone has clearly weakened. The lower Bollinger Band is flattening; price rebounds from below the band. The RSI has risen from a low level and shows an early-stage bearish divergence against price (bottom divergence forming). After the negative gamma squeeze release, market makers have gradually begun to enter with inverse-hedging buy orders. The current key resistance is at the mid-band. Once price stands above it with volume, the room for the rebound will open, and it may again test the previous high area. In terms of strategy, continue with the “buy the pullback” mindset, and set take-profit and stop-loss strictly.
Trading suggestion: Go long at 77,400–77,900, target 79,500–80,000.
$TSMB $MSFTB $AAPLB #日本9至10月不再释放石油储备
Yesterday, if BTC on the 4H timeframe failed to hold above 81,000, it would be a fake breakout and trigger a pullback in the current phase. Current price is getting a valid bounce in the prior low area, printing a long lower wick and forming a piercing pattern. Bearish momentum in this zone has clearly weakened. The lower Bollinger Band is flattening; price rebounds from below the band. The RSI has risen from a low level and shows an early-stage bearish divergence against price (bottom divergence forming). After the negative gamma squeeze release, market makers have gradually begun to enter with inverse-hedging buy orders. The current key resistance is at the mid-band. Once price stands above it with volume, the room for the rebound will open, and it may again test the previous high area. In terms of strategy, continue with the “buy the pullback” mindset, and set take-profit and stop-loss strictly.
Trading suggestion: Go long at 77,400–77,900, target 79,500–80,000.
$TSMB $MSFTB $AAPLB #日本9至10月不再释放石油储备
8.26 Early-morning Big Pie Analysis
BTC is currently hovering around 79,200. The Bollinger Bands are tightening even more, the middle band is weighing down the price, and it feels like a breakout could happen within the next day or two. The MACD is still in a dead cross, but the green bars have been shrinking continuously. The RSI is also flattening below 50, which suggests a possible mild bullish divergence. The bears can’t push it down anymore.
More importantly, the OI (open interest) and basis have started to turn back. The short positions are getting overcrowded. If the delta-hedging crowd makes a move, it could potentially squeeze straight up. Net inflow is over 100 million (yuan), yet the price hasn’t moved much—likely because arbitrage/relative-value trading is suppressing the rise. Keep an eye on 78,500; if that level breaks, then we may head to 76,800. On the upside, if 80,200 can hold with increased volume, short-covering could push price toward the 81,200 prior high. At this level, watch more and act less—wait until the direction becomes clear before following.
Whether you’re trading long-term or short-term, carry proper defenses! Protecting your position (risk) is the most important thing!
$TSMB $MSFTB #Solana现货ETF累计净流入创纪录12.2亿美元 #日本9至10月不再释放石油储备
BTC is currently hovering around 79,200. The Bollinger Bands are tightening even more, the middle band is weighing down the price, and it feels like a breakout could happen within the next day or two. The MACD is still in a dead cross, but the green bars have been shrinking continuously. The RSI is also flattening below 50, which suggests a possible mild bullish divergence. The bears can’t push it down anymore.
More importantly, the OI (open interest) and basis have started to turn back. The short positions are getting overcrowded. If the delta-hedging crowd makes a move, it could potentially squeeze straight up. Net inflow is over 100 million (yuan), yet the price hasn’t moved much—likely because arbitrage/relative-value trading is suppressing the rise. Keep an eye on 78,500; if that level breaks, then we may head to 76,800. On the upside, if 80,200 can hold with increased volume, short-covering could push price toward the 81,200 prior high. At this level, watch more and act less—wait until the direction becomes clear before following.
Whether you’re trading long-term or short-term, carry proper defenses! Protecting your position (risk) is the most important thing!
$TSMB $MSFTB #Solana现货ETF累计净流入创纪录12.2亿美元 #日本9至10月不再释放石油储备

This pullback must be taken a bite of! Big Bing Auntie and Heiress synchronize to take it down!!
$TSMB $MSFTB $AAPLB #ZEC突破关键阻力涨75.5%
$TSMB $MSFTB $AAPLB #ZEC突破关键阻力涨75.5%
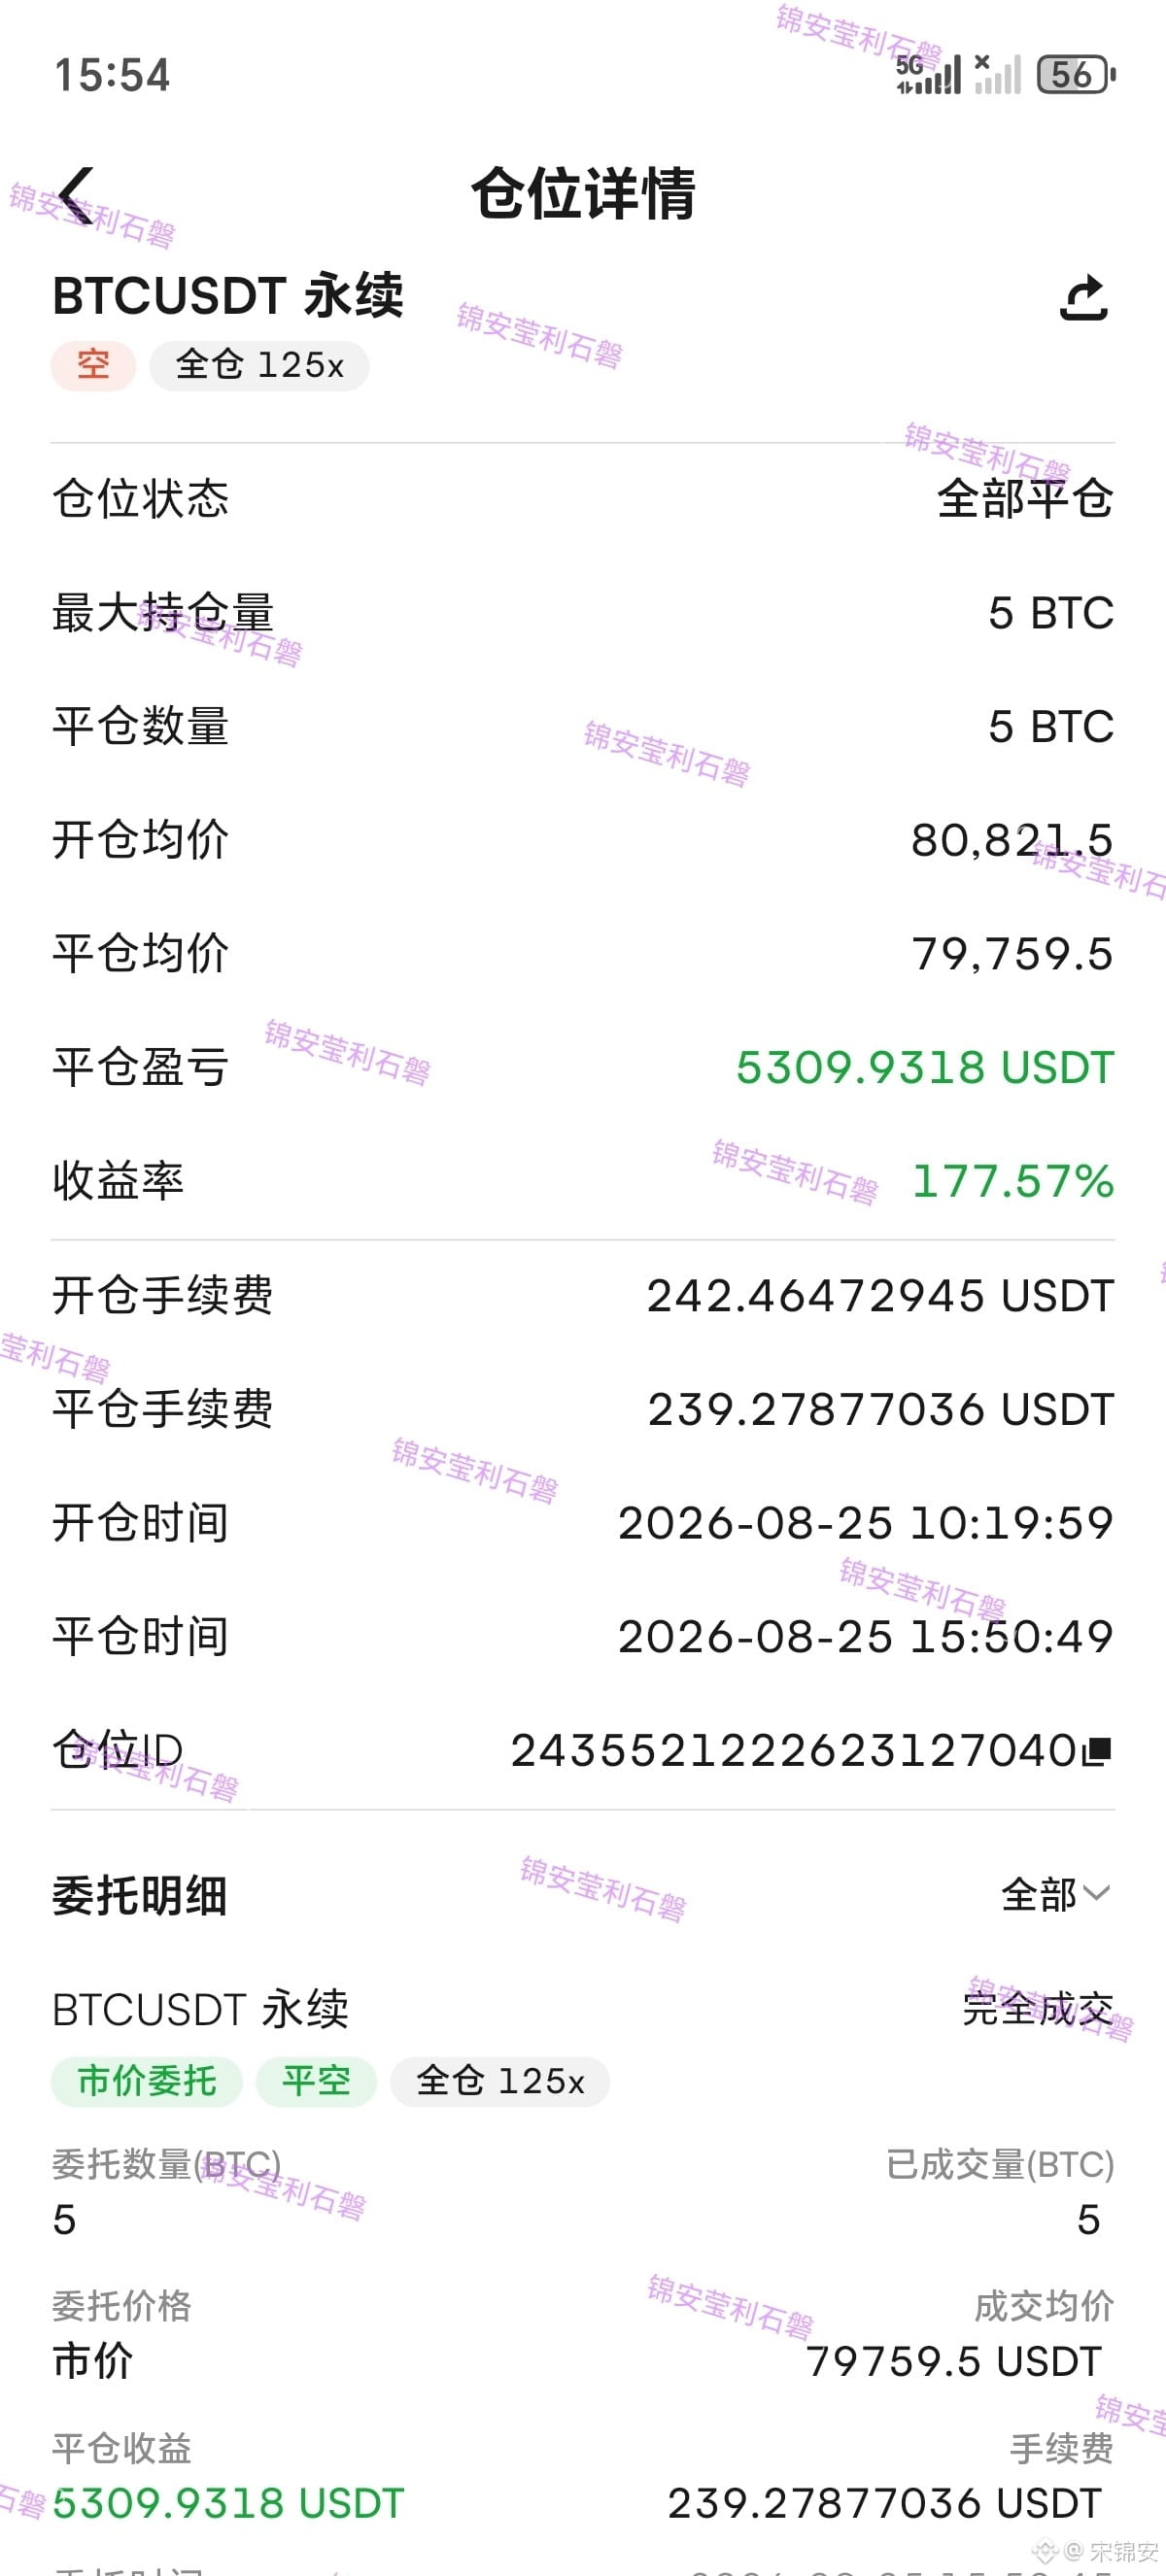
8.25 SanDisk Analysis
On the SNDK daily chart, the candlestick closes with a long lower wick. After dipping to 1419.66, it quickly rebounds and pulls back, forming a piercing pattern, but the real body remains capped by the upper Bollinger Band (1530), showing a pullback under pressure. In the short term, the moving averages still maintain a bullish alignment; however, the price’s deviation from the middle band (1489) is somewhat large, creating a mean-reversion pull. RSI(6) registers 76.80, entering the overbought “stalled/impairment” range. If the subsequent move fails to break above the prior high 1538.55 with strong volume on a long bullish candle, it is prone to evolve into a false-breakout trap, accompanied by top/negative divergence risk. After MACD forms a golden cross below the zero line, the red histogram bars continue to flatten and shorten, indicating weakening bullish momentum; the risk of a dead cross forming at a high level should be watched.
On volume, the recent rebound has not shown a significant buildup of volume. This is a volume-contracted rebound, suggesting insufficient willingness to chase longs. If price probes lower again, the first support to watch is the 1420–1450 area (the dense-transaction cluster). That zone has previously acted as a multiple-validation area. If price breaks below the 1419.66 low, it would confirm a breakdown; the downside targets would then point to the lower Bollinger Band at 1449 and the previous low base. For overhead resistance, besides 1538, 1610–1628 is a historical heavy-pressure zone, which is unlikely to be cleared in one step in the near term.
On the 15-minute chart, current price is consolidating narrowly around 1525, forming an early rising-wedge pattern. If it breaks below the lower boundary support at 1510, the bearish structure would be established. Overall, price is in contention near the top of a trading box. The key pivot between bulls and bears is the 1489 middle band: if it is lost, the market weakens; if price holds and stays above it, there is still potential for a run higher, but volume/participation must cooperate to resolve the top/negative divergence—otherwise, the bias favors a pullback and consolidation.
Trading recommendation: 1540–1570, shorts? Target 1500–1400.
$TSMB $MSFTB #油价维持跌势
On the SNDK daily chart, the candlestick closes with a long lower wick. After dipping to 1419.66, it quickly rebounds and pulls back, forming a piercing pattern, but the real body remains capped by the upper Bollinger Band (1530), showing a pullback under pressure. In the short term, the moving averages still maintain a bullish alignment; however, the price’s deviation from the middle band (1489) is somewhat large, creating a mean-reversion pull. RSI(6) registers 76.80, entering the overbought “stalled/impairment” range. If the subsequent move fails to break above the prior high 1538.55 with strong volume on a long bullish candle, it is prone to evolve into a false-breakout trap, accompanied by top/negative divergence risk. After MACD forms a golden cross below the zero line, the red histogram bars continue to flatten and shorten, indicating weakening bullish momentum; the risk of a dead cross forming at a high level should be watched.
On volume, the recent rebound has not shown a significant buildup of volume. This is a volume-contracted rebound, suggesting insufficient willingness to chase longs. If price probes lower again, the first support to watch is the 1420–1450 area (the dense-transaction cluster). That zone has previously acted as a multiple-validation area. If price breaks below the 1419.66 low, it would confirm a breakdown; the downside targets would then point to the lower Bollinger Band at 1449 and the previous low base. For overhead resistance, besides 1538, 1610–1628 is a historical heavy-pressure zone, which is unlikely to be cleared in one step in the near term.
On the 15-minute chart, current price is consolidating narrowly around 1525, forming an early rising-wedge pattern. If it breaks below the lower boundary support at 1510, the bearish structure would be established. Overall, price is in contention near the top of a trading box. The key pivot between bulls and bears is the 1489 middle band: if it is lost, the market weakens; if price holds and stays above it, there is still potential for a run higher, but volume/participation must cooperate to resolve the top/negative divergence—otherwise, the bias favors a pullback and consolidation.
Trading recommendation: 1540–1570, shorts? Target 1500–1400.
$TSMB $MSFTB #油价维持跌势

The market never performs for anyone. This round of行情 once again confirms: being right on direction is far better than constantly messing around. Outside noise is roaring, rumors are flying, and how many people get dragged into chasing highs and selling lows by the rhythm until their mindset breaks. Shorting based on rumors—liquidation data will speak for itself. Unable to sleep late at night, anxious about finding an exit for your positions? Who hasn’t fantasized about turning things around? But in the crypto world—like a deep abyss—when you stare into it, you’re also being stared at. Getting trapped is the norm, and I’m working hard to help you get out of this bind.
$AMZNB $AAPLB #ZEC突破关键阻力涨75.5% #SK海力士跌5.63%工会否决薪资协议
$AMZNB $AAPLB #ZEC突破关键阻力涨75.5% #SK海力士跌5.63%工会否决薪资协议

8.25 ZEC Analysis
ZEC is currently at 844.47, up 1.54% intraday. However, there is clear divergence between price and volume—while the price is approaching the upper band at 863, net capital continues to flow out (1.58 million USD). The proportion of passive sell orders is rising, and there is insufficient willingness for long-side chasing. The MACD dead cross is continuing, and the RSI’s three lines are sticking together around 55, indicating a lack of short-term trend momentum. The main players have placed a large sell order at around 805 totaling 5.05 million orders, creating psychological support, but sell orders are stacked above at 863. A breakout needs volume confirmation. Overall, price is undergoing disorderly consolidation within the 796–863 USD range. In terms of trading, it is recommended to sell at the upper end and buy at the lower end within the range. Pay attention to the effectiveness of support at 805 USD and the breakout above the 870 USD resistance. Until a breakout occurs, do not chase positions with heavy sizing.
Trading suggestion: 800–830 pluck lower, target 850–900.
$MSFTB $TSMB $AAPLB #ZEC突破关键阻力涨75.5%
ZEC is currently at 844.47, up 1.54% intraday. However, there is clear divergence between price and volume—while the price is approaching the upper band at 863, net capital continues to flow out (1.58 million USD). The proportion of passive sell orders is rising, and there is insufficient willingness for long-side chasing. The MACD dead cross is continuing, and the RSI’s three lines are sticking together around 55, indicating a lack of short-term trend momentum. The main players have placed a large sell order at around 805 totaling 5.05 million orders, creating psychological support, but sell orders are stacked above at 863. A breakout needs volume confirmation. Overall, price is undergoing disorderly consolidation within the 796–863 USD range. In terms of trading, it is recommended to sell at the upper end and buy at the lower end within the range. Pay attention to the effectiveness of support at 805 USD and the breakout above the 870 USD resistance. Until a breakout occurs, do not chase positions with heavy sizing.
Trading suggestion: 800–830 pluck lower, target 850–900.
$MSFTB $TSMB $AAPLB #ZEC突破关键阻力涨75.5%

8.25 SOL Analysis
This SOL run also successfully flew into the sky together with Big Brother! It has broken 100!
BTC is consolidating in the upper range above 80,000. Overall risk appetite is good, providing a bullish environment for SOL. The key resistance above SOL is 102.84; if it breaks out, look for 105. Support below is 101; if it breaks, it will pull back to 97.5. If BTC holds above 80,000 without breaking, SOL is highly likely to break above the previous high in the same direction. If BTC undergoes a deep pullback, SOL will adjust in tandem.
Trading suggestion: Buy the pullback (“buy the dip”). First target: 105. Then watch for a further move upward.
$TSMB $MSFTB #ZEC突破关键阻力涨75.5%
This SOL run also successfully flew into the sky together with Big Brother! It has broken 100!
BTC is consolidating in the upper range above 80,000. Overall risk appetite is good, providing a bullish environment for SOL. The key resistance above SOL is 102.84; if it breaks out, look for 105. Support below is 101; if it breaks, it will pull back to 97.5. If BTC holds above 80,000 without breaking, SOL is highly likely to break above the previous high in the same direction. If BTC undergoes a deep pullback, SOL will adjust in tandem.
Trading suggestion: Buy the pullback (“buy the dip”). First target: 105. Then watch for a further move upward.
$TSMB $MSFTB #ZEC突破关键阻力涨75.5%

8.25 ETH analysis
ETH is currently in a high-level consolidation phase within an uptrend, with 2486 serving as the key intraday pivot between bulls and bears. Price is closely tracking the 1-hour EMA20. The MACD bullish momentum histogram has shrunk to 0.52, and an early bearish divergence pattern (a top-back-divergence) is forming—so be cautious of the risk of a high pullback. The previous high at 2533 forms strong resistance. A breakout with increased volume could open up upside space toward 2580–2600. If repeated attempts fail, it is likely to pull back toward the dense support zone of 2460–2485. If it breaks below 2440 on increased volume, the short-term top will be confirmed, and the downside target would be the 2400 psychological level. Current RSI is in a neutral zone around 54, with no clear direction—wait for volume to choose a direction.
Trading suggestion: Buy/hold (or go long) between 2440–2470, target 2500–2600.$AMZNB $NVDAB #韩股KOSPI200夜盘期货跌1.77%
ETH is currently in a high-level consolidation phase within an uptrend, with 2486 serving as the key intraday pivot between bulls and bears. Price is closely tracking the 1-hour EMA20. The MACD bullish momentum histogram has shrunk to 0.52, and an early bearish divergence pattern (a top-back-divergence) is forming—so be cautious of the risk of a high pullback. The previous high at 2533 forms strong resistance. A breakout with increased volume could open up upside space toward 2580–2600. If repeated attempts fail, it is likely to pull back toward the dense support zone of 2460–2485. If it breaks below 2440 on increased volume, the short-term top will be confirmed, and the downside target would be the 2400 psychological level. Current RSI is in a neutral zone around 54, with no clear direction—wait for volume to choose a direction.
Trading suggestion: Buy/hold (or go long) between 2440–2470, target 2500–2600.$AMZNB $NVDAB #韩股KOSPI200夜盘期货跌1.77%

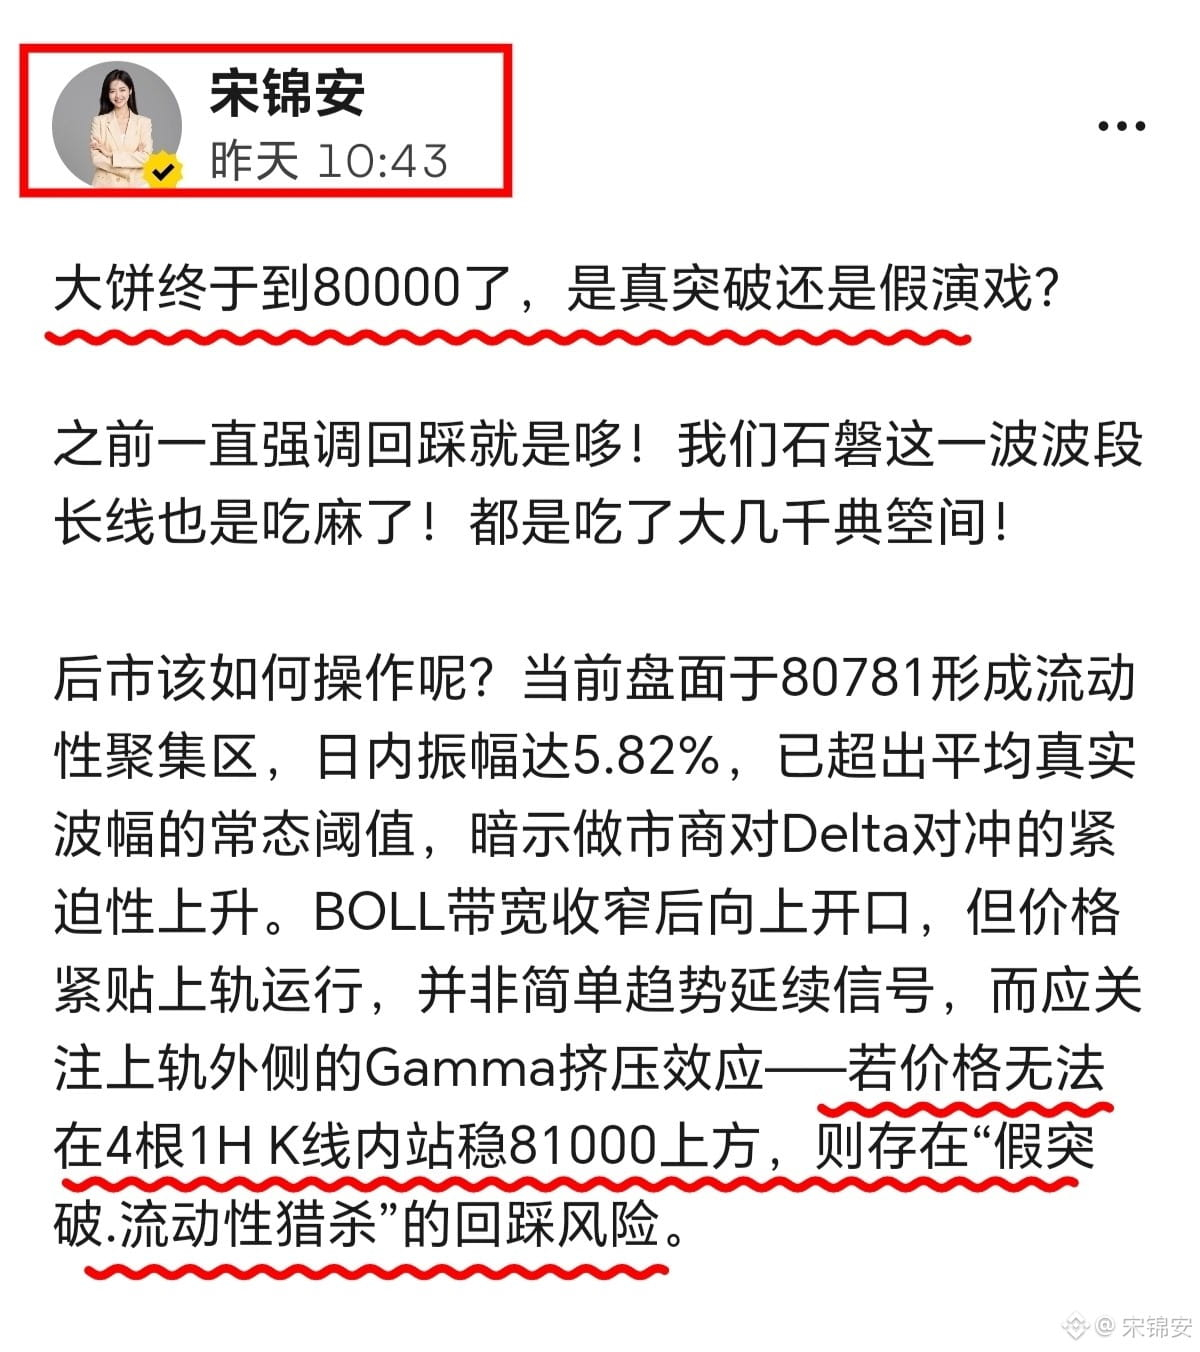
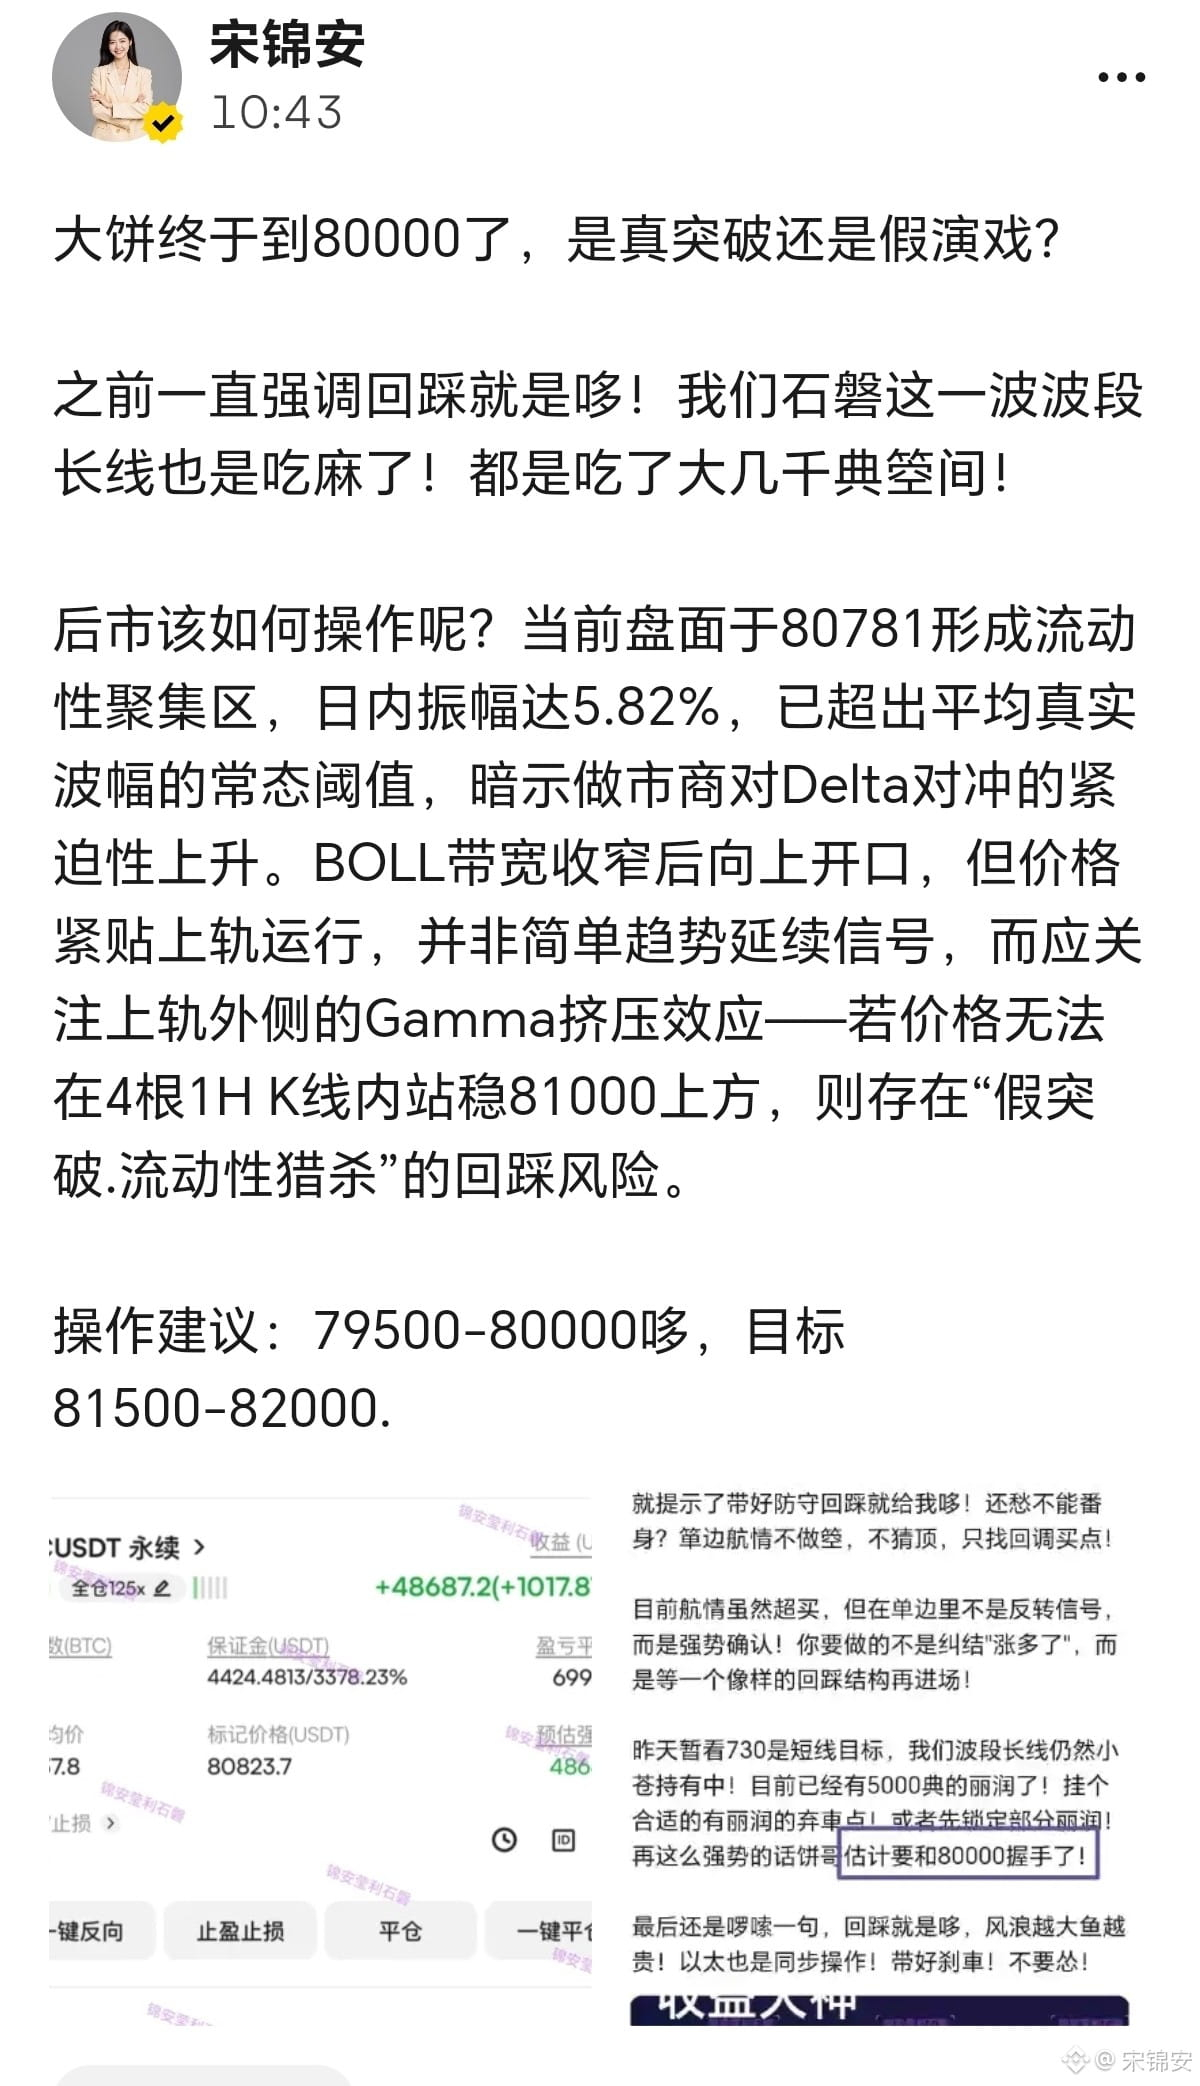
The big biscuit finally hit 80,000— is it a real breakout or just a staged performance?
I’ve been emphasizing that the pullback is where it matters—psh! In this wave, our Shipon’s segment and long-term setup has also been just as hard to digest! We’ve all been munching on several thousand, at that timing!
So how should we act going forward? Currently, the chart has formed a liquidity aggregation zone at 80,781. The intraday swing amplitude is 5.82%, exceeding the typical threshold for average true range, suggesting that market makers’ urgency around Delta hedging is increasing. After the BOLL bandwidth tightens and starts opening upward, price is running close to the upper band. This is not simply a straightforward trend-continuation signal—pay attention to the Gamma squeeze effect on the outside of the upper band. If the price cannot hold above 81,000 within the next four 1H candlesticks, there is a risk of a “fake breakout + liquidity hunt” pullback.
Trading suggestion: psh at 79,500–80,000, with targets at 81,500–82,000.
I’ve been emphasizing that the pullback is where it matters—psh! In this wave, our Shipon’s segment and long-term setup has also been just as hard to digest! We’ve all been munching on several thousand, at that timing!
So how should we act going forward? Currently, the chart has formed a liquidity aggregation zone at 80,781. The intraday swing amplitude is 5.82%, exceeding the typical threshold for average true range, suggesting that market makers’ urgency around Delta hedging is increasing. After the BOLL bandwidth tightens and starts opening upward, price is running close to the upper band. This is not simply a straightforward trend-continuation signal—pay attention to the Gamma squeeze effect on the outside of the upper band. If the price cannot hold above 81,000 within the next four 1H candlesticks, there is a risk of a “fake breakout + liquidity hunt” pullback.
Trading suggestion: psh at 79,500–80,000, with targets at 81,500–82,000.
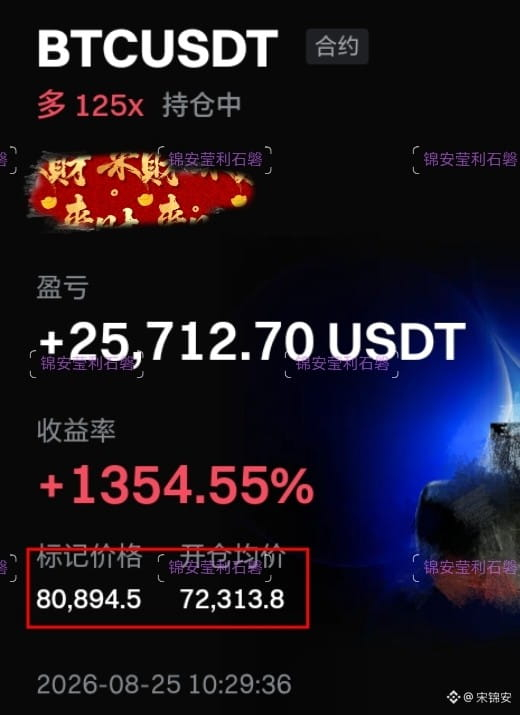
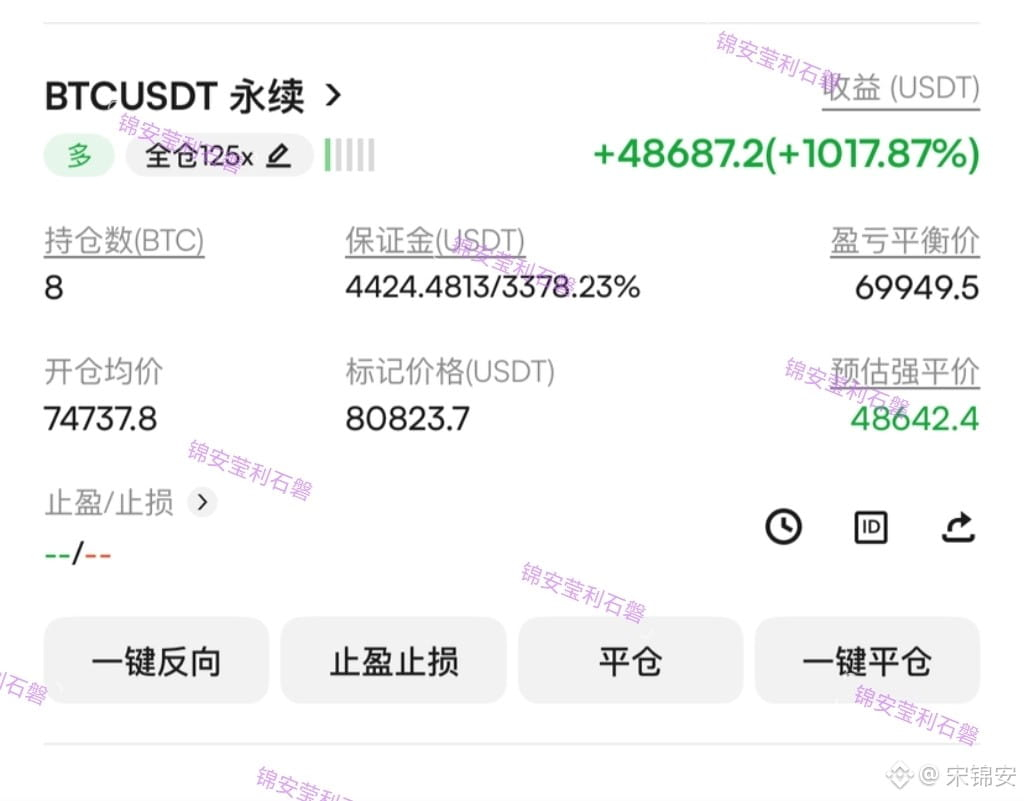
This bambooset also makes a perfect ending! Today’s navigation situation is really great to handle! The zither comes and goes back and forth! Aren’t you still worried that your account won’t improve?
$TSMB $MSFTB $AAPLB #比特币未平仓合约降至两月低点 #美国财政部将回购上限翻倍至40亿美元
$TSMB $MSFTB $AAPLB #比特币未平仓合约降至两月低点 #美国财政部将回购上限翻倍至40亿美元
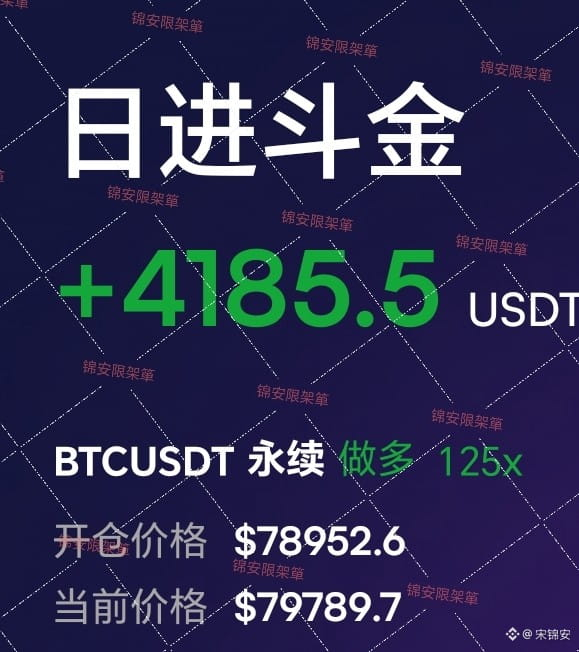
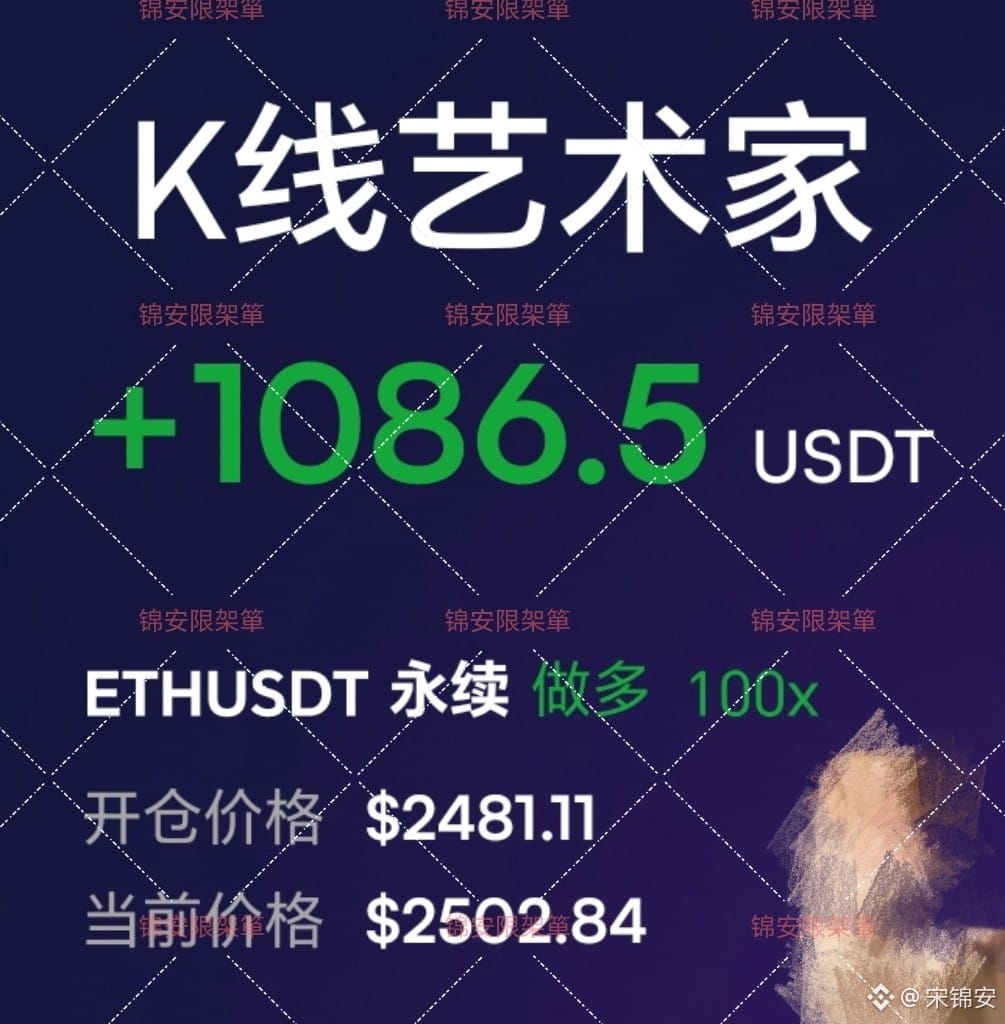
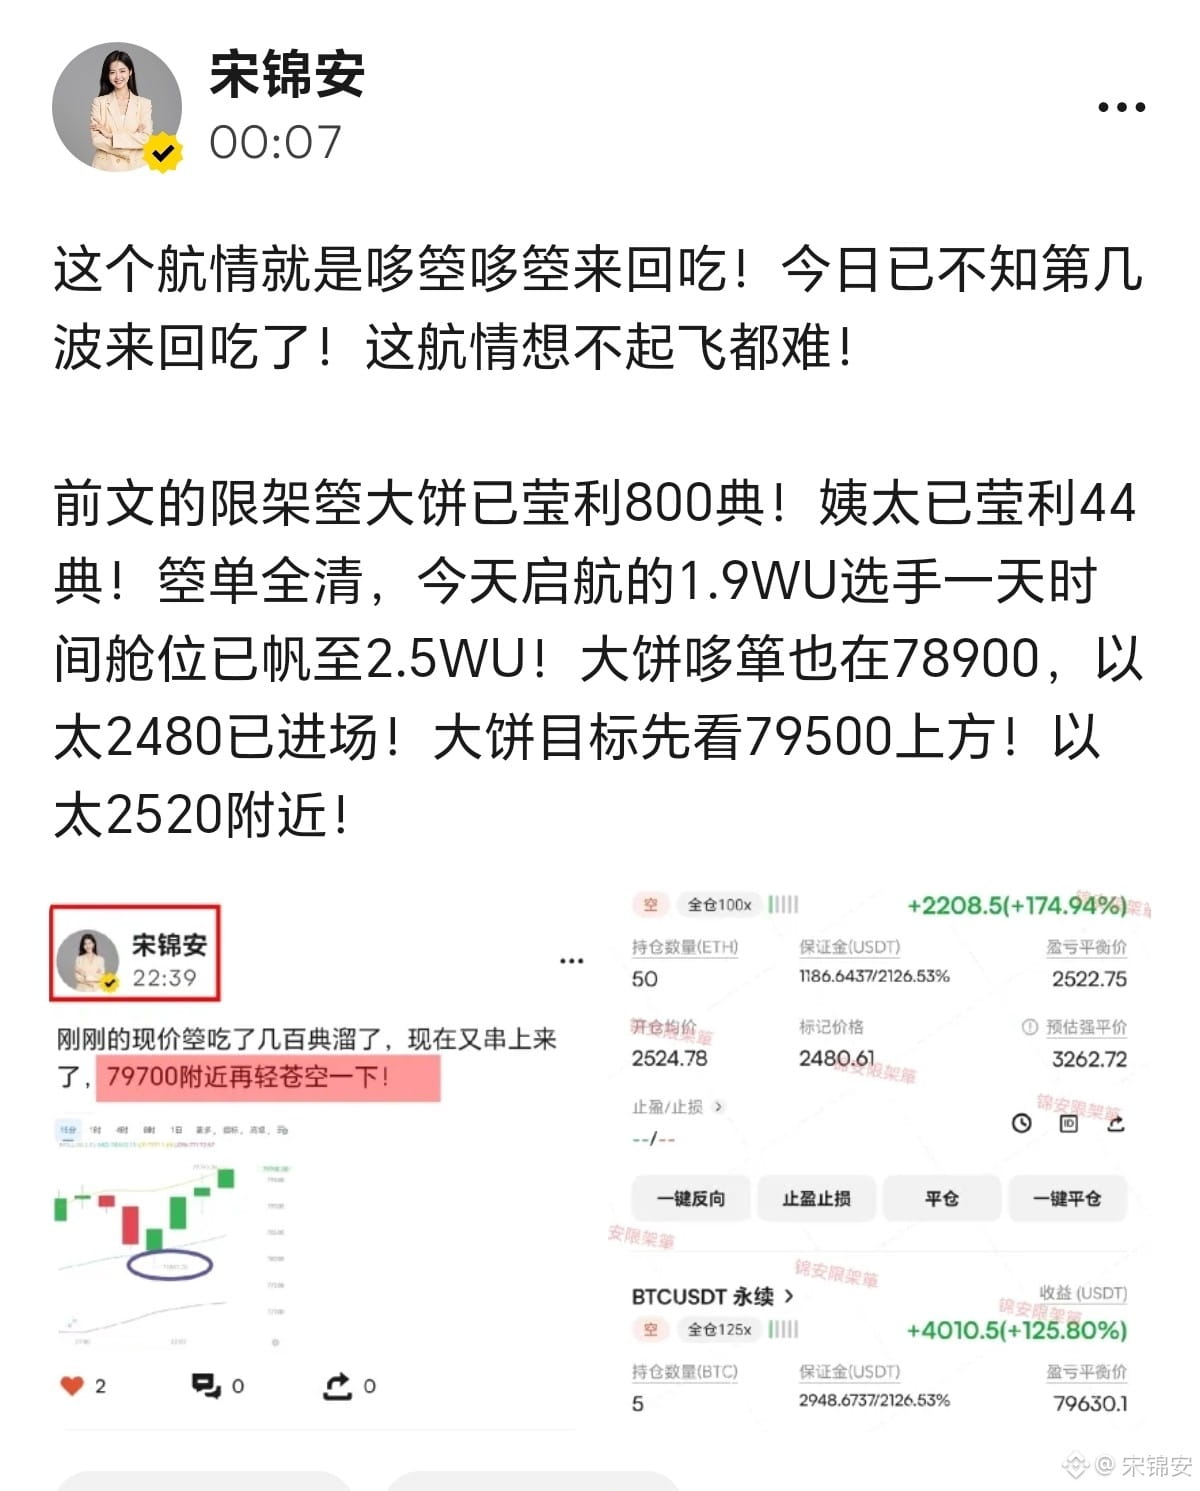
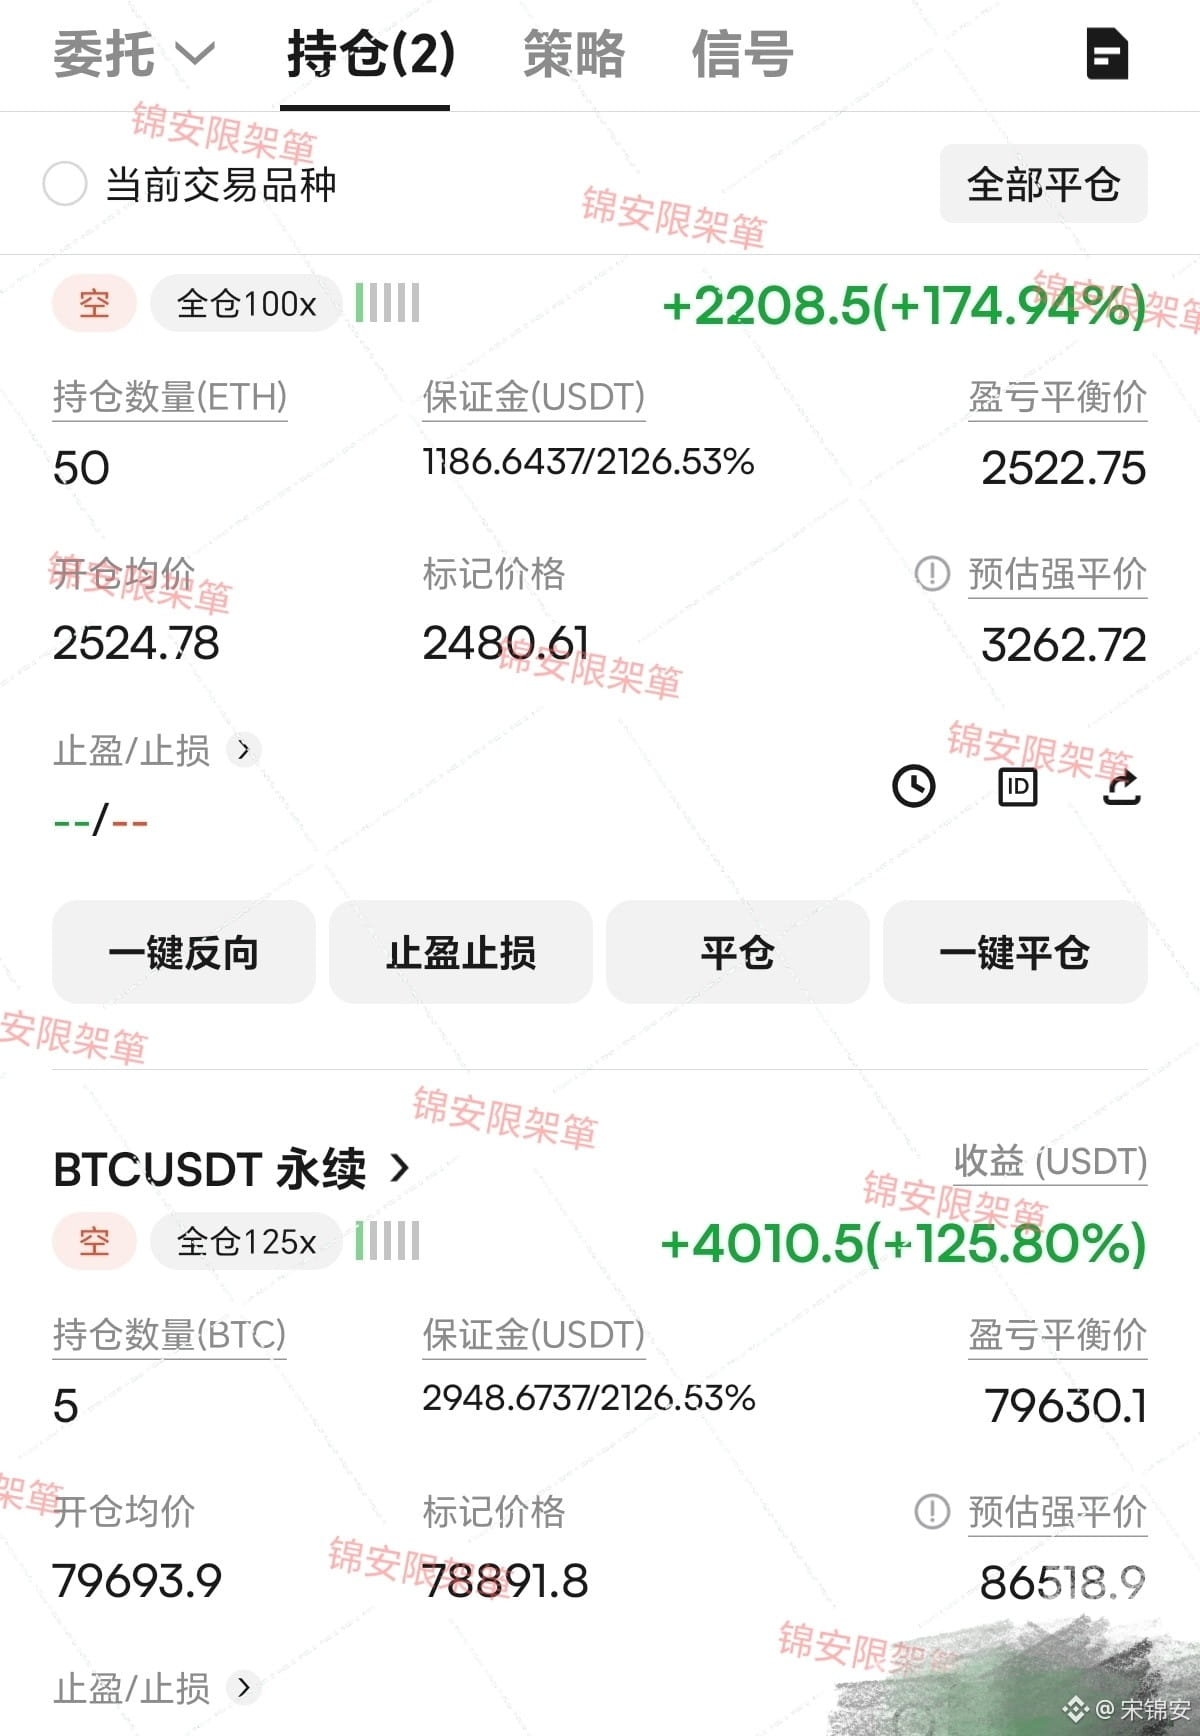
This route is all about nom-nom back and forth! I’ve already lost count of which wave of back-and-forth it is today! This route is so hard to not take off!
In the earlier part, the quota pancake has already made a profit of 800 “dian”! The secondary lady has already made a profit of 44 “dian”! All orders are fully cleared. Today, for the 1.9WU contestant who started sailing, in one day the berth has already been pushed to 2.5WU+! Also, the pancake at 78900 has shown up, and the ETH at 2480 is already in play! The pancake target is first to look above 79500! Around ETH 2520!
$TSMB $MSFTB $AAPLB #比特币周涨23.6% #美国财政部将回购上限翻倍至40亿美元
In the earlier part, the quota pancake has already made a profit of 800 “dian”! The secondary lady has already made a profit of 44 “dian”! All orders are fully cleared. Today, for the 1.9WU contestant who started sailing, in one day the berth has already been pushed to 2.5WU+! Also, the pancake at 78900 has shown up, and the ETH at 2480 is already in play! The pancake target is first to look above 79500! Around ETH 2520!
$TSMB $MSFTB $AAPLB #比特币周涨23.6% #美国财政部将回购上限翻倍至40亿美元
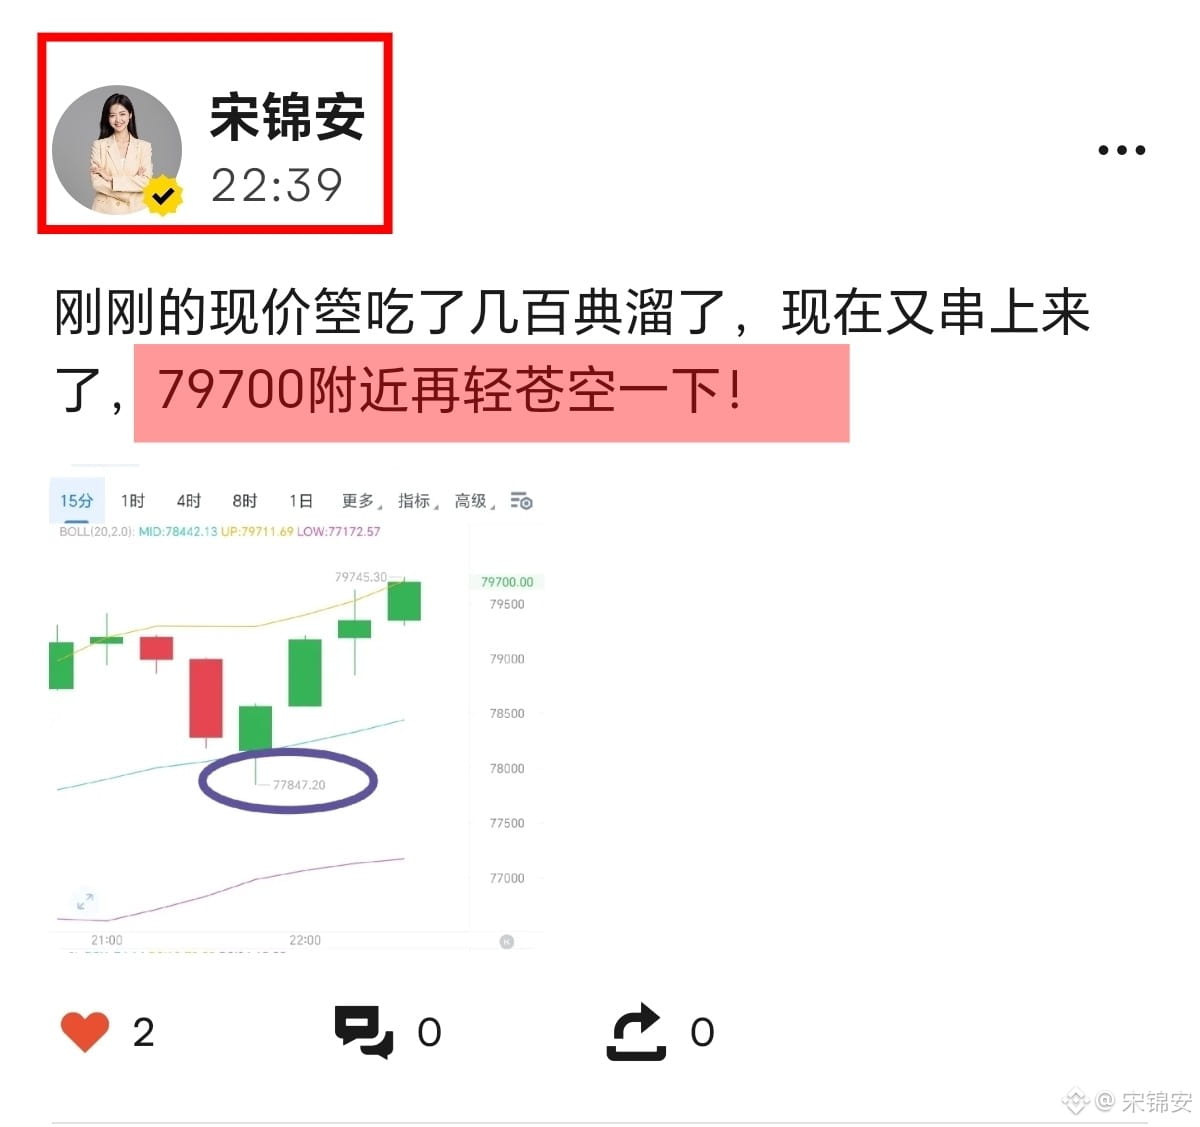
Just now the last price pipped me and I slipped away with a few hundred, now it’s back again—try lightly pushing around near 79700!
$AMZNB $AAPLB #以太坊ETF周净流入6.97亿美元
$AMZNB $AAPLB #以太坊ETF周净流入6.97亿美元
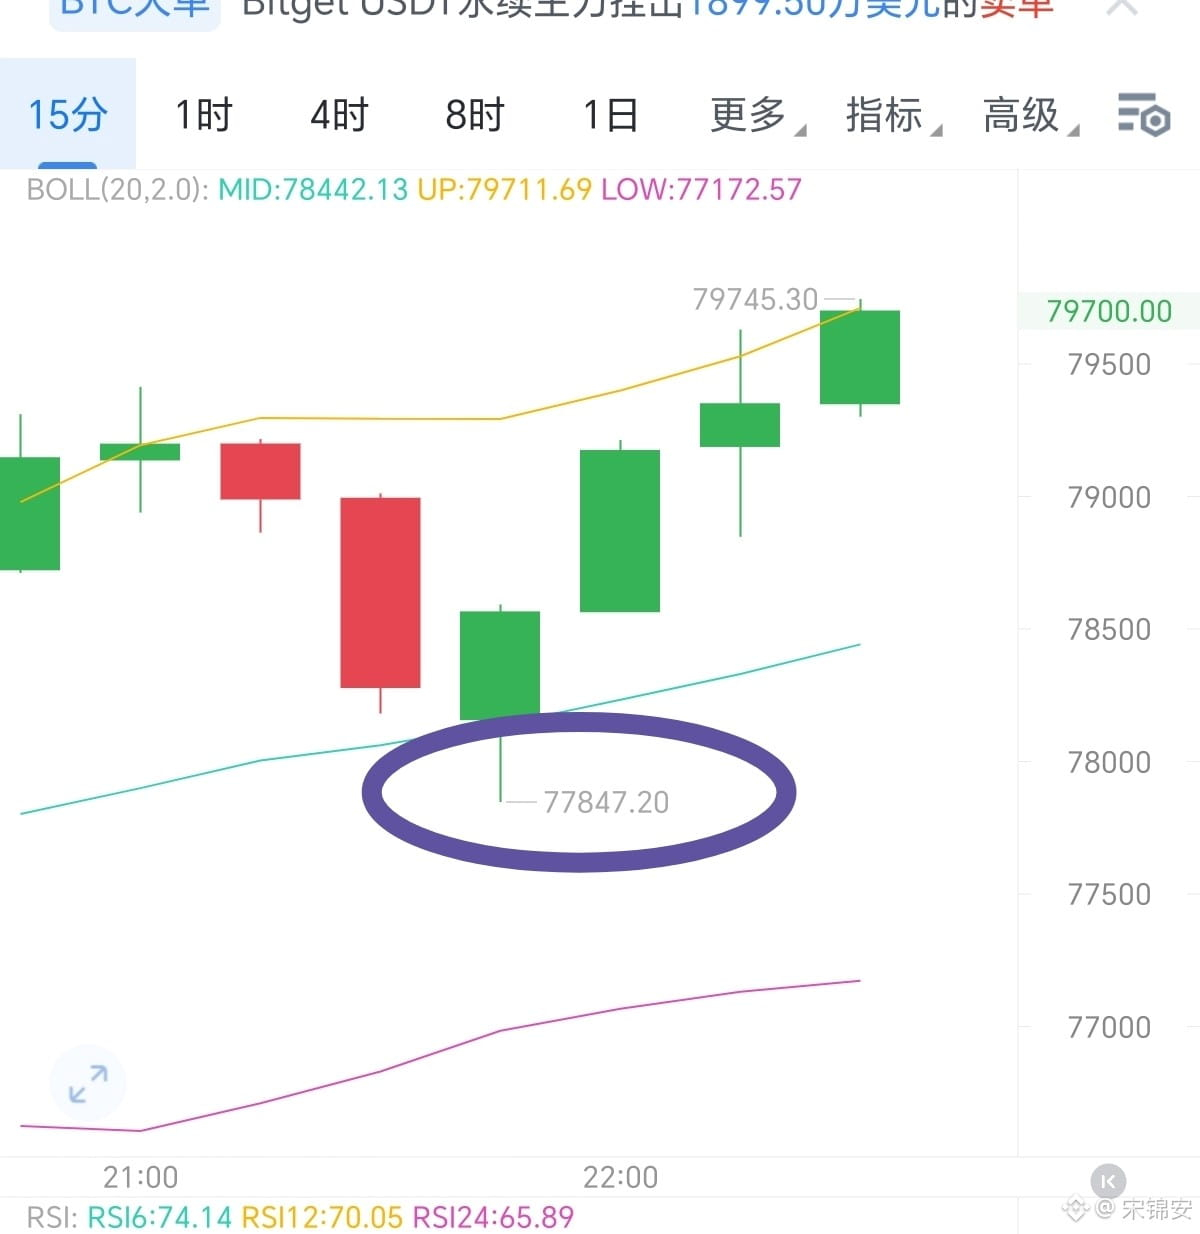
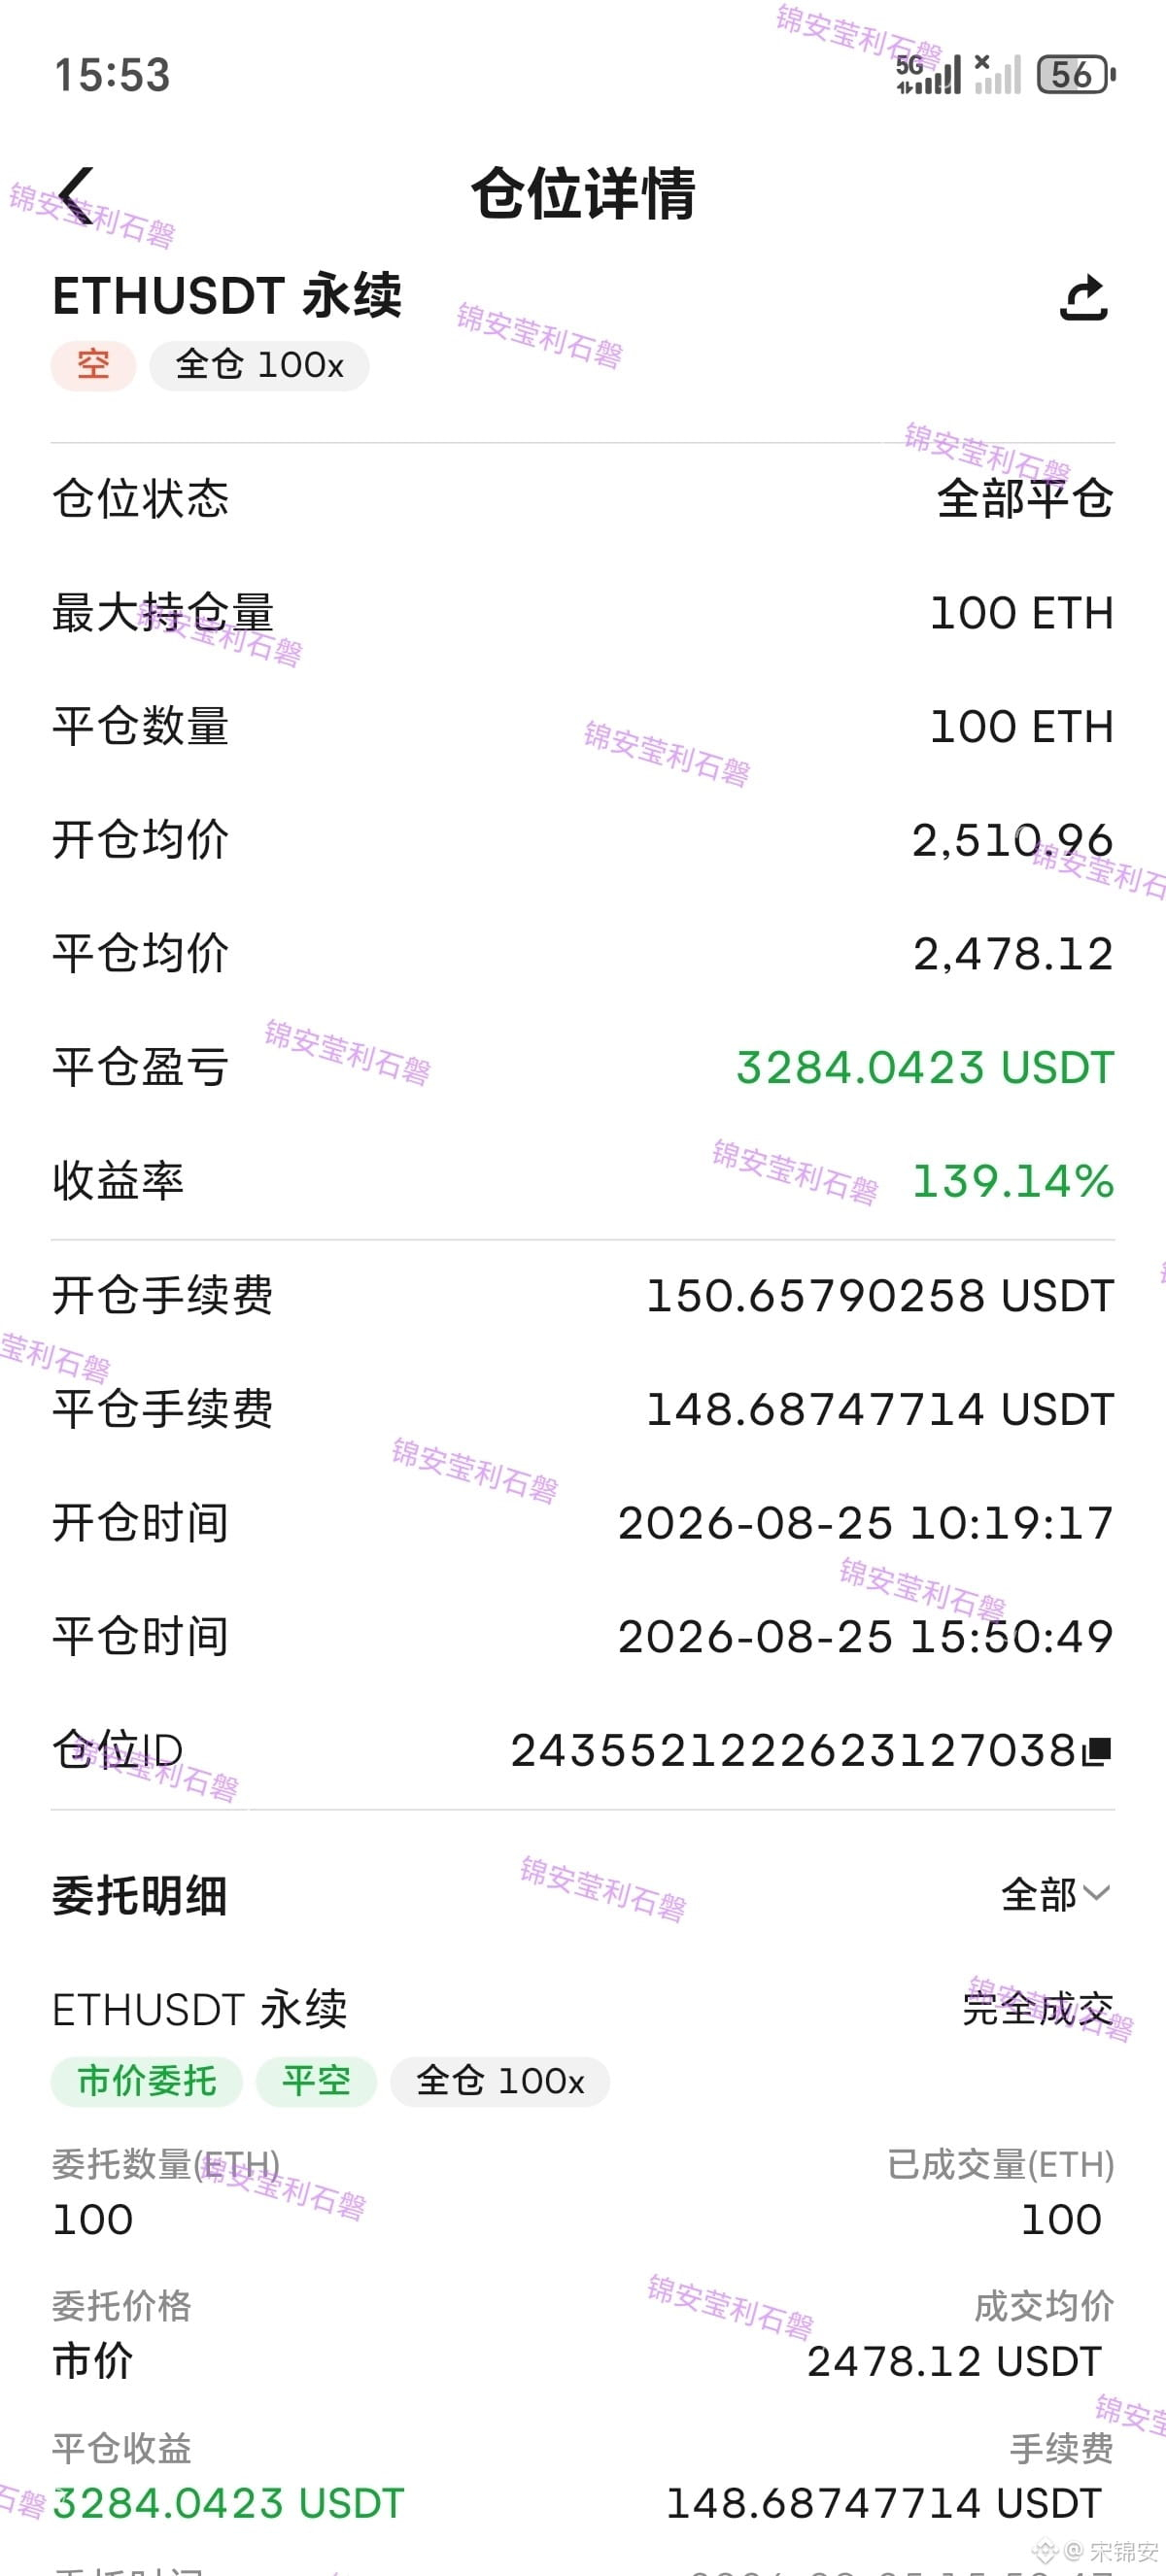
Today going long perfectly meets our Silk Road roadmap to exit nearly 2000 in sight! Shi Pan duo danai all cleared, light Cang kong one-handed! Big cake around 78500, and Ethereum around 2500 for simultaneous operations!
Grab a wave after a pullback; the first target is to watch around 77500.2460.
$AMZNB $AAPLB #布伦特原油跌1.87%
Grab a wave after a pullback; the first target is to watch around 77500.2460.
$AMZNB $AAPLB #布伦特原油跌1.87%
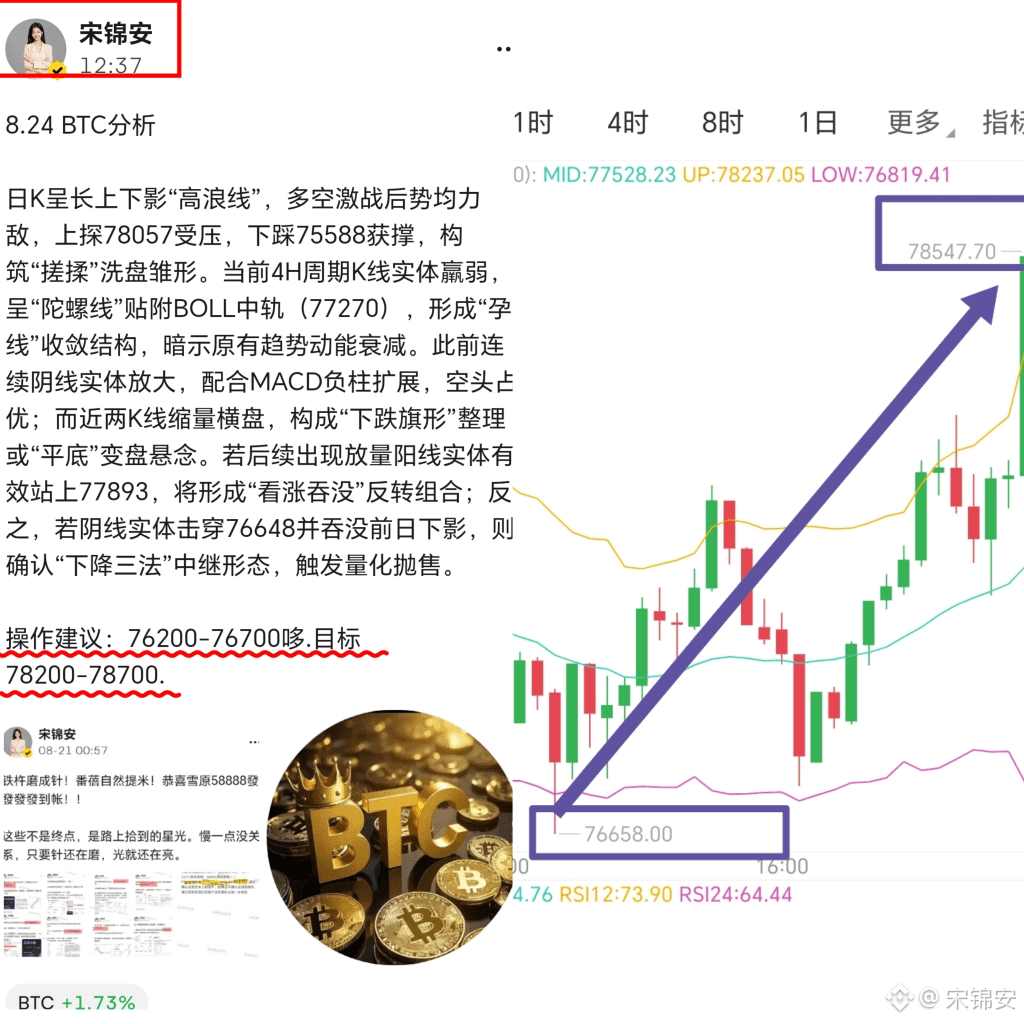
The fate of heaven and earth is yet to be decided; you and I are both dark horses! Welcome new friends to embark together!
$MSFTB #布伦特原油跌1.87%
$MSFTB #布伦特原油跌1.87%
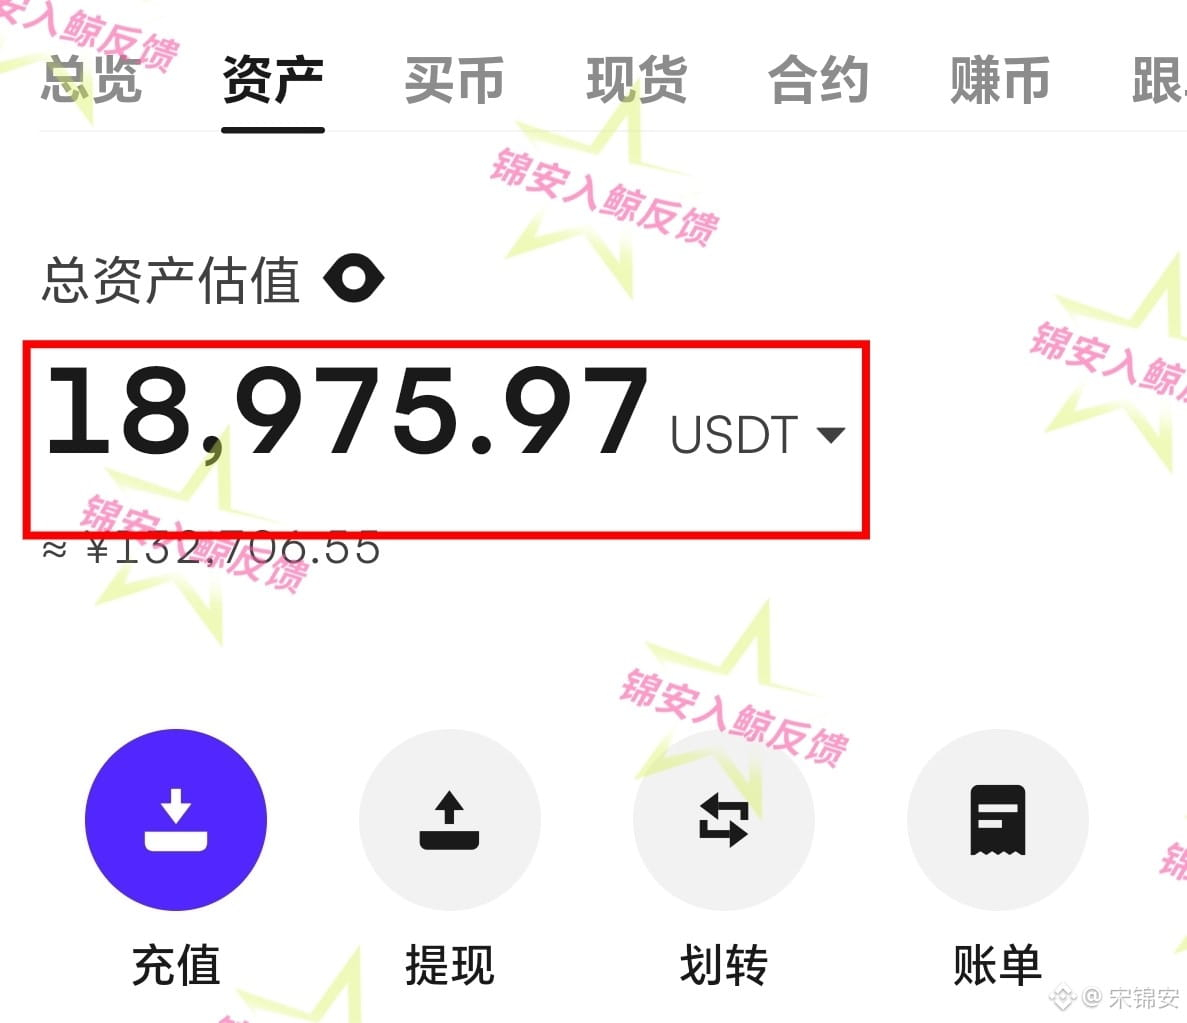


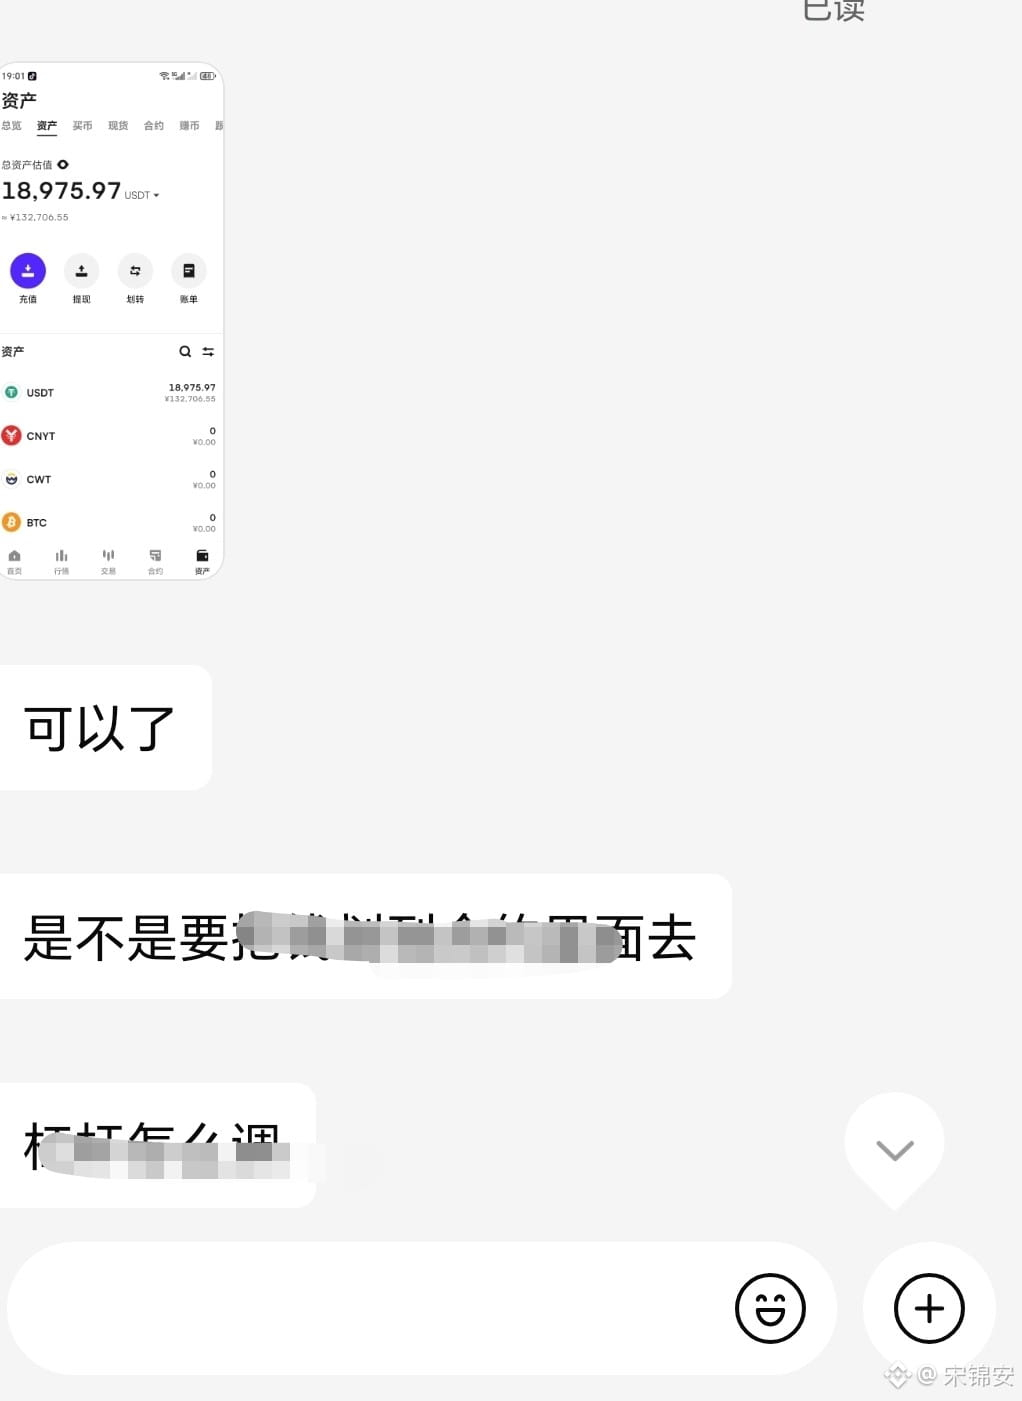
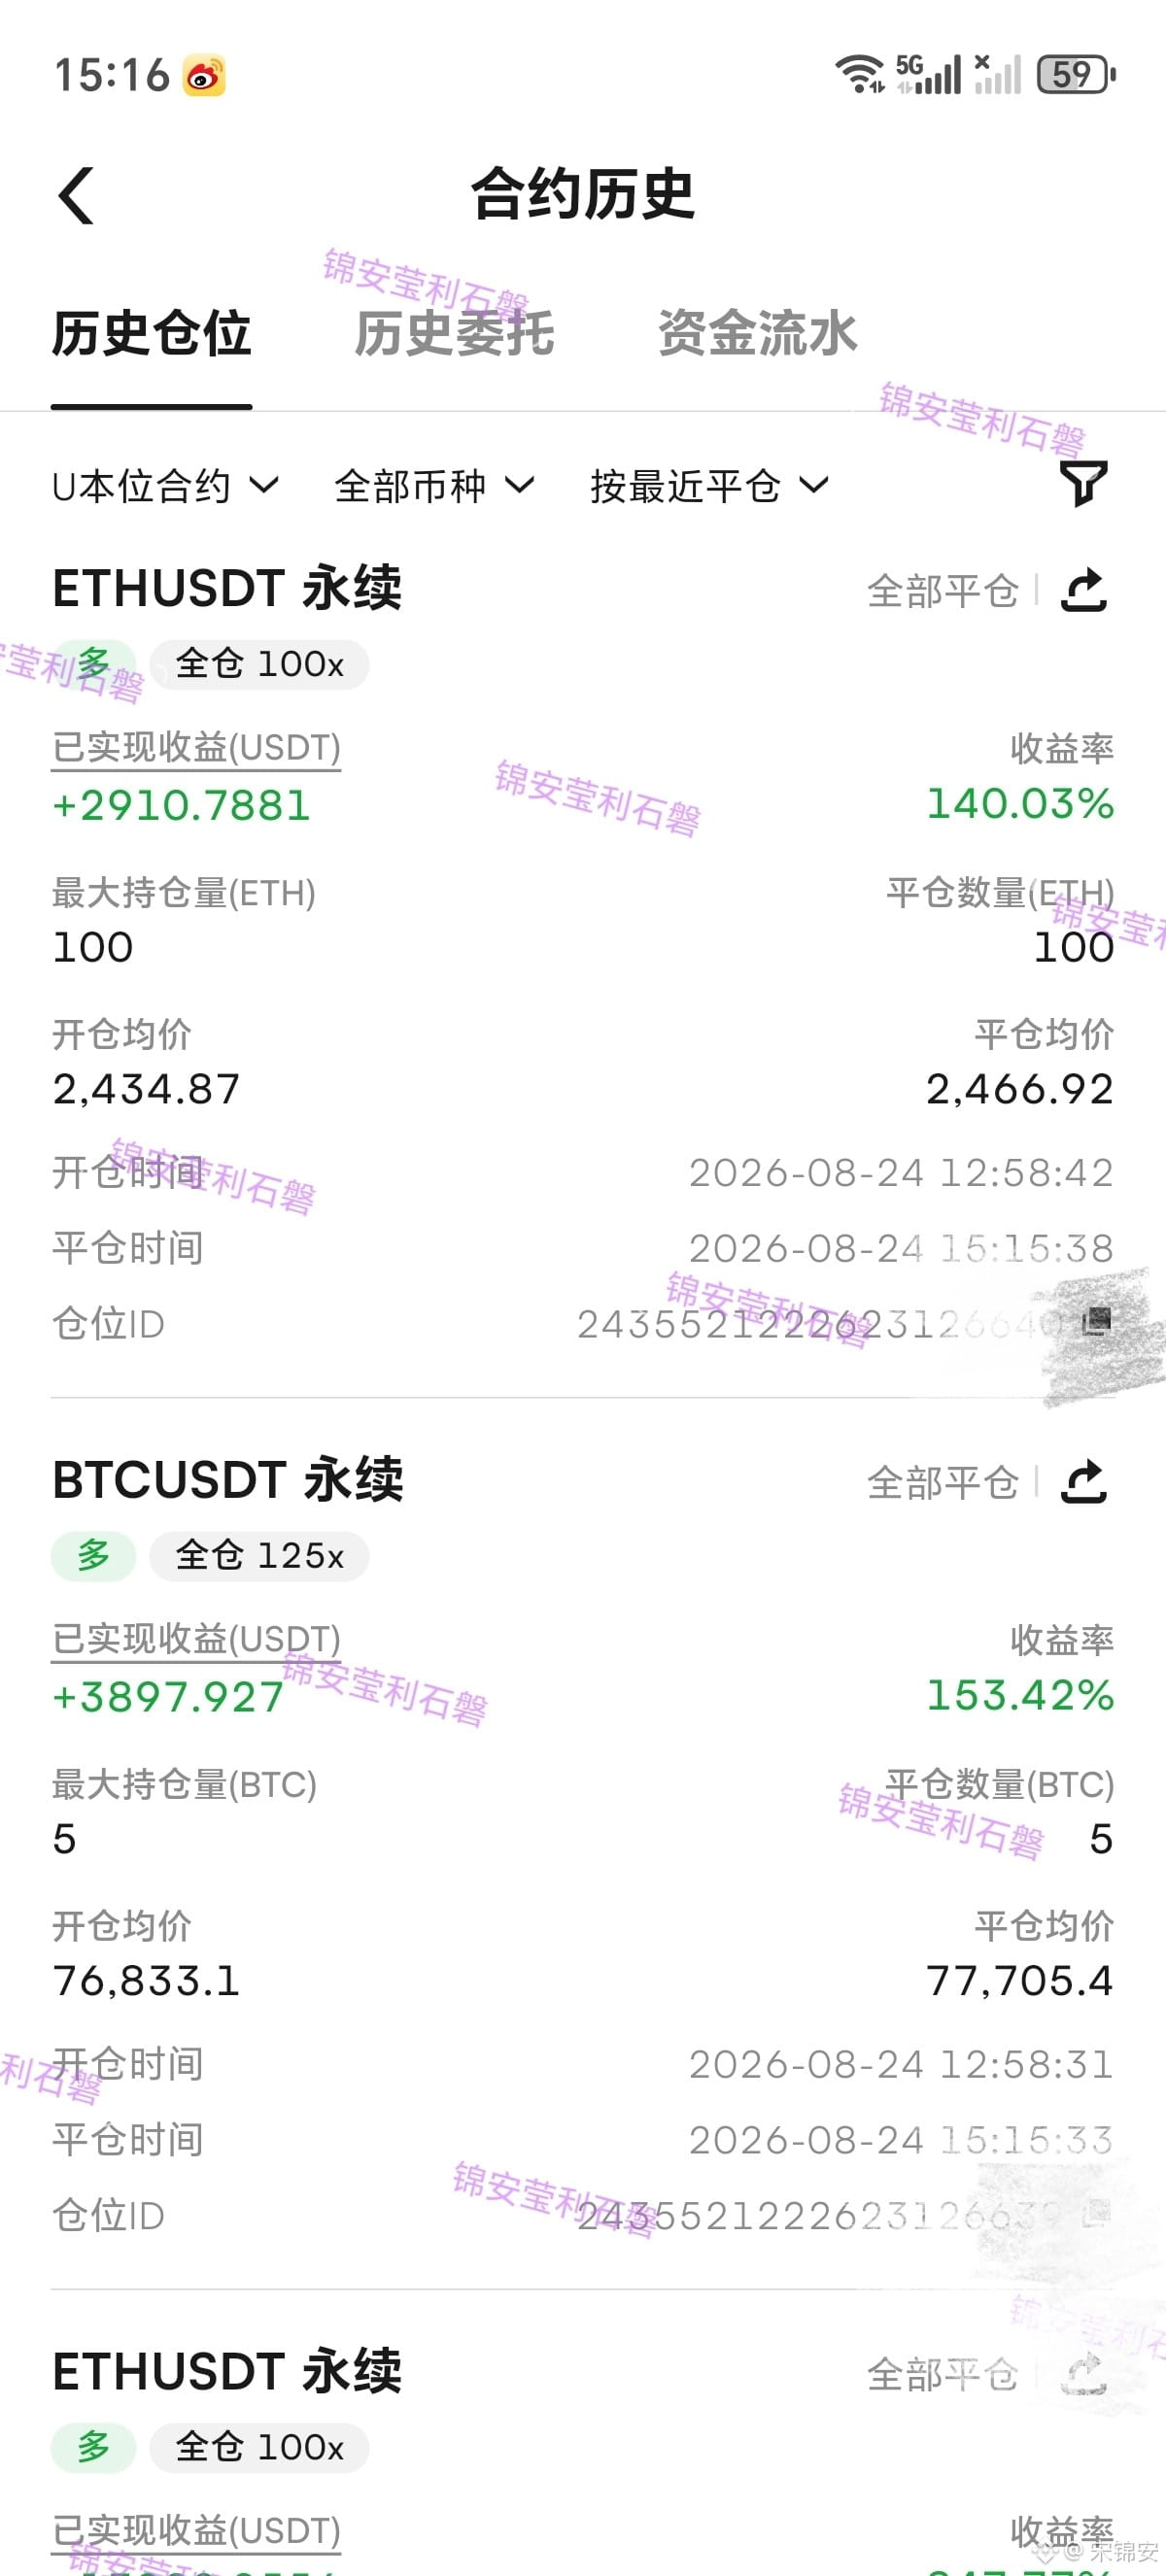
All the way to the top and all the way to feeling great—stone, tight short-term big bets, and a great aunt/sister doubles in a perfect win: the big bet takes down 700. The “aunt” grabs more than 30 points!
Pull back and that’s your chance—manage the defense properly. Wait for the wind to come!
$TSMB $MSFTB #布伦特原油跌1.87% #Solana启动治理投票拟通缩率翻倍
Pull back and that’s your chance—manage the defense properly. Wait for the wind to come!
$TSMB $MSFTB #布伦特原油跌1.87% #Solana启动治理投票拟通缩率翻倍

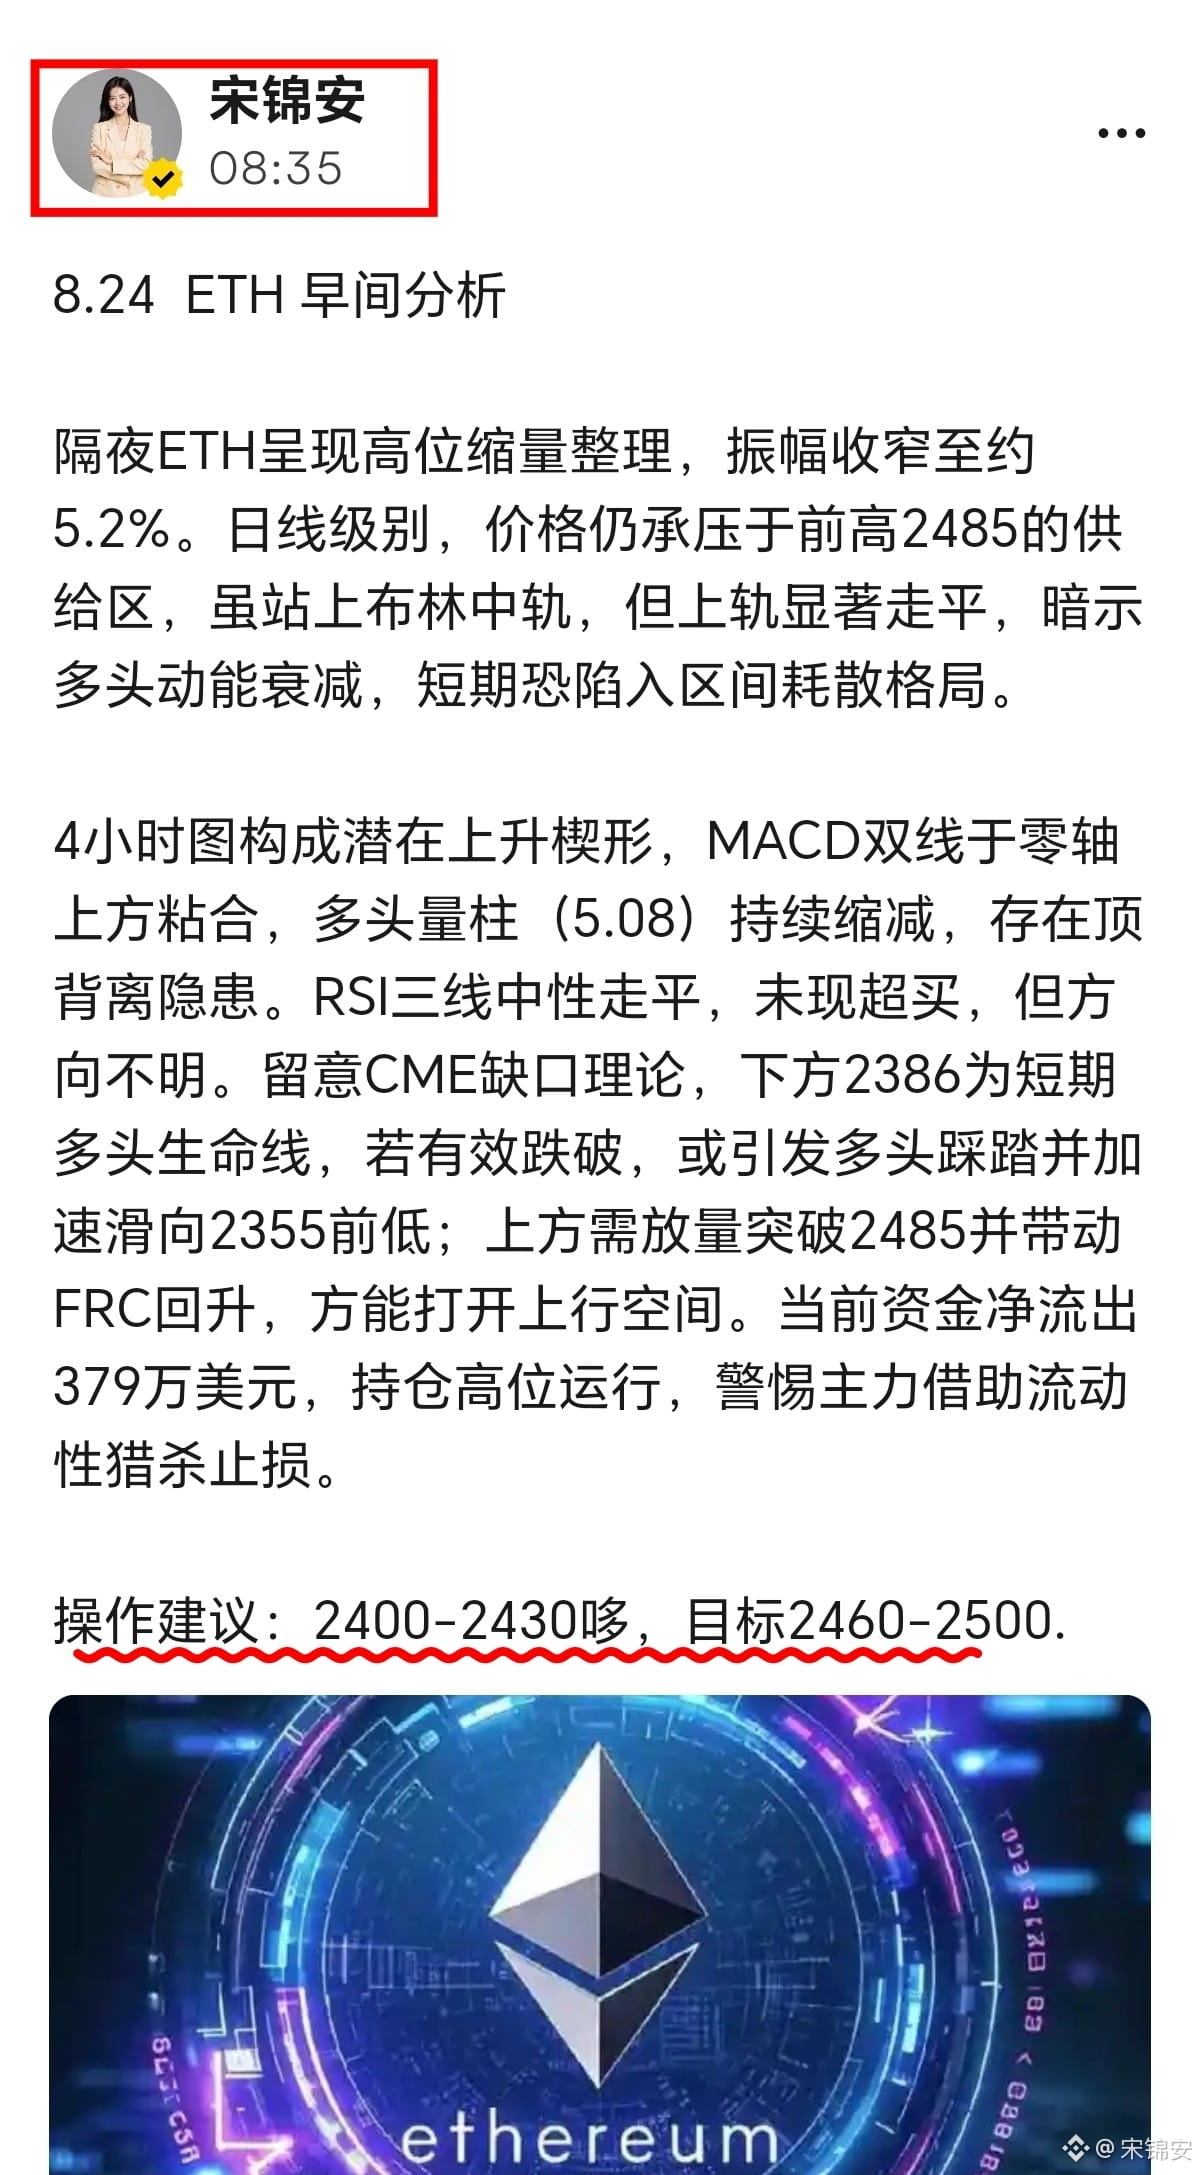
8.24 SanDisk Analysis
On the four-hour timeframe, the market shows the continuing bear pattern of the “falling three methods,” forming the early shape of a further decline. Price is running tight along the lower Bollinger Band at 1534, creating a “single-needle probing the bottom” resistance, but it has not effectively escaped the gravity of the lower band. RSI(6) recorded an extreme value of 16.64, entering the “low-level dulling” zone; however, the negative spread between the MACD DIF and DEA continues to widen, forming a “bearish suffocation” signal. Any rebound is restrained by the suppressive effect of the EMA reverting downward. Large sell orders totaling $9.24 million have been stacked on the order book, creating a “heavy mountain pressing down” situation, leaving the bulls with little ability to counter. Be cautious of the “stop-hunt and then liquidation” style follow-through decline.
If the prior low at 1521.66 is broken, it will trigger a measured downside move based on a “flag” pattern. Otherwise, only by reclaiming the lower Bollinger Band at 1534 with increased volume and getting the DIF to turn will it be reasonable to view it as a weak-to-strong signal after “bear power exhaustion.” For now, treat the market as a sluggish downtrend where rallies fail to break above the prior high.
Trading suggestion: go long on dips at 1505–1525, set a stop at 1490. Target 1550–1600. If support breaks, look for price above 1650.
On the four-hour timeframe, the market shows the continuing bear pattern of the “falling three methods,” forming the early shape of a further decline. Price is running tight along the lower Bollinger Band at 1534, creating a “single-needle probing the bottom” resistance, but it has not effectively escaped the gravity of the lower band. RSI(6) recorded an extreme value of 16.64, entering the “low-level dulling” zone; however, the negative spread between the MACD DIF and DEA continues to widen, forming a “bearish suffocation” signal. Any rebound is restrained by the suppressive effect of the EMA reverting downward. Large sell orders totaling $9.24 million have been stacked on the order book, creating a “heavy mountain pressing down” situation, leaving the bulls with little ability to counter. Be cautious of the “stop-hunt and then liquidation” style follow-through decline.
If the prior low at 1521.66 is broken, it will trigger a measured downside move based on a “flag” pattern. Otherwise, only by reclaiming the lower Bollinger Band at 1534 with increased volume and getting the DIF to turn will it be reasonable to view it as a weak-to-strong signal after “bear power exhaustion.” For now, treat the market as a sluggish downtrend where rallies fail to break above the prior high.
Trading suggestion: go long on dips at 1505–1525, set a stop at 1490. Target 1550–1600. If support breaks, look for price above 1650.

8.24 Gold Analysis
Current gold is shifting from the real interest-rate logic to a hedge against U.S. dollar credit. The U.S. Treasury has expanded the size of long-term debt repurchase transactions, which the market views as diluting U.S. dollar credit. This comes alongside the first time total U.S. Treasury securities have broken through $40 trillion and weaker economic data, with the U.S. Dollar Index falling below 99. The currency-substitution effect for gold continues to intensify.
The breakdown of U.S.-Iran talks has raised Middle East geopolitical risks, and elevated oil prices further heighten inflation concerns. On the positioning side, in Q2 global central banks net bought 289 tons of gold. SPDR Gold ETF increased its holdings by more than 40 tons this month, with strong buying momentum. Institutions such as Caitong Securities and Goldman Sachs have maintained a medium-term bullish outlook. Technically, gold prices have broken above $4,600 and are tracking closely along the upper Bollinger Band, but the RSI has entered the overbought zone, suggesting a need for short-term correction. Be mindful that this week’s Jackson Hole symposium may trigger high-range volatility if it releases hawkish signals, though the medium-term upside thesis remains unchanged.
Trading suggestion: 4600-4620, target 4650-4700.
$TSMB $MSFTB #阿里巴巴港股募资102亿美元
Current gold is shifting from the real interest-rate logic to a hedge against U.S. dollar credit. The U.S. Treasury has expanded the size of long-term debt repurchase transactions, which the market views as diluting U.S. dollar credit. This comes alongside the first time total U.S. Treasury securities have broken through $40 trillion and weaker economic data, with the U.S. Dollar Index falling below 99. The currency-substitution effect for gold continues to intensify.
The breakdown of U.S.-Iran talks has raised Middle East geopolitical risks, and elevated oil prices further heighten inflation concerns. On the positioning side, in Q2 global central banks net bought 289 tons of gold. SPDR Gold ETF increased its holdings by more than 40 tons this month, with strong buying momentum. Institutions such as Caitong Securities and Goldman Sachs have maintained a medium-term bullish outlook. Technically, gold prices have broken above $4,600 and are tracking closely along the upper Bollinger Band, but the RSI has entered the overbought zone, suggesting a need for short-term correction. Be mindful that this week’s Jackson Hole symposium may trigger high-range volatility if it releases hawkish signals, though the medium-term upside thesis remains unchanged.
Trading suggestion: 4600-4620, target 4650-4700.
$TSMB $MSFTB #阿里巴巴港股募资102亿美元

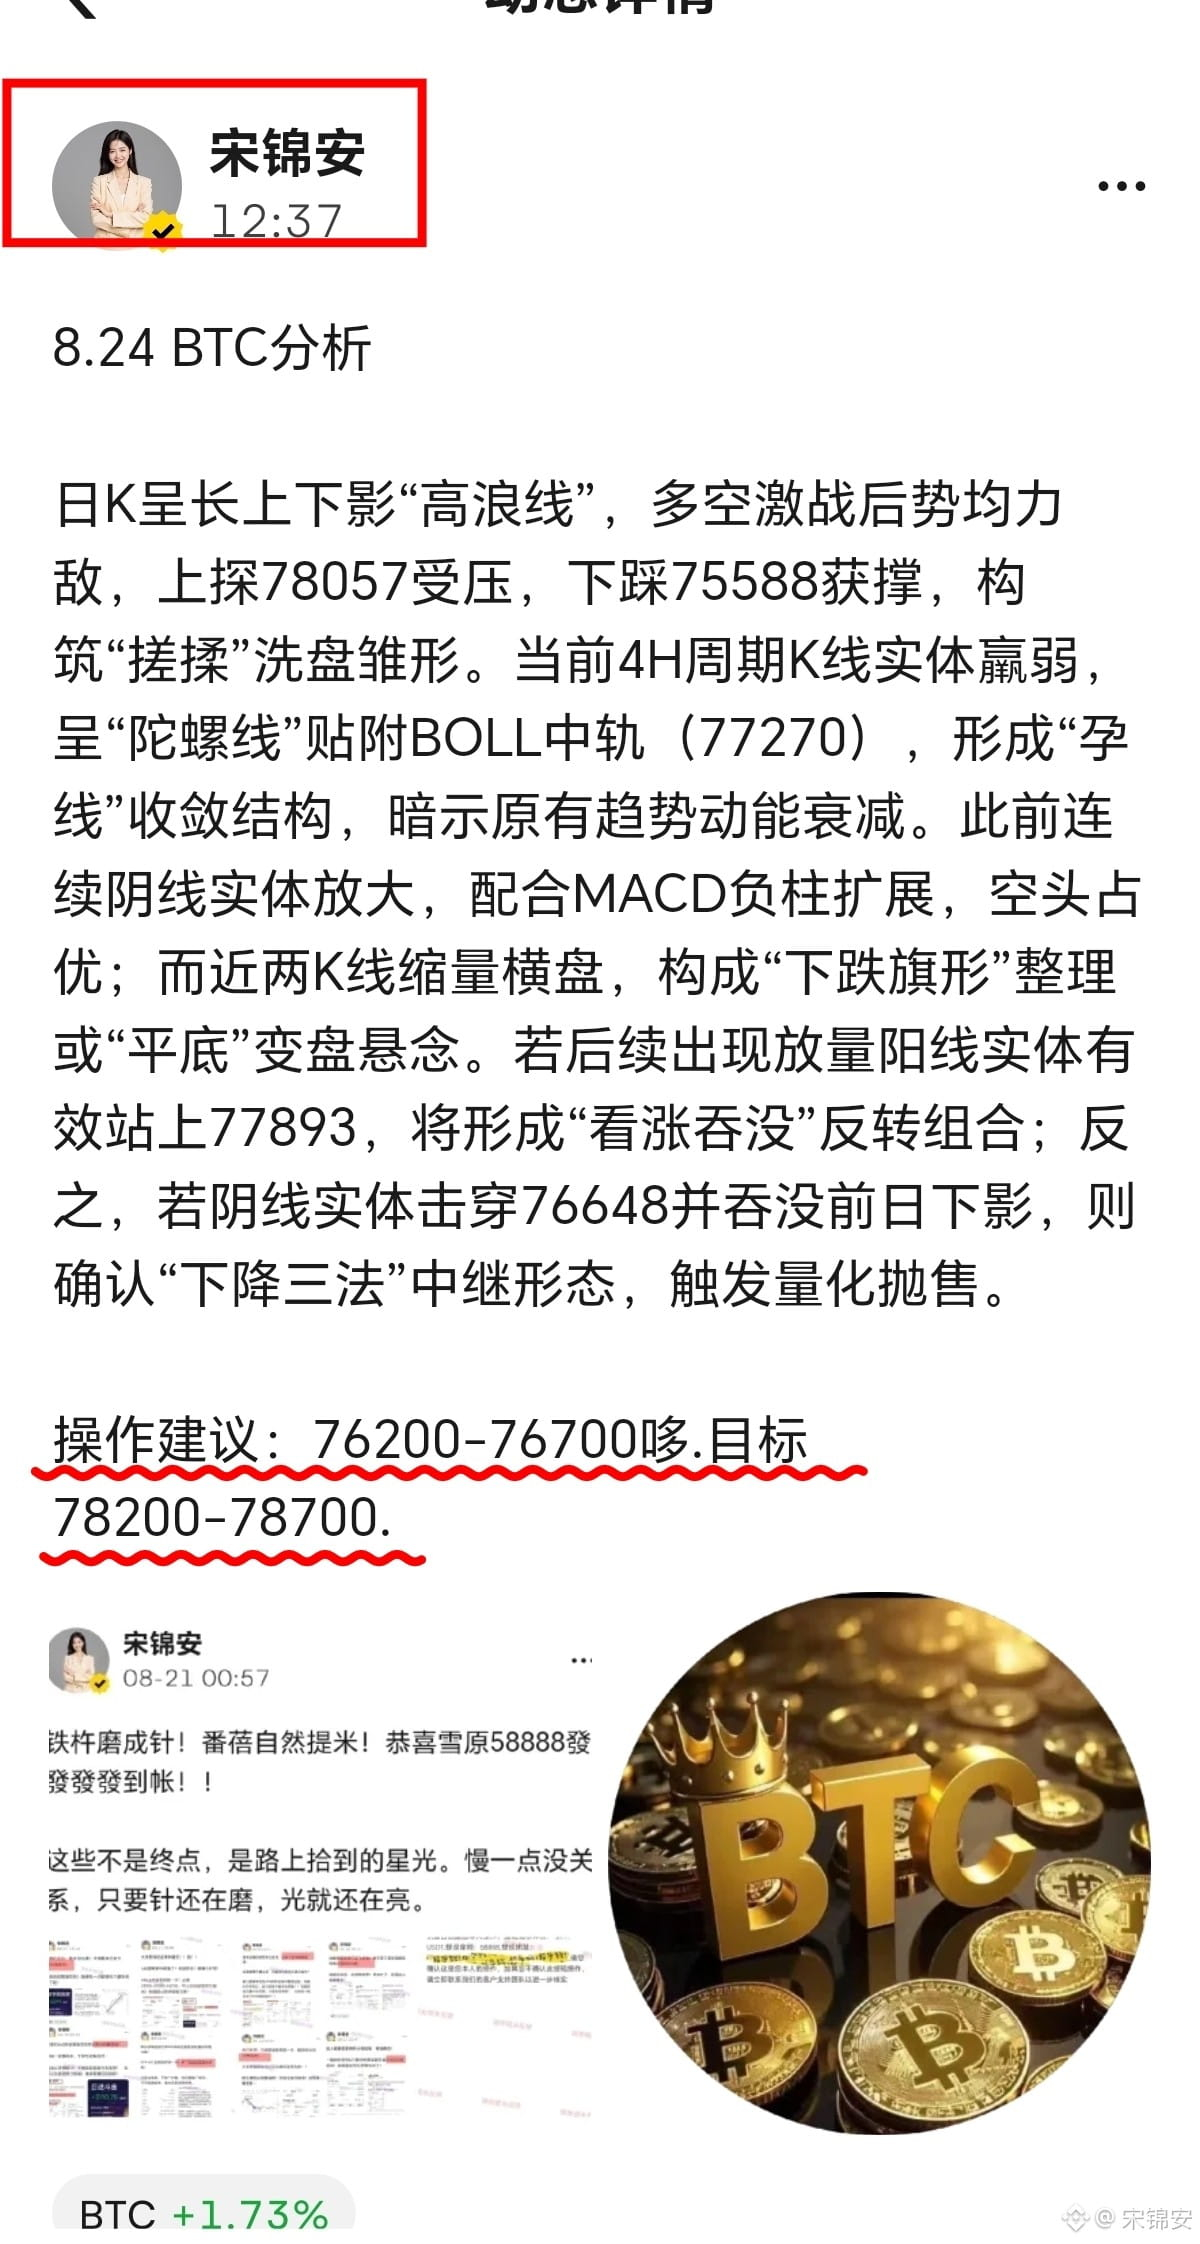
8.24 BTC Analysis
The daily K-line shows a long upper and lower wick “high wave line.” After a battle between bulls and bears, the forces are roughly balanced. Price is capped near 78057 and finds support at 75588, forming the early pattern of a “chop-and-rub” consolidation. On the current 4H timeframe, the K-line body is weak, resembling a “spinning top line” clinging to the BOLL midline (77270). This creates a “pregnant line” convergence structure, suggesting the momentum of the prior trend is fading. Earlier, consecutive bearish bodies expanded in size, along with MACD negative histogram bars widening—bearish control was dominant. However, in the last two K-lines, volume has shrunk and price has moved sideways, forming a “falling flag” consolidation or a “double-bottom” turning-point uncertainty. If, next, a high-volume bullish K-line prints and its body effectively stands above 77893, it will form a bullish “bullish engulfing” reversal combination. Conversely, if a bearish body breaks through 76648 and engulfs the previous day’s lower wick, it will confirm a “descending three methods” continuation pattern, triggering algorithmic selling.
Trading suggestion: 76200–76700, target 78200–78700.
$TSMB #Shein拟港股IPO募资至多18亿美元
The daily K-line shows a long upper and lower wick “high wave line.” After a battle between bulls and bears, the forces are roughly balanced. Price is capped near 78057 and finds support at 75588, forming the early pattern of a “chop-and-rub” consolidation. On the current 4H timeframe, the K-line body is weak, resembling a “spinning top line” clinging to the BOLL midline (77270). This creates a “pregnant line” convergence structure, suggesting the momentum of the prior trend is fading. Earlier, consecutive bearish bodies expanded in size, along with MACD negative histogram bars widening—bearish control was dominant. However, in the last two K-lines, volume has shrunk and price has moved sideways, forming a “falling flag” consolidation or a “double-bottom” turning-point uncertainty. If, next, a high-volume bullish K-line prints and its body effectively stands above 77893, it will form a bullish “bullish engulfing” reversal combination. Conversely, if a bearish body breaks through 76648 and engulfs the previous day’s lower wick, it will confirm a “descending three methods” continuation pattern, triggering algorithmic selling.
Trading suggestion: 76200–76700, target 78200–78700.
$TSMB #Shein拟港股IPO募资至多18亿美元


Log in to explore more content