

stoneLaite
135 Posts
stoneLaite
Report
Block User
102 Following
111 Followers
158 Liked
Posts
All
Quotes
Videos
·
--
See translation
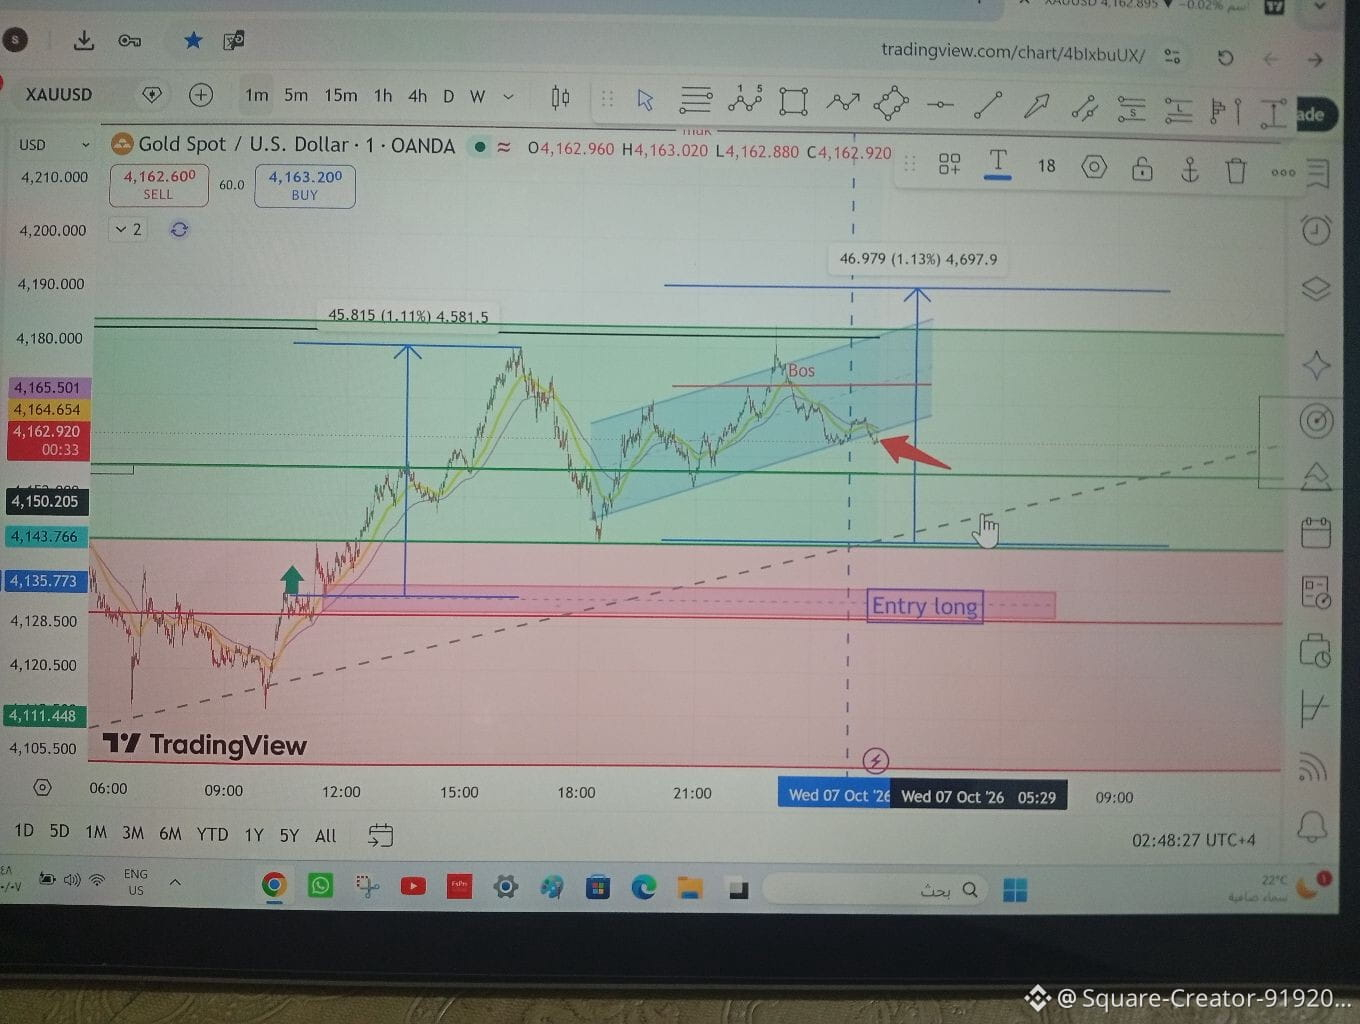
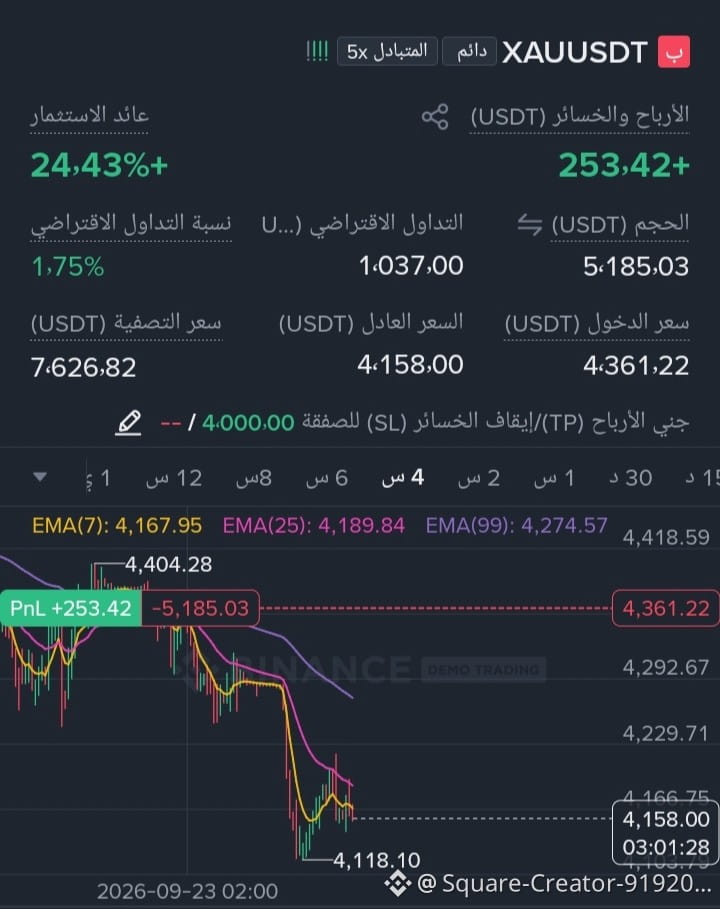
جلسة مراقبة حركة الذهب
اذا هبط الى منطقة أوردر بلوك OB
سأعاود الشراء في نقطة دعم قوية 4100
جلسة مراقبة حركة الذهب
اذا هبط الى منطقة أوردر بلوك OB
سأعاود الشراء في نقطة دعم قوية 4100
اذا هبط الى منطقة أوردر بلوك OB
سأعاود الشراء في نقطة دعم قوية 4100
166
·
--
90٪---
90% of people think that Zigzag is a ZigZag indicator that draws blue lines.
No, my friend—my Zigzag is a complete methodology.
The zigzag =
*wave structure + Fibonacci + ICT liquidity + Elliott waves*
As you can see in the SANDUSDT chart that I drew:
1- The blue structure (zigzag):
It’s what defines the real wave for me, removes noise and fake candles. Every blue line is a wave. I only enter at the end of a wave and the beginning of a new one.
90٪
---
90% of people think that Zigzag is a ZigZag indicator that draws blue lines.
No, my friend—my Zigzag is a complete methodology.
The zigzag =
*wave structure + Fibonacci + ICT liquidity + Elliott waves*
As you can see in the SANDUSDT chart that I drew:
1- The blue structure (zigzag):
It’s what defines the real wave for me, removes noise and fake candles. Every blue line is a wave. I only enter at the end of a wave and the beginning of a new one.
90% of people think that Zigzag is a ZigZag indicator that draws blue lines.
No, my friend—my Zigzag is a complete methodology.
The zigzag =
*wave structure + Fibonacci + ICT liquidity + Elliott waves*
As you can see in the SANDUSDT chart that I drew:
1- The blue structure (zigzag):
It’s what defines the real wave for me, removes noise and fake candles. Every blue line is a wave. I only enter at the end of a wave and the beginning of a new one.
634
·
--
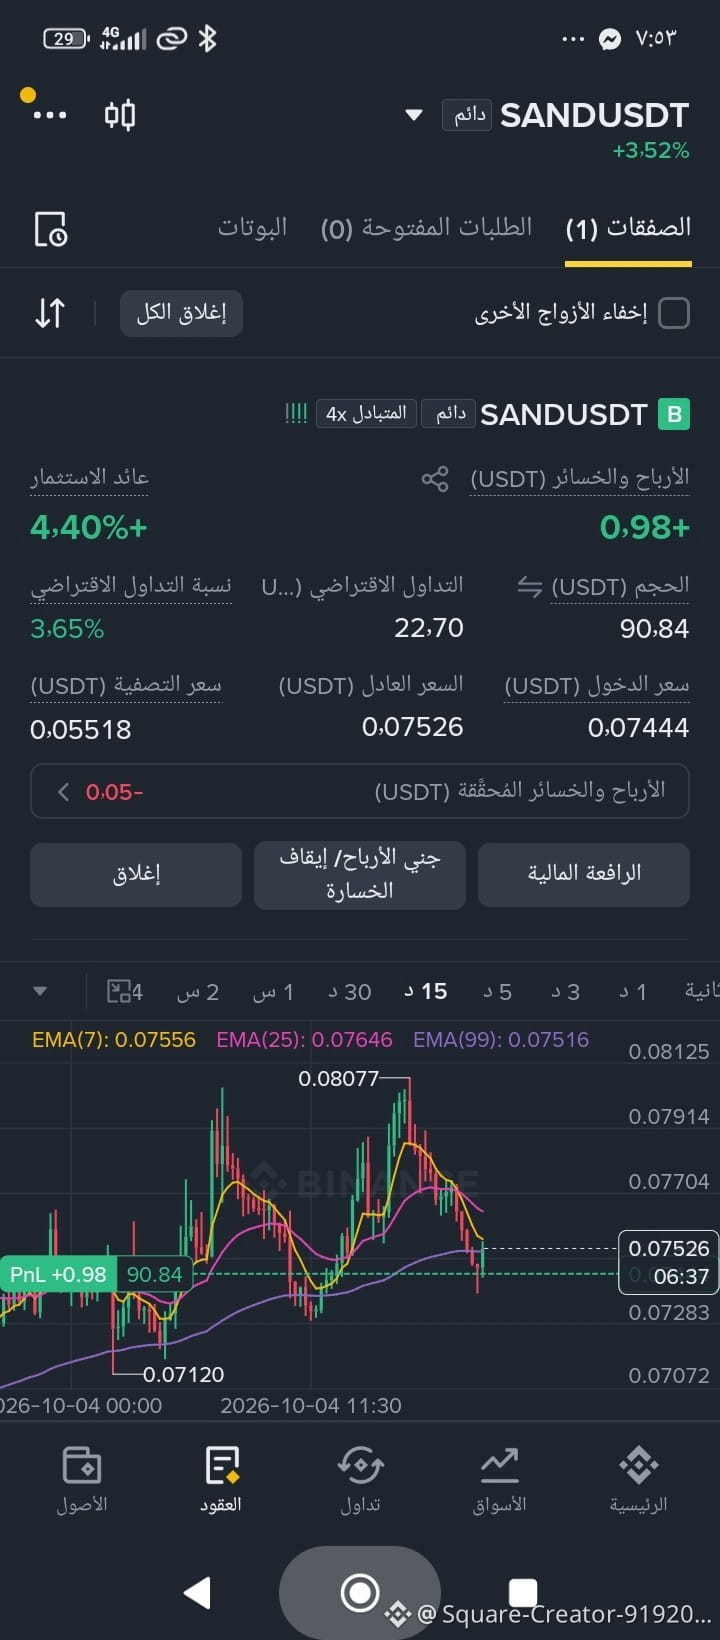
For beginners
A calm deal with a low balance
Stop loss at 0.07400
Sand
For beginners
A calm deal with a low balance
Stop loss at 0.07400
Sand
A calm deal with a low balance
Stop loss at 0.07400
Sand
1
2
970
·
--
Comparing trading to gambling is a gross simplification
Gambling is a bet on the unknown—without tools, without probabilities being considered, and without any ability to control losses
Trading, on the other hand, is dealing with uncertainty using sciences, probabilities, and risk management
The key difference: gambling is a single decision resulting from a binary outcome—no plan and no limit on losses
Trading involves technical analysis of price behavior, wave patterns, and also regions
Fundamental analysis of liquidity, inflation, policies, and events
Measurement tools and probabilities
Capital management and exiting before losses turn into a disaster
Statements by Trump affect the market
But they don’t make the market gambling—they make the environment change
The difference here is that a professional trader doesn’t gamble on the news; rather, they price in its impact and protect themselves against it..
In the end, you’re not obligated to trade if you think it resembles gambling
#فوركس_الكويت #فوركس_السعودية #فوركس_قطر #التداول #تداول_عملات #ترامب #اقتصاد
Comparing trading to gambling is a gross simplification
Gambling is a bet on the unknown—without tools, without probabilities being considered, and without any ability to control losses
Trading, on the other hand, is dealing with uncertainty using sciences, probabilities, and risk management
The key difference: gambling is a single decision resulting from a binary outcome—no plan and no limit on losses
Trading involves technical analysis of price behavior, wave patterns, and also regions
Fundamental analysis of liquidity, inflation, policies, and events
Measurement tools and probabilities
Capital management and exiting before losses turn into a disaster
Statements by Trump affect the market
But they don’t make the market gambling—they make the environment change
The difference here is that a professional trader doesn’t gamble on the news; rather, they price in its impact and protect themselves against it..
In the end, you’re not obligated to trade if you think it resembles gambling
#فوركس_الكويت #فوركس_السعودية #فوركس_قطر #التداول #تداول_عملات #ترامب #اقتصاد
Gambling is a bet on the unknown—without tools, without probabilities being considered, and without any ability to control losses
Trading, on the other hand, is dealing with uncertainty using sciences, probabilities, and risk management
The key difference: gambling is a single decision resulting from a binary outcome—no plan and no limit on losses
Trading involves technical analysis of price behavior, wave patterns, and also regions
Fundamental analysis of liquidity, inflation, policies, and events
Measurement tools and probabilities
Capital management and exiting before losses turn into a disaster
Statements by Trump affect the market
But they don’t make the market gambling—they make the environment change
The difference here is that a professional trader doesn’t gamble on the news; rather, they price in its impact and protect themselves against it..
In the end, you’re not obligated to trade if you think it resembles gambling
#فوركس_الكويت #فوركس_السعودية #فوركس_قطر #التداول #تداول_عملات #ترامب #اقتصاد

203
·
--
-
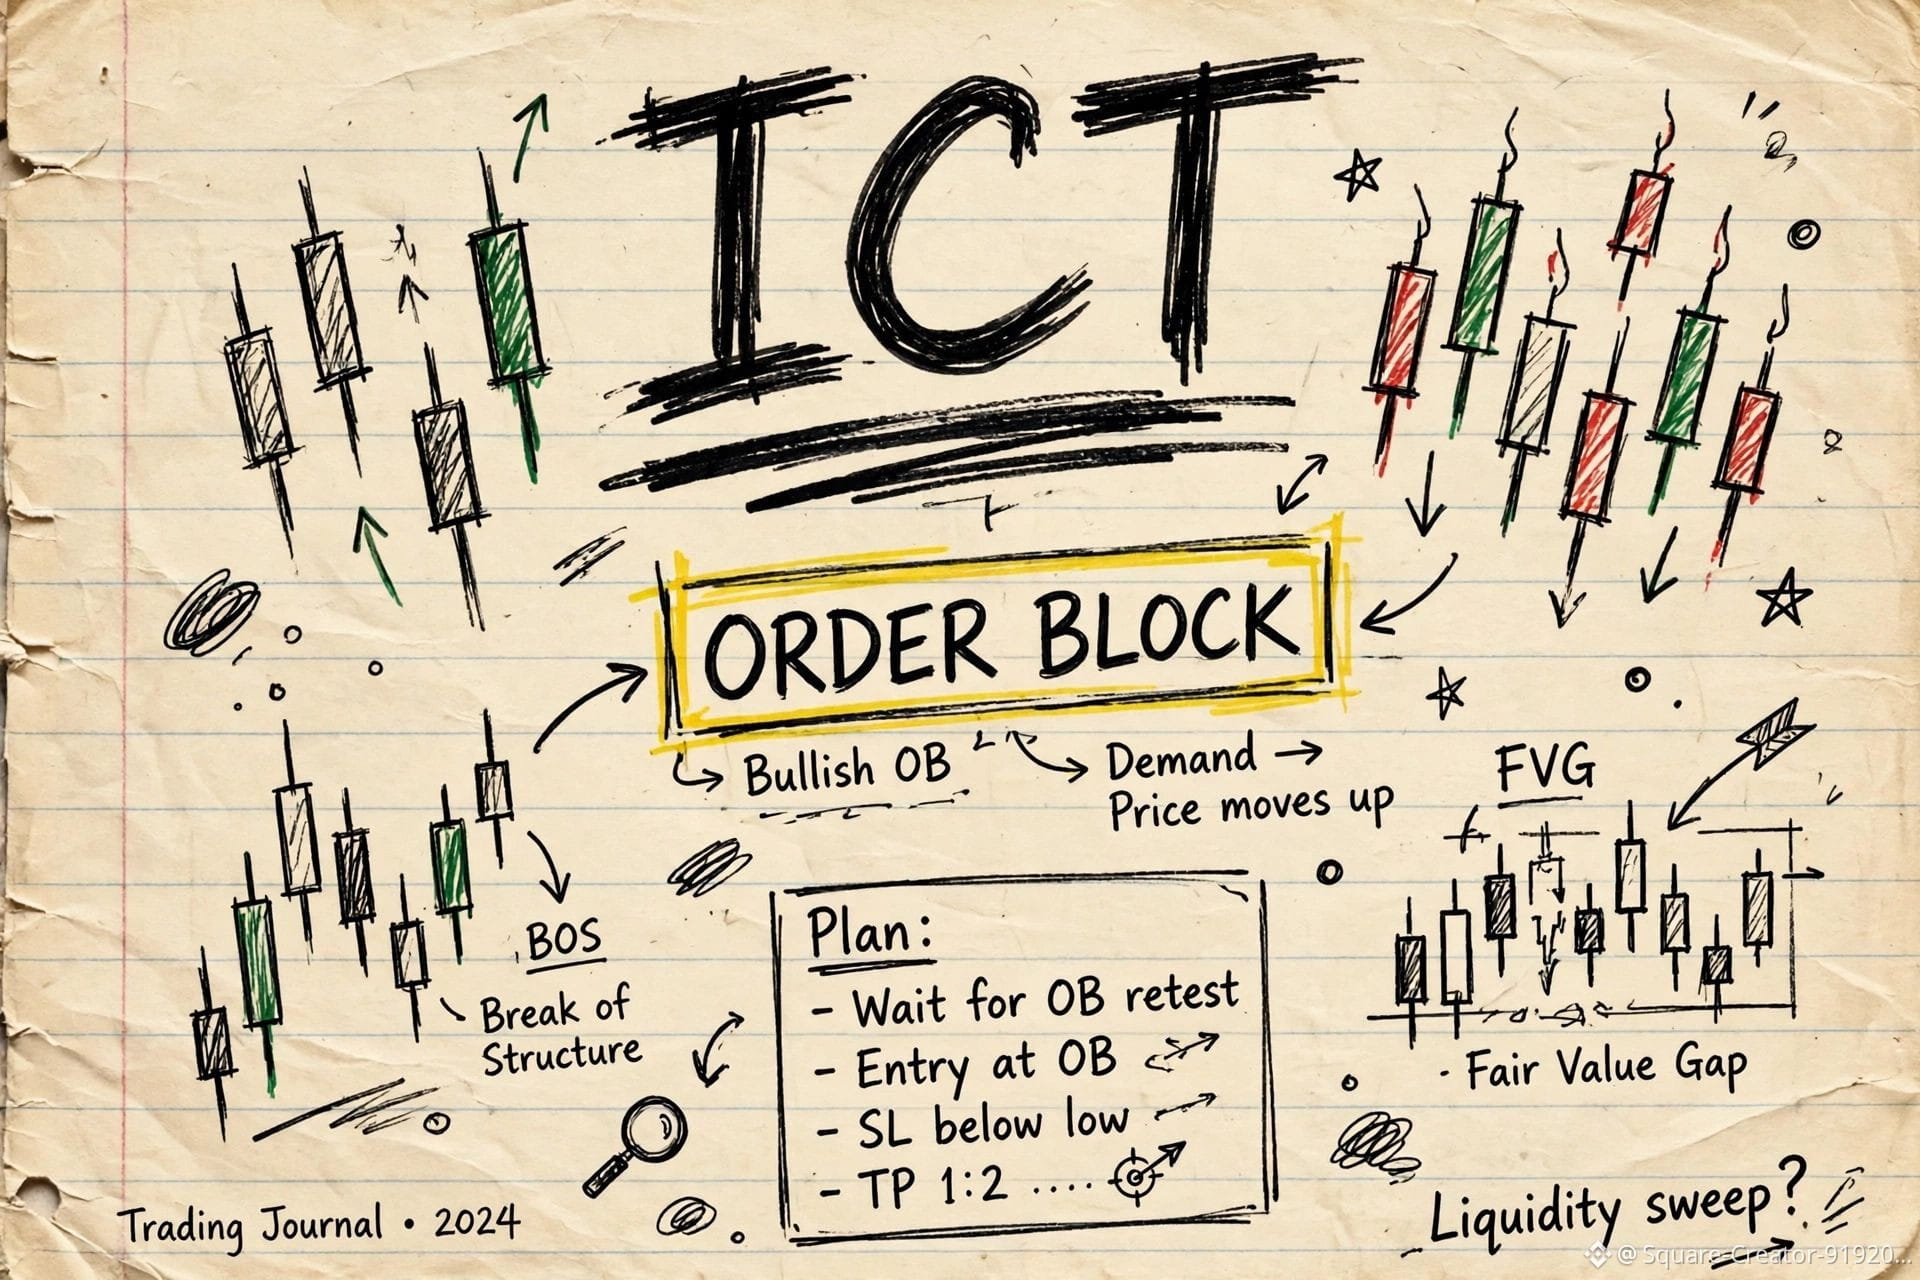
*The First Lesson of ICT: Market Structure and Liquidity*
The market has only two languages: *structure and liquidity.*
*1- Highs and Lows (High & Low):*
Every high above it has some stop orders (sell stops) that people will buy/sell into; every low below it has some stop orders (buy stops) that people have placed.
Market makers don’t move except to take these stops.
*2- Break of Structure (BOS):*
When price breaks the last important low = the downtrend is continuing.
When it breaks the last important high = the uptrend is continuing.
This is a continuation signal, not a reversal.
*3- Market Structure Shift (MSS) (the most important point):*
When the market is bearish and strongly breaks a bearish swing high = a shift from bearish to bullish.
Here we start looking to buy only.
And the opposite is true.
*The Golden Summary Nobody Ever Tells You:*
Price always takes liquidity before it reverses.
Meaning: it rises above the highs to take buy-side liquidity (Buy Side), then drops and stops out everyone.
Or it falls below the lows to take sell-side liquidity (Sell Side), and then it flies.
*The ZIGZAG Law + ICT:*
Never enter before price sweeps the liquidity (Swept).
Let it sweep, it gives you MSS, then you enter with the banks.
Save the picture—this is the map we’ll be following for the next 10 lessons.
Write in the comments *Done* if you understood the lesson 👇
#ICT #First_Lesson #MarketStructure #BOS #MSS #Liquidity #SmartMoney
-
*The First Lesson of ICT: Market Structure and Liquidity*
The market has only two languages: *structure and liquidity.*
*1- Highs and Lows (High & Low):*
Every high above it has some stop orders (sell stops) that people will buy/sell into; every low below it has some stop orders (buy stops) that people have placed.
Market makers don’t move except to take these stops.
*2- Break of Structure (BOS):*
When price breaks the last important low = the downtrend is continuing.
When it breaks the last important high = the uptrend is continuing.
This is a continuation signal, not a reversal.
*3- Market Structure Shift (MSS) (the most important point):*
When the market is bearish and strongly breaks a bearish swing high = a shift from bearish to bullish.
Here we start looking to buy only.
And the opposite is true.
*The Golden Summary Nobody Ever Tells You:*
Price always takes liquidity before it reverses.
Meaning: it rises above the highs to take buy-side liquidity (Buy Side), then drops and stops out everyone.
Or it falls below the lows to take sell-side liquidity (Sell Side), and then it flies.
*The ZIGZAG Law + ICT:*
Never enter before price sweeps the liquidity (Swept).
Let it sweep, it gives you MSS, then you enter with the banks.
Save the picture—this is the map we’ll be following for the next 10 lessons.
Write in the comments *Done* if you understood the lesson 👇
#ICT #First_Lesson #MarketStructure #BOS #MSS #Liquidity #SmartMoney
*The First Lesson of ICT: Market Structure and Liquidity*
The market has only two languages: *structure and liquidity.*
*1- Highs and Lows (High & Low):*
Every high above it has some stop orders (sell stops) that people will buy/sell into; every low below it has some stop orders (buy stops) that people have placed.
Market makers don’t move except to take these stops.
*2- Break of Structure (BOS):*
When price breaks the last important low = the downtrend is continuing.
When it breaks the last important high = the uptrend is continuing.
This is a continuation signal, not a reversal.
*3- Market Structure Shift (MSS) (the most important point):*
When the market is bearish and strongly breaks a bearish swing high = a shift from bearish to bullish.
Here we start looking to buy only.
And the opposite is true.
*The Golden Summary Nobody Ever Tells You:*
Price always takes liquidity before it reverses.
Meaning: it rises above the highs to take buy-side liquidity (Buy Side), then drops and stops out everyone.
Or it falls below the lows to take sell-side liquidity (Sell Side), and then it flies.
*The ZIGZAG Law + ICT:*
Never enter before price sweeps the liquidity (Swept).
Let it sweep, it gives you MSS, then you enter with the banks.
Save the picture—this is the map we’ll be following for the next 10 lessons.
Write in the comments *Done* if you understood the lesson 👇
#ICT #First_Lesson #MarketStructure #BOS #MSS #Liquidity #SmartMoney
1
90
·
--
If you're ready for the first lesson, do a follow up
---
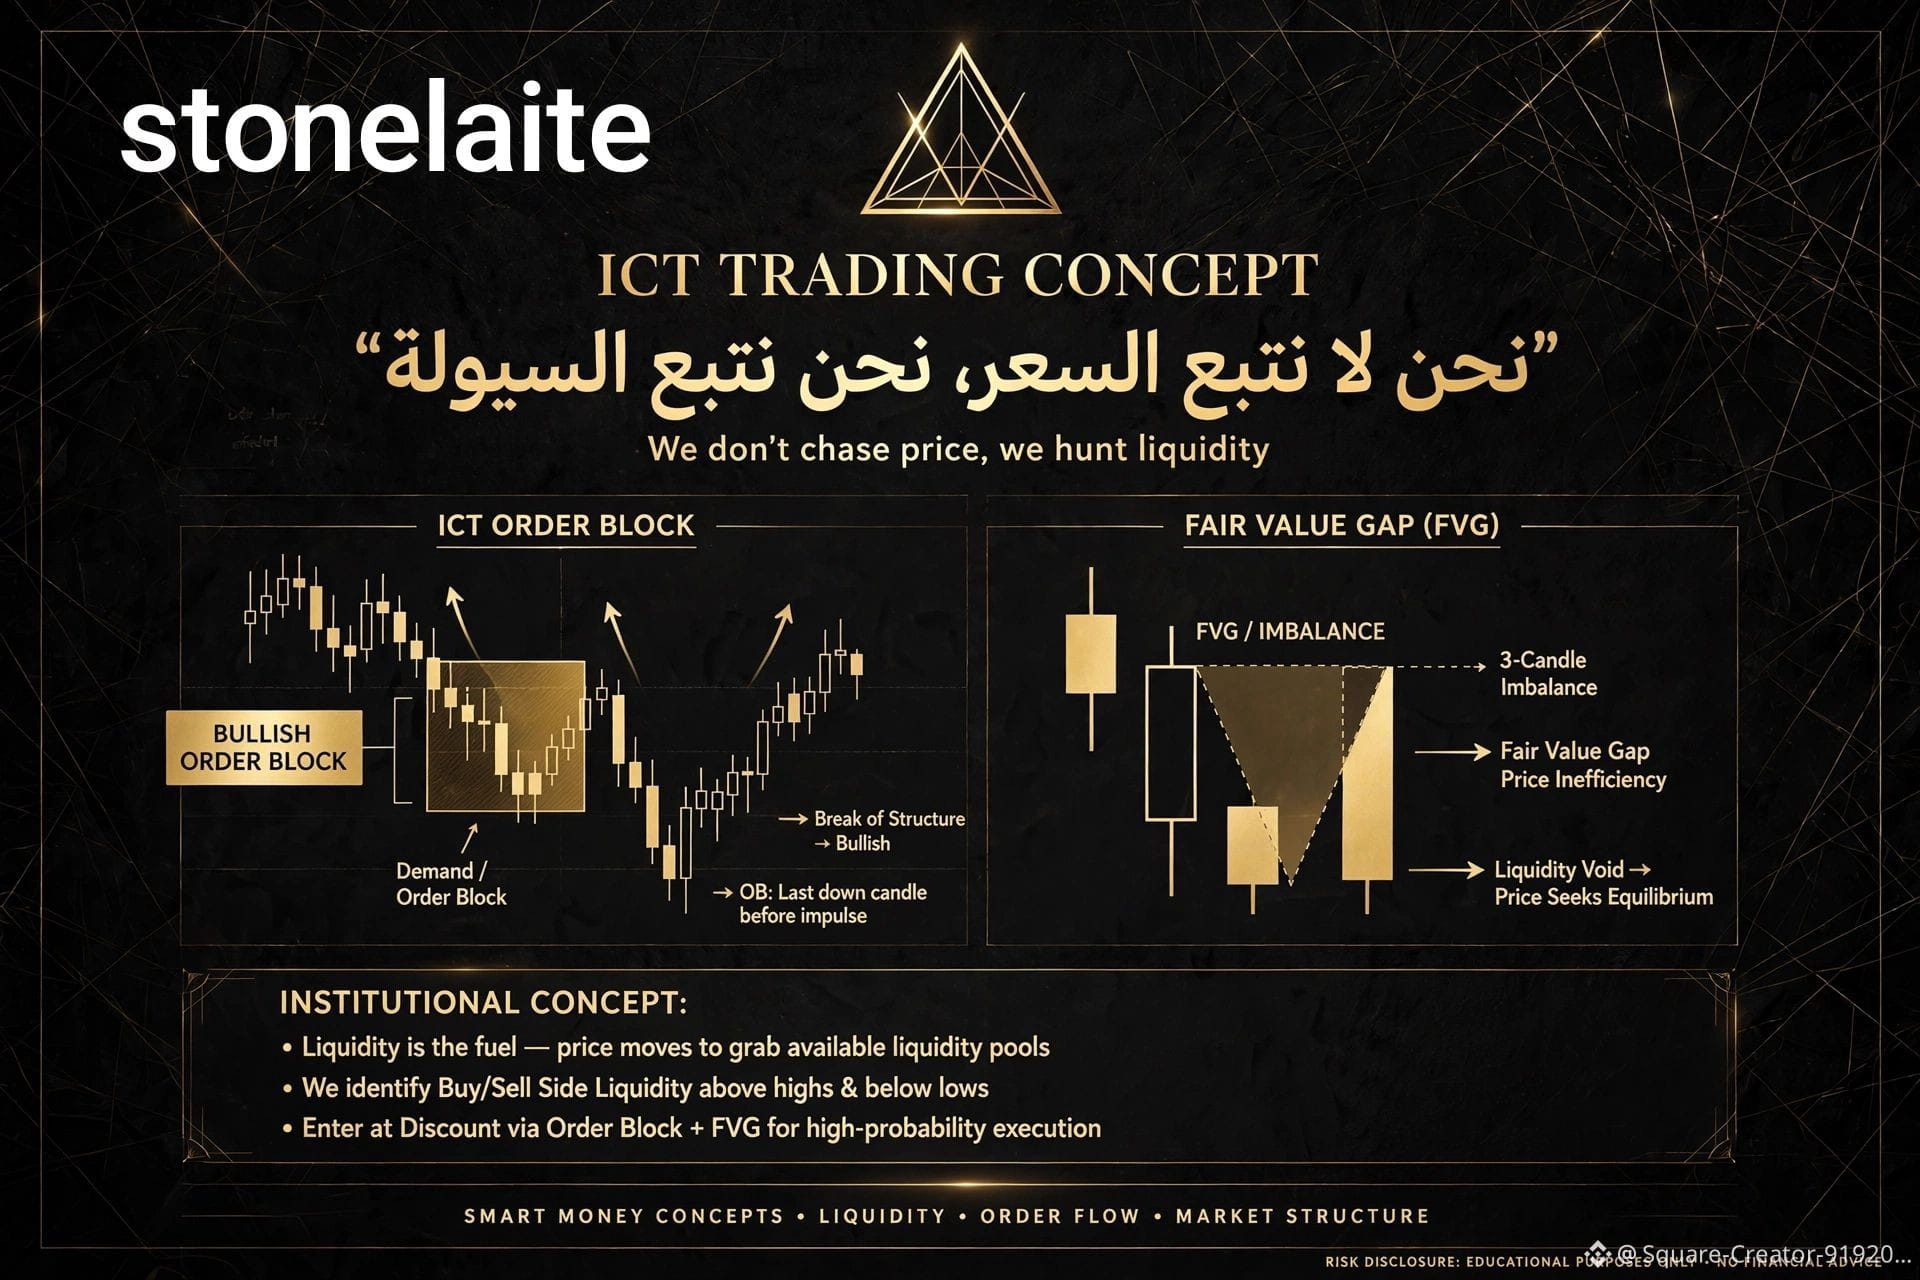
I’m not into indicators; I’m from the ICT school.
We don’t follow price—we follow liquidity.
Everyone sees candlesticks; we see:
- Where the order block that the banks are hiding is
- Where the FVG that price must return to and fill is
- Where the liquidity above the highs and below the lows that the market maker is going to hunt down is
*My simple rule:*
Price moves from liquidity to liquidity.
My job isn’t to predict—my job is to wait for price to reach the Discount zone and enter with the banks, not against them.
If you’re tired of:
❌ Indicators that lag
❌ Recommendations that fool you
❌ Classic analysis that no longer works
Come learn how institutions think.
*Follow me—next I’ll explain:*
1- How to identify the real Order Block (not just any rectangle)
2- How to enter from FVG with confidence
3- How to hunt liquidity before the explosion
This is for whoever wants to understand the game, not for whoever wants a quick signal.
Ready to think like Smart Money? Do a follow up
#ICT #SmartMoney #OrderBlock #FVG #Liquidity #Trading_ #zKzAk_ICT
If you're ready for the first lesson, do a follow up
---
I’m not into indicators; I’m from the ICT school.
We don’t follow price—we follow liquidity.
Everyone sees candlesticks; we see:
- Where the order block that the banks are hiding is
- Where the FVG that price must return to and fill is
- Where the liquidity above the highs and below the lows that the market maker is going to hunt down is
*My simple rule:*
Price moves from liquidity to liquidity.
My job isn’t to predict—my job is to wait for price to reach the Discount zone and enter with the banks, not against them.
If you’re tired of:
❌ Indicators that lag
❌ Recommendations that fool you
❌ Classic analysis that no longer works
Come learn how institutions think.
*Follow me—next I’ll explain:*
1- How to identify the real Order Block (not just any rectangle)
2- How to enter from FVG with confidence
3- How to hunt liquidity before the explosion
This is for whoever wants to understand the game, not for whoever wants a quick signal.
Ready to think like Smart Money? Do a follow up
#ICT #SmartMoney #OrderBlock #FVG #Liquidity #Trading_ #zKzAk_ICT
---
I’m not into indicators; I’m from the ICT school.
We don’t follow price—we follow liquidity.
Everyone sees candlesticks; we see:
- Where the order block that the banks are hiding is
- Where the FVG that price must return to and fill is
- Where the liquidity above the highs and below the lows that the market maker is going to hunt down is
*My simple rule:*
Price moves from liquidity to liquidity.
My job isn’t to predict—my job is to wait for price to reach the Discount zone and enter with the banks, not against them.
If you’re tired of:
❌ Indicators that lag
❌ Recommendations that fool you
❌ Classic analysis that no longer works
Come learn how institutions think.
*Follow me—next I’ll explain:*
1- How to identify the real Order Block (not just any rectangle)
2- How to enter from FVG with confidence
3- How to hunt liquidity before the explosion
This is for whoever wants to understand the game, not for whoever wants a quick signal.
Ready to think like Smart Money? Do a follow up
#ICT #SmartMoney #OrderBlock #FVG #Liquidity #Trading_ #zKzAk_ICT
81
·
--
---
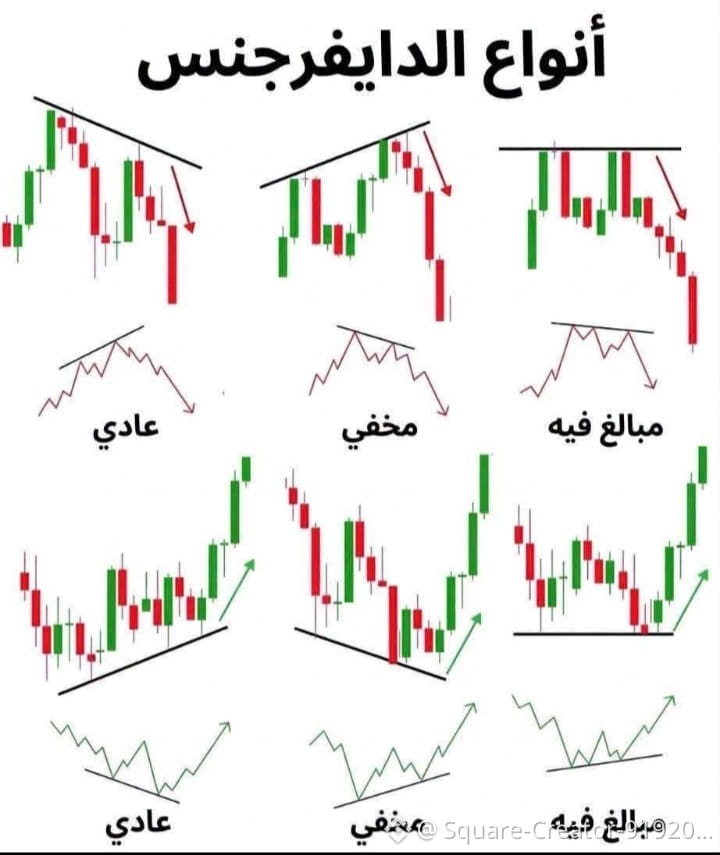
*Divergence made simple — save this post, you’ll need it every day 📚🔥*
90% of traders know divergence incorrectly. The image summarizes all types:
*First: Regular divergence (normal) — a reversal signal 🔄*
- *Sell:* Price makes a higher high, while the indicator (RSI) makes a lower high = weakness in the move upward; it will drop
- *Buy:* Price makes a lower low, while the indicator makes a higher low = weakness in the down move; it will rise
> *Use it when there is a clear ZigZag resistance/support level*
*Second: Hidden divergence (hidden) — a continuation signal 🚀*
- *Downtrend:* Price makes a lower high, the indicator makes a higher high = the downtrend remains intact
- *Uptrend:* Price makes a higher low, the indicator makes a lower low = the uptrend remains intact
> *This is what makes a pro! Don’t reverse the trend—continue with it*
*Third: Exaggerated divergence (exaggerated) — a dumping trap ⚠️*
- Price makes two highs/two lows at roughly the same level, but the indicator is different
> *This is the most dangerous type. It means the whales are distributing while you think the price is stable*
*The Golden ZigZag rule for divergence:*
Don’t trade divergence by itself! It must be:
1- at a clear ZigZag level
2- with a reversal candle
3- on the 1H timeframe and higher (smaller timeframes are all lies)
Save the image and check it before every trade.
*Question: Which type do you use most? Regular or Hidden? Write it below 👇*
#Divergence #RSI #Technical_Analysis #Trading_Education #ZigZag #BinanceSquareTalks
---
*Divergence made simple — save this post, you’ll need it every day 📚🔥*
90% of traders know divergence incorrectly. The image summarizes all types:
*First: Regular divergence (normal) — a reversal signal 🔄*
- *Sell:* Price makes a higher high, while the indicator (RSI) makes a lower high = weakness in the move upward; it will drop
- *Buy:* Price makes a lower low, while the indicator makes a higher low = weakness in the down move; it will rise
> *Use it when there is a clear ZigZag resistance/support level*
*Second: Hidden divergence (hidden) — a continuation signal 🚀*
- *Downtrend:* Price makes a lower high, the indicator makes a higher high = the downtrend remains intact
- *Uptrend:* Price makes a higher low, the indicator makes a lower low = the uptrend remains intact
> *This is what makes a pro! Don’t reverse the trend—continue with it*
*Third: Exaggerated divergence (exaggerated) — a dumping trap ⚠️*
- Price makes two highs/two lows at roughly the same level, but the indicator is different
> *This is the most dangerous type. It means the whales are distributing while you think the price is stable*
*The Golden ZigZag rule for divergence:*
Don’t trade divergence by itself! It must be:
1- at a clear ZigZag level
2- with a reversal candle
3- on the 1H timeframe and higher (smaller timeframes are all lies)
Save the image and check it before every trade.
*Question: Which type do you use most? Regular or Hidden? Write it below 👇*
#Divergence #RSI #Technical_Analysis #Trading_Education #ZigZag #BinanceSquareTalks
*Divergence made simple — save this post, you’ll need it every day 📚🔥*
90% of traders know divergence incorrectly. The image summarizes all types:
*First: Regular divergence (normal) — a reversal signal 🔄*
- *Sell:* Price makes a higher high, while the indicator (RSI) makes a lower high = weakness in the move upward; it will drop
- *Buy:* Price makes a lower low, while the indicator makes a higher low = weakness in the down move; it will rise
> *Use it when there is a clear ZigZag resistance/support level*
*Second: Hidden divergence (hidden) — a continuation signal 🚀*
- *Downtrend:* Price makes a lower high, the indicator makes a higher high = the downtrend remains intact
- *Uptrend:* Price makes a higher low, the indicator makes a lower low = the uptrend remains intact
> *This is what makes a pro! Don’t reverse the trend—continue with it*
*Third: Exaggerated divergence (exaggerated) — a dumping trap ⚠️*
- Price makes two highs/two lows at roughly the same level, but the indicator is different
> *This is the most dangerous type. It means the whales are distributing while you think the price is stable*
*The Golden ZigZag rule for divergence:*
Don’t trade divergence by itself! It must be:
1- at a clear ZigZag level
2- with a reversal candle
3- on the 1H timeframe and higher (smaller timeframes are all lies)
Save the image and check it before every trade.
*Question: Which type do you use most? Regular or Hidden? Write it below 👇*
#Divergence #RSI #Technical_Analysis #Trading_Education #ZigZag #BinanceSquareTalks
1
67

·
--
O God! What kind of explosion is this? ESports took 35% off the bottom
---
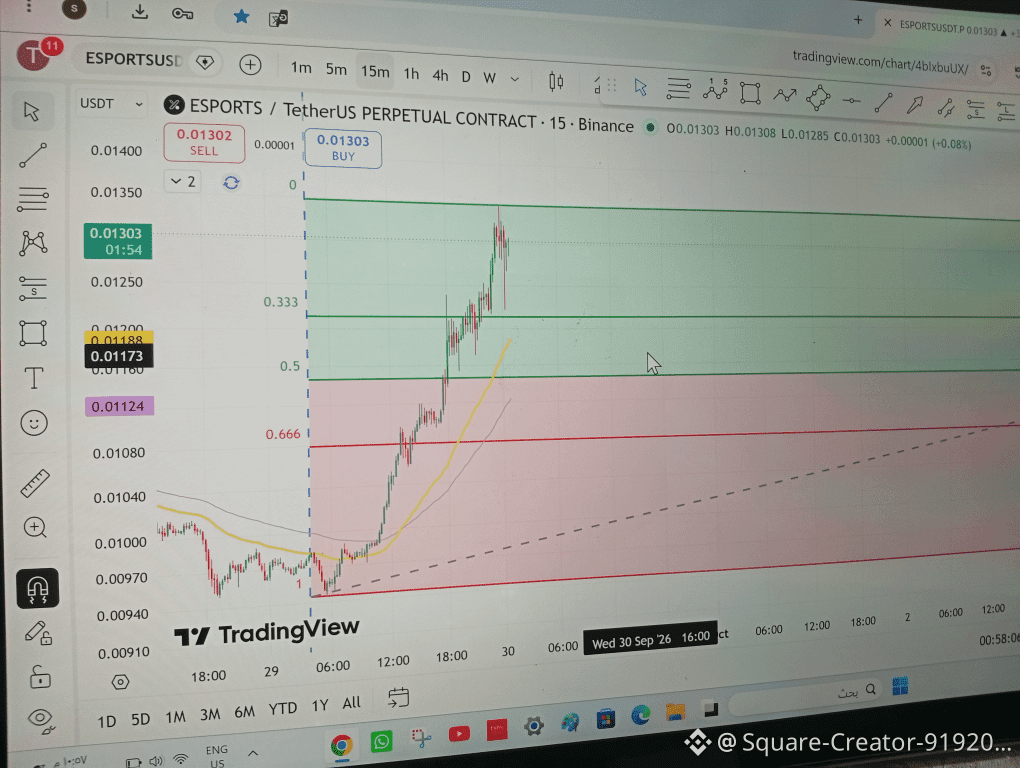
*ESPORTS/USDT explosion — Do we catch the train or is it too late? 🚀*
*What happened on the 15-minute chart:*
The price jumped from 0.00940 to 0.01350 in less than 24 hours!
From 1 Fibonacci to above 0.333 — meaning it broke all resistances.
*My quick analysis:*
📍 Current price 0.01304 inside a strong sell zone (the green zone is 0.333)
📈 The moving averages (yellow and purple) are still below — meaning the uptrend is strong and not finished yet
⚠️ But be careful: the candles became long and nervous at the top — this is a distribution zone, not an entry point
*My plan (zigzag):*
❌ I’m not entering now out of FOMO — anyone who entered from below, congratulations
✅ I’m waiting for a retest:
- First entry: 0.01200 (level 0.333)
- Second strong entry: 0.01150 (level 0.5)
🎯 Target if it holds above 0.01350: 0.01450
🛑 Stop: 0.01100
*The golden rule:* A coin that jumps 30% in one day must give a 50% correction of the move. Patience brings a better price.
Who caught the pump from below? Tell us how much you made 👇
#ESPORTS #ESPORTSUSDT #technical_analysis #عملات_جديدة
O God! What kind of explosion is this? ESports took 35% off the bottom
---
*ESPORTS/USDT explosion — Do we catch the train or is it too late? 🚀*
*What happened on the 15-minute chart:*
The price jumped from 0.00940 to 0.01350 in less than 24 hours!
From 1 Fibonacci to above 0.333 — meaning it broke all resistances.
*My quick analysis:*
📍 Current price 0.01304 inside a strong sell zone (the green zone is 0.333)
📈 The moving averages (yellow and purple) are still below — meaning the uptrend is strong and not finished yet
⚠️ But be careful: the candles became long and nervous at the top — this is a distribution zone, not an entry point
*My plan (zigzag):*
❌ I’m not entering now out of FOMO — anyone who entered from below, congratulations
✅ I’m waiting for a retest:
- First entry: 0.01200 (level 0.333)
- Second strong entry: 0.01150 (level 0.5)
🎯 Target if it holds above 0.01350: 0.01450
🛑 Stop: 0.01100
*The golden rule:* A coin that jumps 30% in one day must give a 50% correction of the move. Patience brings a better price.
Who caught the pump from below? Tell us how much you made 👇
#ESPORTS #ESPORTSUSDT #technical_analysis #عملات_جديدة
---
*ESPORTS/USDT explosion — Do we catch the train or is it too late? 🚀*
*What happened on the 15-minute chart:*
The price jumped from 0.00940 to 0.01350 in less than 24 hours!
From 1 Fibonacci to above 0.333 — meaning it broke all resistances.
*My quick analysis:*
📍 Current price 0.01304 inside a strong sell zone (the green zone is 0.333)
📈 The moving averages (yellow and purple) are still below — meaning the uptrend is strong and not finished yet
⚠️ But be careful: the candles became long and nervous at the top — this is a distribution zone, not an entry point
*My plan (zigzag):*
❌ I’m not entering now out of FOMO — anyone who entered from below, congratulations
✅ I’m waiting for a retest:
- First entry: 0.01200 (level 0.333)
- Second strong entry: 0.01150 (level 0.5)
🎯 Target if it holds above 0.01350: 0.01450
🛑 Stop: 0.01100
*The golden rule:* A coin that jumps 30% in one day must give a 50% correction of the move. Patience brings a better price.
Who caught the pump from below? Tell us how much you made 👇
#ESPORTS #ESPORTSUSDT #technical_analysis #عملات_جديدة
309
·
--
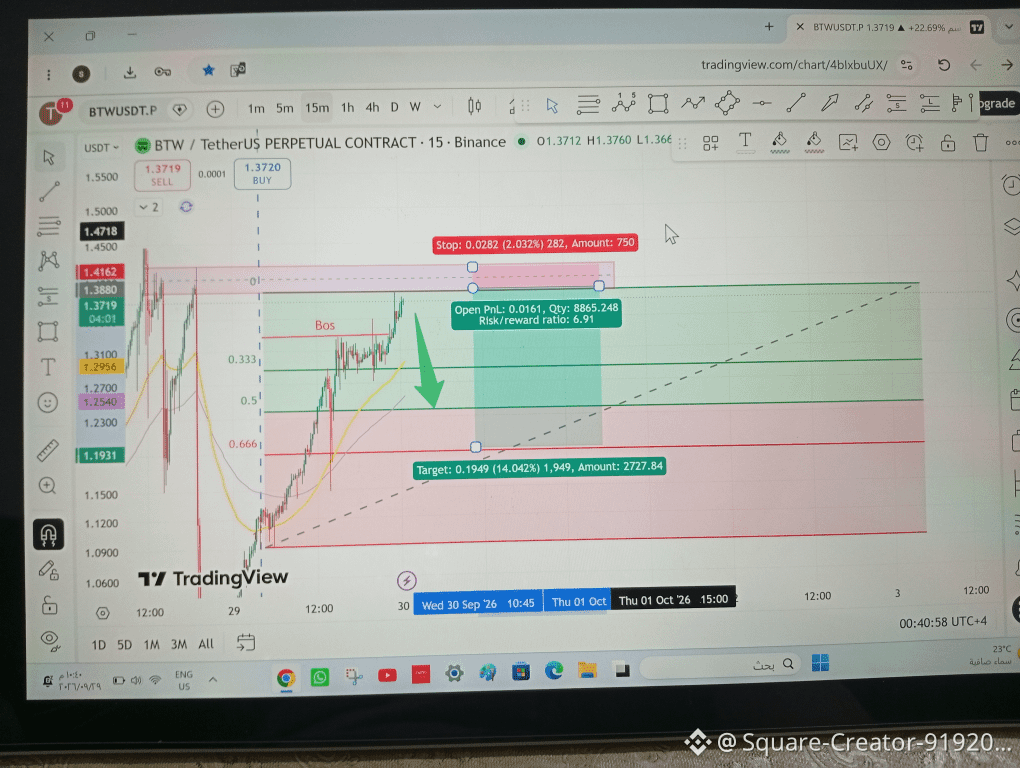
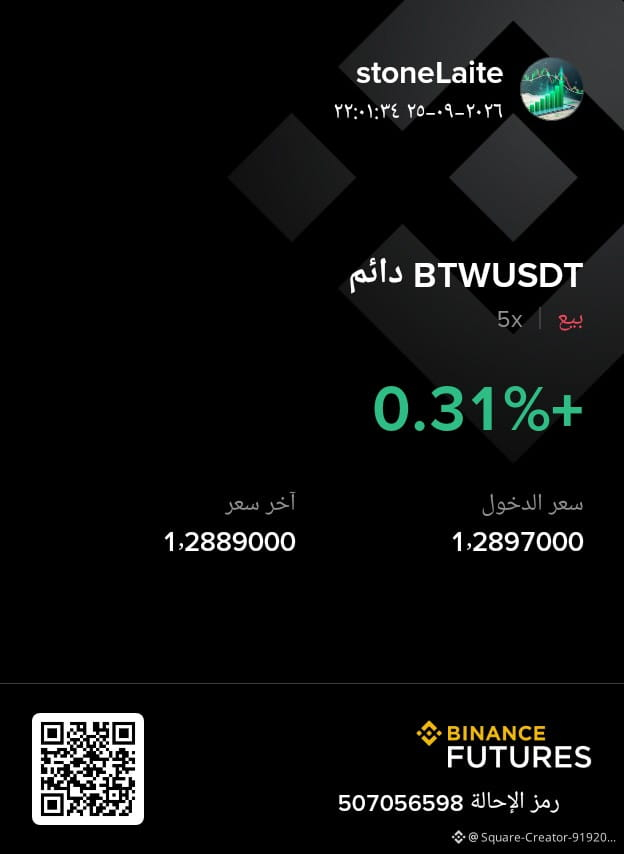
Live now with btw
Wait without rushing
Maybe a regular sell deal
The price is now at the highest peak of the daily timeframe
Whoever reads, give us your ideas 😊
Live now with btw
Wait without rushing
Maybe a regular sell deal
The price is now at the highest peak of the daily timeframe
Whoever reads, give us your ideas 😊
Wait without rushing
Maybe a regular sell deal
The price is now at the highest peak of the daily timeframe
Whoever reads, give us your ideas 😊
407
·
--
🎁🎁
90% of your loss is caused by boredom, not the market.
I have 3 rules that I never break:
*1- The Level Rule:* If the price is far from a clear zigzag level, I don’t enter. Even if it moves 100%.
*2- The 2 Rule:* Only 2 trades per day. You won? Close the laptop. You lost? Also close the laptop.
*3- No charting after 11 PM:* After 11, your mind is tired and you’ll start seeing fake opportunities.
Since I applied these rules, my account stopped bleeding.
Trading isn’t about making lots of trades—trading is waiting.
*What rule have you set for yourself and never break? Write it below so we can all benefit from each other.*$
🎁🎁
90% of your loss is caused by boredom, not the market.
I have 3 rules that I never break:
*1- The Level Rule:* If the price is far from a clear zigzag level, I don’t enter. Even if it moves 100%.
*2- The 2 Rule:* Only 2 trades per day. You won? Close the laptop. You lost? Also close the laptop.
*3- No charting after 11 PM:* After 11, your mind is tired and you’ll start seeing fake opportunities.
Since I applied these rules, my account stopped bleeding.
Trading isn’t about making lots of trades—trading is waiting.
*What rule have you set for yourself and never break? Write it below so we can all benefit from each other.*$
90% of your loss is caused by boredom, not the market.
I have 3 rules that I never break:
*1- The Level Rule:* If the price is far from a clear zigzag level, I don’t enter. Even if it moves 100%.
*2- The 2 Rule:* Only 2 trades per day. You won? Close the laptop. You lost? Also close the laptop.
*3- No charting after 11 PM:* After 11, your mind is tired and you’ll start seeing fake opportunities.
Since I applied these rules, my account stopped bleeding.
Trading isn’t about making lots of trades—trading is waiting.
*What rule have you set for yourself and never break? Write it below so we can all benefit from each other.*$
26
1
41
21.6k

·
--
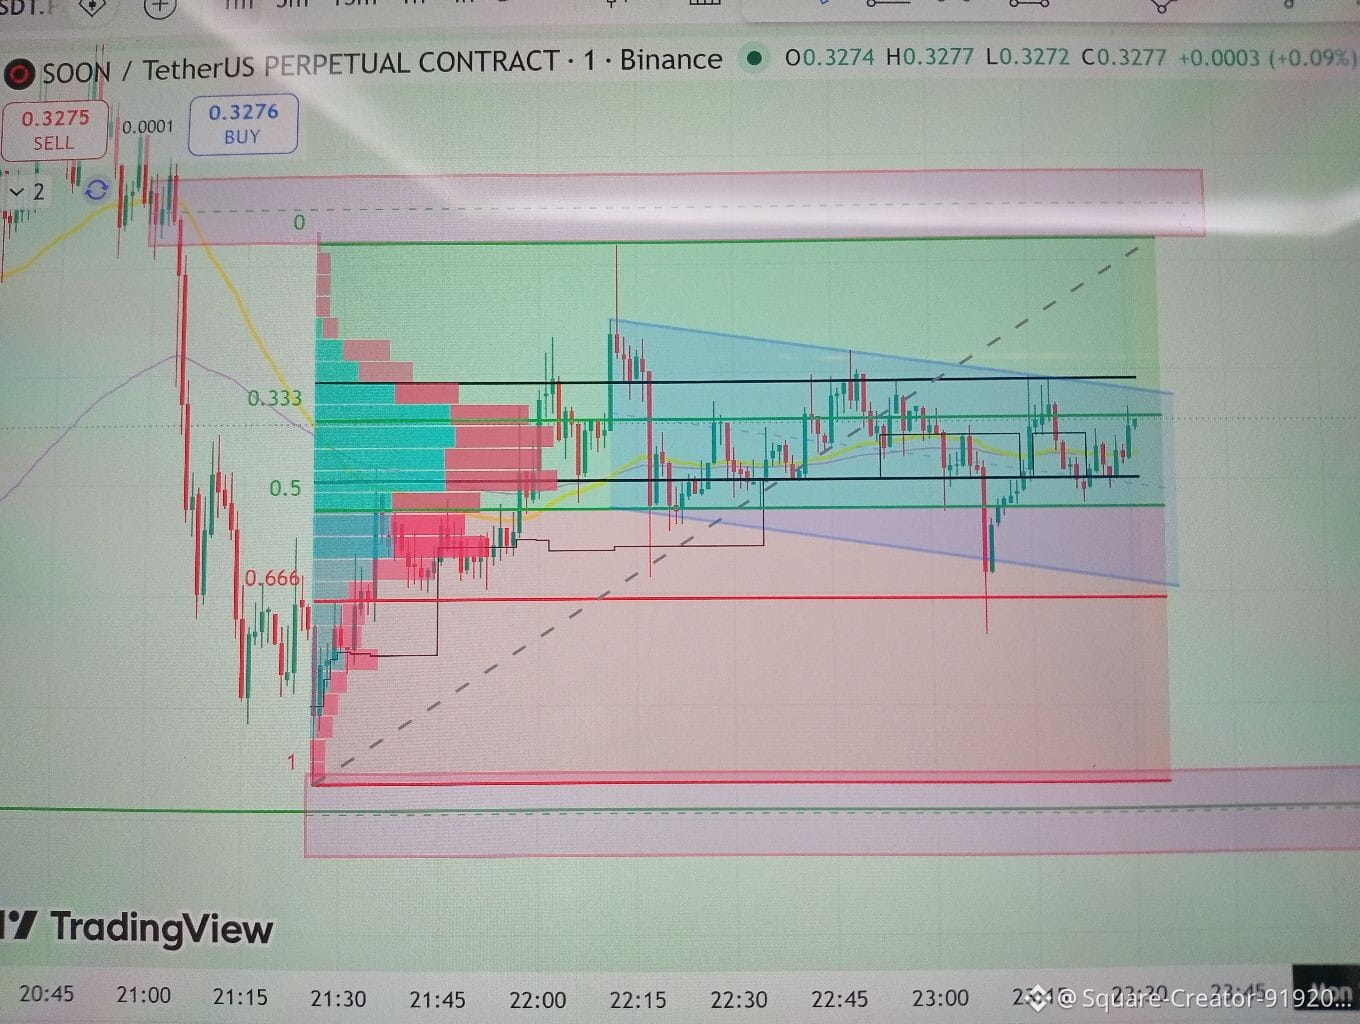
I saw the chart - SOON, a golden shot for the post is coming! 🔥
The price is squeezed and the setup is clearly visible. This is the post ready for this image:
--- $soon
*Title:* SOON / USDT -
*Content:*
Guys, take a look at SOON on the 1-minute frame — a classic scenario
*What do you see on the chart?*
📊 Current price: 0.3277
📦 Strong accumulation zone between 0.3290 and 0.3320 (big blue profile there)
📐 A tight descending triangle — the price is compressed against the other side
📉 Fibonacci retracement 0.5 is masking the price — this is the strongest support right now
*My plan:*
✅ Break and close above 0.3330 = direct entry — first target 0.3370 and second target 0.3420
❌ Break below 0.3260 = we cancel the move up and wait at 0.3220
⚠️ Stop loss: 0.3245
Liquidity has gathered above, and the market maker has to take it. Patience is the key to profit.
Do you think it’s going up, or still in the final dip? 🎁🎁💰
I saw the chart - SOON, a golden shot for the post is coming! 🔥
The price is squeezed and the setup is clearly visible. This is the post ready for this image:
--- $soon
*Title:* SOON / USDT -
*Content:*
Guys, take a look at SOON on the 1-minute frame — a classic scenario
*What do you see on the chart?*
📊 Current price: 0.3277
📦 Strong accumulation zone between 0.3290 and 0.3320 (big blue profile there)
📐 A tight descending triangle — the price is compressed against the other side
📉 Fibonacci retracement 0.5 is masking the price — this is the strongest support right now
*My plan:*
✅ Break and close above 0.3330 = direct entry — first target 0.3370 and second target 0.3420
❌ Break below 0.3260 = we cancel the move up and wait at 0.3220
⚠️ Stop loss: 0.3245
Liquidity has gathered above, and the market maker has to take it. Patience is the key to profit.
Do you think it’s going up, or still in the final dip? 🎁🎁💰
The price is squeezed and the setup is clearly visible. This is the post ready for this image:
--- $soon
*Title:* SOON / USDT -
*Content:*
Guys, take a look at SOON on the 1-minute frame — a classic scenario
*What do you see on the chart?*
📊 Current price: 0.3277
📦 Strong accumulation zone between 0.3290 and 0.3320 (big blue profile there)
📐 A tight descending triangle — the price is compressed against the other side
📉 Fibonacci retracement 0.5 is masking the price — this is the strongest support right now
*My plan:*
✅ Break and close above 0.3330 = direct entry — first target 0.3370 and second target 0.3420
❌ Break below 0.3260 = we cancel the move up and wait at 0.3220
⚠️ Stop loss: 0.3245
Liquidity has gathered above, and the market maker has to take it. Patience is the key to profit.
Do you think it’s going up, or still in the final dip? 🎁🎁💰
128
·
--
Today's Post -
---
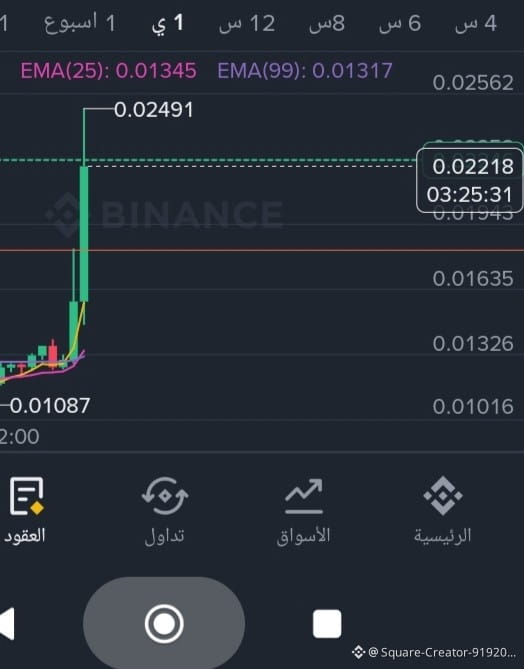
*Title:* Don’t buy the long green candle! ⚠️
*Content:*
The biggest trap for beginners:
You see a big green candle +10% and it enters quickly... then it drops -15% and gets stuck.
*The ZigZag solution:*
1. Any long candle should be far from the last ZigZag level = don’t enter
2. Wait for the price to return and touch a nearby ZigZag level + a small reversal candle
3. Enter and place your stop loss below the level
Today the whole market is green—don’t be the liquidity for someone else.
#Trading #Tip_of_the_Day #ZigZag #Bitcoin #Technical_Analysis
---
Today's Post -
---
*Title:* Don’t buy the long green candle! ⚠️
*Content:*
The biggest trap for beginners:
You see a big green candle +10% and it enters quickly... then it drops -15% and gets stuck.
*The ZigZag solution:*
1. Any long candle should be far from the last ZigZag level = don’t enter
2. Wait for the price to return and touch a nearby ZigZag level + a small reversal candle
3. Enter and place your stop loss below the level
Today the whole market is green—don’t be the liquidity for someone else.
#Trading #Tip_of_the_Day #ZigZag #Bitcoin #Technical_Analysis
---
---
*Title:* Don’t buy the long green candle! ⚠️
*Content:*
The biggest trap for beginners:
You see a big green candle +10% and it enters quickly... then it drops -15% and gets stuck.
*The ZigZag solution:*
1. Any long candle should be far from the last ZigZag level = don’t enter
2. Wait for the price to return and touch a nearby ZigZag level + a small reversal candle
3. Enter and place your stop loss below the level
Today the whole market is green—don’t be the liquidity for someone else.
#Trading #Tip_of_the_Day #ZigZag #Bitcoin #Technical_Analysis
---
218
·
--
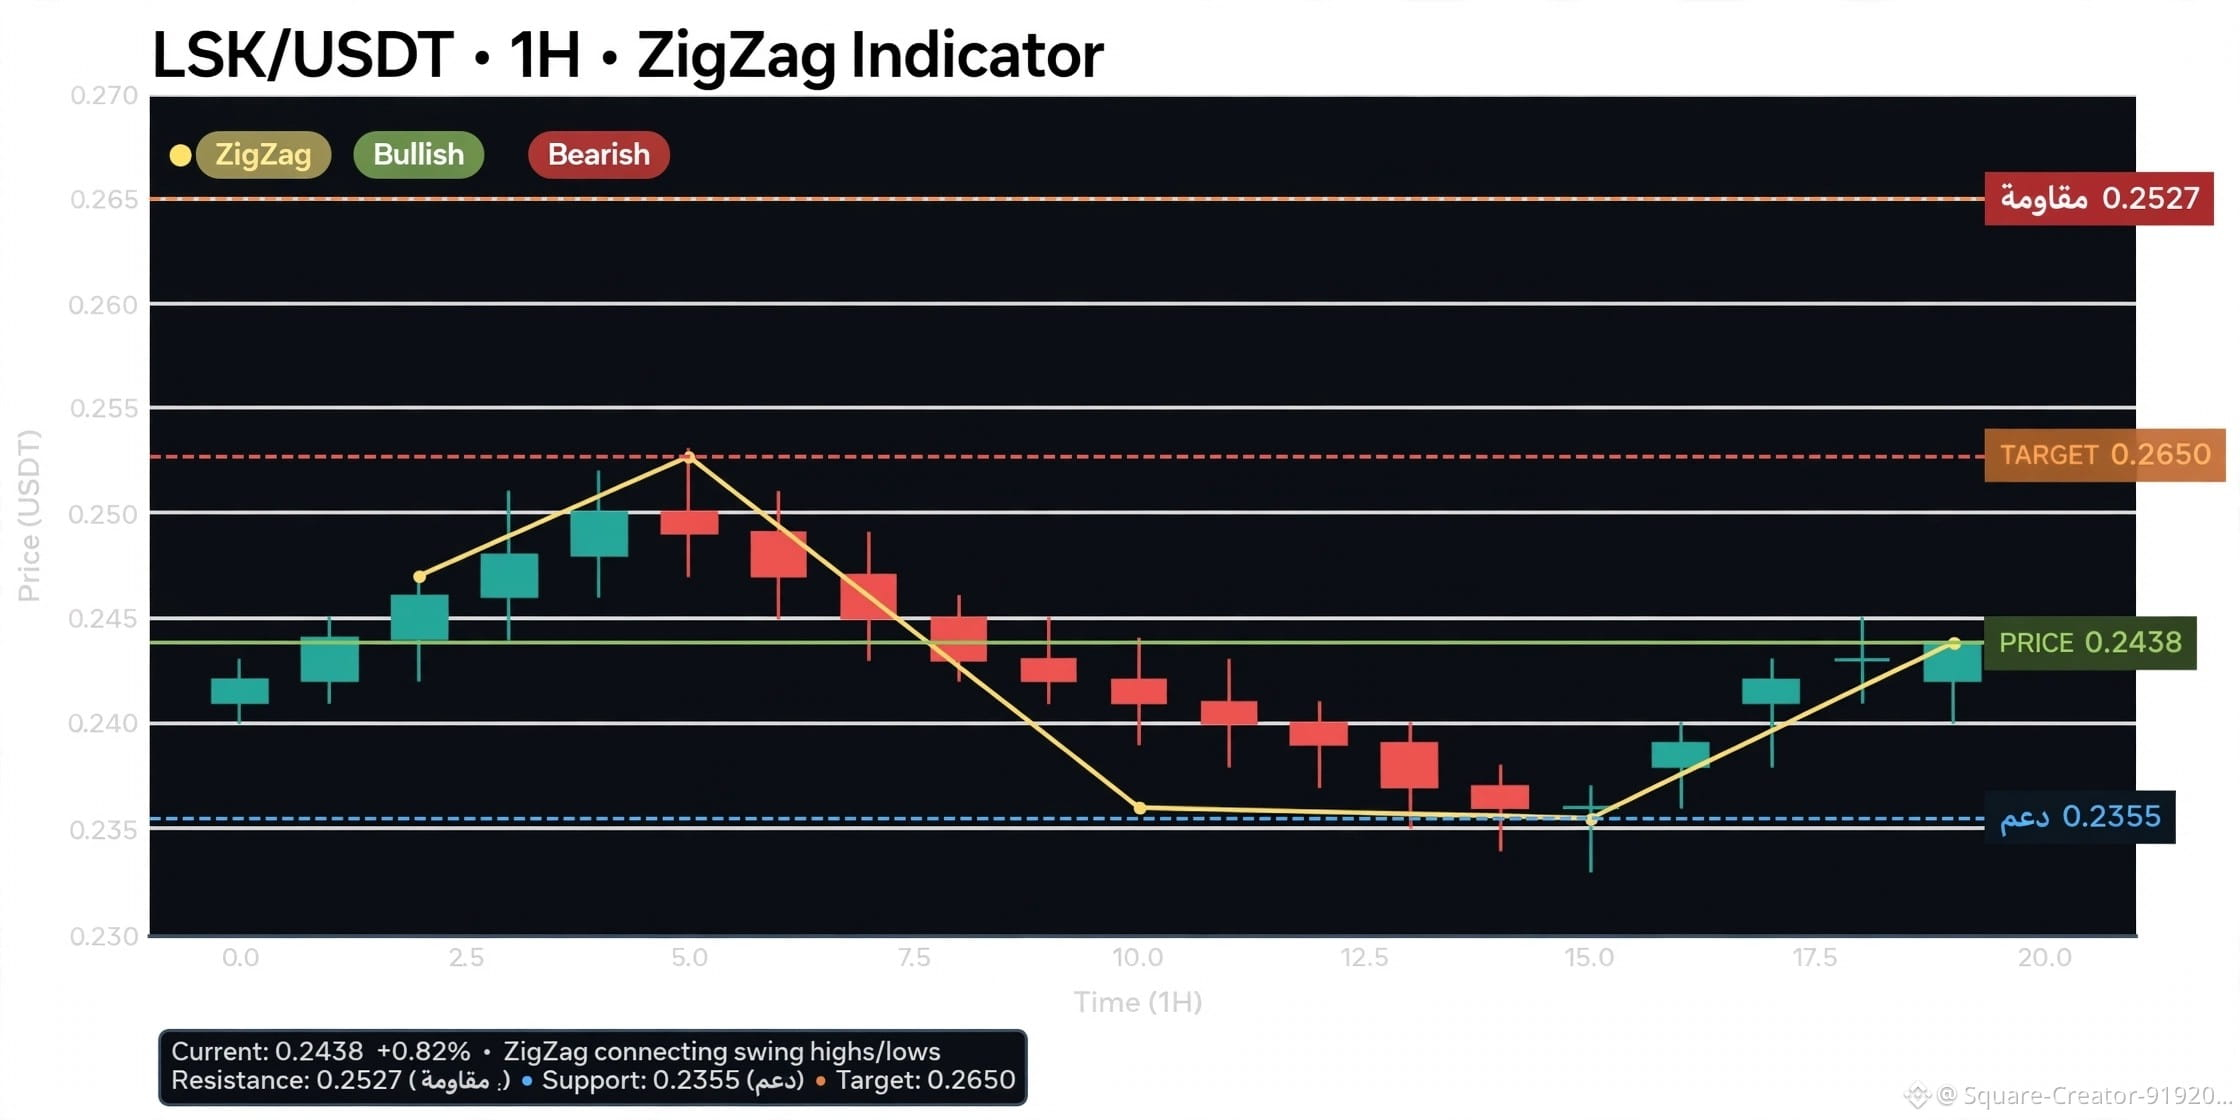
Before, I used to enter randomly—I'd see the coin flying, rush to catch it for $$ , and it would just stick.
When I learned how to draw the zigzag levels, I started waiting for the price to return to the blue level and then I would enter.
Example last week: I didn’t enter LSK at 0.25. I waited for it to return to 0.2355, then entered and took profit.
Patience is the profit.
What’s the biggest mistake you made in trading? Tell me
🎁🎁🎁
Before, I used to enter randomly—I'd see the coin flying, rush to catch it for $$ , and it would just stick.
When I learned how to draw the zigzag levels, I started waiting for the price to return to the blue level and then I would enter.
Example last week: I didn’t enter LSK at 0.25. I waited for it to return to 0.2355, then entered and took profit.
Patience is the profit.
What’s the biggest mistake you made in trading? Tell me
🎁🎁🎁
When I learned how to draw the zigzag levels, I started waiting for the price to return to the blue level and then I would enter.
Example last week: I didn’t enter LSK at 0.25. I waited for it to return to 0.2355, then entered and took profit.
Patience is the profit.
What’s the biggest mistake you made in trading? Tell me
🎁🎁🎁
3
6
4.6k
·
--
720
·
--
*Title:* Why do 90% lose? Because they don't know ZigZag!
*Content:*
ZigZag is not a magic indicator; it's a glasses that removes noise from the chart.
A golden rule in my life:
🔴 Old red level + RSI above 70 = sell
🔵 Old blue level + RSI below 30 = buy
Try it on any coin and see.
Are you using ZigZag or not yet?
@Binance_Academy
🤑🎁🎁🎁
*Title:* Why do 90% lose? Because they don't know ZigZag!
*Content:*
ZigZag is not a magic indicator; it's a glasses that removes noise from the chart.
A golden rule in my life:
🔴 Old red level + RSI above 70 = sell
🔵 Old blue level + RSI below 30 = buy
Try it on any coin and see.
Are you using ZigZag or not yet?
@Binance Academy
🤑🎁🎁🎁
*Content:*
ZigZag is not a magic indicator; it's a glasses that removes noise from the chart.
A golden rule in my life:
🔴 Old red level + RSI above 70 = sell
🔵 Old blue level + RSI below 30 = buy
Try it on any coin and see.
Are you using ZigZag or not yet?
@Binance Academy
🤑🎁🎁🎁
1
2
2.9k
Log in to explore more content
Join global crypto users on Binance Square
⚡️ Get latest and useful information about crypto.
💬 Trusted by the world’s largest crypto exchange.
👍 Discover real insights from verified creators.
Email / Phone number
Trending Topics
BinanceLaunchesBinanceIntelligence
825,712 views
5,131 Discussing
🚀 BINANCE IS PUSHING AI DEEPER INTO FINANCE
Binance Intelligence brings together three products aimed at different users — everyday traders, advanced users and developers.
For traders, the interesting part is simple:
More data → better analysis → faster decisions.
Now the real question:
Can AI actually give retail traders an edge? 👀
$BNB $BTC $ETH
#binancelaunchesbinanceintelligence
CryptoMahibaloch
·0 Likes
·130 views
RobinhoodAdds$25MInBitcoinToBalanceSheet
0 views
0 Discussing
SP500AndNasdaqHitRecordHighs
0 views
19 Discussing