---
90% of people think that Zigzag is a ZigZag indicator that draws blue lines.
No, my friend—my Zigzag is a complete methodology.
The zigzag =
*wave structure + Fibonacci + ICT liquidity + Elliott waves*
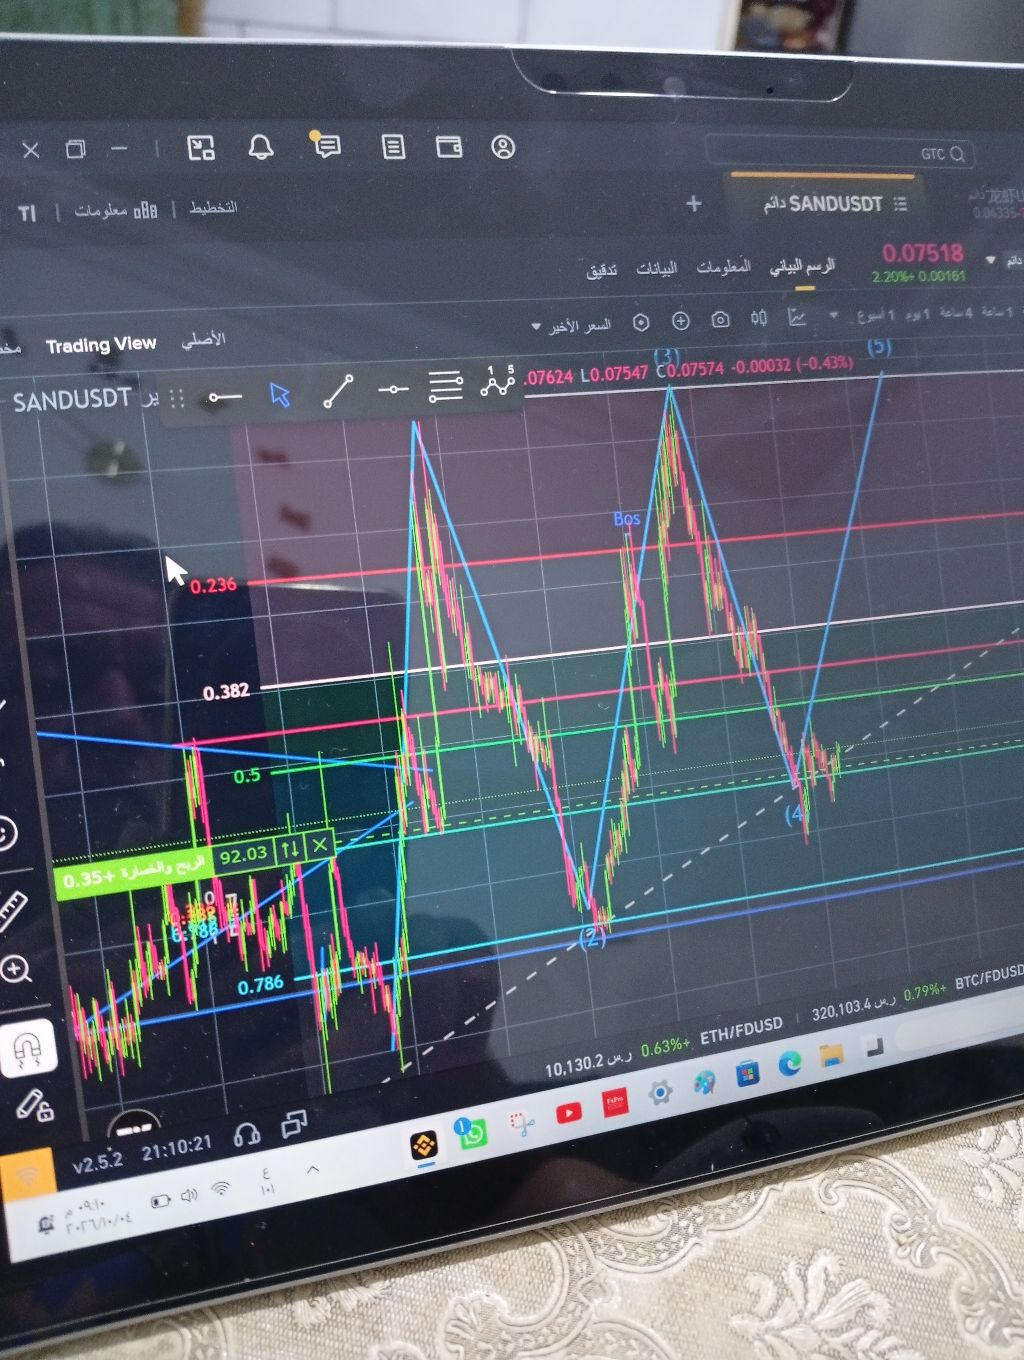
As you can see in the SANDUSDT chart that I drew:
1- The blue structure (zigzag):
It’s what defines the real wave for me, removes noise and fake candles. Every blue line is a wave. I only enter at the end of a wave and the beginning of a new one.
2- Elliott Waves (2), (3), (4), (5):
It’s clear in your image:
- Wave (2) is the strong correction that moved down
- Wave (3) is the explosive move you see above (the strongest wave)
- Wave (4) is the current correction, where we are now at 0.5
This system helps me know exactly where we are: are we at the start of an upswing or near the end?
3- The Golden Fibonacci:
Do you see the 0.236, 0.382, 0.5, and 0.786 levels?
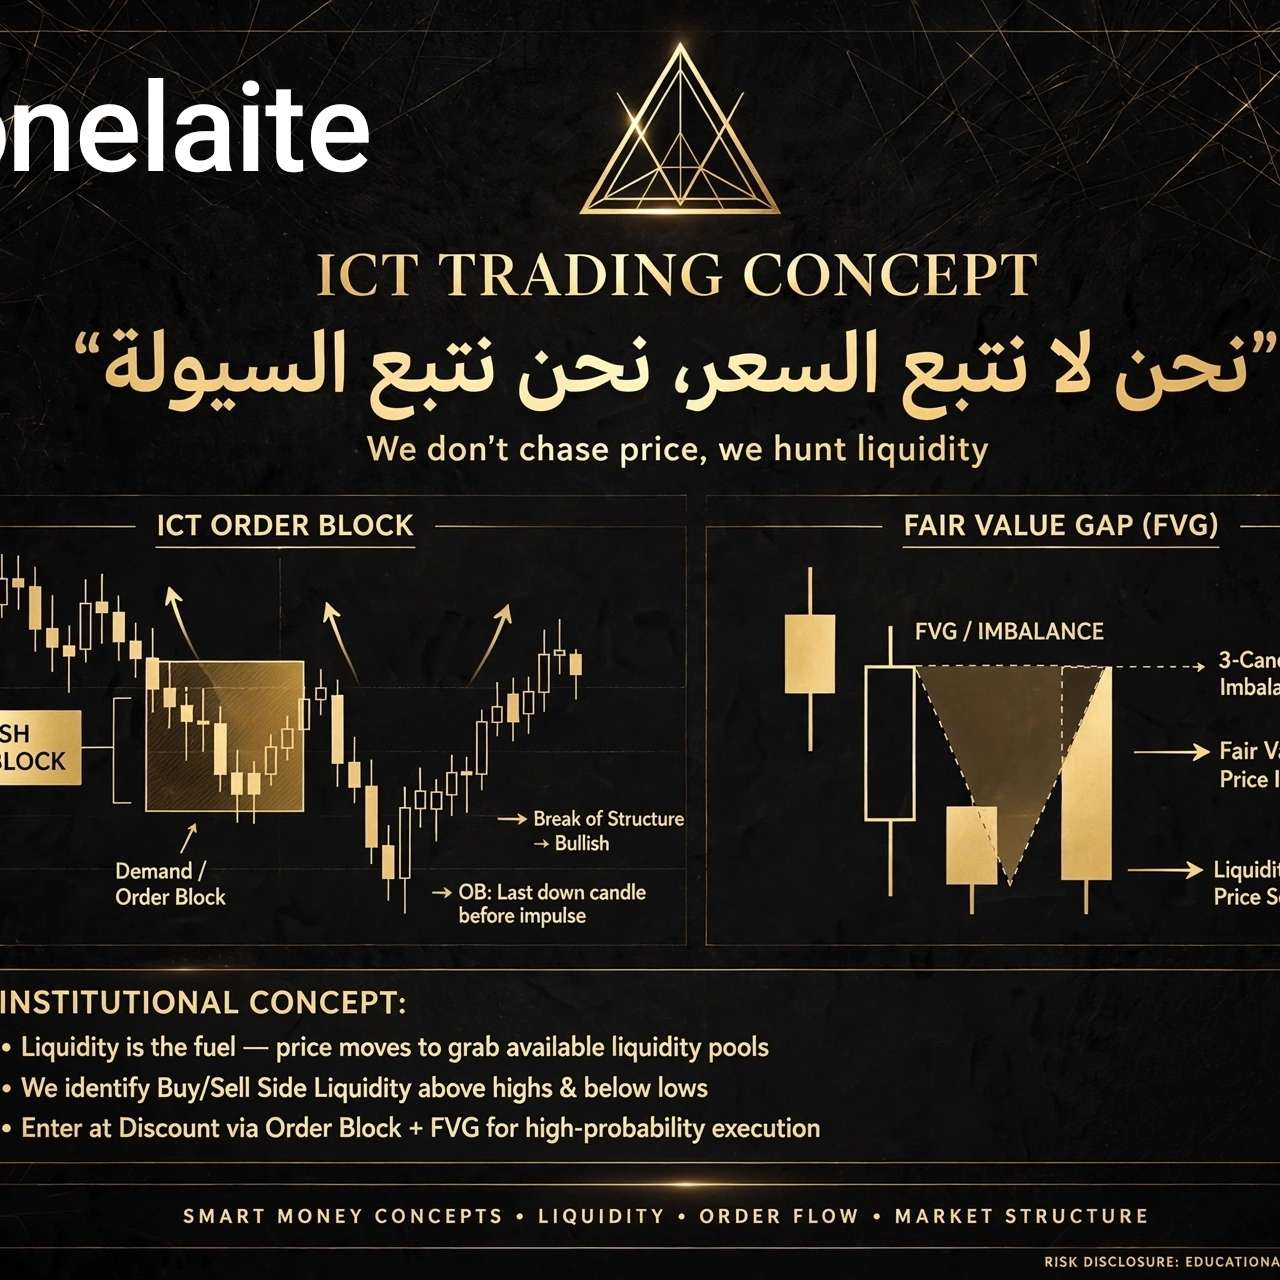
These aren’t random numbers; these are the discount zones we talked about in ICT.
- When price retraces to 0.5–0.618 = a golden buying zone
- When it retraces to 0.236–0.382 = a selling zone
In your image, price bounced to the millimeter from the green 0.5 zone and respected it. Why? Because it’s an institutional demand zone.
4- An ICT touch: BOS
Do you see the word BOS above the peak? Break of Structure.
My zigzag isn’t complete until the structure breaks. If it doesn’t break the previous peak, the wave has failed, and I don’t enter.
The final mix (the Zigzag Strategy):
1. Draw the blue zigzag to identify the larger waves
2. Number the Elliott waves so I know whether I’m in wave 3 (go in aggressively) or wave 5 (watch for a reversal)
3. Draw Fibonacci from the start of the wave to its end
4. Wait for price to return to the 0.5–0.786 zone + for there to be an Order Block or FVG
5. Enter with a stop below wave (2) and a target at the peak of wave (3) or (5)
A live example from the SANDUSDT image:
Price is now in a corrective wave (4), sitting at the 0.5 level + the lower blue trendline. This is a textbook ICT buy setup if an MSS candle appears on the 15-minute timeframe. Your target is the BOS above at 0.07574.
The zigzag isn’t an indicator; it’s a way of thinking like the pros...
Follow me for lesson three