

نبض_الشارت
83 Posts

نبض_الشارت
Report
Block User
محلل ومتداول فوري. أشارك استراتيجيات التداول الذكي وإدارة المخاطر واقتناص الفرص عند نقاط الدعم بدون تعقيد.
109 Following
113 Followers
102 Liked
Posts
All
Quotes
·
--
Article
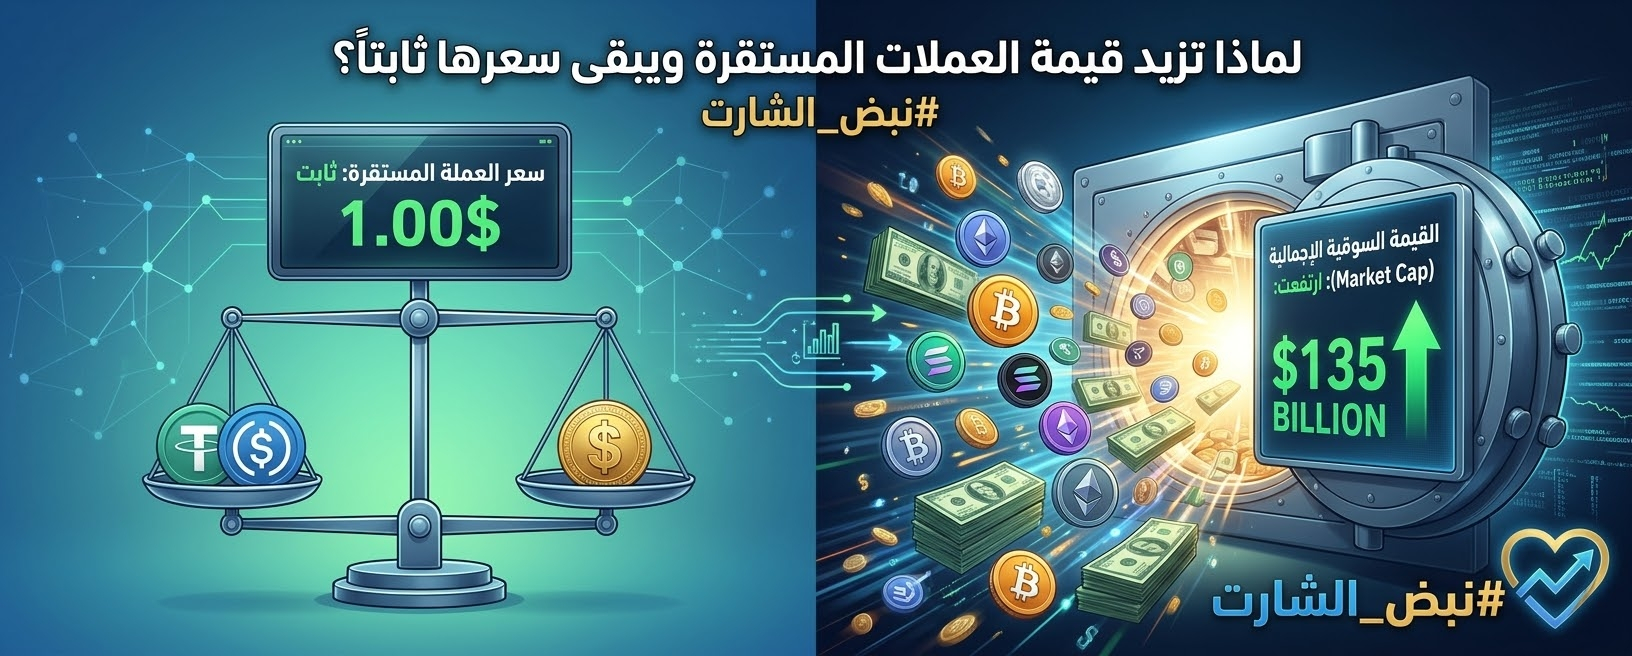
Stablecoins (USDT/USDC): Why Does Their Total Value Increase While Their Price Stays Fixed at One Dollar?Good morning, everyone. I hope you’re all doing well.
One of the most common questions among beginners in the crypto world is: "If people buy stablecoins like USDT or USDC worth millions of dollars every day, and their market value increases, why doesn’t their price rise to $2 or $5 like other coins? And why does their price always remain pegged to one dollar?"
Stablecoins (USDT/USDC): Why Does Their Total Value Increase While Their Price Stays Fixed at One Dollar?
Good morning, everyone. I hope you’re all doing well.
One of the most common questions among beginners in the crypto world is: "If people buy stablecoins like USDT or USDC worth millions of dollars every day, and their market value increases, why doesn’t their price rise to $2 or $5 like other coins? And why does their price always remain pegged to one dollar?"
One of the most common questions among beginners in the crypto world is: "If people buy stablecoins like USDT or USDC worth millions of dollars every day, and their market value increases, why doesn’t their price rise to $2 or $5 like other coins? And why does their price always remain pegged to one dollar?"
1
199
·
--
Article
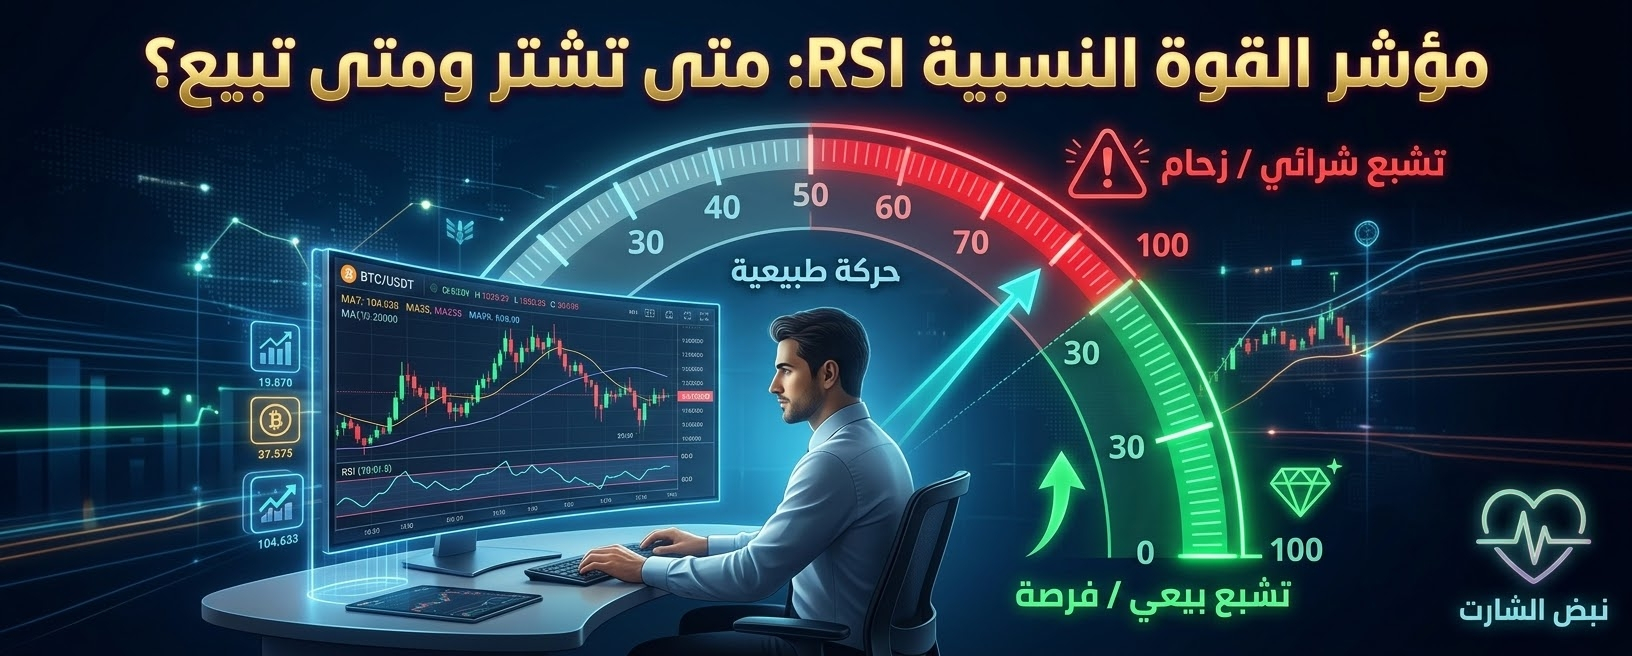
Relative Strength Index (RSI): Your simple compass for knowing when a currency is “too expensive” or “too cheap”Good morning, everyone. Hope you're all doing great.
Many beginners feel dizzy as soon as they open a chart and see all those lines and complicated indicators at the bottom! Today, we'll simplify one of the most important and widely used indicators: the Relative Strength Index (RSI).
To understand the idea without the geometric complexity, imagine this simple example from our daily lives:
Relative Strength Index (RSI): Your simple compass for knowing when a currency is “too expensive” or “too cheap”
Good morning, everyone. Hope you're all doing great.
Many beginners feel dizzy as soon as they open a chart and see all those lines and complicated indicators at the bottom! Today, we'll simplify one of the most important and widely used indicators: the Relative Strength Index (RSI).
To understand the idea without the geometric complexity, imagine this simple example from our daily lives:
1
93
·
--
Article
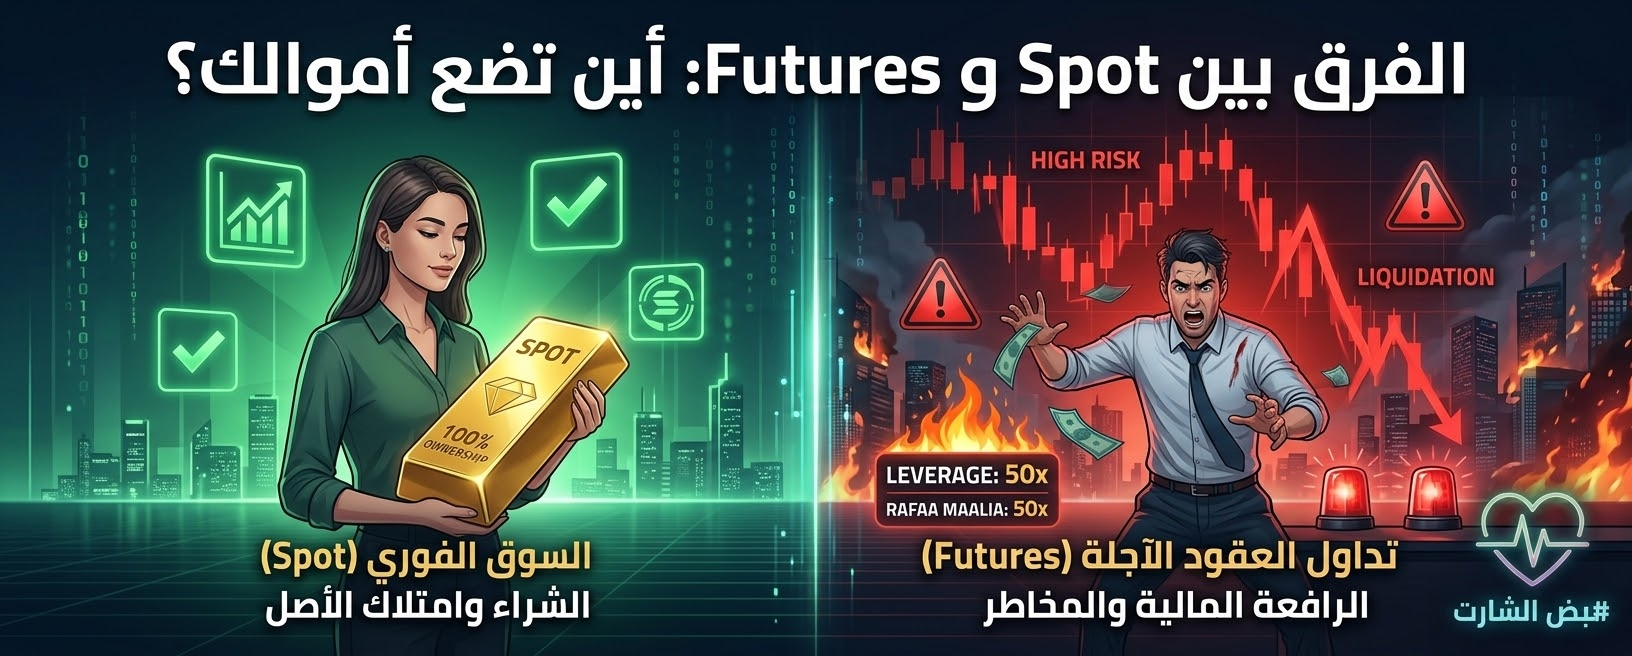
The Difference Between Spot Trades and Futures Trading: When Are You Fishing with Your Own Money, and When Are You Playing with Fire?How are you guys? Hope you’re all doing great.
When many beginners first enter the world of crypto, their eyes light up at the prospect of quick profits. They hear the word “Futures” and jump in with their capital without even understanding the difference between futures trading and spot trading. To make the idea easier to grasp, let me share this simple example from everyday life:
The Difference Between Spot Trades and Futures Trading: When Are You Fishing with Your Own Money, and When Are You Playing with Fire?
How are you guys? Hope you’re all doing great.
When many beginners first enter the world of crypto, their eyes light up at the prospect of quick profits. They hear the word “Futures” and jump in with their capital without even understanding the difference between futures trading and spot trading. To make the idea easier to grasp, let me share this simple example from everyday life:
When many beginners first enter the world of crypto, their eyes light up at the prospect of quick profits. They hear the word “Futures” and jump in with their capital without even understanding the difference between futures trading and spot trading. To make the idea easier to grasp, let me share this simple example from everyday life:
1
78
·
--
Article
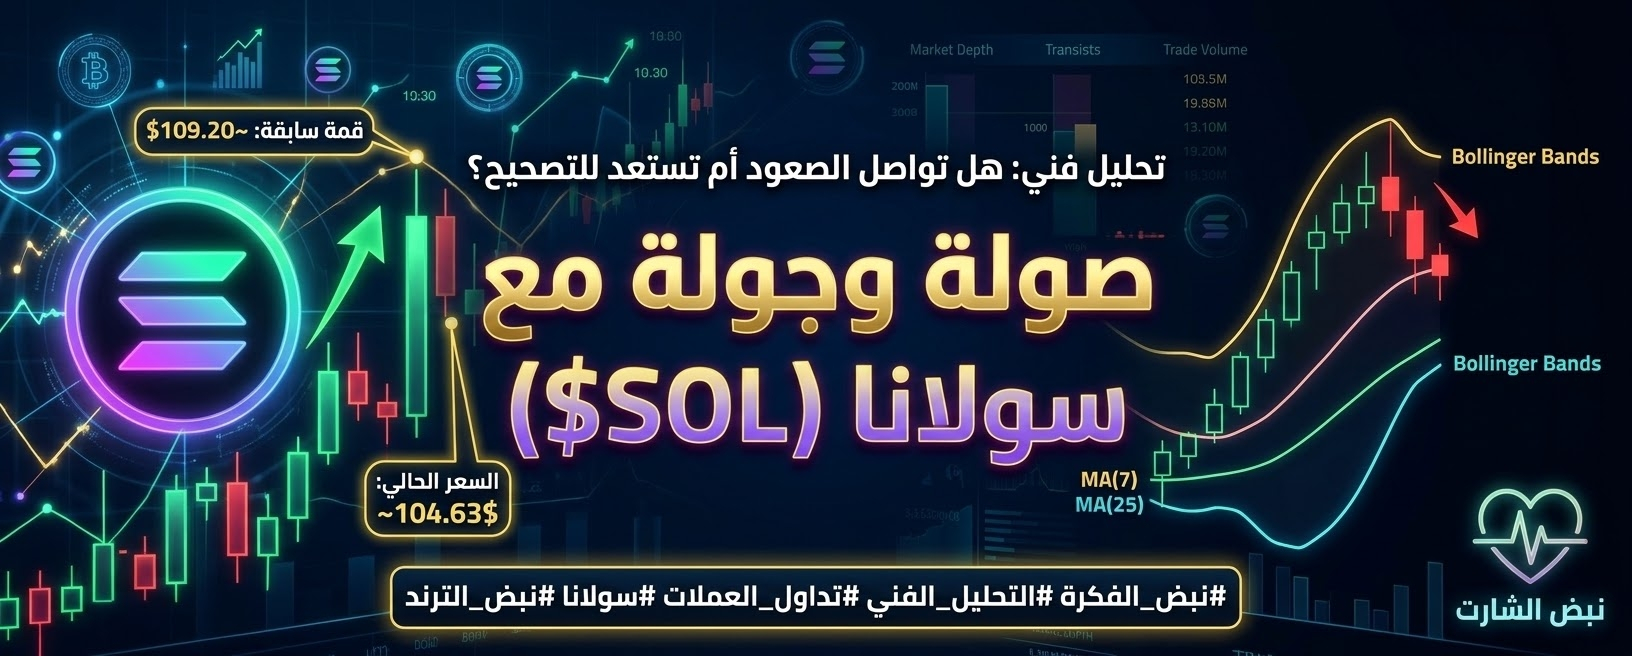
A Look at Solana ($SOL): Should We Seize the Opportunity at Current Support Levels or Wait?Good evening, everyone. Hope you’re all doing great. I’ve been away for a while.
Due to unavoidable circumstances.
Today, with our eyes on the bigger chart, SOL’s movement over the past few hours caught my attention. After soaring near $109.20 and strongly touching the upper Bollinger Band, it entered a slight downward correction toward the $104.63 area.
Many people are asking: Is the rally over? The answer is always dictated by the chart, not by emotion!
A Look at Solana ($SOL): Should We Seize the Opportunity at Current Support Levels or Wait?
Good evening, everyone. Hope you’re all doing great. I’ve been away for a while.
Due to unavoidable circumstances.
Today, with our eyes on the bigger chart, SOL’s movement over the past few hours caught my attention. After soaring near $109.20 and strongly touching the upper Bollinger Band, it entered a slight downward correction toward the $104.63 area.
Many people are asking: Is the rally over? The answer is always dictated by the chart, not by emotion!
1
129
·
--
🚀 Quick analysis of SUI/USDT on the 4-hour timeframe (#ChartPulse)
The #ChartPulse team welcomes you. Here’s a quick technical look at the SUI pair’s price action and an update on key levels for traders:
📉 Technical levels map:
Nearest support: $1.00–0.99$ (an important local bounce zone).
Major support: $0.96–0.955$ (a strong low and a protective level for the trade).
First resistance: $1.06–1.08$ (a decisive breakout level).
Major resistance: $1.14–1.15$ (the next wave’s target).
📊 Momentum and volatility indicators (Bollinger Bands & MACD):
Bollinger Bands: The price is moving near the middle band, with a noticeable narrowing of the range. This suggests a potential price expansion may be approaching, with a possible breakout above the upper band.
MACD: The return of positive crossovers and the histogram turning green reflect gradually increasing buying momentum.
🎯 Suggested trading strategy:
Entry zones: Accumulate gradually at support, or buy after a clear 4-hour candle closes above 1.06$ with strong volume.
Targets (TP): 1.08$ ➔ $1.12 ➔ $1.15
Stop-loss (SL): A close below 0.945$ to protect capital.
⚠️ Risk management: Always stick to your plan and avoid getting greedy. Capital management is the key to staying in the market!
#ChartPulse #SUI #BinanceSquare #Crypto #TechnicalAnalysis #Cryptocurrency
{spot}(SUIUSDT)
{spot}(BTCUSDT)
🚀 Quick analysis of SUI/USDT on the 4-hour timeframe (#ChartPulse)
The #ChartPulse team welcomes you. Here’s a quick technical look at the SUI pair’s price action and an update on key levels for traders:
📉 Technical levels map:
Nearest support: $1.00–0.99$ (an important local bounce zone).
Major support: $0.96–0.955$ (a strong low and a protective level for the trade).
First resistance: $1.06–1.08$ (a decisive breakout level).
Major resistance: $1.14–1.15$ (the next wave’s target).
📊 Momentum and volatility indicators (Bollinger Bands & MACD):
Bollinger Bands: The price is moving near the middle band, with a noticeable narrowing of the range. This suggests a potential price expansion may be approaching, with a possible breakout above the upper band.
MACD: The return of positive crossovers and the histogram turning green reflect gradually increasing buying momentum.
🎯 Suggested trading strategy:
Entry zones: Accumulate gradually at support, or buy after a clear 4-hour candle closes above 1.06$ with strong volume.
Targets (TP): 1.08$ ➔ $1.12 ➔ $1.15
Stop-loss (SL): A close below 0.945$ to protect capital.
⚠️ Risk management: Always stick to your plan and avoid getting greedy. Capital management is the key to staying in the market!
#ChartPulse #SUI #BinanceSquare #Crypto #TechnicalAnalysis #Cryptocurrency
1
239
·
--
Technical analysis of $FET: A quick scalping opportunity amid bullish momentum! 🔥$FET is seeing strong positive movement and notable momentum, up +6.25% to 0.2394 USDT!
With a clear bullish crossover of the MA(7) and MA(25) moving averages, and the four-hour candle breaking through previous accumulation zones on high trading volume, the coin presents an excellent opportunity for quick scalping.
📊 Key technical figures and levels:
Technical analysis of $FET: A quick scalping opportunity amid bullish momentum! 🔥
$FET is seeing strong positive movement and notable momentum, up +6.25% to 0.2394 USDT!
With a clear bullish crossover of the MA(7) and MA(25) moving averages, and the four-hour candle breaking through previous accumulation zones on high trading volume, the coin presents an excellent opportunity for quick scalping.
📊 Key technical figures and levels:
With a clear bullish crossover of the MA(7) and MA(25) moving averages, and the four-hour candle breaking through previous accumulation zones on high trading volume, the coin presents an excellent opportunity for quick scalping.
📊 Key technical figures and levels:
610
·
--
Article
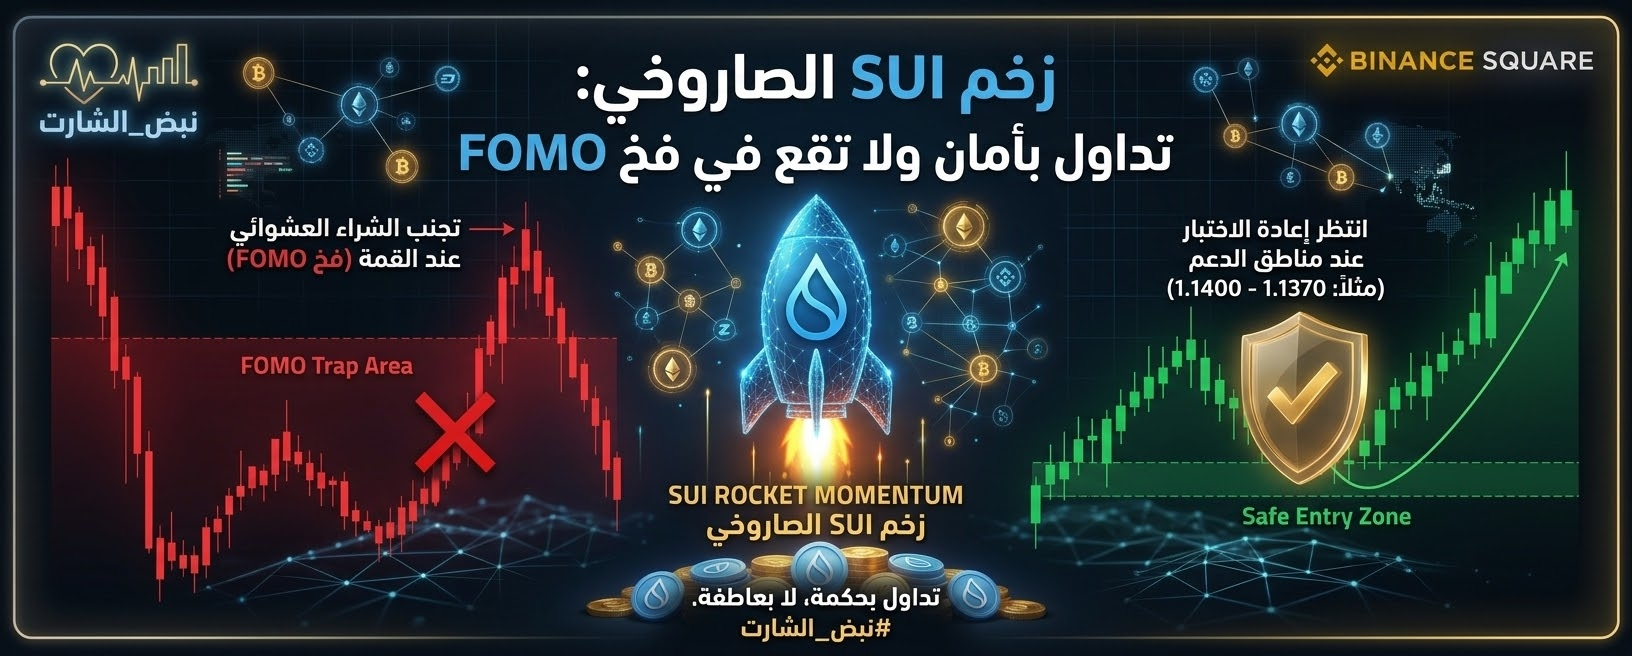
$SUI Update: A Quick Chart Read and Entry Strategy After the Rebound$SUI has made a notable upward move, rising +5.52% to settle at 1.1164 USDT, with strong momentum on the hourly timeframe and the fast moving average MA(7) at 1.1136 approaching current price levels as support.
But is now the right time to buy blindly, or should you wait? A smart trader reads the indicators and doesn’t get swept up by a green candle!
$SUI Update: A Quick Chart Read and Entry Strategy After the Rebound
$SUI has made a notable upward move, rising +5.52% to settle at 1.1164 USDT, with strong momentum on the hourly timeframe and the fast moving average MA(7) at 1.1136 approaching current price levels as support.
But is now the right time to buy blindly, or should you wait? A smart trader reads the indicators and doesn’t get swept up by a green candle!
But is now the right time to buy blindly, or should you wait? A smart trader reads the indicators and doesn’t get swept up by a green candle!
192
·
--
Article
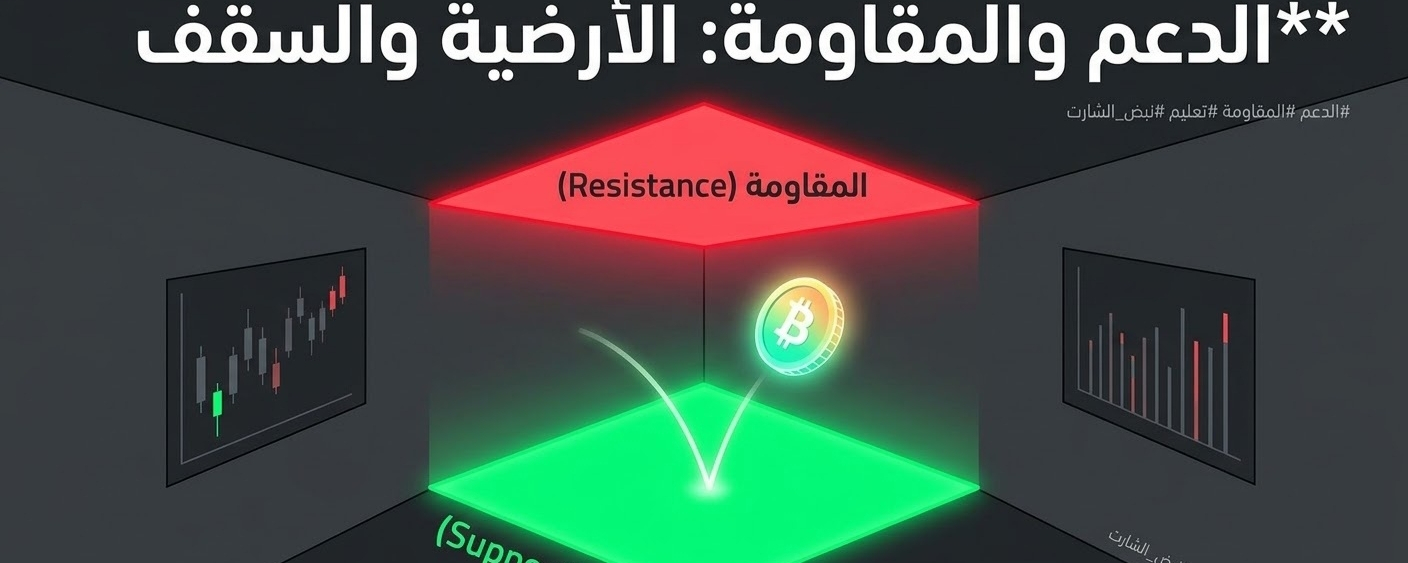
The Room's Floor and Ceiling: How to Understand Support and Resistance EasilyImagine you're standing in a room holding a small rubber ball, then you throw it forcefully toward the floor. What happens? The ball hits the floor and bounces back up. If it bounces high enough to hit the ceiling, it will bounce back down again.
This simple analogy is at the heart of price action in the cryptocurrency market:
Support level (the floor): The price level that prevents a continued decline. When the price reaches this area, traders see the asset as cheap and worth buying, so demand increases and prices bounce back up.
The Room's Floor and Ceiling: How to Understand Support and Resistance Easily
Imagine you're standing in a room holding a small rubber ball, then you throw it forcefully toward the floor. What happens? The ball hits the floor and bounces back up. If it bounces high enough to hit the ceiling, it will bounce back down again.
This simple analogy is at the heart of price action in the cryptocurrency market:
Support level (the floor): The price level that prevents a continued decline. When the price reaches this area, traders see the asset as cheap and worth buying, so demand increases and prices bounce back up.
This simple analogy is at the heart of price action in the cryptocurrency market:
Support level (the floor): The price level that prevents a continued decline. When the price reaches this area, traders see the asset as cheap and worth buying, so demand increases and prices bounce back up.
2
335
·
--
Article
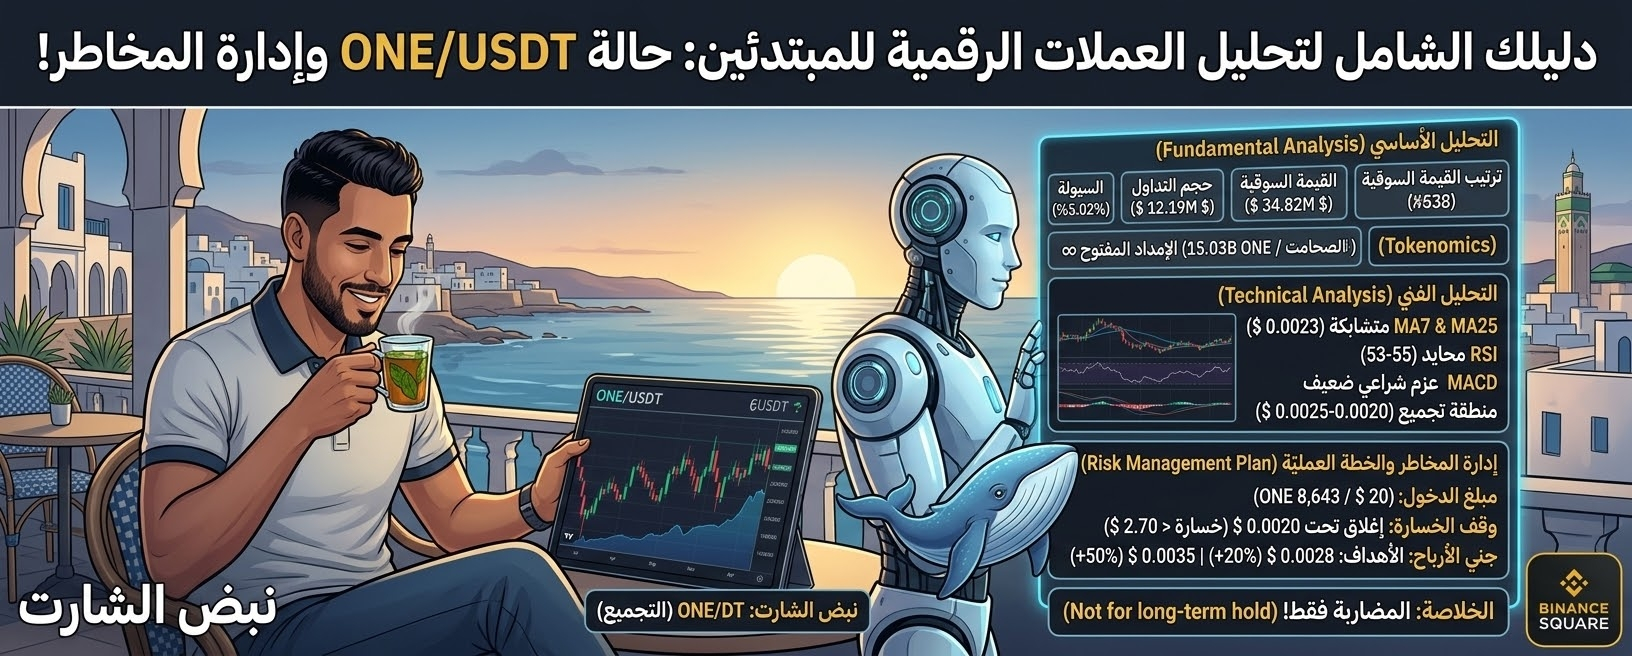
Chart Pulse | ONE Coin: Bottoming Opportunity or Speculative Trap?🛑 Very Important Disclaimer:
The information in this article is for educational purposes and to explain the technical and fundamental data available on Binance at the time of writing. This is not investment advice or a recommendation to buy or sell. Trading cryptocurrencies involves significant risk, and you should always do your own research (DYOR) before making any decisions.
Chart Pulse | ONE Coin: Bottoming Opportunity or Speculative Trap?
🛑 Very Important Disclaimer:
The information in this article is for educational purposes and to explain the technical and fundamental data available on Binance at the time of writing. This is not investment advice or a recommendation to buy or sell. Trading cryptocurrencies involves significant risk, and you should always do your own research (DYOR) before making any decisions.
The information in this article is for educational purposes and to explain the technical and fundamental data available on Binance at the time of writing. This is not investment advice or a recommendation to buy or sell. Trading cryptocurrencies involves significant risk, and you should always do your own research (DYOR) before making any decisions.
439
·
--
Article
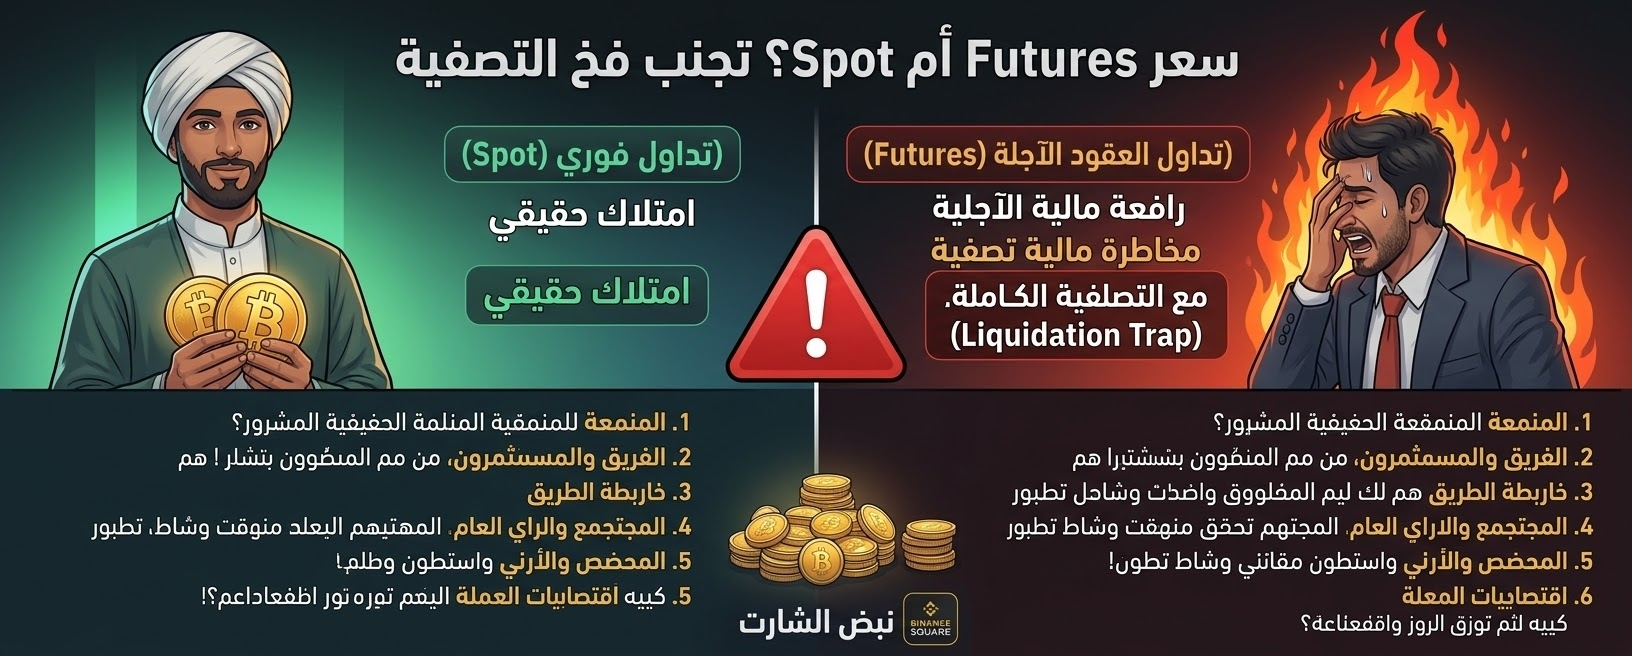
⚖️ Spot or Futures Trading? The Key Differences and How to Avoid the Liquidation Trap!Protecting beginners from immaturely chasing the quick, illusory profits offered by leverage, and explaining the logical difference between owning assets and gambling on the direction of their price.
Spot trading: You buy ownership of the currency
actual; if the price drops, your ownership isn’t liquidated, and you can wait for the market to recover.
2 Futures: You buy a contract that bets on the price using leverage; rapid rises and falls can multiply your profits, but they also risk “total liquidation” and wiping out your account when liquidity is targeted.
⚖️ Spot or Futures Trading? The Key Differences and How to Avoid the Liquidation Trap!
Protecting beginners from immaturely chasing the quick, illusory profits offered by leverage, and explaining the logical difference between owning assets and gambling on the direction of their price.
Spot trading: You buy ownership of the currency
actual; if the price drops, your ownership isn’t liquidated, and you can wait for the market to recover.
2 Futures: You buy a contract that bets on the price using leverage; rapid rises and falls can multiply your profits, but they also risk “total liquidation” and wiping out your account when liquidity is targeted.
162
·
--

Article
🤖 The magic of the (DCA) strategy: how to invest in crypto with profits and without the stress of accumulation?Address the problem of trying to "guess the bottom" that troubles beginners and pushes them to buy at the wrong times due to emotion, and propose a scheduled cumulative buying strategy as a sound institutional solution.
What is the DCA strategy? Explain the concept of average cost by reallocating capital over fixed time intervals (e.g., buying $50 per week regardless of the price).
🤖 The magic of the (DCA) strategy: how to invest in crypto with profits and without the stress of accumulation?
Address the problem of trying to "guess the bottom" that troubles beginners and pushes them to buy at the wrong times due to emotion, and propose a scheduled cumulative buying strategy as a sound institutional solution.
What is the DCA strategy? Explain the concept of average cost by reallocating capital over fixed time intervals (e.g., buying $50 per week regardless of the price).
What is the DCA strategy? Explain the concept of average cost by reallocating capital over fixed time intervals (e.g., buying $50 per week regardless of the price).
6
1.2k
·
--
Article
🛡️ Safety belt in trading: How do you protect your capital with the 1% rule and risk rate?🛑 Important warning:
The information provided in this article is for educational purposes and to clarify risk management concepts available within the Binance platform only. This is not investment advice, and not a solicitation to buy or sell. Trading in cryptocurrencies involves high risk, and you must always do your own research (DYOR) before making any decision.
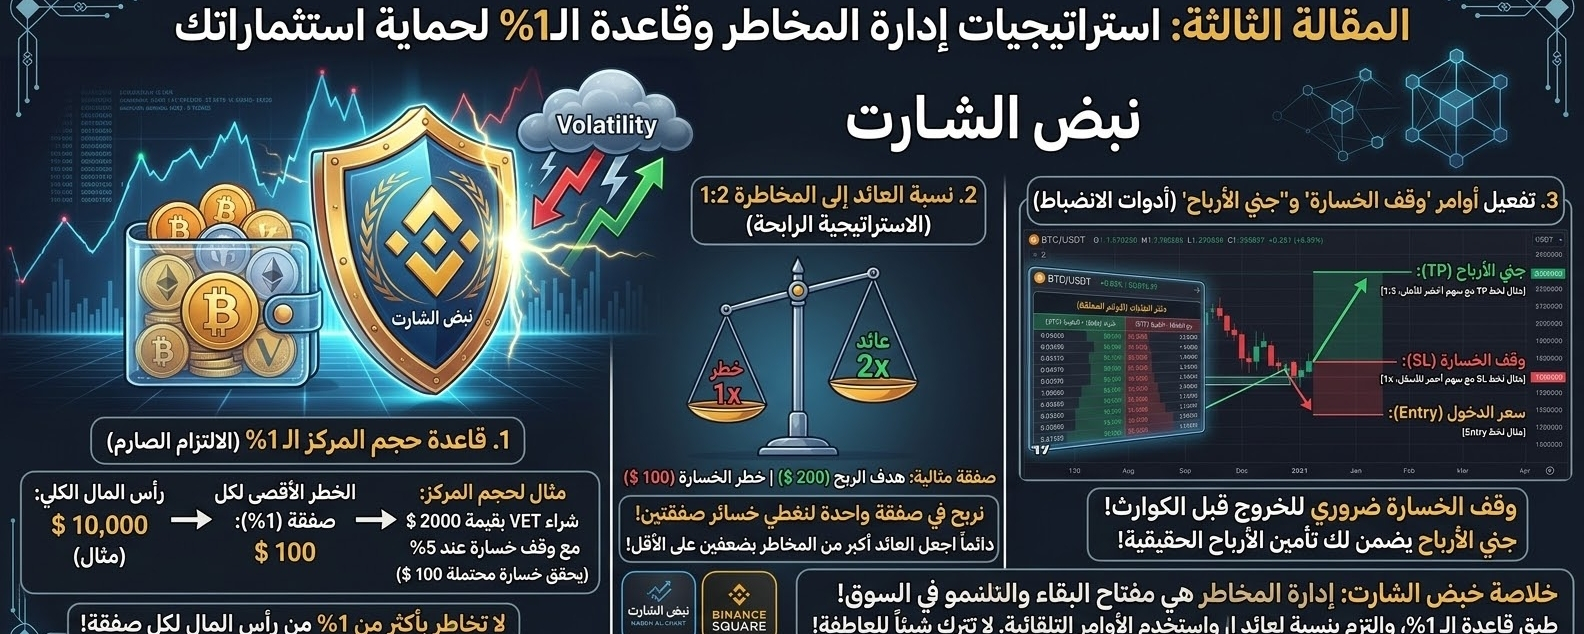
🛡️ Safety belt in trading: How do you protect your capital with the 1% rule and risk rate?
🛑 Important warning:
The information provided in this article is for educational purposes and to clarify risk management concepts available within the Binance platform only. This is not investment advice, and not a solicitation to buy or sell. Trading in cryptocurrencies involves high risk, and you must always do your own research (DYOR) before making any decision.
The information provided in this article is for educational purposes and to clarify risk management concepts available within the Binance platform only. This is not investment advice, and not a solicitation to buy or sell. Trading in cryptocurrencies involves high risk, and you must always do your own research (DYOR) before making any decision.
2
88
·
--
Article
🛡️ Safety belt in trading: How do you protect your capital with the 1% rule and the risk rate?🛑 Important notice:
The information provided in this article is for educational purposes and to explain risk management concepts available within the Binance platform only. This is not investment advice, nor a solicitation to buy or sell. Trading in cryptocurrencies involves high risk, and you should always do your own research (DYOR) before making any decision.
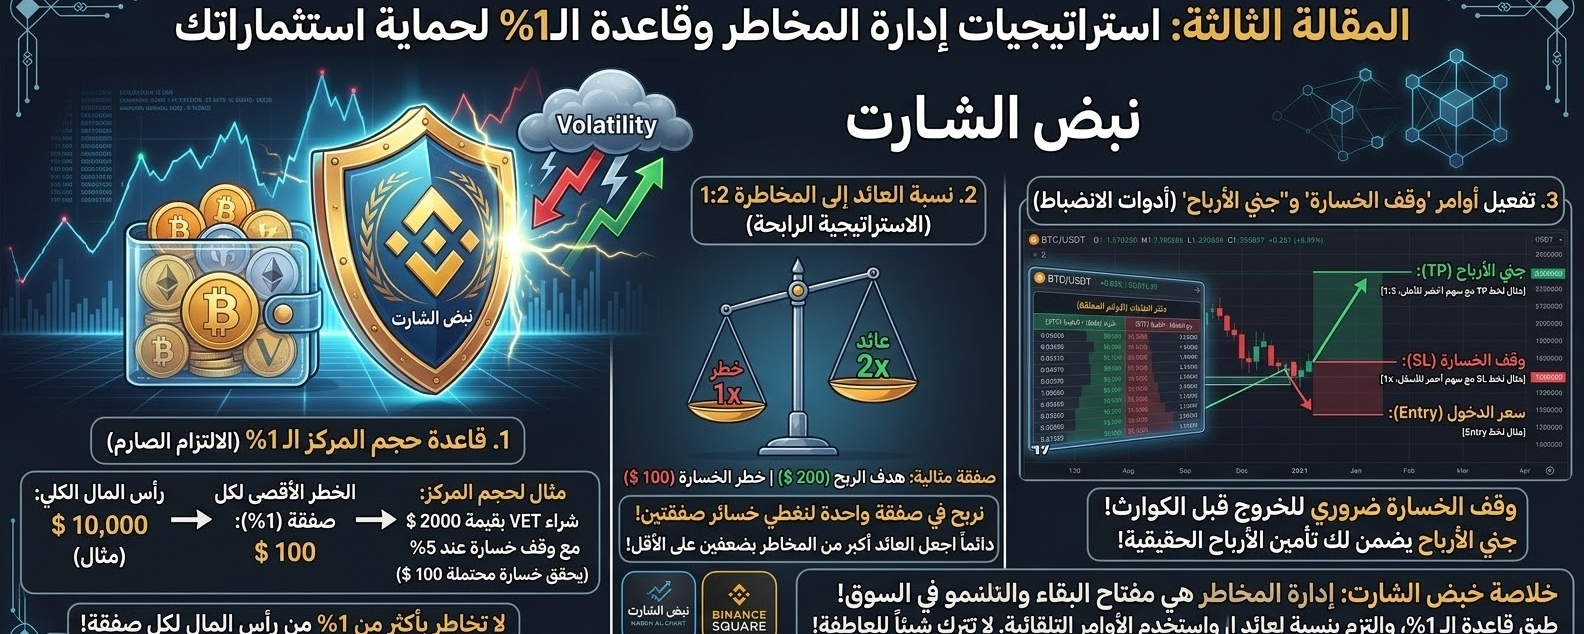
🛡️ Safety belt in trading: How do you protect your capital with the 1% rule and the risk rate?
🛑 Important notice:
The information provided in this article is for educational purposes and to explain risk management concepts available within the Binance platform only. This is not investment advice, nor a solicitation to buy or sell. Trading in cryptocurrencies involves high risk, and you should always do your own research (DYOR) before making any decision.
The information provided in this article is for educational purposes and to explain risk management concepts available within the Binance platform only. This is not investment advice, nor a solicitation to buy or sell. Trading in cryptocurrencies involves high risk, and you should always do your own research (DYOR) before making any decision.
2
170
·
--
Article
🍕 The trap of cheap coins: Why a price of $0.0001 does not mean the coin is cheap?🛑 Very important notice:
The information in this article is for educational purposes and to explain the concepts available within the Binance platform only. This is not investment advice, nor a solicitation to buy or sell. Trading in cryptocurrencies involves high risk, and you should always do your own research (DYOR) before making any decision.
1. A trap of "unit bias" 🧠
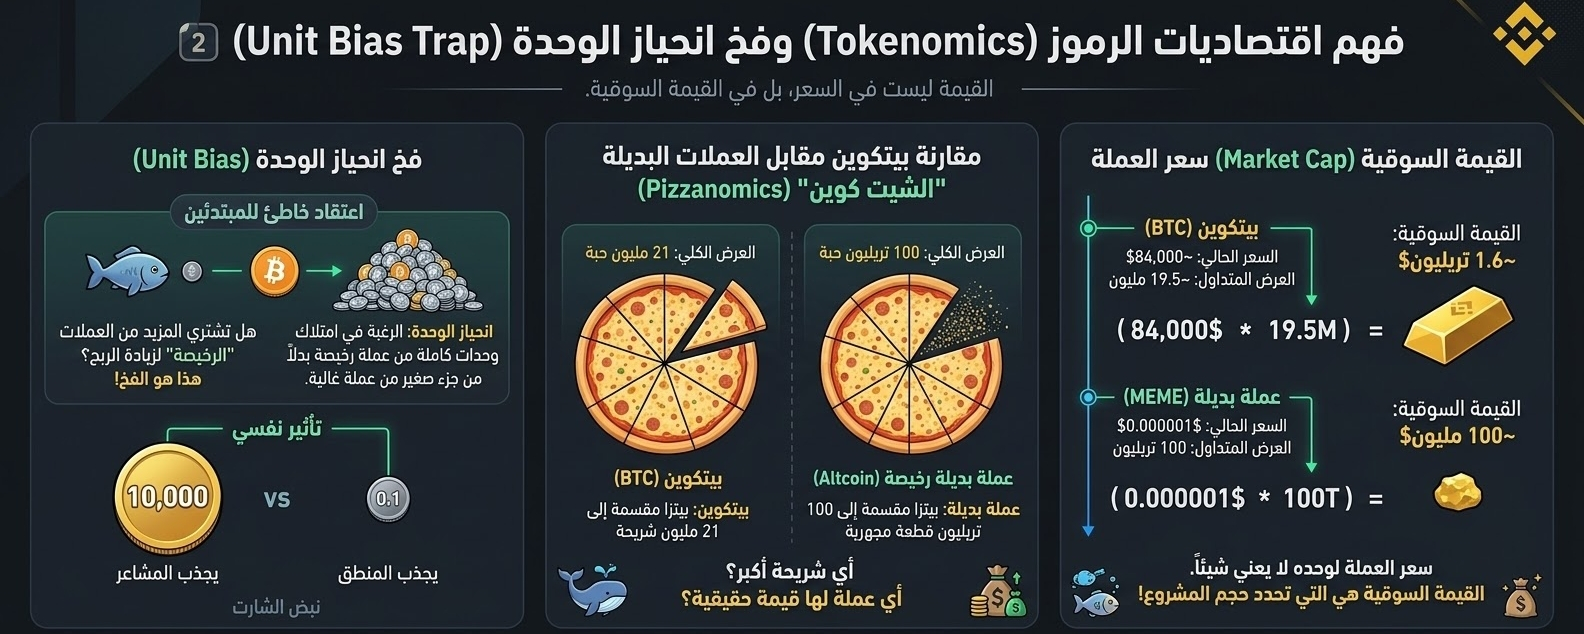
🍕 The trap of cheap coins: Why a price of $0.0001 does not mean the coin is cheap?
🛑 Very important notice:
The information in this article is for educational purposes and to explain the concepts available within the Binance platform only. This is not investment advice, nor a solicitation to buy or sell. Trading in cryptocurrencies involves high risk, and you should always do your own research (DYOR) before making any decision.
1. A trap of "unit bias" 🧠
2
173
·
--
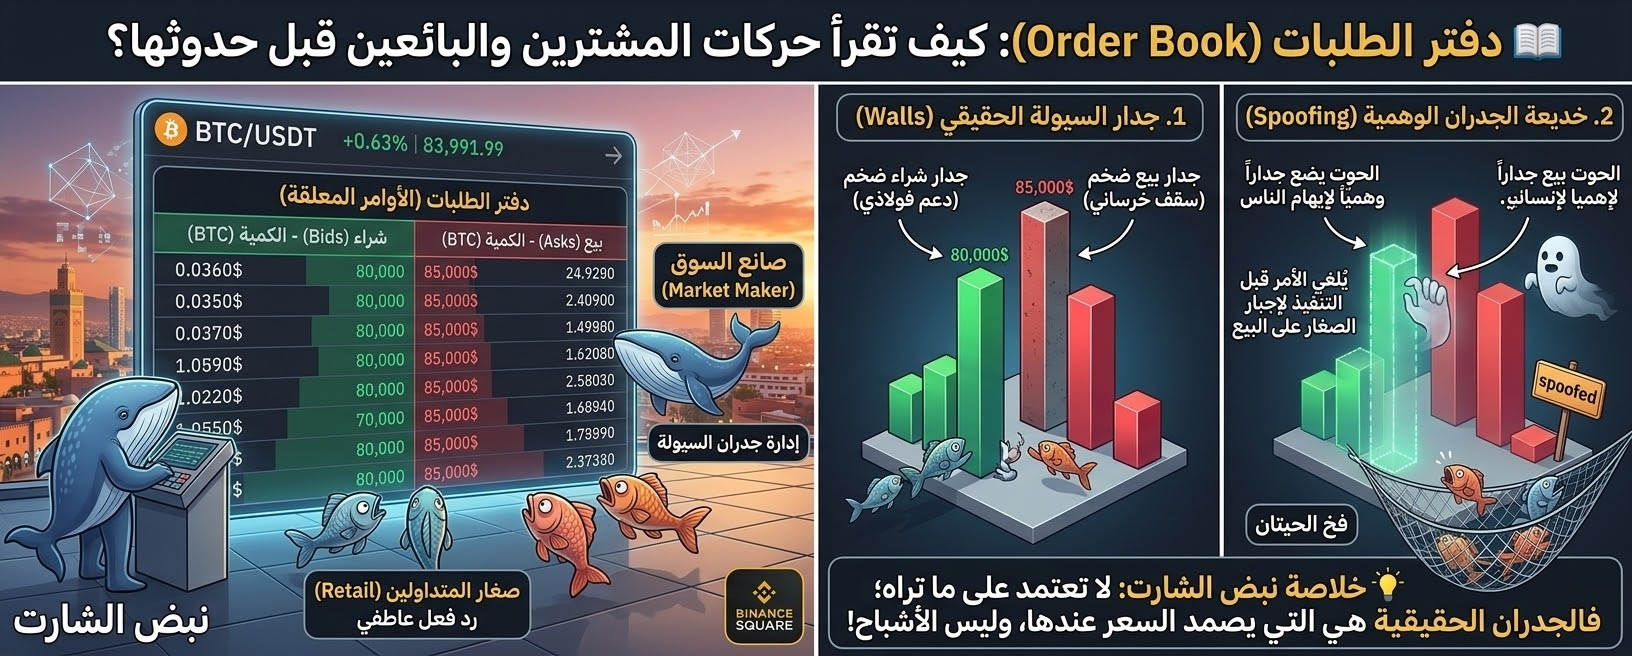
Article
📖 Order Book: How to read the moves of buyers and sellers before they happen?🛑 Very important notice:
The information provided in this article is for educational purposes and to explain the technical concepts available within the Binance platform only. This is not investment advice, nor a solicitation to buy or sell. Trading in cryptocurrencies involves high risk, and you must always do your own research (DYOR) before making any decision.
📖 Order Book: How to read the moves of buyers and sellers before they happen?
🛑 Very important notice:
The information provided in this article is for educational purposes and to explain the technical concepts available within the Binance platform only. This is not investment advice, nor a solicitation to buy or sell. Trading in cryptocurrencies involves high risk, and you must always do your own research (DYOR) before making any decision.
The information provided in this article is for educational purposes and to explain the technical concepts available within the Binance platform only. This is not investment advice, nor a solicitation to buy or sell. Trading in cryptocurrencies involves high risk, and you must always do your own research (DYOR) before making any decision.
1
170
·
--
Article
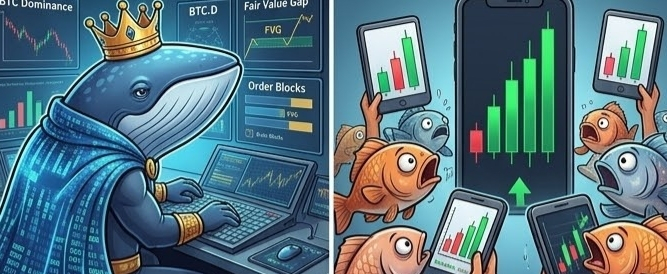
🧠 The “Smart Money” Secret: How Do Whales Control the Market and How Can You Trade With Them?
🛑 Important notice:
The information provided in this article is for educational purposes and to explain how markets work and the trading tactics available on the Binance platform only. This is not investment advice, and not a solicitation to buy or sell. Trading in cryptocurrencies involves high risk, and you should always do your own research (DYOR) before making any decision.
1
171
·
--
Article
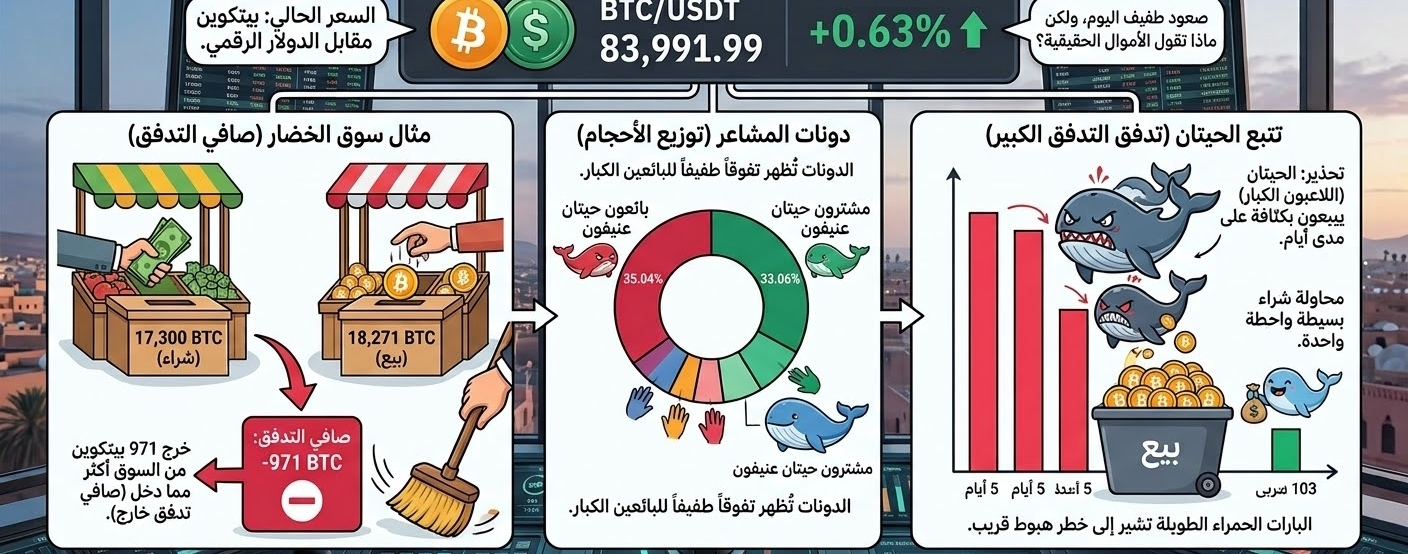
Breaking Down the Bitcoin Liquidity Flow Code: A Beginner’s Guide 📊I’m pleased to present this illustrative chart that breaks down the complex Bitcoin liquidity flow analysis interface. I converted the technical numbers from the app interface into simplified, real-life examples to help you understand what "big money" is doing at a glance.
Follow this image with the following structure:
Head (current price): The current price is 83,991.99. Although it rose slightly (+0.63%), we’ll delve deeper to see what’s really going on.
Breaking Down the Bitcoin Liquidity Flow Code: A Beginner’s Guide 📊
I’m pleased to present this illustrative chart that breaks down the complex Bitcoin liquidity flow analysis interface. I converted the technical numbers from the app interface into simplified, real-life examples to help you understand what "big money" is doing at a glance.
Follow this image with the following structure:
Head (current price): The current price is 83,991.99. Although it rose slightly (+0.63%), we’ll delve deeper to see what’s really going on.
Follow this image with the following structure:
Head (current price): The current price is 83,991.99. Although it rose slightly (+0.63%), we’ll delve deeper to see what’s really going on.
1
95
·
--
A Promise Is the Word, Commitment Is the Principle... 🤝In the "Pulse of the Chart" community, I don’t believe in empty follow-ups or dry numbers; rather, I believe in starting a real educational and interactive journey with all of you. And because commitment is a faith, I present to you these three obligations:
Mutual follow (Follow Back): Whoever follows the page, I will follow back myself, even if the number of followers exceeds one million! We are building a community that grows and develops together.
A Promise Is the Word, Commitment Is the Principle... 🤝
In the "Pulse of the Chart" community, I don’t believe in empty follow-ups or dry numbers; rather, I believe in starting a real educational and interactive journey with all of you. And because commitment is a faith, I present to you these three obligations:
Mutual follow (Follow Back): Whoever follows the page, I will follow back myself, even if the number of followers exceeds one million! We are building a community that grows and develops together.
Mutual follow (Follow Back): Whoever follows the page, I will follow back myself, even if the number of followers exceeds one million! We are building a community that grows and develops together.
2
170
·
--
🔍 Dissecting the VTHO Coin: How "Network Fuel" Works and What It Has to Do with Its Twin, VET?When you enter the Binance platform, you may notice that there are two coins linked to the same project: VTHO and VET. Many beginners get confused: "What’s the difference between them? And which one should I buy?"
In this educational article, we will decode the VTHO (VeThor Token) coin in a simplified way, using examples from everyday life to explain the "Dual-Token System" model.
🔍 Dissecting the VTHO Coin: How "Network Fuel" Works and What It Has to Do with Its Twin, VET?
When you enter the Binance platform, you may notice that there are two coins linked to the same project: VTHO and VET. Many beginners get confused: "What’s the difference between them? And which one should I buy?"
In this educational article, we will decode the VTHO (VeThor Token) coin in a simplified way, using examples from everyday life to explain the "Dual-Token System" model.
In this educational article, we will decode the VTHO (VeThor Token) coin in a simplified way, using examples from everyday life to explain the "Dual-Token System" model.
1
275
Log in to explore more content
Join global crypto users on Binance Square
⚡️ Get latest and useful information about crypto.
💬 Trusted by the world’s largest crypto exchange.
👍 Discover real insights from verified creators.
Email / Phone number
Trending Topics
UniswapA16zSeekDeFiExemptionFromIllinoisCryptoTax
18,563 views
663 Discussing
The debate over crypto taxation is heating up as Uniswap and Andreessen Horowitz ( a16z ) push for a DeFi exemption from Illinois proposed crypto tax rules. Their concern is that decentralized finance protocols and non custodial platforms could face unfair tax burdens potentially slowing innovation and making crypto development more difficult. DeFi platforms allow users to trade and manage digital assets without traditional intermediaries so applying conventional financial tax rules may create serious challenges. This could become an important moment for the US crypto industry as regulators must find a balance between fair taxation, investor protection, and innovation. 🚀
The main concern is that the proposed 0.2% tax is calculated on transaction value, not simply trading profits. Uniswap a16z and the DeFi Education Fund want wallet withdrawals and cross chain bridging excluded, while also opposing requirements to maintain private key records. Illinois has agreed to postpone implementation until July 1, 2027 subject to court approval. The outcome could influence how other US states approach DeFi taxation. The Defiant +2
What do you think 🤔 ? Should DeFi transactions be tax free to protect decentralization or should crypto platforms follow traditional tax rules ? 🤔
#UniswapA16zSeekDeFiExemptionFromIllinoisCryptoTax
Volatile
·3 Likes
·165 views
HKDollarStablecoinHKDAPToLaunchOnSolana
12,742 views
402 Discussing
$1.5BInLeveragedCryptoBetsLiquidated
31,019 views
232 Discussing