


Good morning, everyone. Hope you're all doing great.
Many beginners feel dizzy as soon as they open a chart and see all those lines and complicated indicators at the bottom! Today, we'll simplify one of the most important and widely used indicators: the Relative Strength Index (RSI).
To understand the idea without the geometric complexity, imagine this simple example from our daily lives:
Imagine you're in the middle of a major sale (Soldes) at a clothing store. Everyone starts rushing to buy the same shirt until it's sold out, and its price skyrockets because of the huge crowd. This excessive crowding means people have exhausted their buying power, and no one is left to buy at a higher price.
Now imagine the exact opposite: the price of a certain product has dropped, everyone has completely ignored it, and it's become unbelievably cheap in a corner of the store. That's when some savvy traders notice it and snap it up because it's become "very cheap."
What is the RSI indicator, in brief?
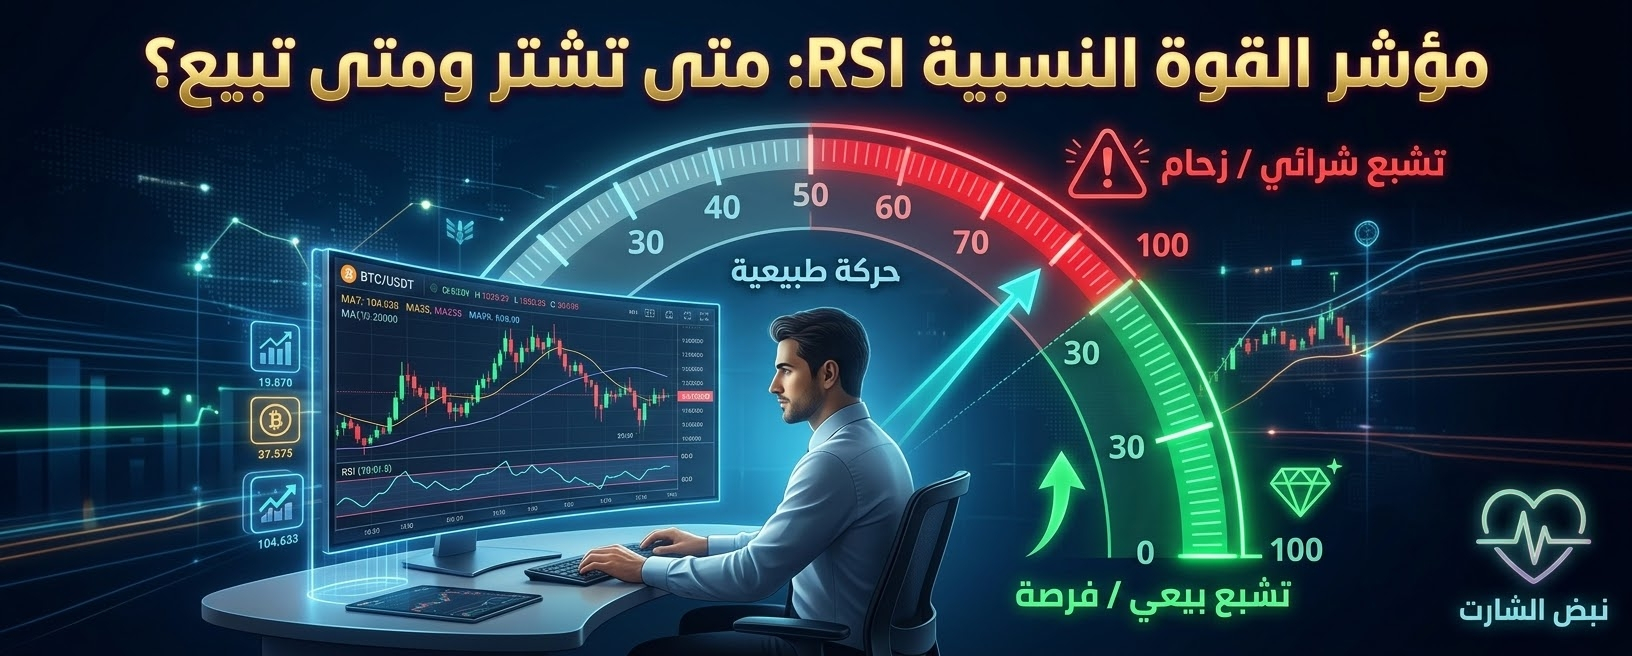
It's an indicator displayed as a line in a separate panel, with a value that always ranges between 0 and 100. It measures the speed and magnitude of price changes to give you two key signals:
Overbought zone (above 70):
When the line rises above 70, it's like a "very crowded store": the price has risen excessively over a short period. Be cautious here, because buying momentum may run out, often followed by profit-taking or a downward correction.Oversold zone (below 30):
When the line falls below 30, it's like "goods that have been neglected and are very cheap": the price has fallen sharply amid widespread selling, putting the coin on the radar for a potential bullish rebound when buyers decide to return.
🛡️ Golden rules for beginners using RSI:
Don't sell just because it has crossed 70: a strong coin can remain in overbought territory for a long time while continuing to rise sharply. Always wait for a genuine reversal signal.
Don't buy blindly just because it's below 30: a coin that's falling may keep falling if it's facing real problems. Always relate the indicator reading to support and resistance levels.
Neutral zone: The area between 30 and 70 is considered normal market movement and volatility.
Trading isn't random guesswork; it's an intelligent reading of momentum and liquidity!
Tell me in the comments: Do you rely on the RSI indicator in your daily trades, or do you prefer other tools?
Trade wisely, not recklessly! 🚀
#ChartPulse #TechnicalAnalysis #TradingEducation #RSI #مبتدئين_الكريبتو


