
爱理财的小瑜msg
40 Posts

爱理财的小瑜msg
Report
Block User
0 Following
6 Followers
11 Liked
Posts
·
--
Bitcoin’s bigger move is really coming!
The bears who are promoting an immediate big drop mostly don’t dare to show real short positions on their screens—they just type and brag!
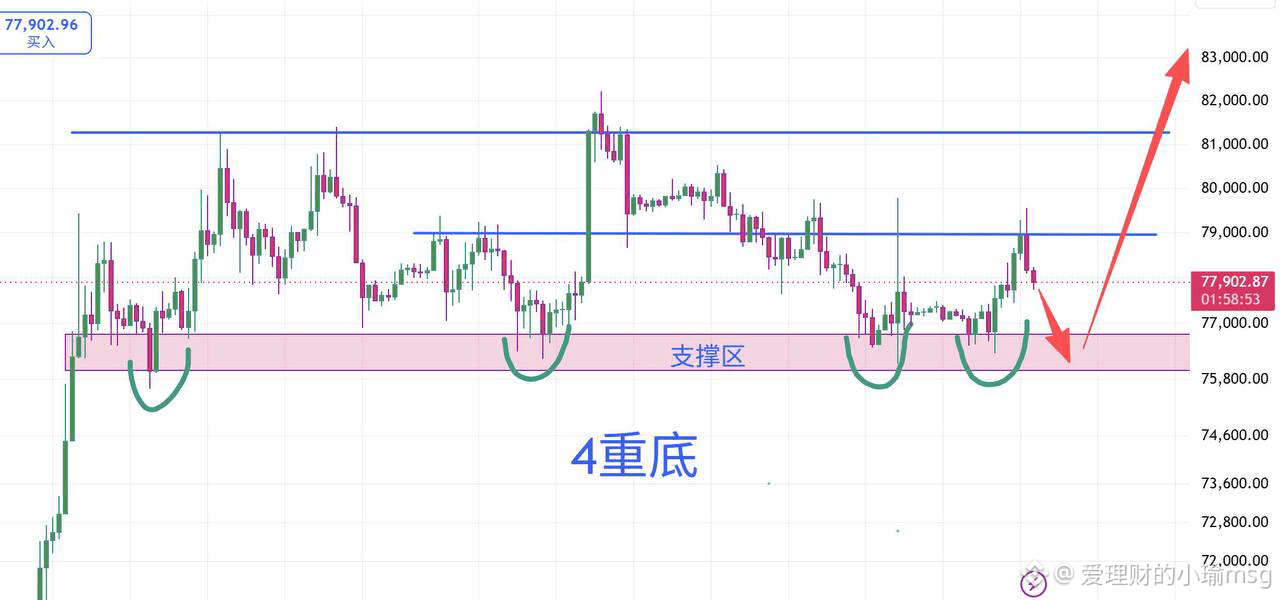
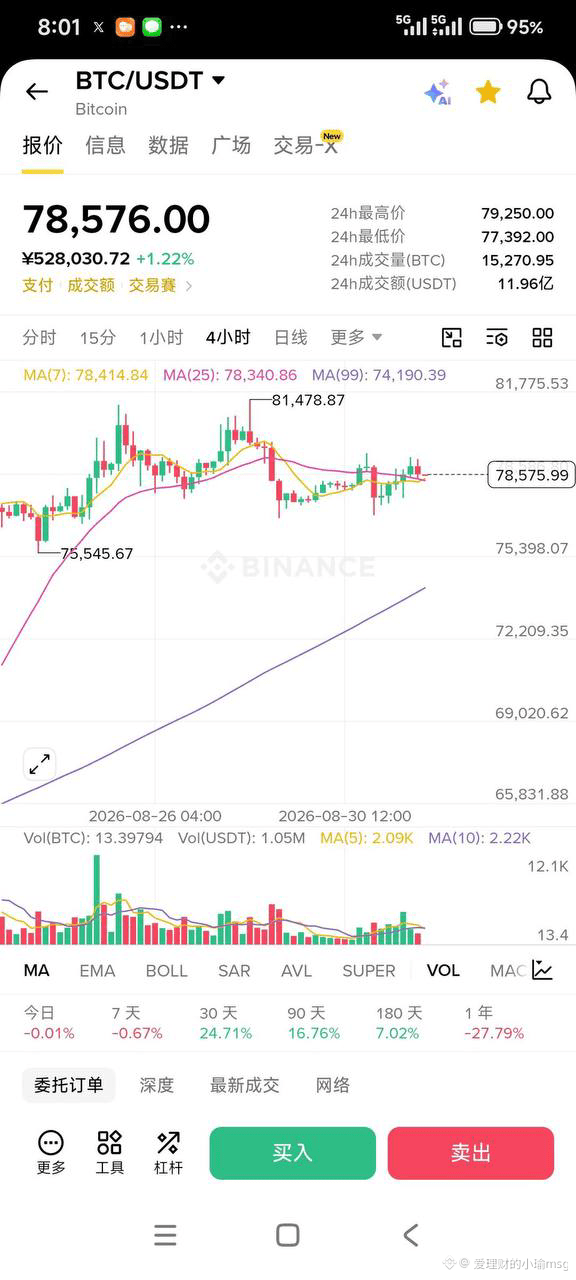
The 4-hour K-line shows that the support zone at 75.5k–76k is truly strong—it's held it four times already! It hasn’t broken at all!
Combined with Bitcoin’s liquidation map, we expect Bitcoin to test the support zone for the 5th time. If it doesn’t break down, it will rebound directly, then try to push toward 82,000!
Don’t let the back-and-forth swings during the trading session shake your head and confuse you—this bull run surge is already building momentum! The big breakout is about to start blasting up!
#BTC
Bitcoin’s bigger move is really coming!
The bears who are promoting an immediate big drop mostly don’t dare to show real short positions on their screens—they just type and brag!
The 4-hour K-line shows that the support zone at 75.5k–76k is truly strong—it's held it four times already! It hasn’t broken at all!
Combined with Bitcoin’s liquidation map, we expect Bitcoin to test the support zone for the 5th time. If it doesn’t break down, it will rebound directly, then try to push toward 82,000!
Don’t let the back-and-forth swings during the trading session shake your head and confuse you—this bull run surge is already building momentum! The big breakout is about to start blasting up!
#BTC
The bears who are promoting an immediate big drop mostly don’t dare to show real short positions on their screens—they just type and brag!
The 4-hour K-line shows that the support zone at 75.5k–76k is truly strong—it's held it four times already! It hasn’t broken at all!
Combined with Bitcoin’s liquidation map, we expect Bitcoin to test the support zone for the 5th time. If it doesn’t break down, it will rebound directly, then try to push toward 82,000!
Don’t let the back-and-forth swings during the trading session shake your head and confuse you—this bull run surge is already building momentum! The big breakout is about to start blasting up!
#BTC
2
1.7k
·
--
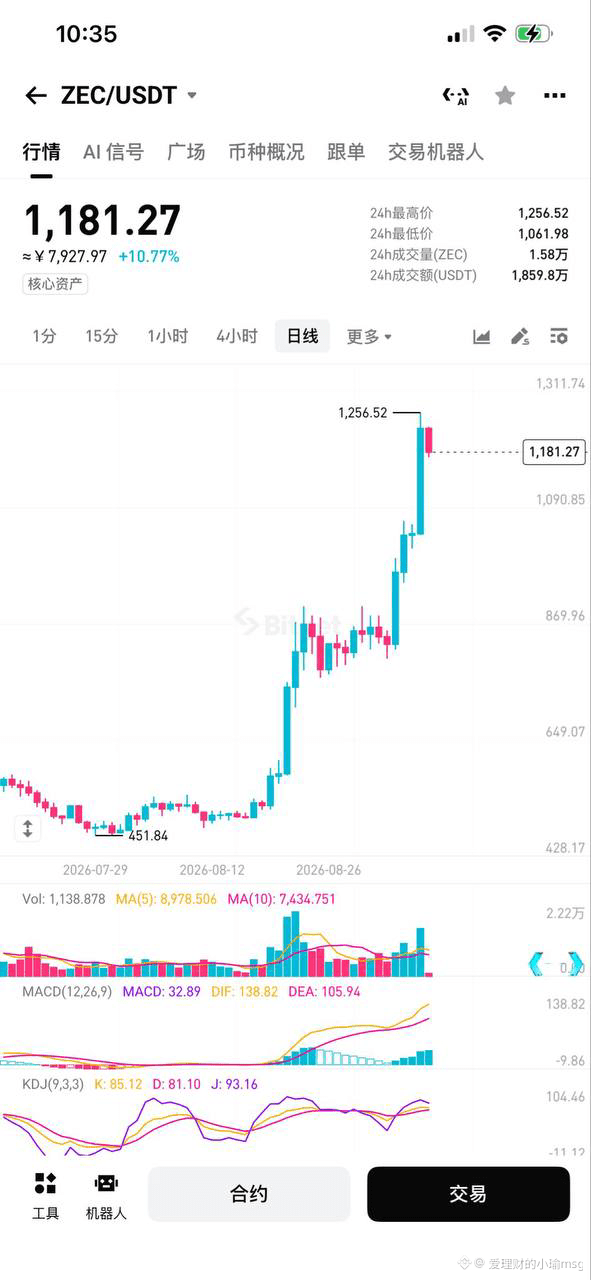
5 Key Reasons for ZEC’s Recent Rise:
1. Grayscale ETF Launch Paves the Way for Institutional Inflows. By the end of August, Grayscale successfully converted its nine-year Zcash trust into the U.S.’s first Zcash spot ETF (ticker: ZCSH), which began trading on the NYSE. Traditional investors can now comply and allocate ZEC through brokerage accounts—fully opening the capital channel. This is the hardest catalyst behind the current rally.
2. Bad Regulatory News Has Run Its Course, and the “Tightening” Spell Is Lifted. In January 2026, the SEC officially concluded its investigation into the Zcash Foundation—after nearly two years—without taking any enforcement action. In effect, this is an official stamp that ZEC is not a security. The “you could be sued at any moment” sword hanging over privacy coins for years has finally been put down.
3. A Tightening Supply-and-Demand Structure Makes Coins Scarcer. ZEC’s total supply is locked at 21 million coins. After the block reward halved in November 2024, the daily issuance was cut roughly in half. On top of that, about 30% of circulating supply is locked in shielded pools and Grayscale trusts, so the actual liquid supply keeps shrinking—supply tightens while demand grows, naturally pushing prices higher.
4. The AI Monitoring Era Reprices the Privacy Narrative. On-chain analytics have become increasingly powerful, and Bitcoin’s transparent ledger is arguably the bigger risk. ZEC’s zero-knowledge proof technology enables transactions to be anonymous and to support “selective disclosure.” Capital has therefore redefined it as an “insurance asset that hedges against on-chain monitoring.” Grayscale has also publicly stated that ZEC’s value in the AI era has been undervalued.
5. Short Squeezes and a Forced-Margin Rally Fuel the Fire. When price breaks through key levels, roughly $34.5 million worth of short positions were forced to close, compelling additional buying that further pushes the price—creating a positive feedback loop. Combined with KOLs issuing dense trading calls and the market’s FOMO sentiment spreading, short-term capital accelerates into the market.
5 Key Reasons for ZEC’s Recent Rise:
1. Grayscale ETF Launch Paves the Way for Institutional Inflows. By the end of August, Grayscale successfully converted its nine-year Zcash trust into the U.S.’s first Zcash spot ETF (ticker: ZCSH), which began trading on the NYSE. Traditional investors can now comply and allocate ZEC through brokerage accounts—fully opening the capital channel. This is the hardest catalyst behind the current rally.
2. Bad Regulatory News Has Run Its Course, and the “Tightening” Spell Is Lifted. In January 2026, the SEC officially concluded its investigation into the Zcash Foundation—after nearly two years—without taking any enforcement action. In effect, this is an official stamp that ZEC is not a security. The “you could be sued at any moment” sword hanging over privacy coins for years has finally been put down.
3. A Tightening Supply-and-Demand Structure Makes Coins Scarcer. ZEC’s total supply is locked at 21 million coins. After the block reward halved in November 2024, the daily issuance was cut roughly in half. On top of that, about 30% of circulating supply is locked in shielded pools and Grayscale trusts, so the actual liquid supply keeps shrinking—supply tightens while demand grows, naturally pushing prices higher.
4. The AI Monitoring Era Reprices the Privacy Narrative. On-chain analytics have become increasingly powerful, and Bitcoin’s transparent ledger is arguably the bigger risk. ZEC’s zero-knowledge proof technology enables transactions to be anonymous and to support “selective disclosure.” Capital has therefore redefined it as an “insurance asset that hedges against on-chain monitoring.” Grayscale has also publicly stated that ZEC’s value in the AI era has been undervalued.
5. Short Squeezes and a Forced-Margin Rally Fuel the Fire. When price breaks through key levels, roughly $34.5 million worth of short positions were forced to close, compelling additional buying that further pushes the price—creating a positive feedback loop. Combined with KOLs issuing dense trading calls and the market’s FOMO sentiment spreading, short-term capital accelerates into the market.
1. Grayscale ETF Launch Paves the Way for Institutional Inflows. By the end of August, Grayscale successfully converted its nine-year Zcash trust into the U.S.’s first Zcash spot ETF (ticker: ZCSH), which began trading on the NYSE. Traditional investors can now comply and allocate ZEC through brokerage accounts—fully opening the capital channel. This is the hardest catalyst behind the current rally.
2. Bad Regulatory News Has Run Its Course, and the “Tightening” Spell Is Lifted. In January 2026, the SEC officially concluded its investigation into the Zcash Foundation—after nearly two years—without taking any enforcement action. In effect, this is an official stamp that ZEC is not a security. The “you could be sued at any moment” sword hanging over privacy coins for years has finally been put down.
3. A Tightening Supply-and-Demand Structure Makes Coins Scarcer. ZEC’s total supply is locked at 21 million coins. After the block reward halved in November 2024, the daily issuance was cut roughly in half. On top of that, about 30% of circulating supply is locked in shielded pools and Grayscale trusts, so the actual liquid supply keeps shrinking—supply tightens while demand grows, naturally pushing prices higher.
4. The AI Monitoring Era Reprices the Privacy Narrative. On-chain analytics have become increasingly powerful, and Bitcoin’s transparent ledger is arguably the bigger risk. ZEC’s zero-knowledge proof technology enables transactions to be anonymous and to support “selective disclosure.” Capital has therefore redefined it as an “insurance asset that hedges against on-chain monitoring.” Grayscale has also publicly stated that ZEC’s value in the AI era has been undervalued.
5. Short Squeezes and a Forced-Margin Rally Fuel the Fire. When price breaks through key levels, roughly $34.5 million worth of short positions were forced to close, compelling additional buying that further pushes the price—creating a positive feedback loop. Combined with KOLs issuing dense trading calls and the market’s FOMO sentiment spreading, short-term capital accelerates into the market.
143
·
--
🚨 Bitcoin’s "bull market start signal" is flashing!
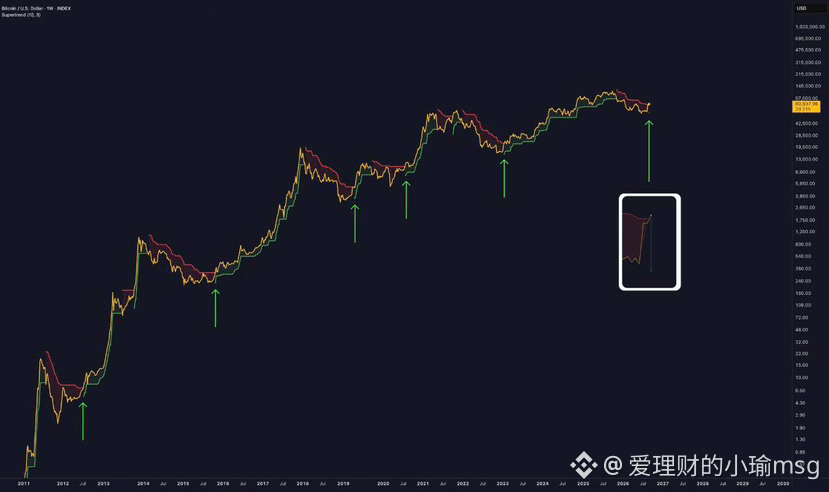
$BTC weekly Supertrend has officially turned green 🟢
Why is this signal worth paying attention to?
Because looking back at Bitcoin’s past cycles:
Every time the weekly Supertrend flipped from red to green,
what followed was almost always a true major bull market. 🚀
And now, this signal has appeared again.
But there is one last key point:
⚠️ This week’s weekly candle has not closed yet.
Turning green intraday does not count as a real confirmation.
If Supertrend remains green after this week’s close—
then what we are seeing now
may not be the end of a rebound, but the beginning of a new bull market.
The next weekly candle is very important. 👀
🚨 Bitcoin’s "bull market start signal" is flashing!
$BTC weekly Supertrend has officially turned green 🟢
Why is this signal worth paying attention to?
Because looking back at Bitcoin’s past cycles:
Every time the weekly Supertrend flipped from red to green,
what followed was almost always a true major bull market. 🚀
And now, this signal has appeared again.
But there is one last key point:
⚠️ This week’s weekly candle has not closed yet.
Turning green intraday does not count as a real confirmation.
If Supertrend remains green after this week’s close—
then what we are seeing now
may not be the end of a rebound, but the beginning of a new bull market.
The next weekly candle is very important. 👀
$BTC weekly Supertrend has officially turned green 🟢
Why is this signal worth paying attention to?
Because looking back at Bitcoin’s past cycles:
Every time the weekly Supertrend flipped from red to green,
what followed was almost always a true major bull market. 🚀
And now, this signal has appeared again.
But there is one last key point:
⚠️ This week’s weekly candle has not closed yet.
Turning green intraday does not count as a real confirmation.
If Supertrend remains green after this week’s close—
then what we are seeing now
may not be the end of a rebound, but the beginning of a new bull market.
The next weekly candle is very important. 👀
150
·
--
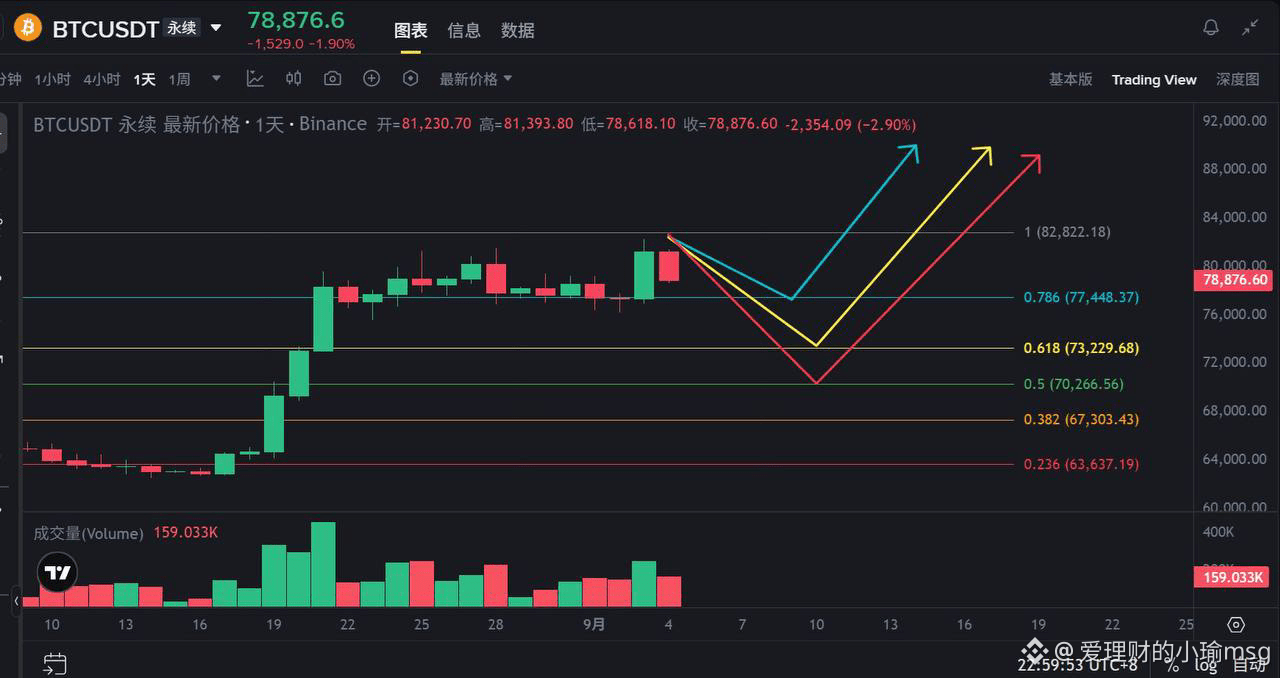
Three possible price scenarios for BTC going forward (revised)
💙 Scenario 1 (blue path, highest probability, about 50%): CPI meets expectations, BTC retests 75K-76K;
Trigger conditions: August core CPI month-over-month is close to the expected 0.2%, and inflation continues in a "moderate but sticky" pattern; rate hike probability: stays around the current 60%;
BTC target: 75,000-76,000 range (whale order zone + Fib 0.382);
💛 Scenario 2 (yellow path, second-highest probability, about 30%): CPI comes in higher, BTC falls to around 73K;
Trigger conditions: core CPI month-over-month is 0.2%-0.3%, higher than expected but not out of control, service inflation remains sticky, rate hike probability: rises above 70%.
BTC target: around 73,000 (Fib 0.5 retracement + 200-day moving average);
🔴 Scenario 3 (red path, lower probability, about 20%): CPI is relatively high, BTC falls to around 71K.
Trigger conditions: core CPI month-over-month >0.3%, combined with high oil prices, the market rapidly prices in rate hike probability, rate hike probability: surges above 80%.
BTC target: around 71,000 (Fib 0.618 retracement, extreme case).
📚 In the end, all three paths point to "a retest and confirmation before moving up again"; the difference is only in depth. At present, the blue scenario has the highest probability, while the red scenario requires multiple bearish factors to stack up.
The bear market is over, and the bull market has begun! The logic lies in the shift in strength between bullish and bearish volume, a more bullish capital flow, and funds flowing out of AI having already moved into cryptocurrencies.
No matter which scenario plays out, once the pullback is in place, there are two words: get on board🚗❗️
Three possible price scenarios for BTC going forward (revised)
💙 Scenario 1 (blue path, highest probability, about 50%): CPI meets expectations, BTC retests 75K-76K;
Trigger conditions: August core CPI month-over-month is close to the expected 0.2%, and inflation continues in a "moderate but sticky" pattern; rate hike probability: stays around the current 60%;
BTC target: 75,000-76,000 range (whale order zone + Fib 0.382);
💛 Scenario 2 (yellow path, second-highest probability, about 30%): CPI comes in higher, BTC falls to around 73K;
Trigger conditions: core CPI month-over-month is 0.2%-0.3%, higher than expected but not out of control, service inflation remains sticky, rate hike probability: rises above 70%.
BTC target: around 73,000 (Fib 0.5 retracement + 200-day moving average);
🔴 Scenario 3 (red path, lower probability, about 20%): CPI is relatively high, BTC falls to around 71K.
Trigger conditions: core CPI month-over-month >0.3%, combined with high oil prices, the market rapidly prices in rate hike probability, rate hike probability: surges above 80%.
BTC target: around 71,000 (Fib 0.618 retracement, extreme case).
📚 In the end, all three paths point to "a retest and confirmation before moving up again"; the difference is only in depth. At present, the blue scenario has the highest probability, while the red scenario requires multiple bearish factors to stack up.
The bear market is over, and the bull market has begun! The logic lies in the shift in strength between bullish and bearish volume, a more bullish capital flow, and funds flowing out of AI having already moved into cryptocurrencies.
No matter which scenario plays out, once the pullback is in place, there are two words: get on board🚗❗️
💙 Scenario 1 (blue path, highest probability, about 50%): CPI meets expectations, BTC retests 75K-76K;
Trigger conditions: August core CPI month-over-month is close to the expected 0.2%, and inflation continues in a "moderate but sticky" pattern; rate hike probability: stays around the current 60%;
BTC target: 75,000-76,000 range (whale order zone + Fib 0.382);
💛 Scenario 2 (yellow path, second-highest probability, about 30%): CPI comes in higher, BTC falls to around 73K;
Trigger conditions: core CPI month-over-month is 0.2%-0.3%, higher than expected but not out of control, service inflation remains sticky, rate hike probability: rises above 70%.
BTC target: around 73,000 (Fib 0.5 retracement + 200-day moving average);
🔴 Scenario 3 (red path, lower probability, about 20%): CPI is relatively high, BTC falls to around 71K.
Trigger conditions: core CPI month-over-month >0.3%, combined with high oil prices, the market rapidly prices in rate hike probability, rate hike probability: surges above 80%.
BTC target: around 71,000 (Fib 0.618 retracement, extreme case).
📚 In the end, all three paths point to "a retest and confirmation before moving up again"; the difference is only in depth. At present, the blue scenario has the highest probability, while the red scenario requires multiple bearish factors to stack up.
The bear market is over, and the bull market has begun! The logic lies in the shift in strength between bullish and bearish volume, a more bullish capital flow, and funds flowing out of AI having already moved into cryptocurrencies.
No matter which scenario plays out, once the pullback is in place, there are two words: get on board🚗❗️
139
·
--
9/4 BTC market trend tracking:
Keep it simple
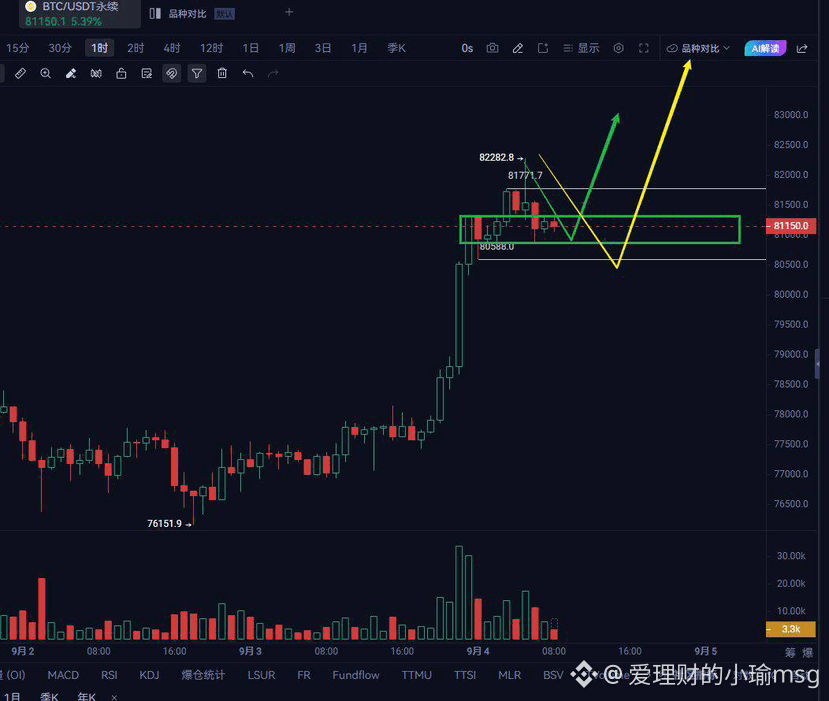
Focus on the 1H trend only. Right now, price is ranging between 806–818. There are two scenarios:
1. If it breaks above the resistance at 818, it will continue to accelerate upward.
2. Otherwise, if it breaks below support at 806, we need to see whether there will be a quick V-reversal, or whether it will pull back even further. If it breaks below 806 again, going long again will only be after it pulls back to 806.
A-Xin believes the probability of a big pullback is low. After a modest consolidation, it will most likely break above 818 again, then continue pushing higher—aiming at 830, and possibly even spiking to 840–860 $BTC
9/4 BTC market trend tracking:
Keep it simple
Focus on the 1H trend only. Right now, price is ranging between 806–818. There are two scenarios:
1. If it breaks above the resistance at 818, it will continue to accelerate upward.
2. Otherwise, if it breaks below support at 806, we need to see whether there will be a quick V-reversal, or whether it will pull back even further. If it breaks below 806 again, going long again will only be after it pulls back to 806.
A-Xin believes the probability of a big pullback is low. After a modest consolidation, it will most likely break above 818 again, then continue pushing higher—aiming at 830, and possibly even spiking to 840–860 $BTC
Keep it simple
Focus on the 1H trend only. Right now, price is ranging between 806–818. There are two scenarios:
1. If it breaks above the resistance at 818, it will continue to accelerate upward.
2. Otherwise, if it breaks below support at 806, we need to see whether there will be a quick V-reversal, or whether it will pull back even further. If it breaks below 806 again, going long again will only be after it pulls back to 806.
A-Xin believes the probability of a big pullback is low. After a modest consolidation, it will most likely break above 818 again, then continue pushing higher—aiming at 830, and possibly even spiking to 840–860 $BTC
196
·
--
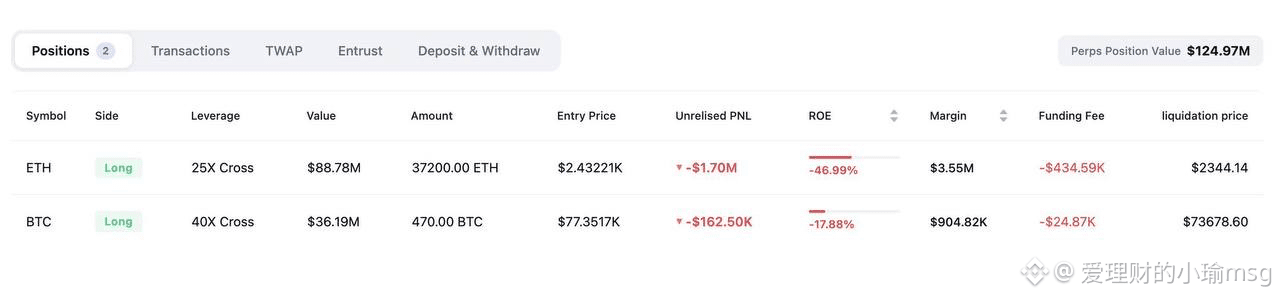
Just found out: today around 5 p.m., that bro’s position difference of over $100 million nearly got liquidated—
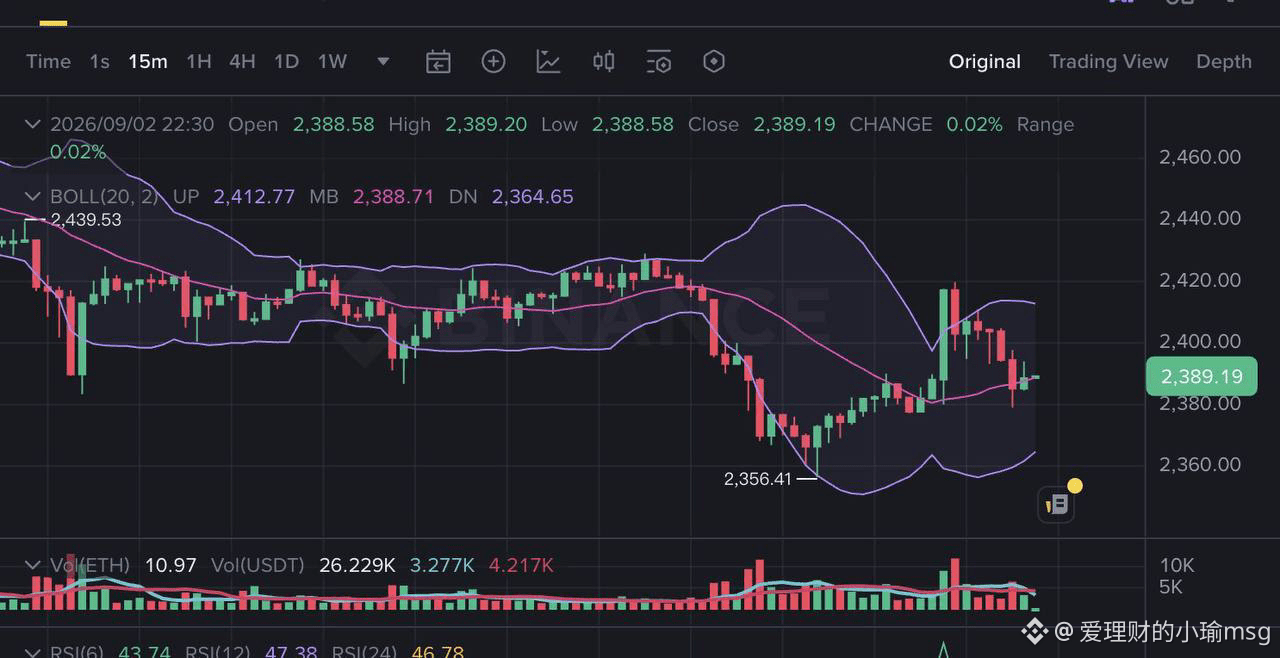
ETH wicked down to 2356, leaving only $16 between it and his liquidation line at 2340. Later the market rallied back and he finally caught his breath.
These days the oscillations haven’t eased for him at all; instead, he added more leverage. Now he has a total position of $124 million in value, including BTC.
The price still hasn’t fully left the danger zone. If he makes it through, it’ll be one more legend in the bull market; if not, it’ll be another sad story in crypto.
Just found out: today around 5 p.m., that bro’s position difference of over $100 million nearly got liquidated—
ETH wicked down to 2356, leaving only $16 between it and his liquidation line at 2340. Later the market rallied back and he finally caught his breath.
These days the oscillations haven’t eased for him at all; instead, he added more leverage. Now he has a total position of $124 million in value, including BTC.
The price still hasn’t fully left the danger zone. If he makes it through, it’ll be one more legend in the bull market; if not, it’ll be another sad story in crypto.
ETH wicked down to 2356, leaving only $16 between it and his liquidation line at 2340. Later the market rallied back and he finally caught his breath.
These days the oscillations haven’t eased for him at all; instead, he added more leverage. Now he has a total position of $124 million in value, including BTC.
The price still hasn’t fully left the danger zone. If he makes it through, it’ll be one more legend in the bull market; if not, it’ll be another sad story in crypto.
1
1.1k
·
--
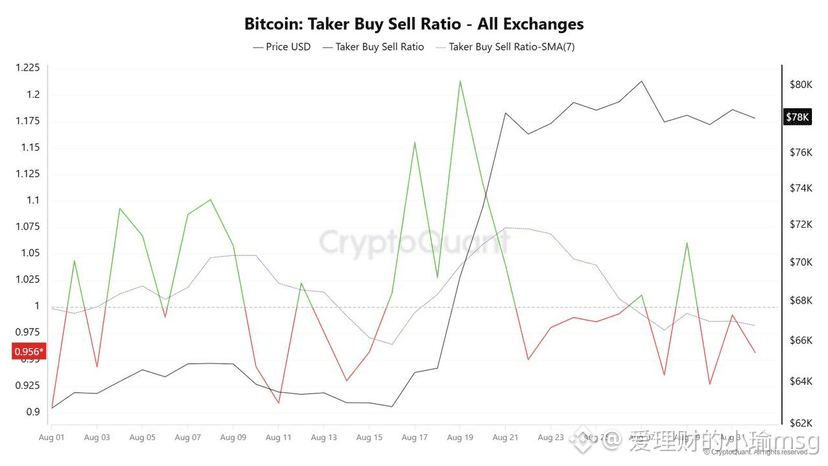
BTC fell from above $80,000 back to around $78,000. The active buy/sell ratio in the perpetual futures market dropped to 0.956, and the 7-day moving average has also fallen below 1.
This indicator measures the ratio of active buy volume to active sell volume in perpetual contracts.
Below 1 means that, recently, derivatives traders have executed more trades with market sell orders than market buys, implying a bearish bias in the short-term derivatives market.
However, it cannot determine on its own whether these sell orders come from newly opened short positions or from long traders actively closing their positions.
The former is usually accompanied by an increase in open interest, while the latter is more likely to coincide with a decline in open interest. The implications for the next move are therefore different.
So what we can confirm right now is:
During the BTC pullback, the sellers in the perpetual market were more aggressive. But to judge whether the shorts will continue adding exposure, you still need to consider open interest and the funding rate. If active selling remains dominant and open interest continues to rise, short-side pressure is more worth watching closely; if open interest falls, it looks more like long traders are de-leveraging.
BTC fell from above $80,000 back to around $78,000. The active buy/sell ratio in the perpetual futures market dropped to 0.956, and the 7-day moving average has also fallen below 1.
This indicator measures the ratio of active buy volume to active sell volume in perpetual contracts.
Below 1 means that, recently, derivatives traders have executed more trades with market sell orders than market buys, implying a bearish bias in the short-term derivatives market.
However, it cannot determine on its own whether these sell orders come from newly opened short positions or from long traders actively closing their positions.
The former is usually accompanied by an increase in open interest, while the latter is more likely to coincide with a decline in open interest. The implications for the next move are therefore different.
So what we can confirm right now is:
During the BTC pullback, the sellers in the perpetual market were more aggressive. But to judge whether the shorts will continue adding exposure, you still need to consider open interest and the funding rate. If active selling remains dominant and open interest continues to rise, short-side pressure is more worth watching closely; if open interest falls, it looks more like long traders are de-leveraging.
This indicator measures the ratio of active buy volume to active sell volume in perpetual contracts.
Below 1 means that, recently, derivatives traders have executed more trades with market sell orders than market buys, implying a bearish bias in the short-term derivatives market.
However, it cannot determine on its own whether these sell orders come from newly opened short positions or from long traders actively closing their positions.
The former is usually accompanied by an increase in open interest, while the latter is more likely to coincide with a decline in open interest. The implications for the next move are therefore different.
So what we can confirm right now is:
During the BTC pullback, the sellers in the perpetual market were more aggressive. But to judge whether the shorts will continue adding exposure, you still need to consider open interest and the funding rate. If active selling remains dominant and open interest continues to rise, short-side pressure is more worth watching closely; if open interest falls, it looks more like long traders are de-leveraging.
145
·
--
BTC Insights
1. Bitcoin holds support around $78,000 despite ETF outflows driven by macro factors, while corporate/enterprise accumulation totals as much as $513 million.
Key drivers
1. - **Institutional accumulation (High)**: MicroStrategy and Strive together purchased 6,403 BTC for a total of $513 million, highlighting strong absorption capacity from corporate balance sheets.
- **ETF inflows (High)**: U.S. spot Bitcoin ETFs recorded a net inflow of $924 million last week, indicating sustained institutional demand.
- **Technical breakout (Medium)**: Price remains above the $77,600 support level; MACD shows positive momentum, and RSI is in a neutral-to-bullish range (50-67).
Risk assessment
1. - **Macroeconomic headwinds (High)**: Fed officials made hawkish remarks on inflation control, strengthening the U.S. dollar and leading to $201.8 million in ETF outflows on Friday.
- **Supply resistance (Medium)**: Nearly 8% of Bitcoin’s supply was bought in the $80,000–$82,000 range, creating notable overhead resistance.
- **Illegal activity (Low)**: Reports indicate hackers may have shifted funds via derivatives platforms, which could negatively affect market sentiment.
A hawkish macro backdrop combined with heavy supply resistance near $80,000 creates substantial pressure on short-term upside.
#Bitcoin Holds Above $78,000 $BTC
BTC Insights
1. Bitcoin holds support around $78,000 despite ETF outflows driven by macro factors, while corporate/enterprise accumulation totals as much as $513 million.
Key drivers
1. - **Institutional accumulation (High)**: MicroStrategy and Strive together purchased 6,403 BTC for a total of $513 million, highlighting strong absorption capacity from corporate balance sheets.
- **ETF inflows (High)**: U.S. spot Bitcoin ETFs recorded a net inflow of $924 million last week, indicating sustained institutional demand.
- **Technical breakout (Medium)**: Price remains above the $77,600 support level; MACD shows positive momentum, and RSI is in a neutral-to-bullish range (50-67).
Risk assessment
1. - **Macroeconomic headwinds (High)**: Fed officials made hawkish remarks on inflation control, strengthening the U.S. dollar and leading to $201.8 million in ETF outflows on Friday.
- **Supply resistance (Medium)**: Nearly 8% of Bitcoin’s supply was bought in the $80,000–$82,000 range, creating notable overhead resistance.
- **Illegal activity (Low)**: Reports indicate hackers may have shifted funds via derivatives platforms, which could negatively affect market sentiment.
A hawkish macro backdrop combined with heavy supply resistance near $80,000 creates substantial pressure on short-term upside.
#Bitcoin Holds Above $78,000 $BTC
1. Bitcoin holds support around $78,000 despite ETF outflows driven by macro factors, while corporate/enterprise accumulation totals as much as $513 million.
Key drivers
1. - **Institutional accumulation (High)**: MicroStrategy and Strive together purchased 6,403 BTC for a total of $513 million, highlighting strong absorption capacity from corporate balance sheets.
- **ETF inflows (High)**: U.S. spot Bitcoin ETFs recorded a net inflow of $924 million last week, indicating sustained institutional demand.
- **Technical breakout (Medium)**: Price remains above the $77,600 support level; MACD shows positive momentum, and RSI is in a neutral-to-bullish range (50-67).
Risk assessment
1. - **Macroeconomic headwinds (High)**: Fed officials made hawkish remarks on inflation control, strengthening the U.S. dollar and leading to $201.8 million in ETF outflows on Friday.
- **Supply resistance (Medium)**: Nearly 8% of Bitcoin’s supply was bought in the $80,000–$82,000 range, creating notable overhead resistance.
- **Illegal activity (Low)**: Reports indicate hackers may have shifted funds via derivatives platforms, which could negatively affect market sentiment.
A hawkish macro backdrop combined with heavy supply resistance near $80,000 creates substantial pressure on short-term upside.
#Bitcoin Holds Above $78,000 $BTC
91
·
--
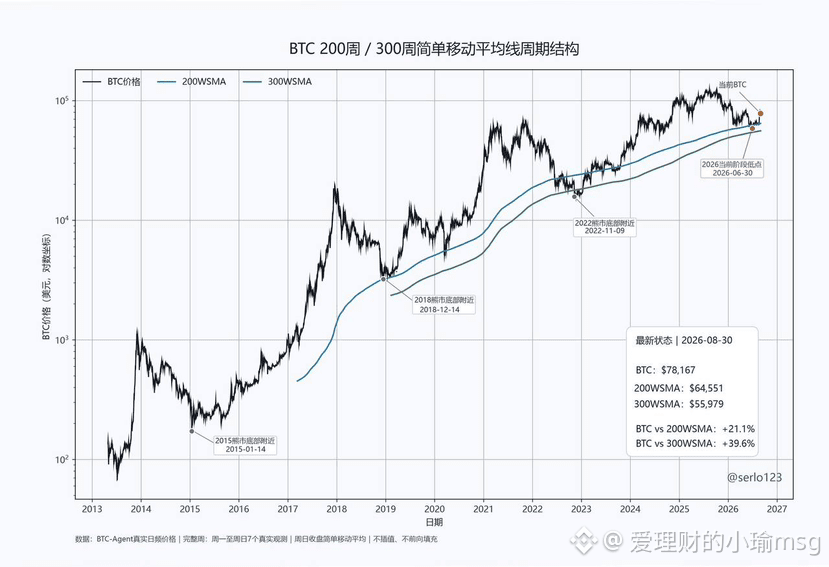
BTC is currently around $78,000, having widened its gap again from the 200-day and 300-day moving averages.
Currently, the 200-day MA is about $64,600 and the 300-day MA about $56,000. A month ago, the 200-day MA was around $63,000 and the 300-day MA about $55,000.
Historically: In the 2019 bear-market bottom, price stayed near the 200-day MA for about 11 days; in 2022, amid a Black Swan shock, it hovered in the 200-day MA–300-day MA zone for more than 200 days; and in this cycle, it has been near the 200-day MA for about 85 days.
From the long-cycle structure, we are currently in the recovery phase of late-bear / early-bull.
BTC is currently around $78,000, having widened its gap again from the 200-day and 300-day moving averages.
Currently, the 200-day MA is about $64,600 and the 300-day MA about $56,000. A month ago, the 200-day MA was around $63,000 and the 300-day MA about $55,000.
Historically: In the 2019 bear-market bottom, price stayed near the 200-day MA for about 11 days; in 2022, amid a Black Swan shock, it hovered in the 200-day MA–300-day MA zone for more than 200 days; and in this cycle, it has been near the 200-day MA for about 85 days.
From the long-cycle structure, we are currently in the recovery phase of late-bear / early-bull.
Currently, the 200-day MA is about $64,600 and the 300-day MA about $56,000. A month ago, the 200-day MA was around $63,000 and the 300-day MA about $55,000.
Historically: In the 2019 bear-market bottom, price stayed near the 200-day MA for about 11 days; in 2022, amid a Black Swan shock, it hovered in the 200-day MA–300-day MA zone for more than 200 days; and in this cycle, it has been near the 200-day MA for about 85 days.
From the long-cycle structure, we are currently in the recovery phase of late-bear / early-bull.
150
·
--
·
Zhao Changpeng appears in Hong Kong.
On August 27, when I saw this news, my first reaction wasn’t, “Zhao Changpeng has come to Hong Kong.”
Instead, I thought:
A person who was convicted by the United States, served four months in prison, was fined $4.3 billion, and was later pardoned by Trump—why on earth would he choose Hong Kong to hold a new book meet-and-greet?
This question is far more interesting than the mere fact that “Zhao Changpeng is in Hong Kong.”
The scene on site was also incredibly striking.
Zhao Changpeng walked into the Hong Kong Convention and Exhibition Centre, surrounded by a group of bodyguards, attending a reader meet-and-greet for 《Binance: The Life》.
If you rewind a few years, it’s almost unimaginable.
In 2023, he was hit with a hefty fine by the U.S. Department of Justice for failing to establish an effective anti-money-laundering mechanism, and he was sentenced to four months’ imprisonment.
In October 2025, Trump signed a pardon.
From a defendant in the U.S. Department of Justice—
to someone pardoned by the president.
Then, today, he stands at the Hong Kong Convention and Exhibition Centre surrounded by bodyguards, chatting with several hundred people about Web3.
Sometimes, real-life storylines are indeed more absurd than fiction.
But what I truly care about isn’t his legendary saga.
It’s why he chose Hong Kong.
At the event, Zhao Changpeng said:
“Life’s success depends eighty percent on choosing the right track, but the key is to get personally involved—if you don’t participate, there’s no chance.”
If someone else said this, it might just be inspirational fluff.
But when it comes out of Zhao Changpeng’s mouth, it’s a completely different matter.
He chose the right track, and he also went all in himself.
The price, of course, was four months of imprisonment and a $4.3 billion fine.
Yet in the end, he still returned to the game table.
And this time, he’s standing in Hong Kong.
His assessment of Hong Kong was also very direct:
“Web3 and Hong Kong are extremely tightly bound.”
He’s also bullish on Dubai, Abu Dhabi, and the United States as policies gradually warm up.
More importantly, he believes the crypto industry has already survived its coldest period.
And one of the directions worth watching closely next is RWA—tokenizing real-world assets.
In fact, this is far more important than “the founder of Binance coming to Hong Kong to hold a signing event.”
Because I’ve always believed that to judge whether an industry truly has staying power, you can’t just look at prices.
You need to see whether the people are still there, whether the money is still there, whether policy has left room, and whether entrepreneurs are bold enough to keep betting.
And this time, Zhao Changpeng chose Hong Kong
·
Zhao Changpeng appears in Hong Kong.
On August 27, when I saw this news, my first reaction wasn’t, “Zhao Changpeng has come to Hong Kong.”
Instead, I thought:
A person who was convicted by the United States, served four months in prison, was fined $4.3 billion, and was later pardoned by Trump—why on earth would he choose Hong Kong to hold a new book meet-and-greet?
This question is far more interesting than the mere fact that “Zhao Changpeng is in Hong Kong.”
The scene on site was also incredibly striking.
Zhao Changpeng walked into the Hong Kong Convention and Exhibition Centre, surrounded by a group of bodyguards, attending a reader meet-and-greet for 《Binance: The Life》.
If you rewind a few years, it’s almost unimaginable.
In 2023, he was hit with a hefty fine by the U.S. Department of Justice for failing to establish an effective anti-money-laundering mechanism, and he was sentenced to four months’ imprisonment.
In October 2025, Trump signed a pardon.
From a defendant in the U.S. Department of Justice—
to someone pardoned by the president.
Then, today, he stands at the Hong Kong Convention and Exhibition Centre surrounded by bodyguards, chatting with several hundred people about Web3.
Sometimes, real-life storylines are indeed more absurd than fiction.
But what I truly care about isn’t his legendary saga.
It’s why he chose Hong Kong.
At the event, Zhao Changpeng said:
“Life’s success depends eighty percent on choosing the right track, but the key is to get personally involved—if you don’t participate, there’s no chance.”
If someone else said this, it might just be inspirational fluff.
But when it comes out of Zhao Changpeng’s mouth, it’s a completely different matter.
He chose the right track, and he also went all in himself.
The price, of course, was four months of imprisonment and a $4.3 billion fine.
Yet in the end, he still returned to the game table.
And this time, he’s standing in Hong Kong.
His assessment of Hong Kong was also very direct:
“Web3 and Hong Kong are extremely tightly bound.”
He’s also bullish on Dubai, Abu Dhabi, and the United States as policies gradually warm up.
More importantly, he believes the crypto industry has already survived its coldest period.
And one of the directions worth watching closely next is RWA—tokenizing real-world assets.
In fact, this is far more important than “the founder of Binance coming to Hong Kong to hold a signing event.”
Because I’ve always believed that to judge whether an industry truly has staying power, you can’t just look at prices.
You need to see whether the people are still there, whether the money is still there, whether policy has left room, and whether entrepreneurs are bold enough to keep betting.
And this time, Zhao Changpeng chose Hong Kong
Zhao Changpeng appears in Hong Kong.
On August 27, when I saw this news, my first reaction wasn’t, “Zhao Changpeng has come to Hong Kong.”
Instead, I thought:
A person who was convicted by the United States, served four months in prison, was fined $4.3 billion, and was later pardoned by Trump—why on earth would he choose Hong Kong to hold a new book meet-and-greet?
This question is far more interesting than the mere fact that “Zhao Changpeng is in Hong Kong.”
The scene on site was also incredibly striking.
Zhao Changpeng walked into the Hong Kong Convention and Exhibition Centre, surrounded by a group of bodyguards, attending a reader meet-and-greet for 《Binance: The Life》.
If you rewind a few years, it’s almost unimaginable.
In 2023, he was hit with a hefty fine by the U.S. Department of Justice for failing to establish an effective anti-money-laundering mechanism, and he was sentenced to four months’ imprisonment.
In October 2025, Trump signed a pardon.
From a defendant in the U.S. Department of Justice—
to someone pardoned by the president.
Then, today, he stands at the Hong Kong Convention and Exhibition Centre surrounded by bodyguards, chatting with several hundred people about Web3.
Sometimes, real-life storylines are indeed more absurd than fiction.
But what I truly care about isn’t his legendary saga.
It’s why he chose Hong Kong.
At the event, Zhao Changpeng said:
“Life’s success depends eighty percent on choosing the right track, but the key is to get personally involved—if you don’t participate, there’s no chance.”
If someone else said this, it might just be inspirational fluff.
But when it comes out of Zhao Changpeng’s mouth, it’s a completely different matter.
He chose the right track, and he also went all in himself.
The price, of course, was four months of imprisonment and a $4.3 billion fine.
Yet in the end, he still returned to the game table.
And this time, he’s standing in Hong Kong.
His assessment of Hong Kong was also very direct:
“Web3 and Hong Kong are extremely tightly bound.”
He’s also bullish on Dubai, Abu Dhabi, and the United States as policies gradually warm up.
More importantly, he believes the crypto industry has already survived its coldest period.
And one of the directions worth watching closely next is RWA—tokenizing real-world assets.
In fact, this is far more important than “the founder of Binance coming to Hong Kong to hold a signing event.”
Because I’ve always believed that to judge whether an industry truly has staying power, you can’t just look at prices.
You need to see whether the people are still there, whether the money is still there, whether policy has left room, and whether entrepreneurs are bold enough to keep betting.
And this time, Zhao Changpeng chose Hong Kong

1
1.7k
·
--
Jing Tian’s biggest problem is that she’s trapped in short-term trading mindsets.
She hasn’t really gone deep into the fundamentals of the underlying assets behind the trading; instead, she’s obsessed with making quick money through short-term trades.
When you look at it over a longer time, it’s like losing the man and the wife…
If she had studied Sun Yuchen properly and switched to a long-term perspective, the outcome might have been completely different.
By choosing deep ties—marriage, having children—children naturally gain rights to inherit assets. Then, it won’t just be about fighting for fifty million USD; there’s a real chance to compete for five hundred million as well.
Whether you’re a celebrity or an ordinary person, true wealth in essence is the monetization of one’s cognition.
Short-term games and one-off deals can’t last forever. Understanding long-term trends and becoming friends with time—that’s the real path.
Jing Tian’s biggest problem is that she’s trapped in short-term trading mindsets.
She hasn’t really gone deep into the fundamentals of the underlying assets behind the trading; instead, she’s obsessed with making quick money through short-term trades.
When you look at it over a longer time, it’s like losing the man and the wife…
If she had studied Sun Yuchen properly and switched to a long-term perspective, the outcome might have been completely different.
By choosing deep ties—marriage, having children—children naturally gain rights to inherit assets. Then, it won’t just be about fighting for fifty million USD; there’s a real chance to compete for five hundred million as well.
Whether you’re a celebrity or an ordinary person, true wealth in essence is the monetization of one’s cognition.
Short-term games and one-off deals can’t last forever. Understanding long-term trends and becoming friends with time—that’s the real path.
She hasn’t really gone deep into the fundamentals of the underlying assets behind the trading; instead, she’s obsessed with making quick money through short-term trades.
When you look at it over a longer time, it’s like losing the man and the wife…
If she had studied Sun Yuchen properly and switched to a long-term perspective, the outcome might have been completely different.
By choosing deep ties—marriage, having children—children naturally gain rights to inherit assets. Then, it won’t just be about fighting for fifty million USD; there’s a real chance to compete for five hundred million as well.
Whether you’re a celebrity or an ordinary person, true wealth in essence is the monetization of one’s cognition.
Short-term games and one-off deals can’t last forever. Understanding long-term trends and becoming friends with time—that’s the real path.

1
83
·
--
This round of U.S. sanctions on Iran marks a shift—from “sanctioning Iran” to “sanctioning those who do business with Iran.”
The new measures are now in place:
Cryptocurrencies, gold, technology, aviation, and shipping are all included.
More importantly, the U.S. has started directly pressuring third countries:
If they continue to maintain financial and economic ties with Iran, they could face secondary sanctions—possibly even being cut off from the U.S. financial system.
Companies from China have already appeared on the list, along with Asian trade networks.
But today the reaction in crude oil has been pretty unusual.
By logic, as sanctions escalate and supply risks rise, oil prices should go up.
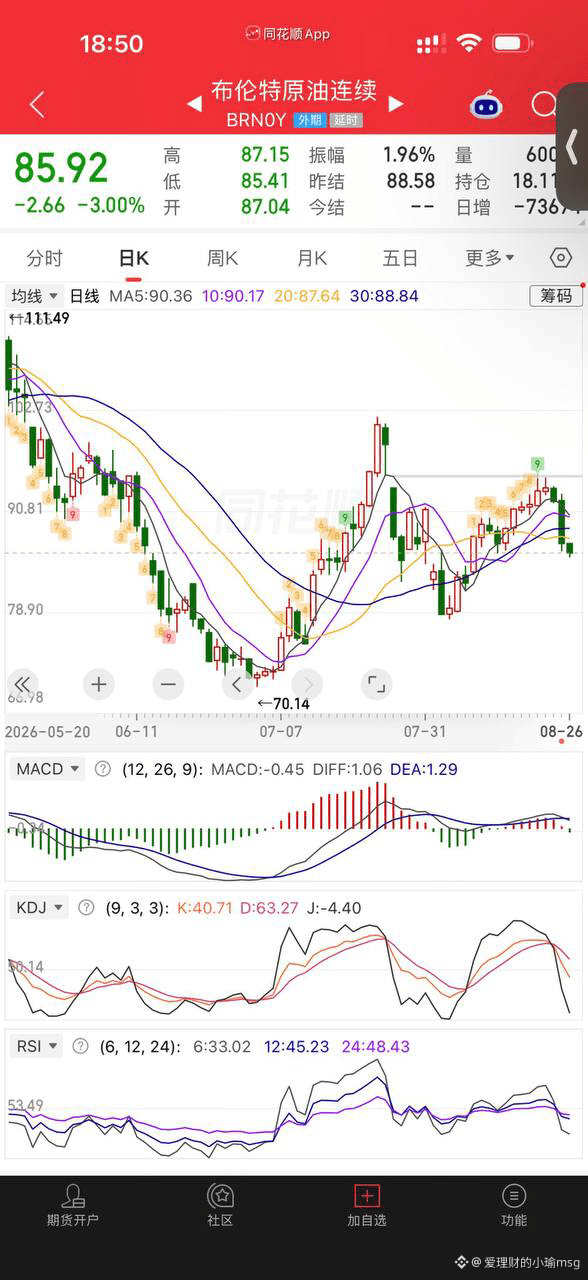
Instead, Brent fell directly by 3.9% yesterday, and today it continues to drop, hovering around $86.
The market seems to be betting that:
The U.S. isn’t planning to keep relying on force to resolve the Hormuz issue.
Next, it will use sanctions and negotiations to pressure Iran into handing over the shipping lanes.
Should we buy the dip on VOO tonight? 🤔
This round of U.S. sanctions on Iran marks a shift—from “sanctioning Iran” to “sanctioning those who do business with Iran.”
The new measures are now in place:
Cryptocurrencies, gold, technology, aviation, and shipping are all included.
More importantly, the U.S. has started directly pressuring third countries:
If they continue to maintain financial and economic ties with Iran, they could face secondary sanctions—possibly even being cut off from the U.S. financial system.
Companies from China have already appeared on the list, along with Asian trade networks.
But today the reaction in crude oil has been pretty unusual.
By logic, as sanctions escalate and supply risks rise, oil prices should go up.
Instead, Brent fell directly by 3.9% yesterday, and today it continues to drop, hovering around $86.
The market seems to be betting that:
The U.S. isn’t planning to keep relying on force to resolve the Hormuz issue.
Next, it will use sanctions and negotiations to pressure Iran into handing over the shipping lanes.
Should we buy the dip on VOO tonight? 🤔
The new measures are now in place:
Cryptocurrencies, gold, technology, aviation, and shipping are all included.
More importantly, the U.S. has started directly pressuring third countries:
If they continue to maintain financial and economic ties with Iran, they could face secondary sanctions—possibly even being cut off from the U.S. financial system.
Companies from China have already appeared on the list, along with Asian trade networks.
But today the reaction in crude oil has been pretty unusual.
By logic, as sanctions escalate and supply risks rise, oil prices should go up.
Instead, Brent fell directly by 3.9% yesterday, and today it continues to drop, hovering around $86.
The market seems to be betting that:
The U.S. isn’t planning to keep relying on force to resolve the Hormuz issue.
Next, it will use sanctions and negotiations to pressure Iran into handing over the shipping lanes.
Should we buy the dip on VOO tonight? 🤔
BZ-2.70%
VOOETF+0.80%
355
·
--
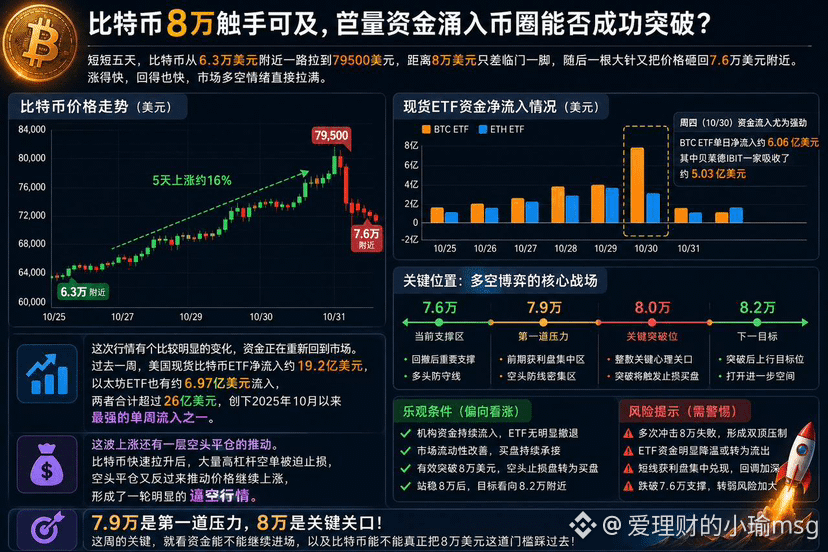
Bitcoin at 80,000 is within reach—will the massive inflow of funds into the crypto market succeed in breaking through?
In just five days, Bitcoin surged from around $63,000 to $79,500. It’s only a step away from $80,000. Then, a long bearish wick pulled the price back to around $76,000. The move up has been fast, and the pullback has been just as quick—bull and bear sentiment has been pushed to the max in the market.
But this rally has a clear change: capital is returning to the market. In the past week, U.S. spot Bitcoin ETFs recorded net inflows of about $1.92 billion, and Ethereum ETFs saw roughly $697 million in inflows as well. Combined, they exceeded $2.6 billion—one of the strongest single-week inflow periods since October 2025.
Thursday’s flows were especially dramatic. On that day, BTC ETF net inflows were about $606 million, and BlackRock’s IBIT alone absorbed around $503 million. Not long ago, ETFs had been in sustained outflows, but institutional money suddenly accelerated its entry. This shift is definitely worth paying attention to.
This upswing also has another driver: short sellers covering. After Bitcoin quickly spiked upward, many high-leverage short positions were forced to cut losses. Then short covering, in turn, pushed the price higher again—creating an obvious short-squeeze rally.
Now the most critical zone is around $79,000 to $80,000. There are both earlier profit-taking orders here and a large number of short positions waiting to break through. If buy-side demand can continue to absorb this selling pressure, once Bitcoin breaks above $80,000, short sellers’ stop-losses could further turn into new buying momentum.
Of course, breaking $80,000 won’t be easy. If several consecutive attempts fail and price is repeatedly pushed back down, and ETF inflows start to visibly cool off, then it’s worth watching for concentrated profit-taking on the short term.
So far, it doesn’t look like institutions have clearly pulled out, and market liquidity is improving. Therefore, I’m still relatively optimistic about the short term. $79,000 is the first resistance level, and $80,000 is the key threshold. Once Bitcoin holds above it effectively, the next target could be around $82,000.
The key this week is whether money can keep flowing in—and whether Bitcoin can truly step over the $80,000 barrier.
Bitcoin at 80,000 is within reach—will the massive inflow of funds into the crypto market succeed in breaking through?
In just five days, Bitcoin surged from around $63,000 to $79,500. It’s only a step away from $80,000. Then, a long bearish wick pulled the price back to around $76,000. The move up has been fast, and the pullback has been just as quick—bull and bear sentiment has been pushed to the max in the market.
But this rally has a clear change: capital is returning to the market. In the past week, U.S. spot Bitcoin ETFs recorded net inflows of about $1.92 billion, and Ethereum ETFs saw roughly $697 million in inflows as well. Combined, they exceeded $2.6 billion—one of the strongest single-week inflow periods since October 2025.
Thursday’s flows were especially dramatic. On that day, BTC ETF net inflows were about $606 million, and BlackRock’s IBIT alone absorbed around $503 million. Not long ago, ETFs had been in sustained outflows, but institutional money suddenly accelerated its entry. This shift is definitely worth paying attention to.
This upswing also has another driver: short sellers covering. After Bitcoin quickly spiked upward, many high-leverage short positions were forced to cut losses. Then short covering, in turn, pushed the price higher again—creating an obvious short-squeeze rally.
Now the most critical zone is around $79,000 to $80,000. There are both earlier profit-taking orders here and a large number of short positions waiting to break through. If buy-side demand can continue to absorb this selling pressure, once Bitcoin breaks above $80,000, short sellers’ stop-losses could further turn into new buying momentum.
Of course, breaking $80,000 won’t be easy. If several consecutive attempts fail and price is repeatedly pushed back down, and ETF inflows start to visibly cool off, then it’s worth watching for concentrated profit-taking on the short term.
So far, it doesn’t look like institutions have clearly pulled out, and market liquidity is improving. Therefore, I’m still relatively optimistic about the short term. $79,000 is the first resistance level, and $80,000 is the key threshold. Once Bitcoin holds above it effectively, the next target could be around $82,000.
The key this week is whether money can keep flowing in—and whether Bitcoin can truly step over the $80,000 barrier.
In just five days, Bitcoin surged from around $63,000 to $79,500. It’s only a step away from $80,000. Then, a long bearish wick pulled the price back to around $76,000. The move up has been fast, and the pullback has been just as quick—bull and bear sentiment has been pushed to the max in the market.
But this rally has a clear change: capital is returning to the market. In the past week, U.S. spot Bitcoin ETFs recorded net inflows of about $1.92 billion, and Ethereum ETFs saw roughly $697 million in inflows as well. Combined, they exceeded $2.6 billion—one of the strongest single-week inflow periods since October 2025.
Thursday’s flows were especially dramatic. On that day, BTC ETF net inflows were about $606 million, and BlackRock’s IBIT alone absorbed around $503 million. Not long ago, ETFs had been in sustained outflows, but institutional money suddenly accelerated its entry. This shift is definitely worth paying attention to.
This upswing also has another driver: short sellers covering. After Bitcoin quickly spiked upward, many high-leverage short positions were forced to cut losses. Then short covering, in turn, pushed the price higher again—creating an obvious short-squeeze rally.
Now the most critical zone is around $79,000 to $80,000. There are both earlier profit-taking orders here and a large number of short positions waiting to break through. If buy-side demand can continue to absorb this selling pressure, once Bitcoin breaks above $80,000, short sellers’ stop-losses could further turn into new buying momentum.
Of course, breaking $80,000 won’t be easy. If several consecutive attempts fail and price is repeatedly pushed back down, and ETF inflows start to visibly cool off, then it’s worth watching for concentrated profit-taking on the short term.
So far, it doesn’t look like institutions have clearly pulled out, and market liquidity is improving. Therefore, I’m still relatively optimistic about the short term. $79,000 is the first resistance level, and $80,000 is the key threshold. Once Bitcoin holds above it effectively, the next target could be around $82,000.
The key this week is whether money can keep flowing in—and whether Bitcoin can truly step over the $80,000 barrier.
115
·
--
Will Bitcoin rise to $4 million?
After a meeting at the White House, the Coinbase CEO started “painting pictures” right away!
He said the direction of U.S. legislation is on the right track, predicting that by 2030 Bitcoin could surge to $3–4 million—he even got so excited he went on TV to call the order.
Trump is pushing the Clarity Act, and Bitcoin immediately jumped 10%, breaking above $72,000. This policy-market play is really smooth.
But it’s taken this bill so long—banks and the crypto industry have started fighting over stablecoin yield, fearing deposit outflows, so they’ve been vigorously obstructing it.
And the CEO even said banks also approve the legislation—where does that confidence come from?
I think it’s the butt deciding the brain.
With the September vote coming soon, how long has the crypto world been waiting for this framework? Don’t delay it again and leave people with another round of empty excitement.
Will Bitcoin rise to $4 million?
After a meeting at the White House, the Coinbase CEO started “painting pictures” right away!
He said the direction of U.S. legislation is on the right track, predicting that by 2030 Bitcoin could surge to $3–4 million—he even got so excited he went on TV to call the order.
Trump is pushing the Clarity Act, and Bitcoin immediately jumped 10%, breaking above $72,000. This policy-market play is really smooth.
But it’s taken this bill so long—banks and the crypto industry have started fighting over stablecoin yield, fearing deposit outflows, so they’ve been vigorously obstructing it.
And the CEO even said banks also approve the legislation—where does that confidence come from?
I think it’s the butt deciding the brain.
With the September vote coming soon, how long has the crypto world been waiting for this framework? Don’t delay it again and leave people with another round of empty excitement.
After a meeting at the White House, the Coinbase CEO started “painting pictures” right away!
He said the direction of U.S. legislation is on the right track, predicting that by 2030 Bitcoin could surge to $3–4 million—he even got so excited he went on TV to call the order.
Trump is pushing the Clarity Act, and Bitcoin immediately jumped 10%, breaking above $72,000. This policy-market play is really smooth.
But it’s taken this bill so long—banks and the crypto industry have started fighting over stablecoin yield, fearing deposit outflows, so they’ve been vigorously obstructing it.
And the CEO even said banks also approve the legislation—where does that confidence come from?
I think it’s the butt deciding the brain.
With the September vote coming soon, how long has the crypto world been waiting for this framework? Don’t delay it again and leave people with another round of empty excitement.

219
·
--
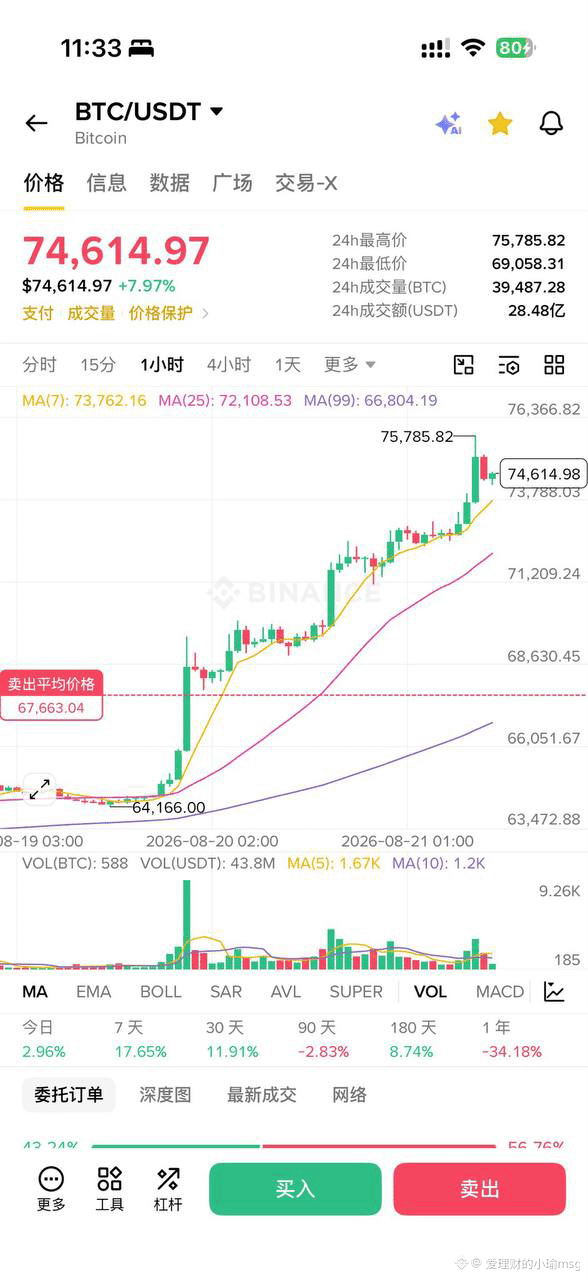
Let’s talk about why BTC has surged recently?
This BTC breakout has been driven by a very important catalyst: U.S. Treasury yields.
But it’s not as simple as “Treasuries fall → BTC rises.” The real logic is:
The U.S. Treasury has started proactively repurchasing long-dated Treasuries → expectations for lower yields on the long end of the curve → a weaker U.S. dollar → marginal easing of financial conditions → repricing of non-sovereign assets like BTC and gold
Over the past few days, the market has already priced this logic directly.
On August 19, the U.S. Treasury announced that the scale of long-term Treasury buybacks would be increased from roughly $2 billion per operation to $4 billion. After the news broke, yields on the long end of Treasuries fell by around 10 bps at one point, while the dollar weakened. BTC and gold rose in sync.
So this sudden increase in long-bond buybacks from the Treasury, at its core, is a signal to the market:
The U.S. government doesn’t want long-term interest rates to keep running out of control.
And that’s why the market started trading “long-end yields topping out / improving financial conditions.”
More importantly, the dollar is also falling.
This is, in my view, the most important piece of this BTC rally.
Right now, the U.S. Dollar Index (DXY) has dropped to around 98.7, hitting a three-month low.
So what’s actually happening now is a very typical combination:
Long-end Treasury yields ↓ + DXY ↓ + BTC ↑ + Gold ↑
This matters far more than BTC rising on its own.
Because it shows the market is not trading a mere “normal crypto narrative,” but rather:
a decline in the actual attractiveness of dollar assets.
That’s why gold and BTC are both strengthening.
Short term: very bullish for BTC.
Long term: you still can’t directly interpret this as “the Fed has started easing aggressively.”
If the 10-year Treasury yield keeps falling below 4.7%, BTC could rise further
Let’s talk about why BTC has surged recently?
This BTC breakout has been driven by a very important catalyst: U.S. Treasury yields.
But it’s not as simple as “Treasuries fall → BTC rises.” The real logic is:
The U.S. Treasury has started proactively repurchasing long-dated Treasuries → expectations for lower yields on the long end of the curve → a weaker U.S. dollar → marginal easing of financial conditions → repricing of non-sovereign assets like BTC and gold
Over the past few days, the market has already priced this logic directly.
On August 19, the U.S. Treasury announced that the scale of long-term Treasury buybacks would be increased from roughly $2 billion per operation to $4 billion. After the news broke, yields on the long end of Treasuries fell by around 10 bps at one point, while the dollar weakened. BTC and gold rose in sync.
So this sudden increase in long-bond buybacks from the Treasury, at its core, is a signal to the market:
The U.S. government doesn’t want long-term interest rates to keep running out of control.
And that’s why the market started trading “long-end yields topping out / improving financial conditions.”
More importantly, the dollar is also falling.
This is, in my view, the most important piece of this BTC rally.
Right now, the U.S. Dollar Index (DXY) has dropped to around 98.7, hitting a three-month low.
So what’s actually happening now is a very typical combination:
Long-end Treasury yields ↓ + DXY ↓ + BTC ↑ + Gold ↑
This matters far more than BTC rising on its own.
Because it shows the market is not trading a mere “normal crypto narrative,” but rather:
a decline in the actual attractiveness of dollar assets.
That’s why gold and BTC are both strengthening.
Short term: very bullish for BTC.
Long term: you still can’t directly interpret this as “the Fed has started easing aggressively.”
If the 10-year Treasury yield keeps falling below 4.7%, BTC could rise further
This BTC breakout has been driven by a very important catalyst: U.S. Treasury yields.
But it’s not as simple as “Treasuries fall → BTC rises.” The real logic is:
The U.S. Treasury has started proactively repurchasing long-dated Treasuries → expectations for lower yields on the long end of the curve → a weaker U.S. dollar → marginal easing of financial conditions → repricing of non-sovereign assets like BTC and gold
Over the past few days, the market has already priced this logic directly.
On August 19, the U.S. Treasury announced that the scale of long-term Treasury buybacks would be increased from roughly $2 billion per operation to $4 billion. After the news broke, yields on the long end of Treasuries fell by around 10 bps at one point, while the dollar weakened. BTC and gold rose in sync.
So this sudden increase in long-bond buybacks from the Treasury, at its core, is a signal to the market:
The U.S. government doesn’t want long-term interest rates to keep running out of control.
And that’s why the market started trading “long-end yields topping out / improving financial conditions.”
More importantly, the dollar is also falling.
This is, in my view, the most important piece of this BTC rally.
Right now, the U.S. Dollar Index (DXY) has dropped to around 98.7, hitting a three-month low.
So what’s actually happening now is a very typical combination:
Long-end Treasury yields ↓ + DXY ↓ + BTC ↑ + Gold ↑
This matters far more than BTC rising on its own.
Because it shows the market is not trading a mere “normal crypto narrative,” but rather:
a decline in the actual attractiveness of dollar assets.
That’s why gold and BTC are both strengthening.
Short term: very bullish for BTC.
Long term: you still can’t directly interpret this as “the Fed has started easing aggressively.”
If the 10-year Treasury yield keeps falling below 4.7%, BTC could rise further
1
313
·
--
It's Wednesday.
Tonight, CPI.
As for the big pie ($BTC), whether it goes up or down depends on today.
Today is about to break—i.e., a turning point.
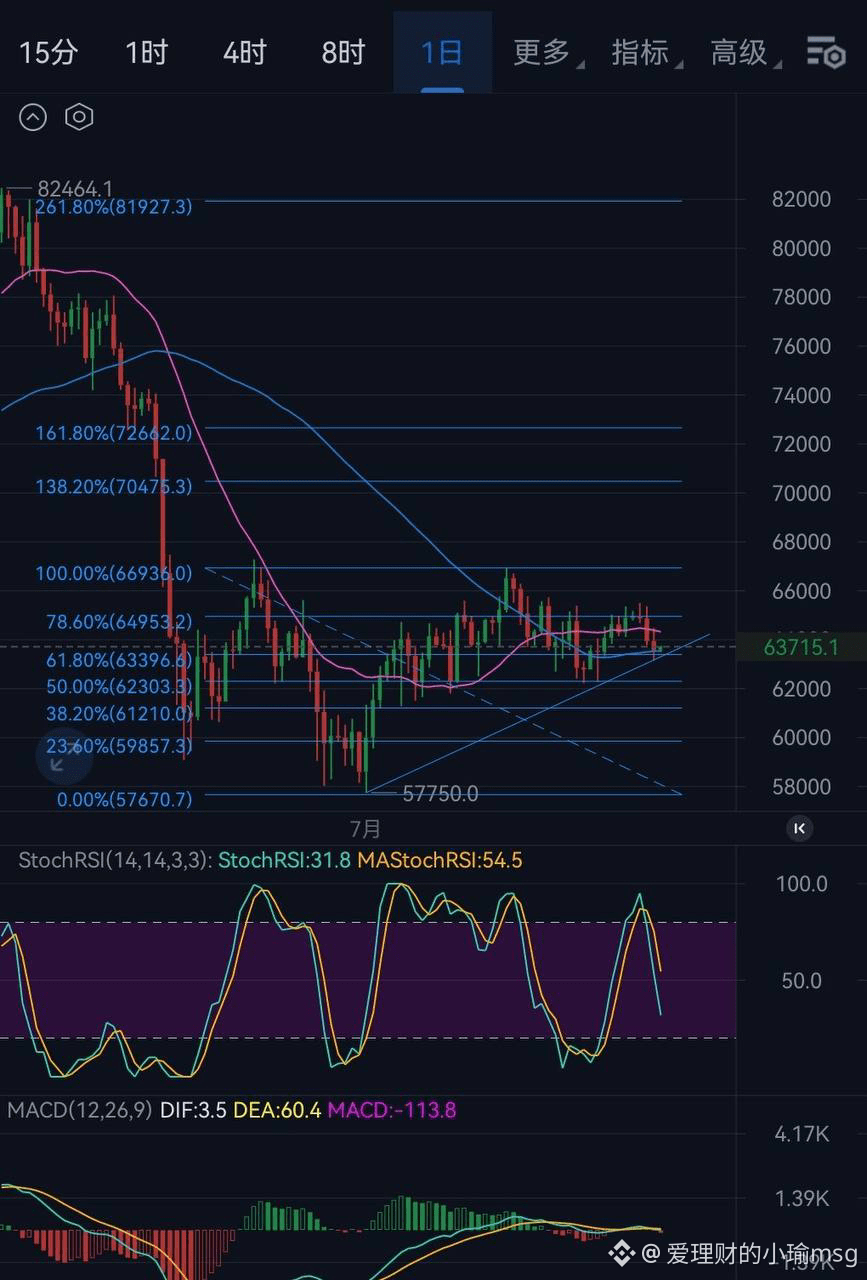
On the daily chart, the Macd fast line and slow line.
They keep grinding back and forth around the zero axis.
Yesterday, the big pie pulled back to the Fibonacci golden ratio 0.618.
There’s also a trendline in the area below.
Use this point as the reference.
If today’s CPI is good news, it should rocket.
If it’s bad news, it should break through and fall.
Judging solely by the current technical setup, it’s still biased to the upside.
For BTC and ETH: looking at the 2-day moving average line.
The advantage is ETH.
Pushing forward with slow consolidation along the MA23 on the 2-day line.
It's Wednesday.
Tonight, CPI.
As for the big pie ($BTC), whether it goes up or down depends on today.
Today is about to break—i.e., a turning point.
On the daily chart, the Macd fast line and slow line.
They keep grinding back and forth around the zero axis.
Yesterday, the big pie pulled back to the Fibonacci golden ratio 0.618.
There’s also a trendline in the area below.
Use this point as the reference.
If today’s CPI is good news, it should rocket.
If it’s bad news, it should break through and fall.
Judging solely by the current technical setup, it’s still biased to the upside.
For BTC and ETH: looking at the 2-day moving average line.
The advantage is ETH.
Pushing forward with slow consolidation along the MA23 on the 2-day line.
Tonight, CPI.
As for the big pie ($BTC), whether it goes up or down depends on today.
Today is about to break—i.e., a turning point.
On the daily chart, the Macd fast line and slow line.
They keep grinding back and forth around the zero axis.
Yesterday, the big pie pulled back to the Fibonacci golden ratio 0.618.
There’s also a trendline in the area below.
Use this point as the reference.
If today’s CPI is good news, it should rocket.
If it’s bad news, it should break through and fall.
Judging solely by the current technical setup, it’s still biased to the upside.
For BTC and ETH: looking at the 2-day moving average line.
The advantage is ETH.
Pushing forward with slow consolidation along the MA23 on the 2-day line.
83
·
--
Let’s talk about our view on gold: the short- to mid-term bottom has already emerged, and you can look for opportunities to rebound
In June/July, expectations for the Fed to raise rates surged; at one point the market priced in a 100% chance of a rate hike in September, which pushed gold to its low.
And now, there are two main reasons that have led gold to bottom and rebound:
1️⃣ Rate-cut expectations have rebounded
The non-farm employment data came in weak, increasing the probability of a rate cut in September. The market’s panic-driven rate hikes earlier in the year are no longer factors that can counterbalance gold.
When market expectations for rate hikes are at their peak, gold happened to bottom in July.
2️⃣ Central banks are buying gold again (Chart 2)
Central banks around the world are also buying low and selling high in gold cycles. You can see that global central banks’ gold reserves showed very little increase when gold was at high levels late last year and early this year.
But in June–July, when gold was at low levels, the increment jumped significantly.
So gold prices around $4,000 in June–July are extremely cost-effective.
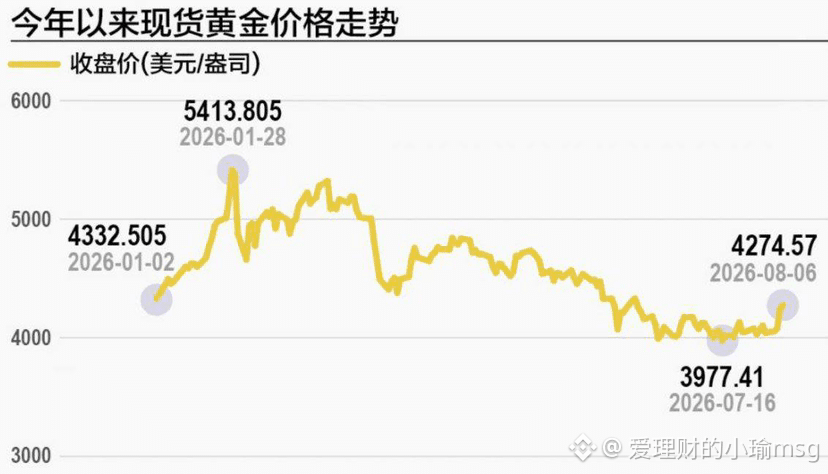
3️⃣ Analyzing from candlestick charts (Chart 3)
In January–February this year, gold saw daily declines of more than 20%, creating a very clear “pin” (wick).
The level of this pin is 4,050, and in the past two months gold has continued to trade in a tight range around 4,050.
In a bull market trend, the low point of a sharp selloff often provides strong support, and since price has consolidated around this level for a long time, its support is even stronger.
So if the best entry point to get into gold is around 4,050.
At present, gold is still mainly a trading (range) play (taking profit at 4,800 is appropriate). I don’t think it can break into new highs. If you chase gold only after it breaks 4,400, the cost-effectiveness drops a lot.
Let’s talk about our view on gold: the short- to mid-term bottom has already emerged, and you can look for opportunities to rebound
In June/July, expectations for the Fed to raise rates surged; at one point the market priced in a 100% chance of a rate hike in September, which pushed gold to its low.
And now, there are two main reasons that have led gold to bottom and rebound:
1️⃣ Rate-cut expectations have rebounded
The non-farm employment data came in weak, increasing the probability of a rate cut in September. The market’s panic-driven rate hikes earlier in the year are no longer factors that can counterbalance gold.
When market expectations for rate hikes are at their peak, gold happened to bottom in July.
2️⃣ Central banks are buying gold again (Chart 2)
Central banks around the world are also buying low and selling high in gold cycles. You can see that global central banks’ gold reserves showed very little increase when gold was at high levels late last year and early this year.
But in June–July, when gold was at low levels, the increment jumped significantly.
So gold prices around $4,000 in June–July are extremely cost-effective.
3️⃣ Analyzing from candlestick charts (Chart 3)
In January–February this year, gold saw daily declines of more than 20%, creating a very clear “pin” (wick).
The level of this pin is 4,050, and in the past two months gold has continued to trade in a tight range around 4,050.
In a bull market trend, the low point of a sharp selloff often provides strong support, and since price has consolidated around this level for a long time, its support is even stronger.
So if the best entry point to get into gold is around 4,050.
At present, gold is still mainly a trading (range) play (taking profit at 4,800 is appropriate). I don’t think it can break into new highs. If you chase gold only after it breaks 4,400, the cost-effectiveness drops a lot.
In June/July, expectations for the Fed to raise rates surged; at one point the market priced in a 100% chance of a rate hike in September, which pushed gold to its low.
And now, there are two main reasons that have led gold to bottom and rebound:
1️⃣ Rate-cut expectations have rebounded
The non-farm employment data came in weak, increasing the probability of a rate cut in September. The market’s panic-driven rate hikes earlier in the year are no longer factors that can counterbalance gold.
When market expectations for rate hikes are at their peak, gold happened to bottom in July.
2️⃣ Central banks are buying gold again (Chart 2)
Central banks around the world are also buying low and selling high in gold cycles. You can see that global central banks’ gold reserves showed very little increase when gold was at high levels late last year and early this year.
But in June–July, when gold was at low levels, the increment jumped significantly.
So gold prices around $4,000 in June–July are extremely cost-effective.
3️⃣ Analyzing from candlestick charts (Chart 3)
In January–February this year, gold saw daily declines of more than 20%, creating a very clear “pin” (wick).
The level of this pin is 4,050, and in the past two months gold has continued to trade in a tight range around 4,050.
In a bull market trend, the low point of a sharp selloff often provides strong support, and since price has consolidated around this level for a long time, its support is even stronger.
So if the best entry point to get into gold is around 4,050.
At present, gold is still mainly a trading (range) play (taking profit at 4,800 is appropriate). I don’t think it can break into new highs. If you chase gold only after it breaks 4,400, the cost-effectiveness drops a lot.
95
·
--
What’s most worth paying attention to in BTC right now isn’t how much it’s risen, but the fact that more and more bearish news is getting absorbed and can’t push it down.
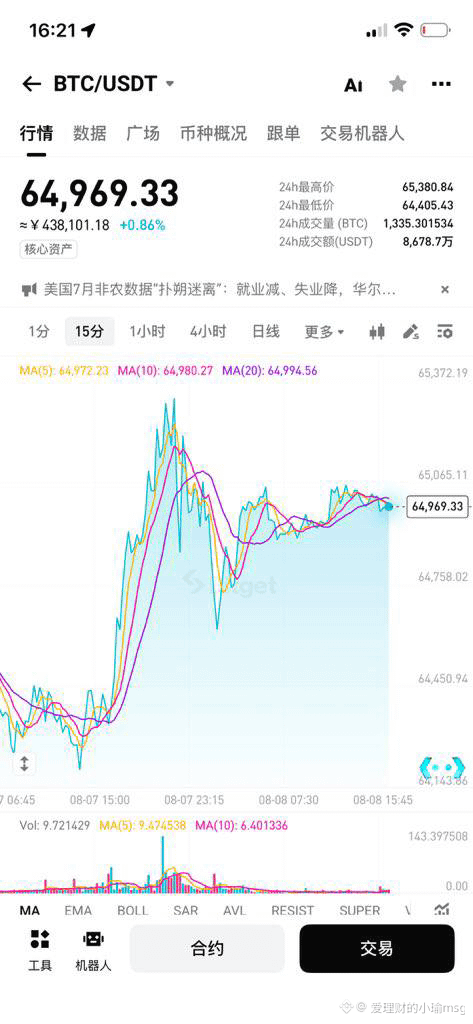
The CLARITY Act has been postponed to September, and regulatory catalysts failed to materialize—but BTC is still holding around $65,000.
More importantly, the money is still coming in.
This week, net inflows into US spot BTC ETFs were about $755 million, potentially making it one of the best-performing weeks since April.
On-chain, the picture is just as clear: since July 29, whales holding 10–10,000 BTC have accumulated more than 20,000 additional BTC, worth roughly $1.2 billion.
ETFs are buying, and whales are also buying—but the price hasn’t risen noticeably yet.
That’s actually the core reason why I’m currently leaning bullish.
Because bottoms often aren’t formed by big money buying all at once and then prices blasting higher immediately. Instead, it’s usually:
Accumulation of funds → price goes sideways → retail investors lose patience → floating supply decreases → and only then does the market choose a direction.
And macro conditions are starting to cooperate too.
July’s US non-farm payrolls unexpectedly fell by 23,000, and employment has clearly cooled. If subsequent data keeps weakening, pressure from interest rates and the US dollar would ease—naturally benefiting a high-beta asset like BTC.
That said, I won’t directly call for a bull market restart right now.
Next, the key is $65K–$66K.
If it breaks out with volume and holds above that level, I’ll continue to watch $68K–$70K. If ETF inflows weaken and BTC slips back below $62K–$63K, then we’ll need to reassess.
So my view is very clear right now:
Choppy trading in the short term, moderately bullish in the medium term; don’t chase—watch pullbacks and add in batches.
The CLARITY postponement only pushes the catalyst further out; it hasn’t changed the fact that capital is flowing back in.
The real thing worth worrying about is never simply that “bad news appears,”
but that “good news gets nobody to buy.”
And right now, it’s actually the opposite—
The news isn’t great, but the money has already started to come back.
What’s most worth paying attention to in BTC right now isn’t how much it’s risen, but the fact that more and more bearish news is getting absorbed and can’t push it down.
The CLARITY Act has been postponed to September, and regulatory catalysts failed to materialize—but BTC is still holding around $65,000.
More importantly, the money is still coming in.
This week, net inflows into US spot BTC ETFs were about $755 million, potentially making it one of the best-performing weeks since April.
On-chain, the picture is just as clear: since July 29, whales holding 10–10,000 BTC have accumulated more than 20,000 additional BTC, worth roughly $1.2 billion.
ETFs are buying, and whales are also buying—but the price hasn’t risen noticeably yet.
That’s actually the core reason why I’m currently leaning bullish.
Because bottoms often aren’t formed by big money buying all at once and then prices blasting higher immediately. Instead, it’s usually:
Accumulation of funds → price goes sideways → retail investors lose patience → floating supply decreases → and only then does the market choose a direction.
And macro conditions are starting to cooperate too.
July’s US non-farm payrolls unexpectedly fell by 23,000, and employment has clearly cooled. If subsequent data keeps weakening, pressure from interest rates and the US dollar would ease—naturally benefiting a high-beta asset like BTC.
That said, I won’t directly call for a bull market restart right now.
Next, the key is $65K–$66K.
If it breaks out with volume and holds above that level, I’ll continue to watch $68K–$70K. If ETF inflows weaken and BTC slips back below $62K–$63K, then we’ll need to reassess.
So my view is very clear right now:
Choppy trading in the short term, moderately bullish in the medium term; don’t chase—watch pullbacks and add in batches.
The CLARITY postponement only pushes the catalyst further out; it hasn’t changed the fact that capital is flowing back in.
The real thing worth worrying about is never simply that “bad news appears,”
but that “good news gets nobody to buy.”
And right now, it’s actually the opposite—
The news isn’t great, but the money has already started to come back.
The CLARITY Act has been postponed to September, and regulatory catalysts failed to materialize—but BTC is still holding around $65,000.
More importantly, the money is still coming in.
This week, net inflows into US spot BTC ETFs were about $755 million, potentially making it one of the best-performing weeks since April.
On-chain, the picture is just as clear: since July 29, whales holding 10–10,000 BTC have accumulated more than 20,000 additional BTC, worth roughly $1.2 billion.
ETFs are buying, and whales are also buying—but the price hasn’t risen noticeably yet.
That’s actually the core reason why I’m currently leaning bullish.
Because bottoms often aren’t formed by big money buying all at once and then prices blasting higher immediately. Instead, it’s usually:
Accumulation of funds → price goes sideways → retail investors lose patience → floating supply decreases → and only then does the market choose a direction.
And macro conditions are starting to cooperate too.
July’s US non-farm payrolls unexpectedly fell by 23,000, and employment has clearly cooled. If subsequent data keeps weakening, pressure from interest rates and the US dollar would ease—naturally benefiting a high-beta asset like BTC.
That said, I won’t directly call for a bull market restart right now.
Next, the key is $65K–$66K.
If it breaks out with volume and holds above that level, I’ll continue to watch $68K–$70K. If ETF inflows weaken and BTC slips back below $62K–$63K, then we’ll need to reassess.
So my view is very clear right now:
Choppy trading in the short term, moderately bullish in the medium term; don’t chase—watch pullbacks and add in batches.
The CLARITY postponement only pushes the catalyst further out; it hasn’t changed the fact that capital is flowing back in.
The real thing worth worrying about is never simply that “bad news appears,”
but that “good news gets nobody to buy.”
And right now, it’s actually the opposite—
The news isn’t great, but the money has already started to come back.
126
·
--
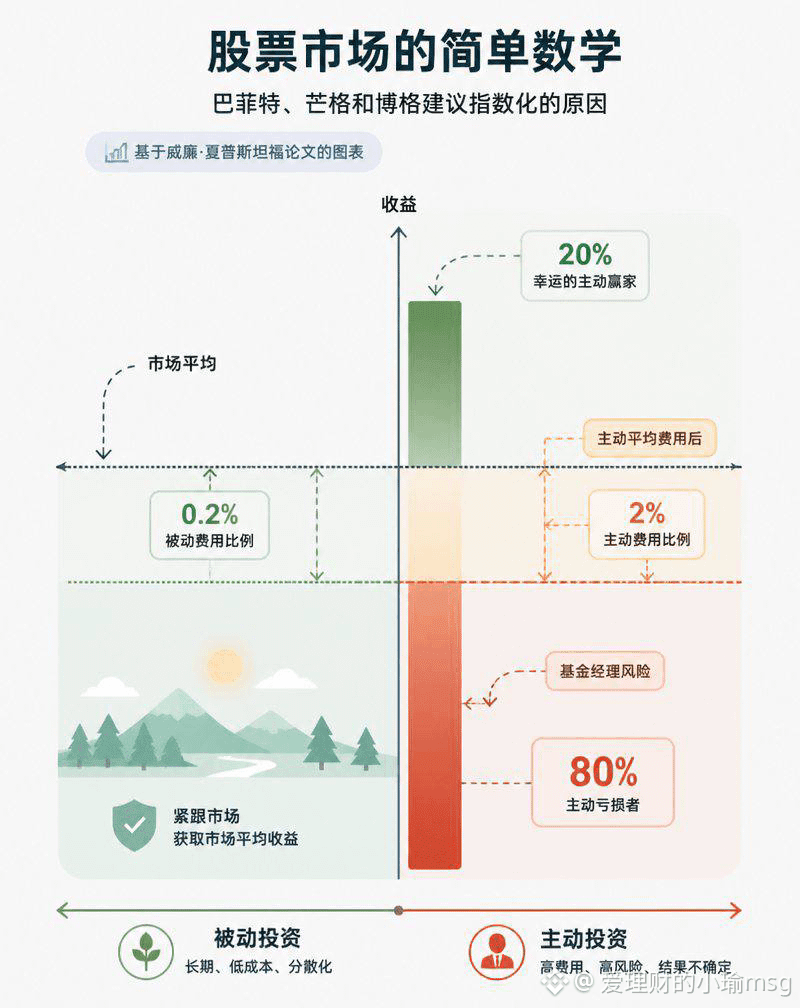
The Most Cruel Truth in the Stock Market:
Most people spend a great deal of time researching stocks, only to end up losing to an “anything-but-doing” index fund.
The reason is simple:
Active investing = high costs + high risk + high uncertainty
Index investing = low costs + diversified risk + long-term compounding
The Most Cruel Truth in the Stock Market:
Most people spend a great deal of time researching stocks, only to end up losing to an “anything-but-doing” index fund.
The reason is simple:
Active investing = high costs + high risk + high uncertainty
Index investing = low costs + diversified risk + long-term compounding
Most people spend a great deal of time researching stocks, only to end up losing to an “anything-but-doing” index fund.
The reason is simple:
Active investing = high costs + high risk + high uncertainty
Index investing = low costs + diversified risk + long-term compounding
102
·
--
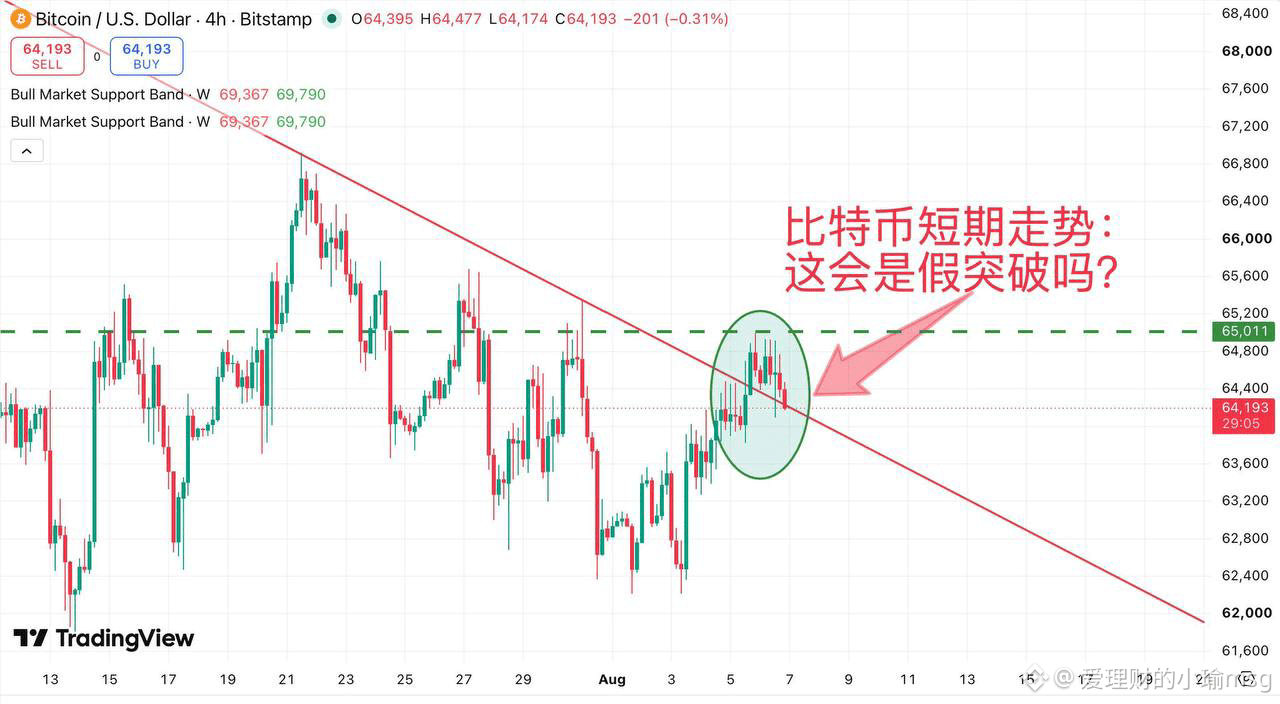
Bitcoin was consolidating in yesterday’s price action. It moved upward, hit 65K, then turned back down. It has now slightly dipped below the downtrend line—could this be a false breakout?
Whether it’s a false breakout can’t be concluded for now. In any case, I believe that based on the monthly chart, Bitcoin is likely to close lower in August. Even if this time it breaks upward, it probably won’t go far before it turns back down again.
Based on this view, I reduced my position in MicroStrategy (MSTR) yesterday!
Bitcoin was consolidating in yesterday’s price action. It moved upward, hit 65K, then turned back down. It has now slightly dipped below the downtrend line—could this be a false breakout?
Whether it’s a false breakout can’t be concluded for now. In any case, I believe that based on the monthly chart, Bitcoin is likely to close lower in August. Even if this time it breaks upward, it probably won’t go far before it turns back down again.
Based on this view, I reduced my position in MicroStrategy (MSTR) yesterday!
Whether it’s a false breakout can’t be concluded for now. In any case, I believe that based on the monthly chart, Bitcoin is likely to close lower in August. Even if this time it breaks upward, it probably won’t go far before it turns back down again.
Based on this view, I reduced my position in MicroStrategy (MSTR) yesterday!
191
Log in to explore more content
Join global crypto users on Binance Square
⚡️ Get latest and useful information about crypto.
💬 Trusted by the world’s largest crypto exchange.
👍 Discover real insights from verified creators.
Email / Phone number