

Noreen Lafosse S1UC
8 Posts

Noreen Lafosse S1UC
Report
Block User
2 Following
12 Followers
9 Liked
Posts
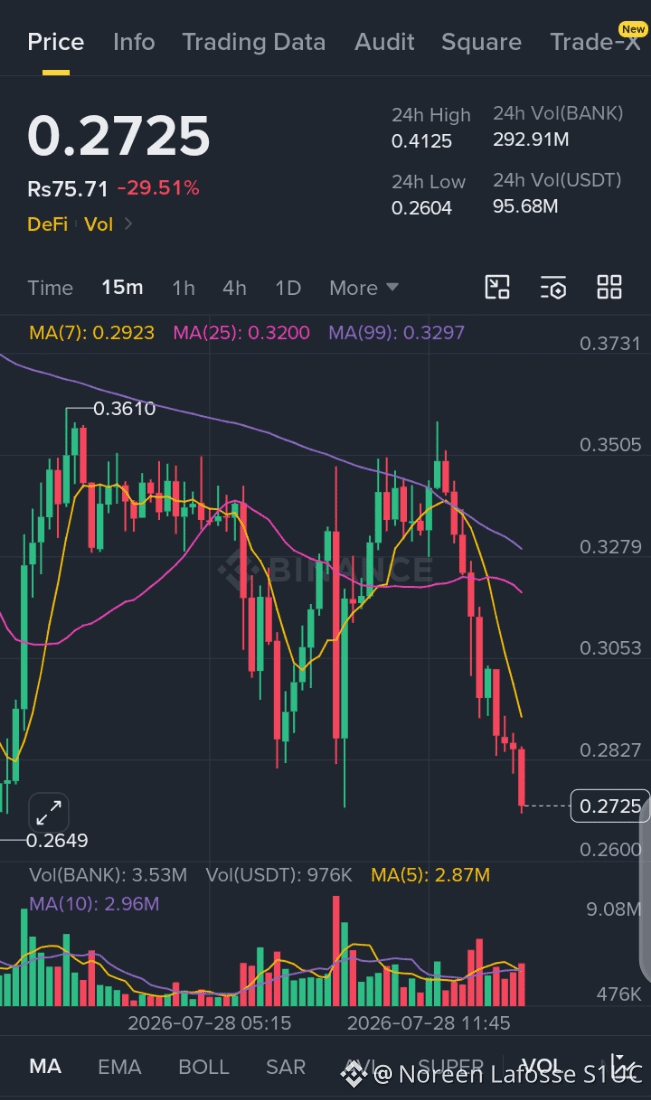
$BANK is currently trading around 0.2725 USDT, showing a -29.51% drop in the last 24 hours.
🔍 Technical View
📉 Strong bearish momentum is visible on the 15-minute chart.
✅ Price is trading below MA(7), MA(25), and MA(99). ✅ Consecutive red candles indicate that sellers remain in control. ✅ High trading volume during the drop suggests strong selling pressure.
👀 Key Levels
🟢 Support: 0.2600–0.2650 USDT
🔴 Resistance: 0.2920 → 0.3200 USDT
💡 My View
I would wait for: ✔️ A bullish reversal candle ✔️ Price reclaiming MA(25) ✔️ Strong buying volume
Until then, patience is better than chasing the dip.
⚠️ This is not financial advice. Always do your own research (DYOR).
$BANK
#Crypto #TechnicalAnalysi #altcoins #CryptoTrading. #analysis
$BANK is currently trading around 0.2725 USDT, showing a -29.51% drop in the last 24 hours.
🔍 Technical View
📉 Strong bearish momentum is visible on the 15-minute chart.
✅ Price is trading below MA(7), MA(25), and MA(99). ✅ Consecutive red candles indicate that sellers remain in control. ✅ High trading volume during the drop suggests strong selling pressure.
👀 Key Levels
🟢 Support: 0.2600–0.2650 USDT
🔴 Resistance: 0.2920 → 0.3200 USDT
💡 My View
I would wait for: ✔️ A bullish reversal candle ✔️ Price reclaiming MA(25) ✔️ Strong buying volume
Until then, patience is better than chasing the dip.
⚠️ This is not financial advice. Always do your own research (DYOR).
$BANK
#Crypto #TechnicalAnalysi #altcoins #CryptoTrading. #analysis
🔍 Technical View
📉 Strong bearish momentum is visible on the 15-minute chart.
✅ Price is trading below MA(7), MA(25), and MA(99). ✅ Consecutive red candles indicate that sellers remain in control. ✅ High trading volume during the drop suggests strong selling pressure.
👀 Key Levels
🟢 Support: 0.2600–0.2650 USDT
🔴 Resistance: 0.2920 → 0.3200 USDT
💡 My View
I would wait for: ✔️ A bullish reversal candle ✔️ Price reclaiming MA(25) ✔️ Strong buying volume
Until then, patience is better than chasing the dip.
⚠️ This is not financial advice. Always do your own research (DYOR).
$BANK
#Crypto #TechnicalAnalysi #altcoins #CryptoTrading. #analysis
220
Ethereum is powering the future of DeFi, NFTs, and Web3.
Every market cycle creates new opportunities for patient investors.
$ETH
#Ethereum #ETH #Web3 #DeFi #CryptoNews #BinanceSquare #HODL
Ethereum is powering the future of DeFi, NFTs, and Web3.
Every market cycle creates new opportunities for patient investors.
$ETH
#Ethereum #ETH #Web3 #DeFi #CryptoNews #BinanceSquare #HODL
Every market cycle creates new opportunities for patient investors.
$ETH
#Ethereum #ETH #Web3 #DeFi #CryptoNews #BinanceSquare #HODL

40
🚀 Bitcoin continues to prove why it remains the king of crypto.
Short-term volatility is normal, but long-term adoption keeps growing. Always invest with proper risk management.
$BTC
#Bitcoin #BTC #Crypto #BinanceSquare #DYOR #Investing #Blockchain
🚀 Bitcoin continues to prove why it remains the king of crypto.
Short-term volatility is normal, but long-term adoption keeps growing. Always invest with proper risk management.
$BTC
#Bitcoin #BTC #Crypto #BinanceSquare #DYOR #Investing #Blockchain
Short-term volatility is normal, but long-term adoption keeps growing. Always invest with proper risk management.
$BTC
#Bitcoin #BTC #Crypto #BinanceSquare #DYOR #Investing #Blockchain

14
Trump’s Inauguration and Its Impact on Cryptocurrency & Trump Coin
Donald Trump's 2017 inauguration influenced cryptocurrency markets by fostering speculation and growth. His administration’s hands-off approach allowed Bitcoin to surge from around $1,000 to nearly $20,000 by year-end. Institutional interest grew, and Bitcoin futures were introduced, but regulatory uncertainty persisted. The SEC cracked down on ICOs, causing market volatility. Although Trump criticized Bitcoin in 2019, his focus on financial deregulation encouraged crypto innovation.
During and after his presidency, several Trump-themed cryptocurrencies, like "Trump Coin," emerged, aiming to capitalize on his political brand. While these coins gained popularity among supporters, most lacked fundamental value, serving as speculative assets rather than serious investments.
#TRUMPTokenWatch
#BTC
#trumpcoin
Trump’s Inauguration and Its Impact on Cryptocurrency & Trump Coin
Donald Trump's 2017 inauguration influenced cryptocurrency markets by fostering speculation and growth. His administration’s hands-off approach allowed Bitcoin to surge from around $1,000 to nearly $20,000 by year-end. Institutional interest grew, and Bitcoin futures were introduced, but regulatory uncertainty persisted. The SEC cracked down on ICOs, causing market volatility. Although Trump criticized Bitcoin in 2019, his focus on financial deregulation encouraged crypto innovation.
During and after his presidency, several Trump-themed cryptocurrencies, like "Trump Coin," emerged, aiming to capitalize on his political brand. While these coins gained popularity among supporters, most lacked fundamental value, serving as speculative assets rather than serious investments.
#TRUMPTokenWatch
#BTC
#trumpcoin
Donald Trump's 2017 inauguration influenced cryptocurrency markets by fostering speculation and growth. His administration’s hands-off approach allowed Bitcoin to surge from around $1,000 to nearly $20,000 by year-end. Institutional interest grew, and Bitcoin futures were introduced, but regulatory uncertainty persisted. The SEC cracked down on ICOs, causing market volatility. Although Trump criticized Bitcoin in 2019, his focus on financial deregulation encouraged crypto innovation.
During and after his presidency, several Trump-themed cryptocurrencies, like "Trump Coin," emerged, aiming to capitalize on his political brand. While these coins gained popularity among supporters, most lacked fundamental value, serving as speculative assets rather than serious investments.
#TRUMPTokenWatch
#BTC
#trumpcoin
225
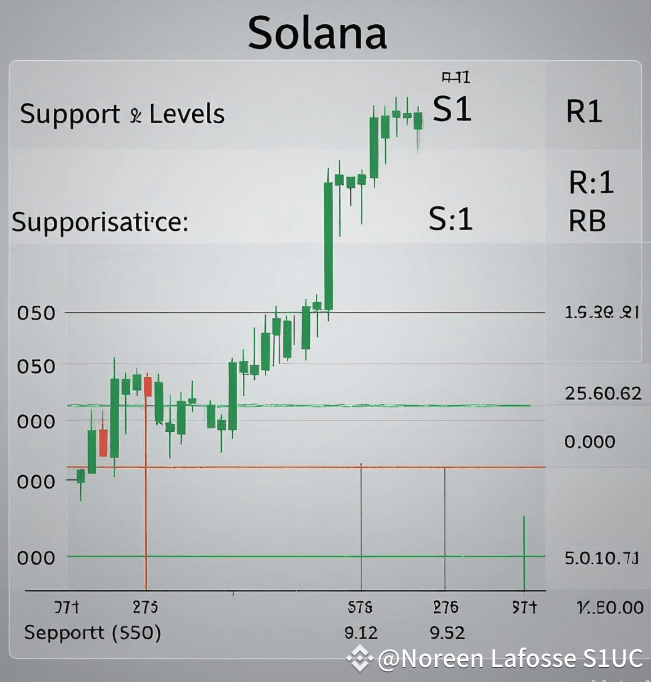
How to Calculate Support and Resistance?
#cryptouniverseofficial
In the context of technical analysis, "PP" stands for "Pivot Point". It's a calculated level that serves as a reference point for traders to gauge the market's direction and potential support and resistance levels.
The Pivot Point (PP) is typically calculated using the following formula:
PP = (High + Low + Close) / 3
Where:
- High: The highest price of the asset (in this case, Solana) during a specific time period (e.g., a day, week, or month).
- Low: The lowest price of the asset during the same time period.
- Close: The closing price of the asset during the same time period.
The Pivot Point is then used to calculate the support and resistance levels, as I mentioned earlier:
- 1st Support Level: (2 * PP) - High
- 2nd Support Level: PP - (R1 - S1)
- 1st Resistance Level: (2 * PP) - Low
- 2nd Resistance Level: PP + (R1 - S1)
The Pivot Point acts as a kind of "anchor" for these calculations, helping traders identify potential areas of support and resistance.
How to Calculate Support and Resistance?
#cryptouniverseofficial
In the context of technical analysis, "PP" stands for "Pivot Point". It's a calculated level that serves as a reference point for traders to gauge the market's direction and potential support and resistance levels.
The Pivot Point (PP) is typically calculated using the following formula:
PP = (High + Low + Close) / 3
Where:
- High: The highest price of the asset (in this case, Solana) during a specific time period (e.g., a day, week, or month).
- Low: The lowest price of the asset during the same time period.
- Close: The closing price of the asset during the same time period.
The Pivot Point is then used to calculate the support and resistance levels, as I mentioned earlier:
- 1st Support Level: (2 * PP) - High
- 2nd Support Level: PP - (R1 - S1)
- 1st Resistance Level: (2 * PP) - Low
- 2nd Resistance Level: PP + (R1 - S1)
The Pivot Point acts as a kind of "anchor" for these calculations, helping traders identify potential areas of support and resistance.
#cryptouniverseofficial
In the context of technical analysis, "PP" stands for "Pivot Point". It's a calculated level that serves as a reference point for traders to gauge the market's direction and potential support and resistance levels.
The Pivot Point (PP) is typically calculated using the following formula:
PP = (High + Low + Close) / 3
Where:
- High: The highest price of the asset (in this case, Solana) during a specific time period (e.g., a day, week, or month).
- Low: The lowest price of the asset during the same time period.
- Close: The closing price of the asset during the same time period.
The Pivot Point is then used to calculate the support and resistance levels, as I mentioned earlier:
- 1st Support Level: (2 * PP) - High
- 2nd Support Level: PP - (R1 - S1)
- 1st Resistance Level: (2 * PP) - Low
- 2nd Resistance Level: PP + (R1 - S1)
The Pivot Point acts as a kind of "anchor" for these calculations, helping traders identify potential areas of support and resistance.
527
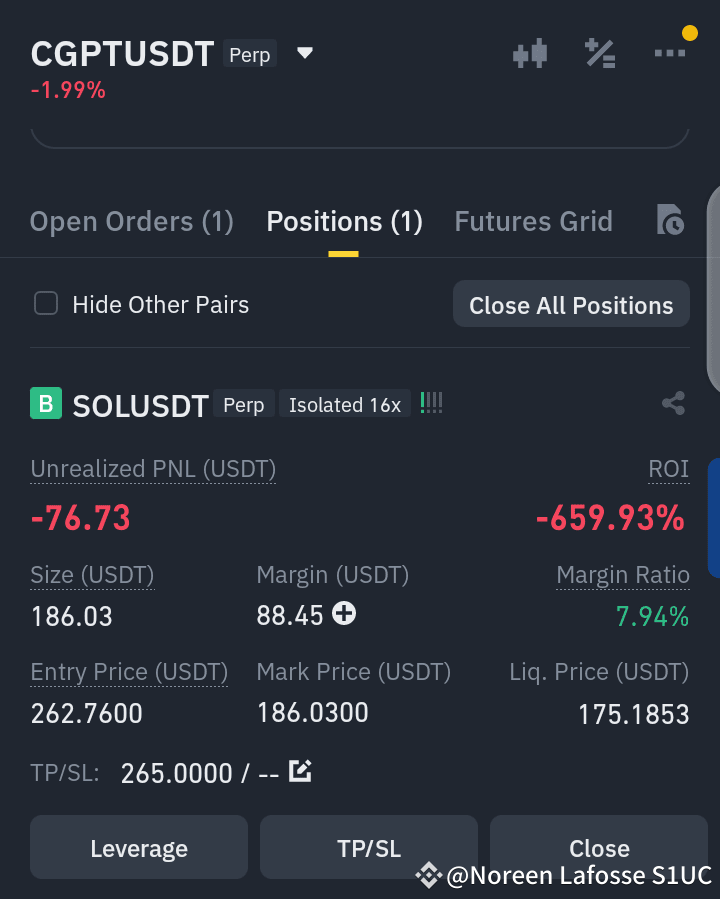
What should I do? Give suggestions. #sol
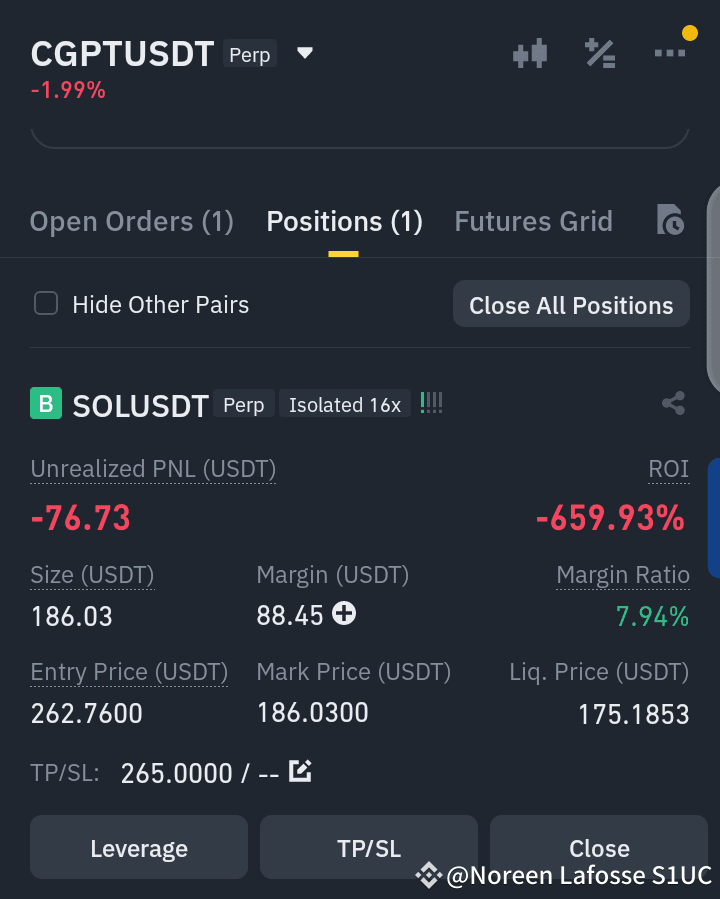
What should I do? Give suggestions. #sol
13
5
6
9k
Log in to explore more content
Join global crypto users on Binance Square
⚡️ Get latest and useful information about crypto.
💬 Trusted by the world’s largest crypto exchange.
👍 Discover real insights from verified creators.
Email / Phone number