
aguila2525
8 Posts

aguila2525
Report
Block User
11 Following
11 Followers
1 Liked
Posts
·
--
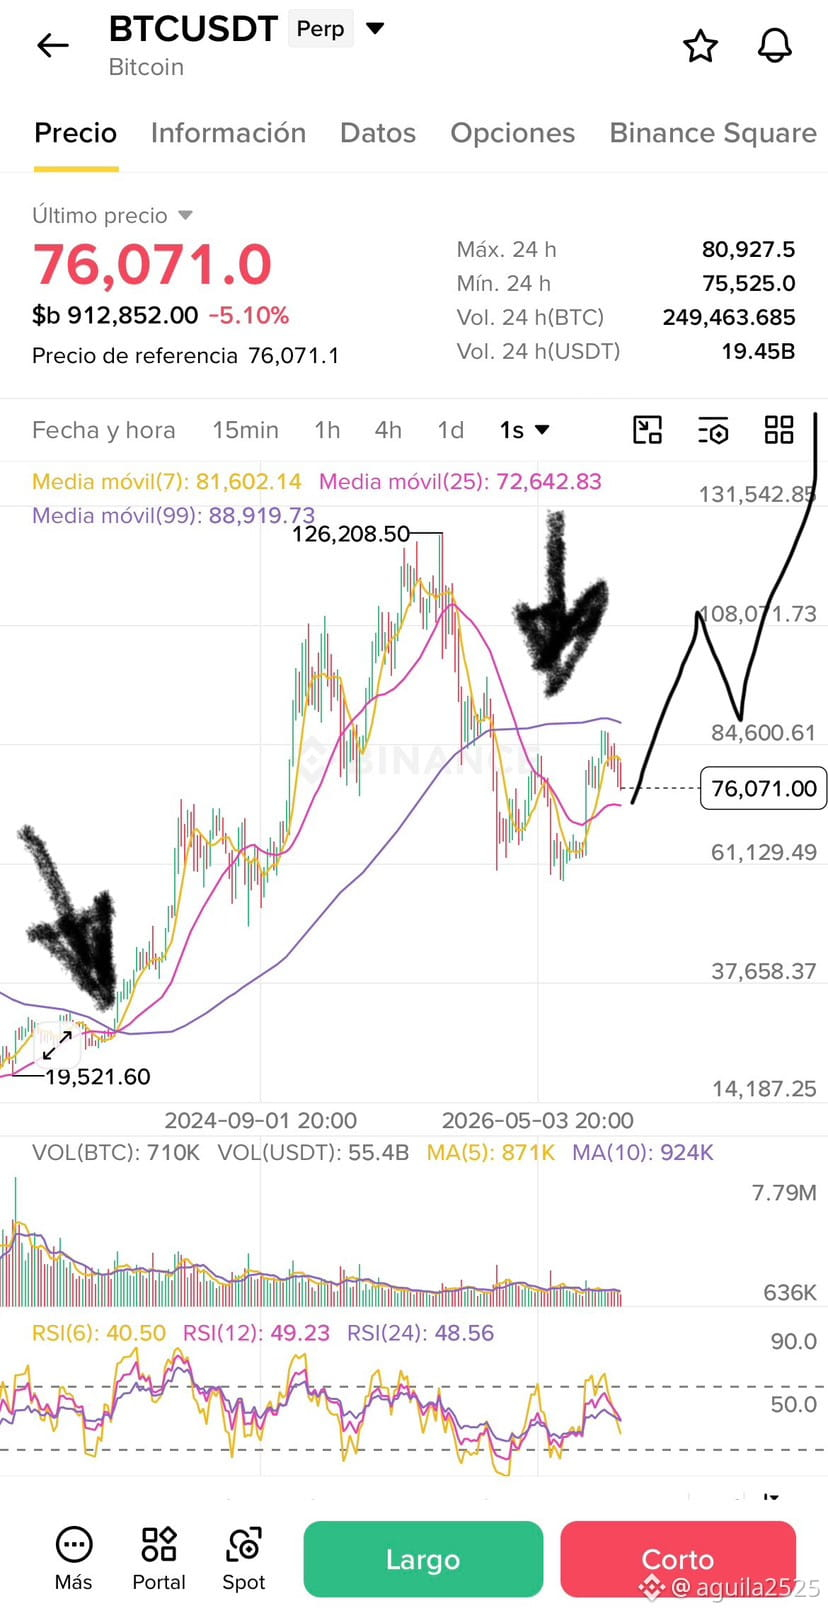
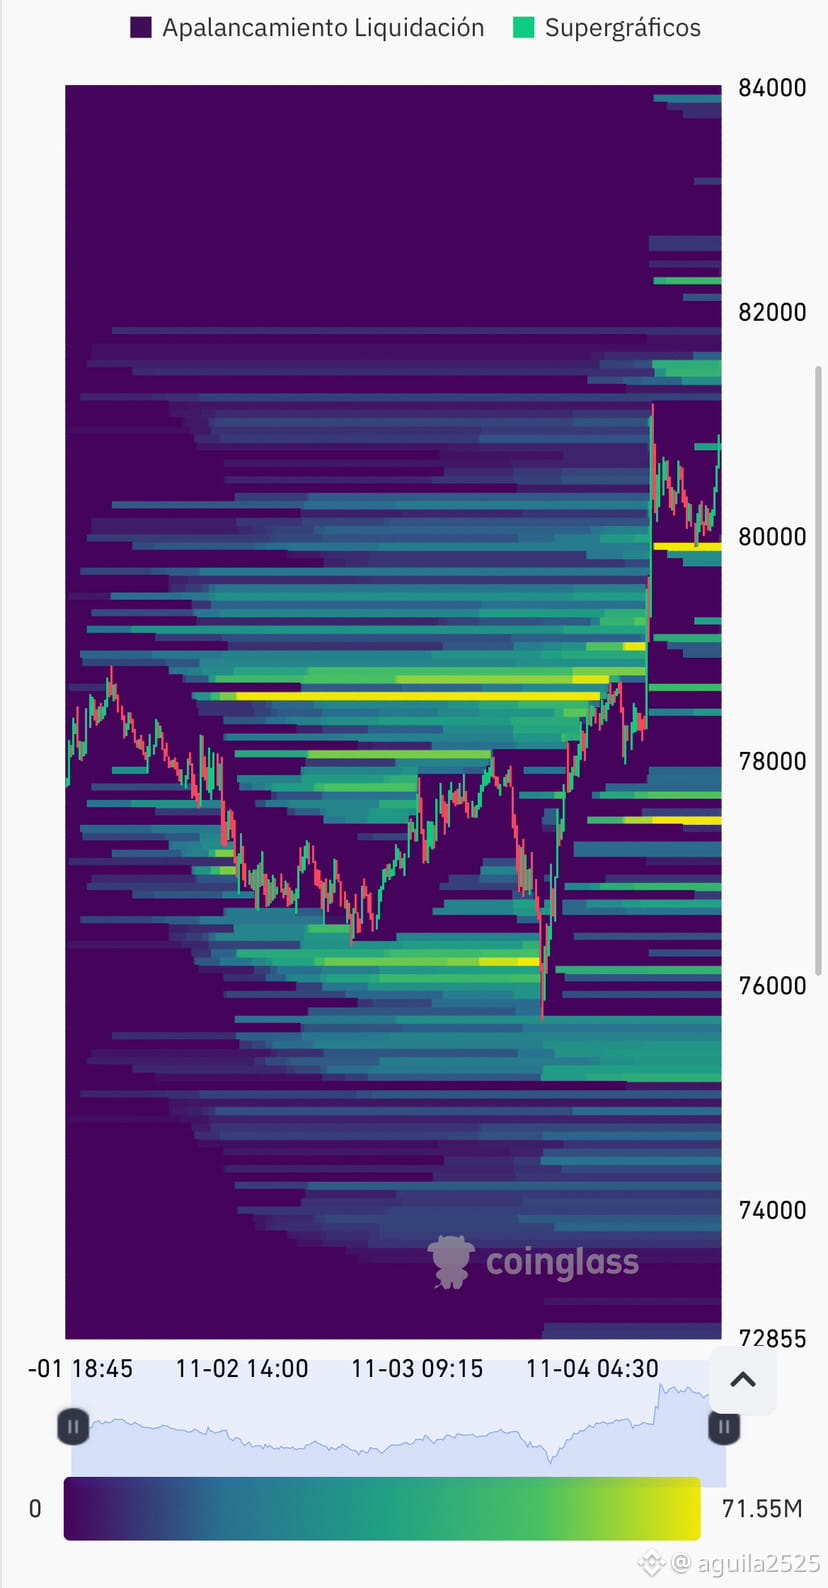
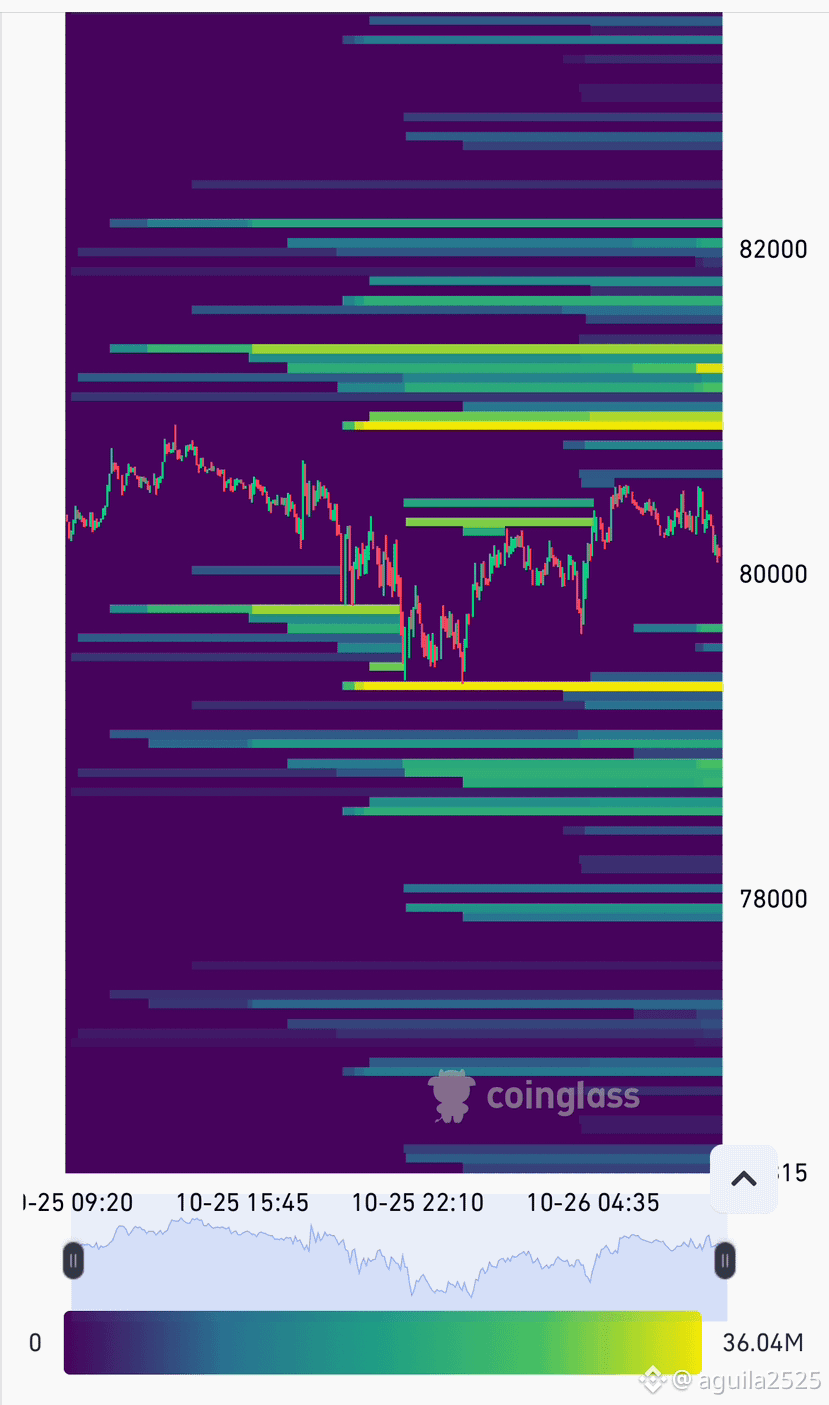
The Coinglass chart reveals a battlefield with liquidity traps on both sides. Price is compressed, and the direction of the next breakout will depend on whether the market clings to hopes for Fed liquidity or whether fears of regulation and inflation take control. The key is to watch how price reacts at 83,700; a break of either of these levels could trigger a cascade of liquidations toward the next target.
The Coinglass chart reveals a battlefield with liquidity traps on both sides. Price is compressed, and the direction of the next breakout will depend on whether the market clings to hopes for Fed liquidity or whether fears of regulation and inflation take control. The key is to watch how price reacts at 83,700; a break of either of these levels could trigger a cascade of liquidations toward the next target.
1.9k
·
--
147
·
--
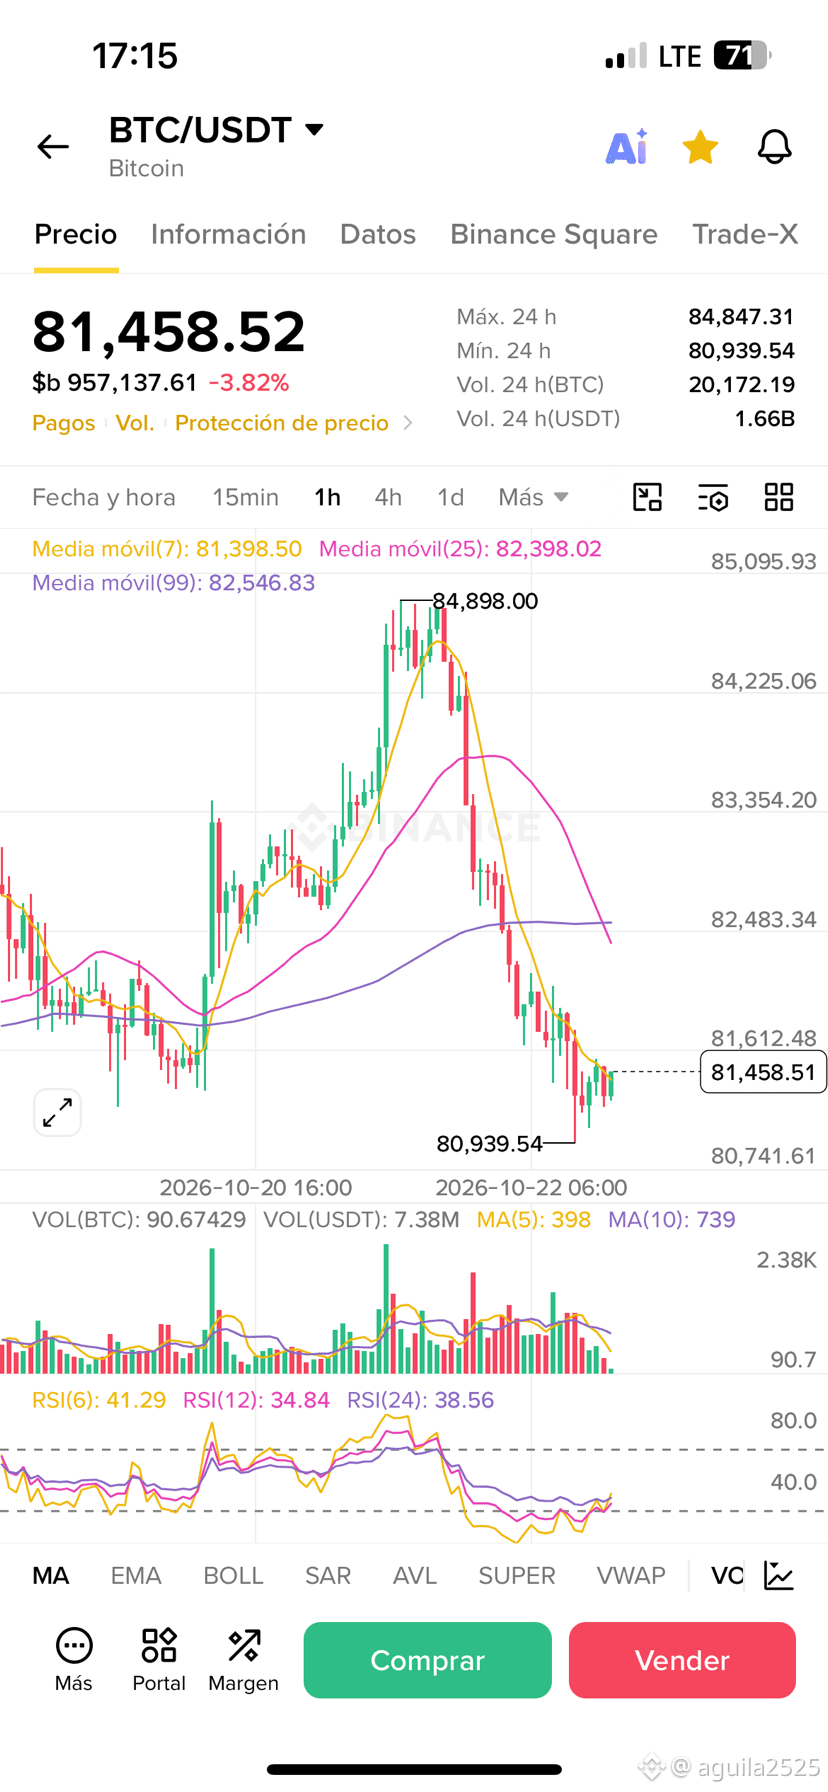
Bitcoin loses ground: Trend reversal on the 1H chart? 📉
The $BTC/USDT chart on the 1-hour timeframe shows a sharp correction (-3.17%) after hitting a ceiling around $84,500.
Looking at the structure indicators, we saw a CHoCH DOWN (Change of Character) followed by a BOS DOWN (Break of Structure), confirming that the short-term uptrend is losing steam.
🔍 Key levels to watch:
• Immediate support: $81,400–$81,500 zone. If we lose this level, we could see a bearish move toward $80,800.
• Resistance: $82,500 and $83,000 are now acting as ceilings after the drop.
• We see several "SELL LIQ" and "BUY LIQ" markers, indicating that the market has swept liquidity in both directions.
Do you think $81,400 will hold, or are we heading toward $80,000?
Bitcoin loses ground: Trend reversal on the 1H chart? 📉
The $BTC/USDT chart on the 1-hour timeframe shows a sharp correction (-3.17%) after hitting a ceiling around $84,500.
Looking at the structure indicators, we saw a CHoCH DOWN (Change of Character) followed by a BOS DOWN (Break of Structure), confirming that the short-term uptrend is losing steam.
🔍 Key levels to watch:
• Immediate support: $81,400–$81,500 zone. If we lose this level, we could see a bearish move toward $80,800.
• Resistance: $82,500 and $83,000 are now acting as ceilings after the drop.
• We see several "SELL LIQ" and "BUY LIQ" markers, indicating that the market has swept liquidity in both directions.
Do you think $81,400 will hold, or are we heading toward $80,000?
The $BTC/USDT chart on the 1-hour timeframe shows a sharp correction (-3.17%) after hitting a ceiling around $84,500.
Looking at the structure indicators, we saw a CHoCH DOWN (Change of Character) followed by a BOS DOWN (Break of Structure), confirming that the short-term uptrend is losing steam.
🔍 Key levels to watch:
• Immediate support: $81,400–$81,500 zone. If we lose this level, we could see a bearish move toward $80,800.
• Resistance: $82,500 and $83,000 are now acting as ceilings after the drop.
• We see several "SELL LIQ" and "BUY LIQ" markers, indicating that the market has swept liquidity in both directions.
Do you think $81,400 will hold, or are we heading toward $80,000?
126
·
--
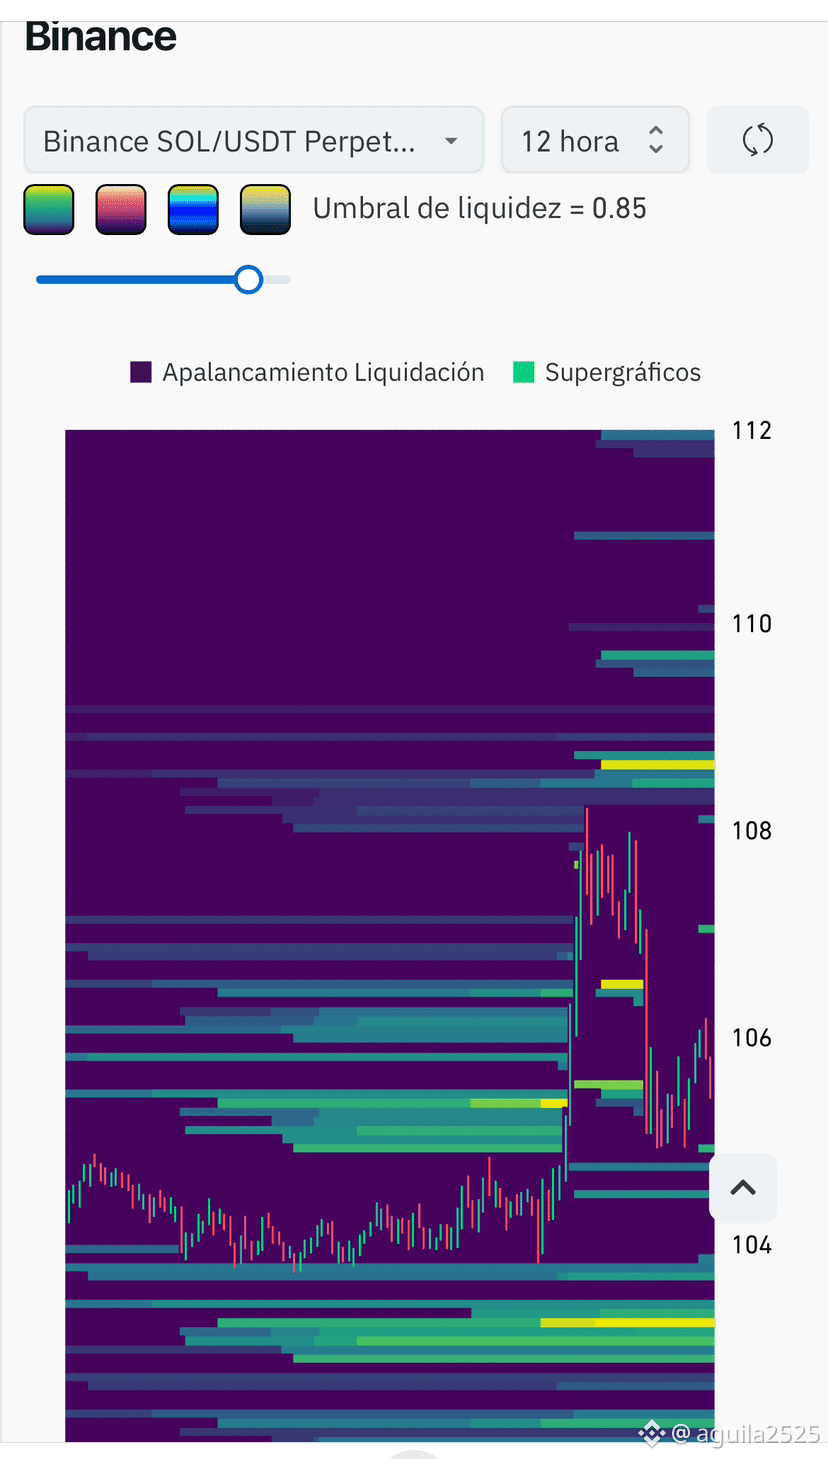
The 12-hour Solana liquidation map went to take the liquidity at 108. What's the next target?
The 12-hour Solana liquidation map went to take the liquidity at 108. What's the next target?
2
1
647
Log in to explore more content
Join global crypto users on Binance Square
⚡️ Get latest and useful information about crypto.
💬 Trusted by the world’s largest crypto exchange.
👍 Discover real insights from verified creators.
Email / Phone number
Trending Topics
BinanceReopensWithdrawalsForMoreAssets
1.1M views
5,577 Discussing
Recovery Update #9: Withdrawals for More Assets to Reopen (2026-11-06)
Binance Announcement
·122 Likes
·525.6k views
$2TWipedOut,HedgeFundsFaceLiquidation
0 views
0 Discussing
AnthropicIPOValuationDoubts
9,560 views
287 Discussing