Bitcoin loses ground: Trend reversal on the 1H chart? 📉
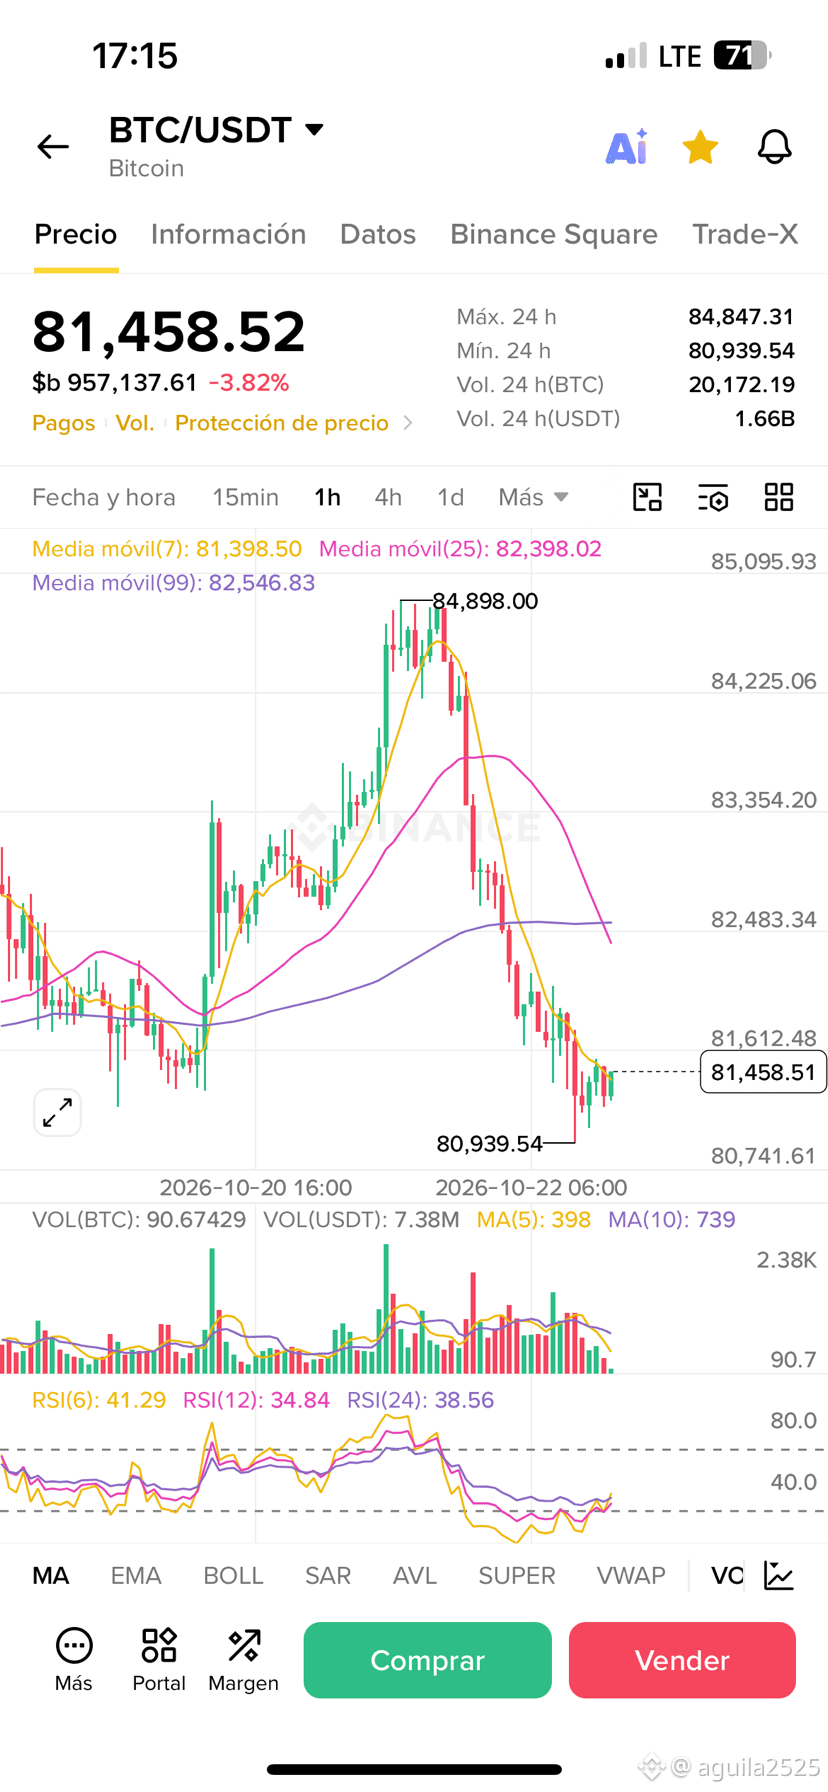
The $BTC/USDT chart on the 1-hour timeframe shows a sharp correction (-3.17%) after hitting a ceiling around $84,500.
Looking at the structure indicators, we saw a CHoCH DOWN (Change of Character) followed by a BOS DOWN (Break of Structure), confirming that the short-term uptrend is losing steam.
🔍 Key levels to watch:
• Immediate support: $81,400–$81,500 zone. If we lose this level, we could see a bearish move toward $80,800.
• Resistance: $82,500 and $83,000 are now acting as ceilings after the drop.
• We see several "SELL LIQ" and "BUY LIQ" markers, indicating that the market has swept liquidity in both directions.
Do you think $81,400 will hold, or are we heading toward $80,000?
The $BTC/USDT chart on the 1-hour timeframe shows a sharp correction (-3.17%) after hitting a ceiling around $84,500.
Looking at the structure indicators, we saw a CHoCH DOWN (Change of Character) followed by a BOS DOWN (Break of Structure), confirming that the short-term uptrend is losing steam.
🔍 Key levels to watch:
• Immediate support: $81,400–$81,500 zone. If we lose this level, we could see a bearish move toward $80,800.
• Resistance: $82,500 and $83,000 are now acting as ceilings after the drop.
• We see several "SELL LIQ" and "BUY LIQ" markers, indicating that the market has swept liquidity in both directions.
Do you think $81,400 will hold, or are we heading toward $80,000?