

青木
778 Posts

青木
Report
Block User
公众号或微博热搜:青木btc 主打趋势交易,擅长中长线布局,深入浅出,点位精准。
Occasional Trader
5.1 Years
27 Following
3.0K+ Followers
1.1K+ Liked
Posts
All
Quotes
PINNED
·
--
Add friends on Binance. Friends who want to join my community chat room can click on my avatar on the homepage to join directly, or search for the chat room on the homepage and enter my chat room ID to add me as a Binance friend. Chat room ID: a332166 Binance ID:211799655
Add friends on Binance. Friends who want to join my community chat room can click on my avatar on the homepage to join directly, or search for the chat room on the homepage and enter my chat room ID to add me as a Binance friend. Chat room ID: a332166 Binance ID:211799655

1
282
PINNED
·
--

Article
Diamond Sutra of the Cryptocurrency Circle, Don’t Think I’m Long-winded——(The Deepest Insights of Top Masters)In the art of trading, the strong are easily broken. Only the most yin and soft can dominate the world. Nothing in the world is as soft as water, but the highest good is like water.
Success is equal to small losses plus large and small profits accumulated many times.
It is very simple to avoid big losses. Survival is the first principle. When there is a danger of hindering this principle, abandon all other principles. Because no matter how many 100% excellent performances you have had in the past, if you lose one 100% now, you will have nothing.
The way of trading is to defend the invincible position and attack the enemy that can be defeated. A 50% loss of 1 million yuan becomes 500,000 yuan, but a 100% profit is required to increase 500,000 yuan to 1 million yuan. Every success will only make you take a small step forward. But every failure will make you take a big step back. It takes an hour to walk from the first floor of the Empire State Building to the top floor. But if you jump from the top of the building, you can get back to the bottom in just 30 seconds.
Diamond Sutra of the Cryptocurrency Circle, Don’t Think I’m Long-winded——(The Deepest Insights of Top Masters)
In the art of trading, the strong are easily broken. Only the most yin and soft can dominate the world. Nothing in the world is as soft as water, but the highest good is like water.
Success is equal to small losses plus large and small profits accumulated many times.
It is very simple to avoid big losses. Survival is the first principle. When there is a danger of hindering this principle, abandon all other principles. Because no matter how many 100% excellent performances you have had in the past, if you lose one 100% now, you will have nothing.
The way of trading is to defend the invincible position and attack the enemy that can be defeated. A 50% loss of 1 million yuan becomes 500,000 yuan, but a 100% profit is required to increase 500,000 yuan to 1 million yuan. Every success will only make you take a small step forward. But every failure will make you take a big step back. It takes an hour to walk from the first floor of the Empire State Building to the top floor. But if you jump from the top of the building, you can get back to the bottom in just 30 seconds.
Success is equal to small losses plus large and small profits accumulated many times.
It is very simple to avoid big losses. Survival is the first principle. When there is a danger of hindering this principle, abandon all other principles. Because no matter how many 100% excellent performances you have had in the past, if you lose one 100% now, you will have nothing.
The way of trading is to defend the invincible position and attack the enemy that can be defeated. A 50% loss of 1 million yuan becomes 500,000 yuan, but a 100% profit is required to increase 500,000 yuan to 1 million yuan. Every success will only make you take a small step forward. But every failure will make you take a big step back. It takes an hour to walk from the first floor of the Empire State Building to the top floor. But if you jump from the top of the building, you can get back to the bottom in just 30 seconds.
12
771
·
--
Bearish
9.7 Note, note—Bitcoin is hard to break out. Heavy overhead pressure; has the short-side squeeze begun?
Looking at the short-term trend, BTC’s rebound lacks strength and weakness is evident. With heavy pressure overhead, even if there are occasional rebounds, it’s difficult to break through the surrounding resistance. Ethereum is also constrained by the high-level suppression zone, indicating that bearish forces may still hold sway ahead.
For the next phase, the strategy should focus on a pullback under pressure after rebounds are capped, and further downside after rebounds fail. In terms of execution, be flexible: if the pressure zone is not broken, set shorts in the higher area and wait for the pullback. When support appears at lower levels, catch the rebound with long positions, and maintain a range-trading approach.
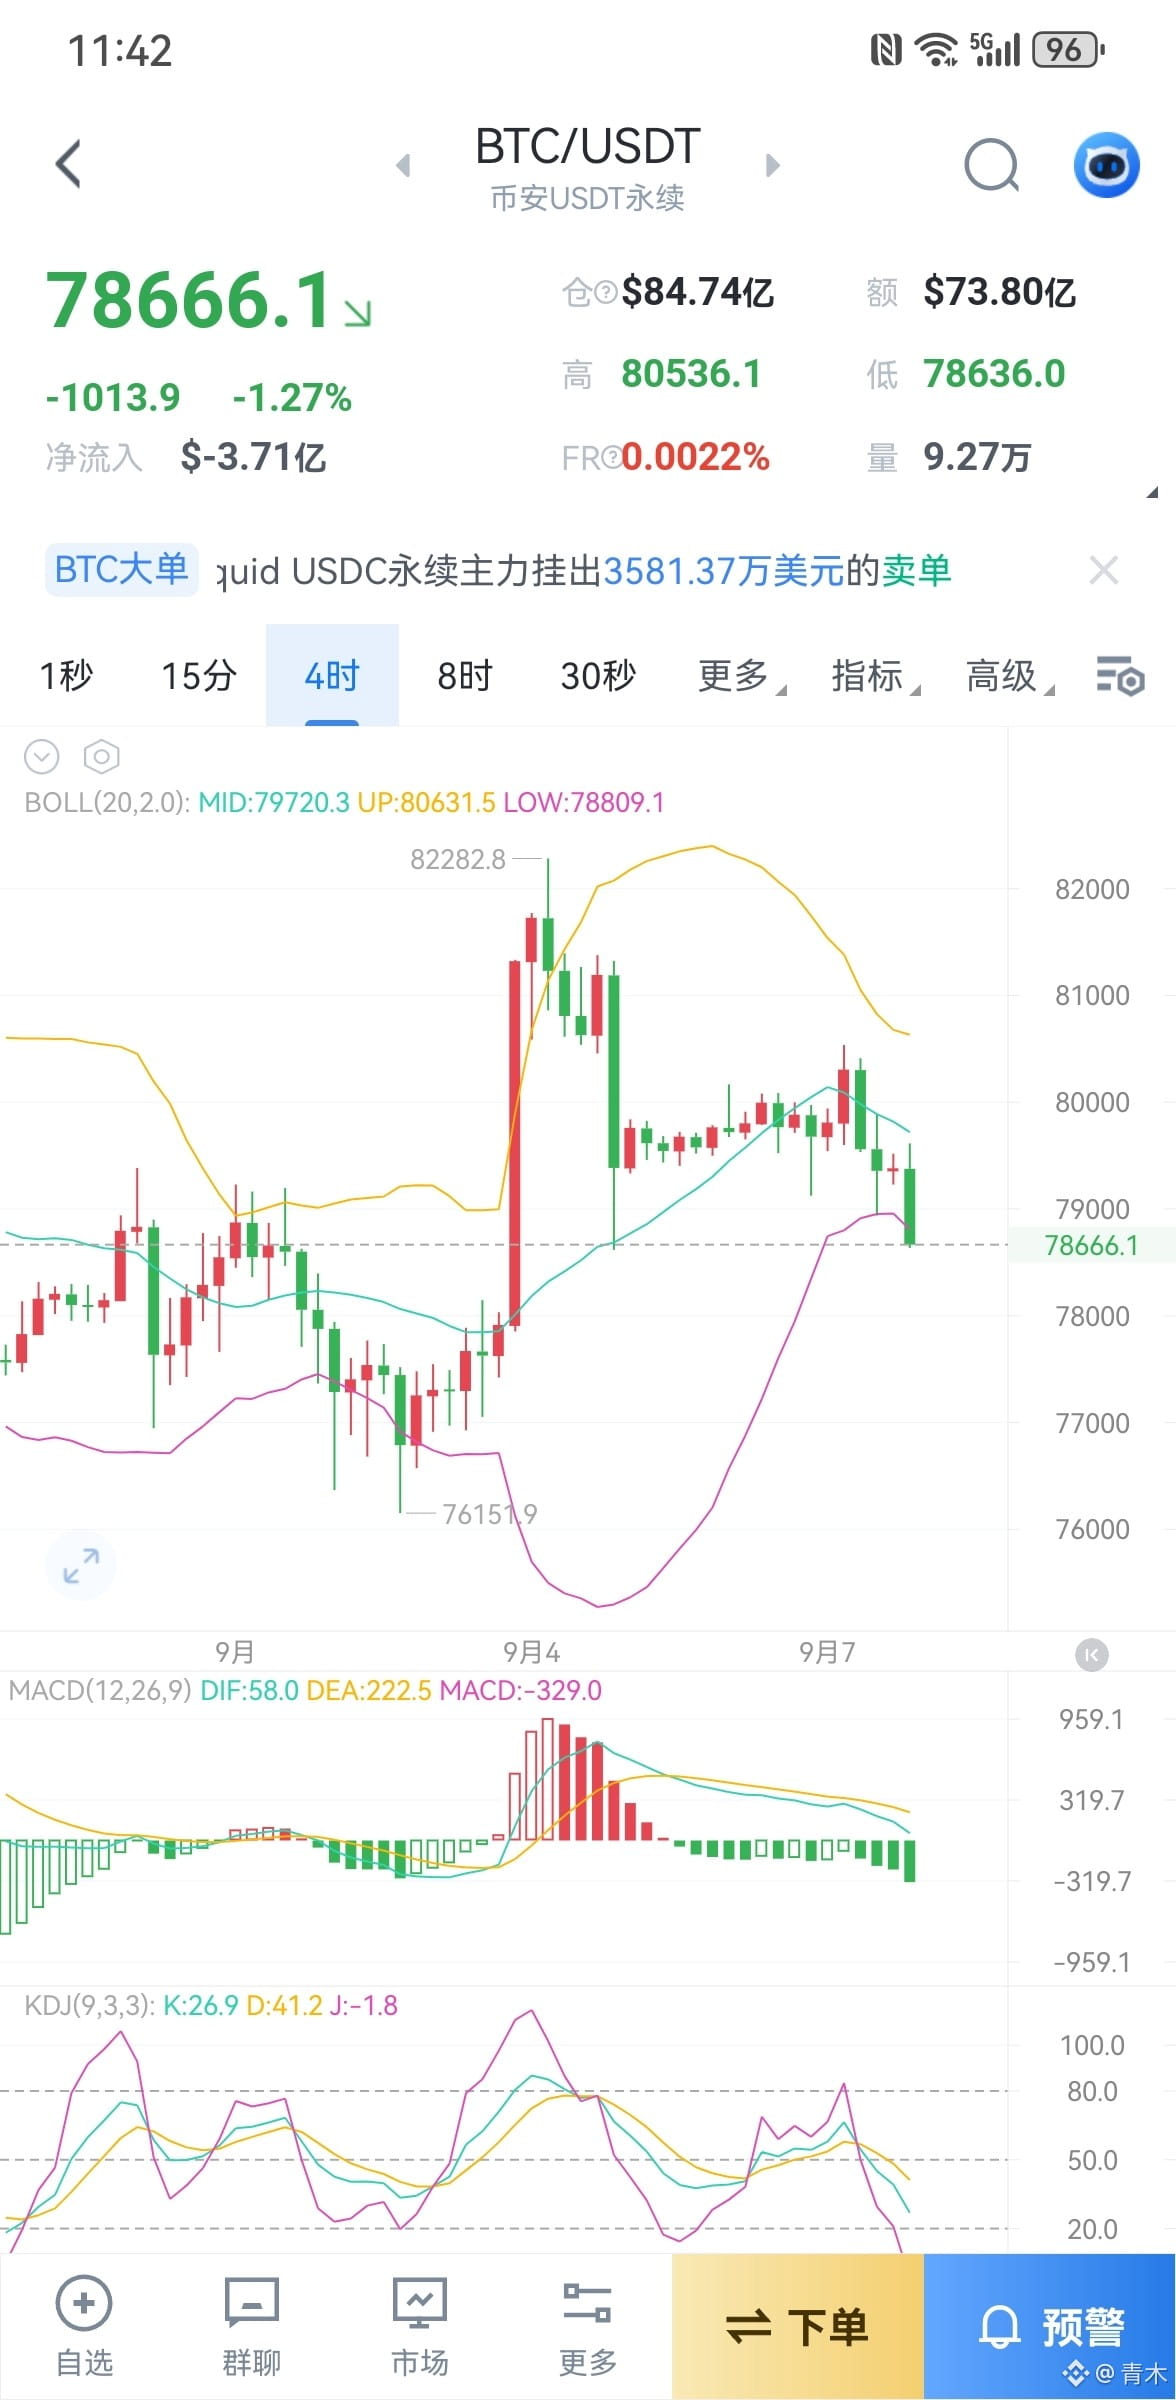
Technically, on the four-hour chart, there are multiple long upper wicks. After a three-day decline followed by a minor bullish correction, it’s not advisable to chase longs too aggressively in the short term. The trading idea is simple: refer to yesterday’s and today’s rebound highs around 80,000 as the resistance area to short for a bearish move. Don’t look too far for the target. Hold the position if 76,200 (the low from the day before yesterday) breaks; if it doesn’t break, exit the short and flip to a long instead!
BTC short around 79,000–79,500, target 77,800–76,500
ETH short around 2,480–2,520, target 2,400–2,350
The viewpoints, conclusions, and suggestions in this article are for reference only and do not constitute investment advice. The market is risky—investments require caution.$BTC $ETH
9.7 Note, note—Bitcoin is hard to break out. Heavy overhead pressure; has the short-side squeeze begun?
Looking at the short-term trend, BTC’s rebound lacks strength and weakness is evident. With heavy pressure overhead, even if there are occasional rebounds, it’s difficult to break through the surrounding resistance. Ethereum is also constrained by the high-level suppression zone, indicating that bearish forces may still hold sway ahead.
For the next phase, the strategy should focus on a pullback under pressure after rebounds are capped, and further downside after rebounds fail. In terms of execution, be flexible: if the pressure zone is not broken, set shorts in the higher area and wait for the pullback. When support appears at lower levels, catch the rebound with long positions, and maintain a range-trading approach.
Technically, on the four-hour chart, there are multiple long upper wicks. After a three-day decline followed by a minor bullish correction, it’s not advisable to chase longs too aggressively in the short term. The trading idea is simple: refer to yesterday’s and today’s rebound highs around 80,000 as the resistance area to short for a bearish move. Don’t look too far for the target. Hold the position if 76,200 (the low from the day before yesterday) breaks; if it doesn’t break, exit the short and flip to a long instead!
BTC short around 79,000–79,500, target 77,800–76,500
ETH short around 2,480–2,520, target 2,400–2,350
The viewpoints, conclusions, and suggestions in this article are for reference only and do not constitute investment advice. The market is risky—investments require caution.$BTC $ETH
Looking at the short-term trend, BTC’s rebound lacks strength and weakness is evident. With heavy pressure overhead, even if there are occasional rebounds, it’s difficult to break through the surrounding resistance. Ethereum is also constrained by the high-level suppression zone, indicating that bearish forces may still hold sway ahead.
For the next phase, the strategy should focus on a pullback under pressure after rebounds are capped, and further downside after rebounds fail. In terms of execution, be flexible: if the pressure zone is not broken, set shorts in the higher area and wait for the pullback. When support appears at lower levels, catch the rebound with long positions, and maintain a range-trading approach.
Technically, on the four-hour chart, there are multiple long upper wicks. After a three-day decline followed by a minor bullish correction, it’s not advisable to chase longs too aggressively in the short term. The trading idea is simple: refer to yesterday’s and today’s rebound highs around 80,000 as the resistance area to short for a bearish move. Don’t look too far for the target. Hold the position if 76,200 (the low from the day before yesterday) breaks; if it doesn’t break, exit the short and flip to a long instead!
BTC short around 79,000–79,500, target 77,800–76,500
ETH short around 2,480–2,520, target 2,400–2,350
The viewpoints, conclusions, and suggestions in this article are for reference only and do not constitute investment advice. The market is risky—investments require caution.$BTC $ETH
835
·
--
Bearish
7.22 BTC sees a tug-of-war between longs and shorts, with ETH trading in a narrow range—where will the breakout direction be?
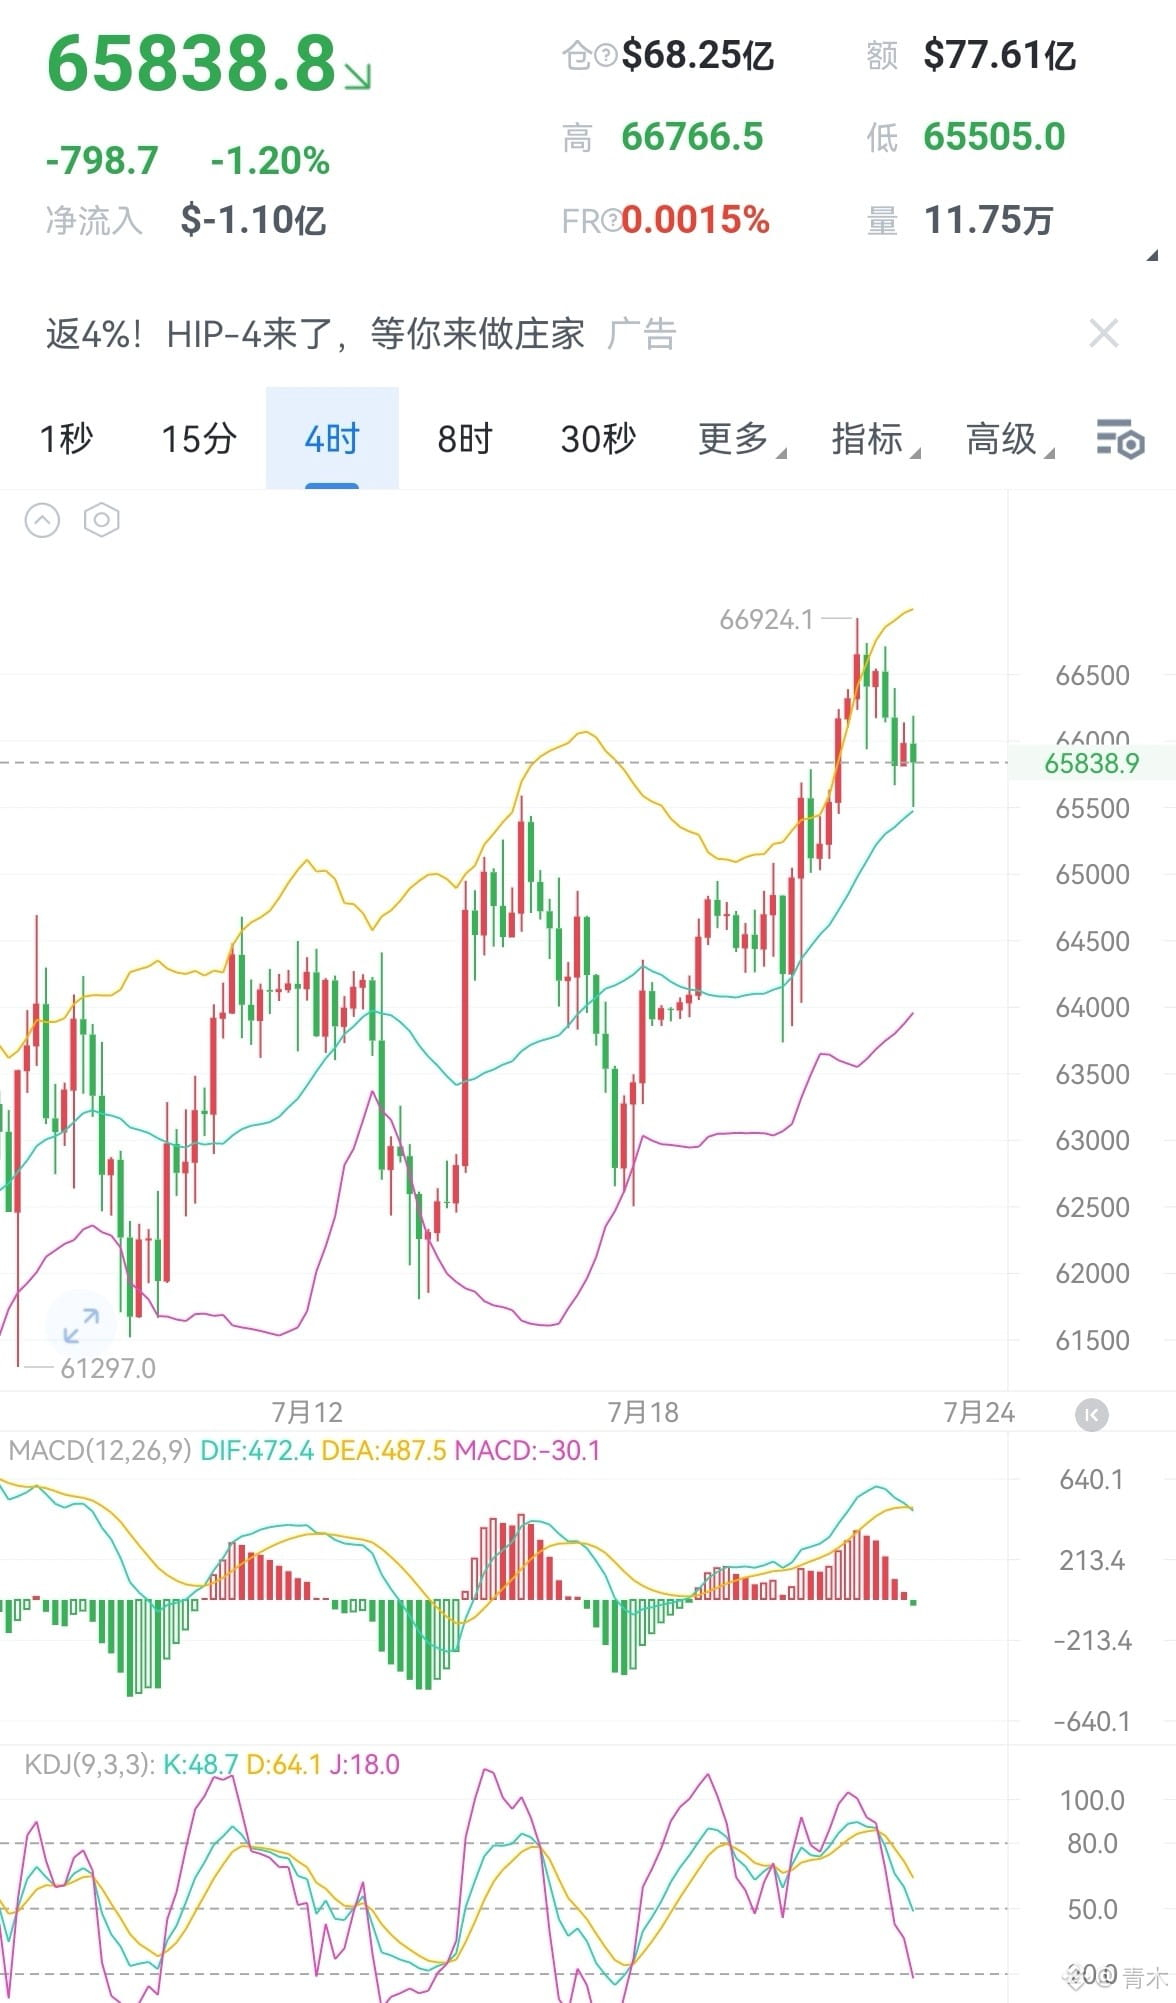
BTC is currently consolidating around the mid-term support at 65,800, and intraday it is now retracing yesterday’s upward move. The 67,000 resistance zone is extremely strong; multiple attempts to surge higher have failed to break through and hold. For now, the support at the 65,800 area is holding, and the battle between bulls and bears has entered a highly heated phase. Over the past 24 hours, the overall market is up slightly by 1.35%. The chart has shown a mild recovery, but the upside push is seriously lacking.
ETH’s trend is relatively steady, hovering around 1,940. Over the past 24 hours it is up slightly by 0.06%, with very small intraday fluctuations. In the past week, major coins have diverged significantly overall. ETH has consistently shown resilient “anti-drawdown” toughness, performing better than most altcoins. However, on the four-hour timeframe, price action has continued to move sideways in consolidation, with trading volume steadily shrinking. In the short term, there is no clear breakout direction, and the range-trading and shakeout pattern is obvious. Recent operations have not been ideal; consult btc0796 to exchange views on the market.
Short-sell suggestions:
BTC 66,000–66,500 short, target 65,000–64,000, defend at 67,000
ETH 1,950–1,980 short, target 1,850–1,800, defend at 2,020
The opinions, conclusions, and suggestions in this article are for reference only and do not constitute investment advice. The market is risky—invest cautiously.$BTC
{future}(BTCUSDT)
$ETH
{future}(ETHUSDT)
7.22 BTC sees a tug-of-war between longs and shorts, with ETH trading in a narrow range—where will the breakout direction be?
BTC is currently consolidating around the mid-term support at 65,800, and intraday it is now retracing yesterday’s upward move. The 67,000 resistance zone is extremely strong; multiple attempts to surge higher have failed to break through and hold. For now, the support at the 65,800 area is holding, and the battle between bulls and bears has entered a highly heated phase. Over the past 24 hours, the overall market is up slightly by 1.35%. The chart has shown a mild recovery, but the upside push is seriously lacking.
ETH’s trend is relatively steady, hovering around 1,940. Over the past 24 hours it is up slightly by 0.06%, with very small intraday fluctuations. In the past week, major coins have diverged significantly overall. ETH has consistently shown resilient “anti-drawdown” toughness, performing better than most altcoins. However, on the four-hour timeframe, price action has continued to move sideways in consolidation, with trading volume steadily shrinking. In the short term, there is no clear breakout direction, and the range-trading and shakeout pattern is obvious. Recent operations have not been ideal; consult btc0796 to exchange views on the market.
Short-sell suggestions:
BTC 66,000–66,500 short, target 65,000–64,000, defend at 67,000
ETH 1,950–1,980 short, target 1,850–1,800, defend at 2,020
The opinions, conclusions, and suggestions in this article are for reference only and do not constitute investment advice. The market is risky—invest cautiously.$BTC
$ETH
BTC is currently consolidating around the mid-term support at 65,800, and intraday it is now retracing yesterday’s upward move. The 67,000 resistance zone is extremely strong; multiple attempts to surge higher have failed to break through and hold. For now, the support at the 65,800 area is holding, and the battle between bulls and bears has entered a highly heated phase. Over the past 24 hours, the overall market is up slightly by 1.35%. The chart has shown a mild recovery, but the upside push is seriously lacking.
ETH’s trend is relatively steady, hovering around 1,940. Over the past 24 hours it is up slightly by 0.06%, with very small intraday fluctuations. In the past week, major coins have diverged significantly overall. ETH has consistently shown resilient “anti-drawdown” toughness, performing better than most altcoins. However, on the four-hour timeframe, price action has continued to move sideways in consolidation, with trading volume steadily shrinking. In the short term, there is no clear breakout direction, and the range-trading and shakeout pattern is obvious. Recent operations have not been ideal; consult btc0796 to exchange views on the market.
Short-sell suggestions:
BTC 66,000–66,500 short, target 65,000–64,000, defend at 67,000
ETH 1,950–1,980 short, target 1,850–1,800, defend at 2,020
The opinions, conclusions, and suggestions in this article are for reference only and do not constitute investment advice. The market is risky—invest cautiously.$BTC
$ETH
1.6k
·
--
Bearish
7.21: BTC Reclaims $65,000, but Liquidity Still Faces Three Major Pressures.
BTC has regained $65,000, and near-term sentiment has somewhat improved. However, liquidity has not fully turned optimistic. The market is caught between an ongoing rebound trend and several key resistance areas that are still being released. What everyone needs to focus on is these pressure levels—not blindly chasing pumps.
Three key data points:
1. BTC breaks above $65,000, but selling pressure remains overhead
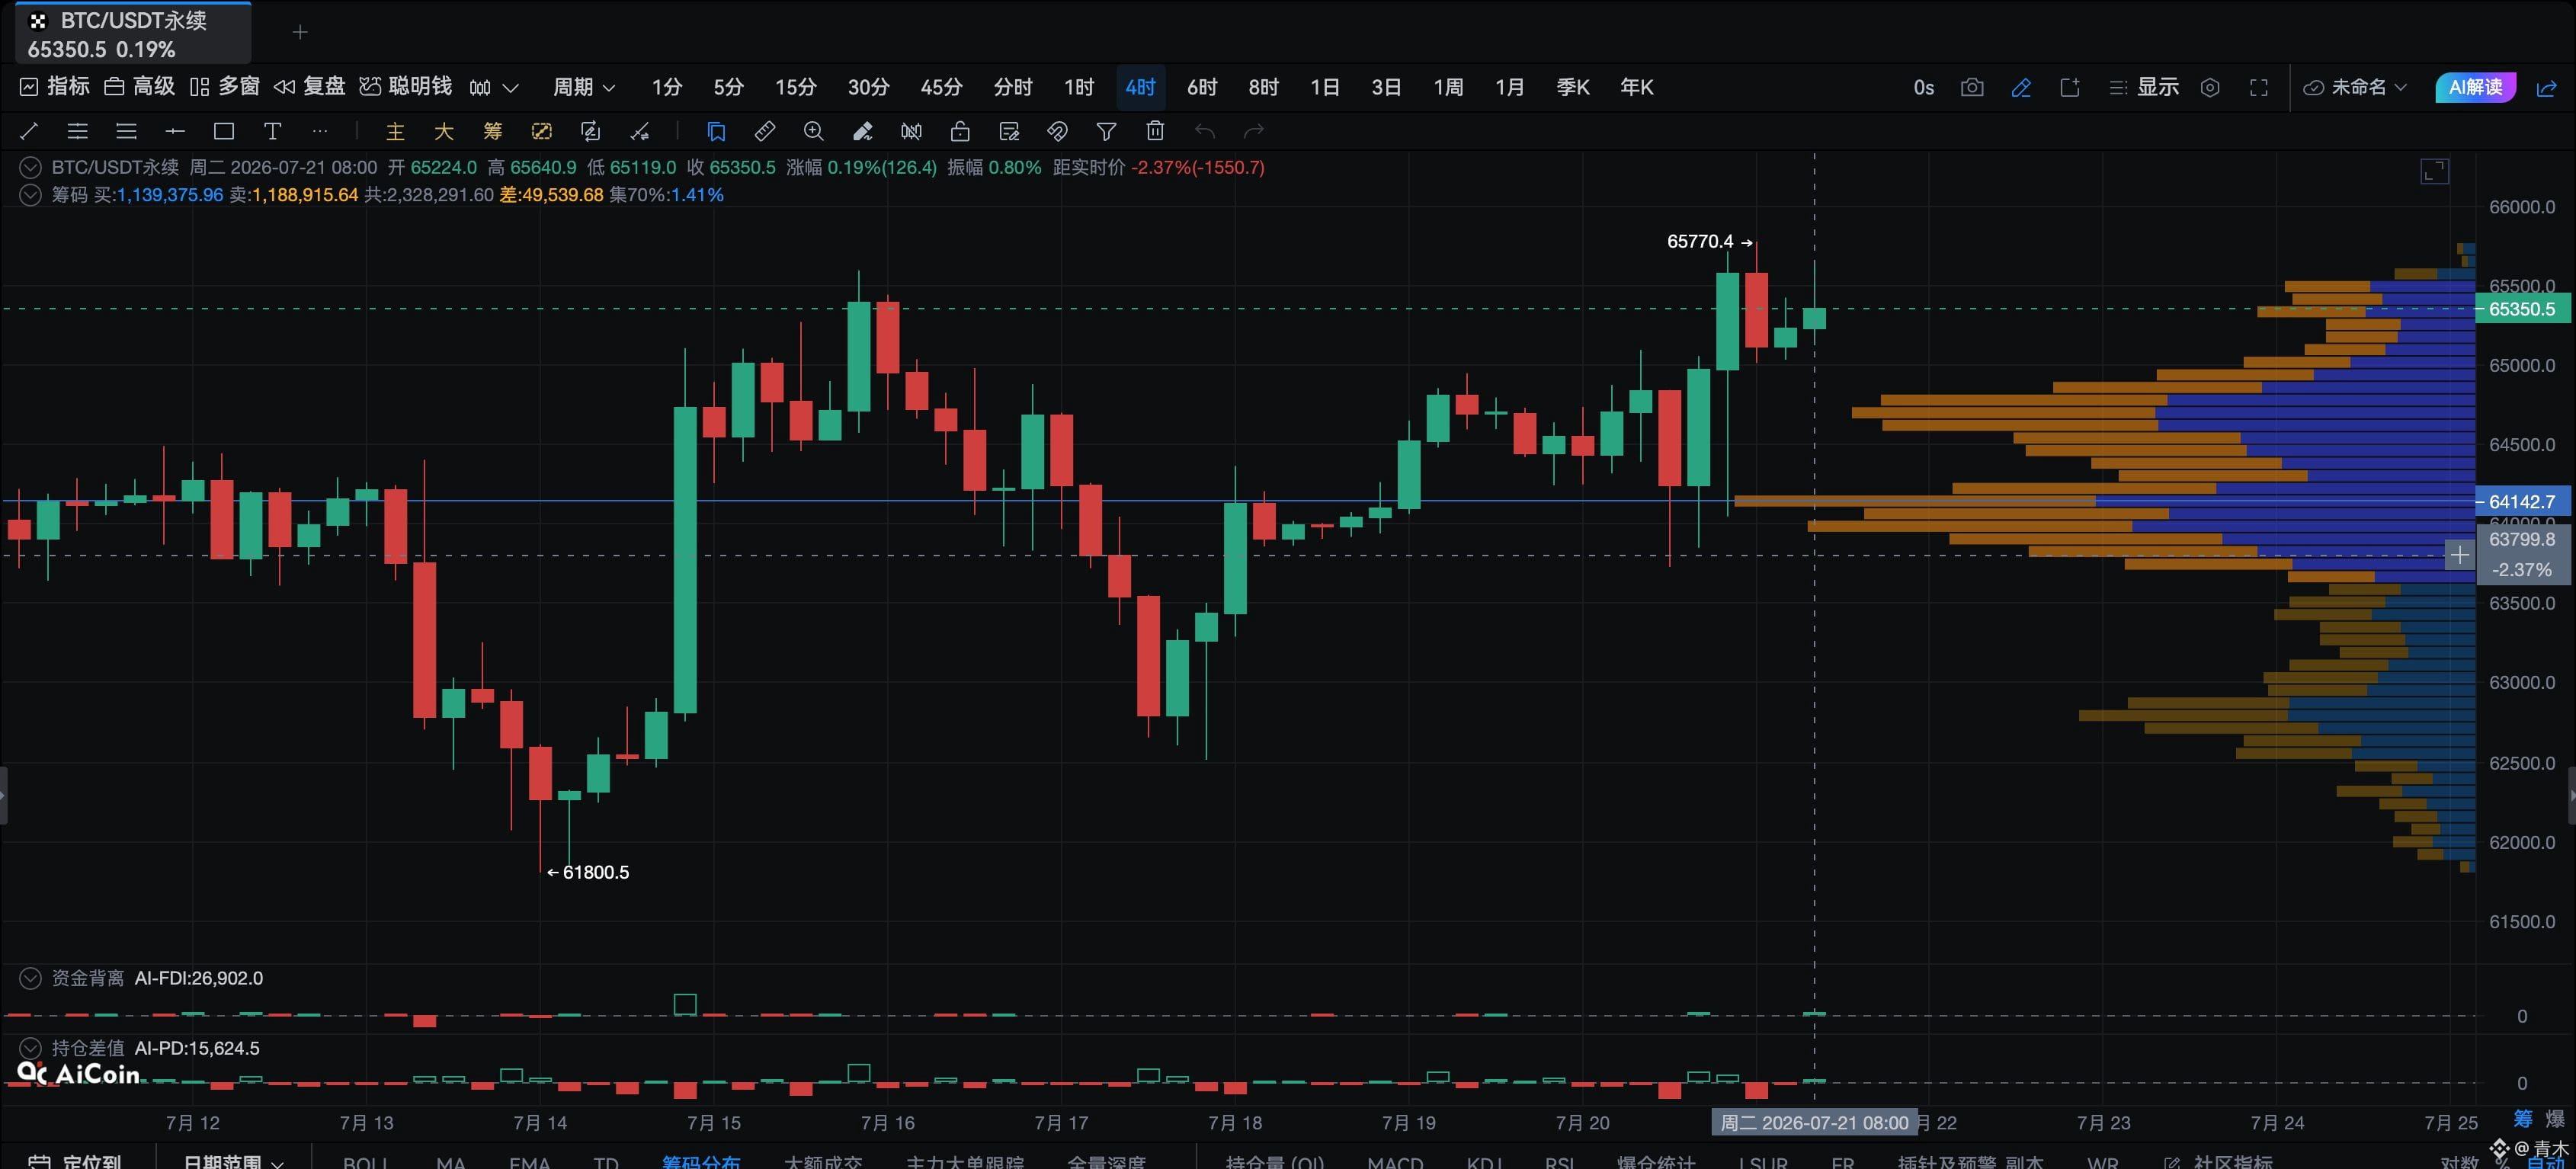
BTC is currently around $65,600. It has risen about 5% over the past 7 days. ETH and SOL are rebounding in sync, indicating that risk appetite is recovering.
However, the $65,000–$66,000 range remains an important battleground. If BTC cannot hold its breakout level, profit-taking is likely.
If you are already holding positions, you can continue to hold, and watch $65,000 as support.
If you want to enter, don’t chase. Wait for a pullback into the $64,000–$64,500 area. If it breaks below $63,500, consider reducing your position size.
2. Liquidity is returning, but institutional selling pressure still needs monitoring
Over the past 24 hours, market liquidations exceeded $1 billion. Liquidations on the short side account for a high proportion, suggesting that the recent rise has mainly been driven by short covering. Meanwhile, signals such as transfers from government-linked addresses and changes in institutional address holdings imply that potential selling pressure still exists above the market.
3. Macro risks may still amplify volatility
Fed rate-cut expectations, geopolitical conflicts, and the end-of-month FOMC meeting remain important variables that can influence market direction. If risk events escalate, BTC may quickly retrace.
Short setup suggestions:
BTC: Short 65,700–66,200. Targets: 64,700–64,000. Defense: 66,700.
ETH: Short 1,930–1,960. Targets: 1,850–1,800. Defense: 1,990.
The views, conclusions, and suggestions in this article are for reference only and do not constitute investment advice. The market is risky; invest with caution.$BTC
{future}(BTCUSDT)
$ETH
{future}(ETHUSDT)
7.21: BTC Reclaims $65,000, but Liquidity Still Faces Three Major Pressures.
BTC has regained $65,000, and near-term sentiment has somewhat improved. However, liquidity has not fully turned optimistic. The market is caught between an ongoing rebound trend and several key resistance areas that are still being released. What everyone needs to focus on is these pressure levels—not blindly chasing pumps.
Three key data points:
1. BTC breaks above $65,000, but selling pressure remains overhead
BTC is currently around $65,600. It has risen about 5% over the past 7 days. ETH and SOL are rebounding in sync, indicating that risk appetite is recovering.
However, the $65,000–$66,000 range remains an important battleground. If BTC cannot hold its breakout level, profit-taking is likely.
If you are already holding positions, you can continue to hold, and watch $65,000 as support.
If you want to enter, don’t chase. Wait for a pullback into the $64,000–$64,500 area. If it breaks below $63,500, consider reducing your position size.
2. Liquidity is returning, but institutional selling pressure still needs monitoring
Over the past 24 hours, market liquidations exceeded $1 billion. Liquidations on the short side account for a high proportion, suggesting that the recent rise has mainly been driven by short covering. Meanwhile, signals such as transfers from government-linked addresses and changes in institutional address holdings imply that potential selling pressure still exists above the market.
3. Macro risks may still amplify volatility
Fed rate-cut expectations, geopolitical conflicts, and the end-of-month FOMC meeting remain important variables that can influence market direction. If risk events escalate, BTC may quickly retrace.
Short setup suggestions:
BTC: Short 65,700–66,200. Targets: 64,700–64,000. Defense: 66,700.
ETH: Short 1,930–1,960. Targets: 1,850–1,800. Defense: 1,990.
The views, conclusions, and suggestions in this article are for reference only and do not constitute investment advice. The market is risky; invest with caution.$BTC
$ETH
BTC has regained $65,000, and near-term sentiment has somewhat improved. However, liquidity has not fully turned optimistic. The market is caught between an ongoing rebound trend and several key resistance areas that are still being released. What everyone needs to focus on is these pressure levels—not blindly chasing pumps.
Three key data points:
1. BTC breaks above $65,000, but selling pressure remains overhead
BTC is currently around $65,600. It has risen about 5% over the past 7 days. ETH and SOL are rebounding in sync, indicating that risk appetite is recovering.
However, the $65,000–$66,000 range remains an important battleground. If BTC cannot hold its breakout level, profit-taking is likely.
If you are already holding positions, you can continue to hold, and watch $65,000 as support.
If you want to enter, don’t chase. Wait for a pullback into the $64,000–$64,500 area. If it breaks below $63,500, consider reducing your position size.
2. Liquidity is returning, but institutional selling pressure still needs monitoring
Over the past 24 hours, market liquidations exceeded $1 billion. Liquidations on the short side account for a high proportion, suggesting that the recent rise has mainly been driven by short covering. Meanwhile, signals such as transfers from government-linked addresses and changes in institutional address holdings imply that potential selling pressure still exists above the market.
3. Macro risks may still amplify volatility
Fed rate-cut expectations, geopolitical conflicts, and the end-of-month FOMC meeting remain important variables that can influence market direction. If risk events escalate, BTC may quickly retrace.
Short setup suggestions:
BTC: Short 65,700–66,200. Targets: 64,700–64,000. Defense: 66,700.
ETH: Short 1,930–1,960. Targets: 1,850–1,800. Defense: 1,990.
The views, conclusions, and suggestions in this article are for reference only and do not constitute investment advice. The market is risky; invest with caution.$BTC
$ETH
440
·
--
Bullish
7.19 BTC and ETH current market situation and key price level analysis:
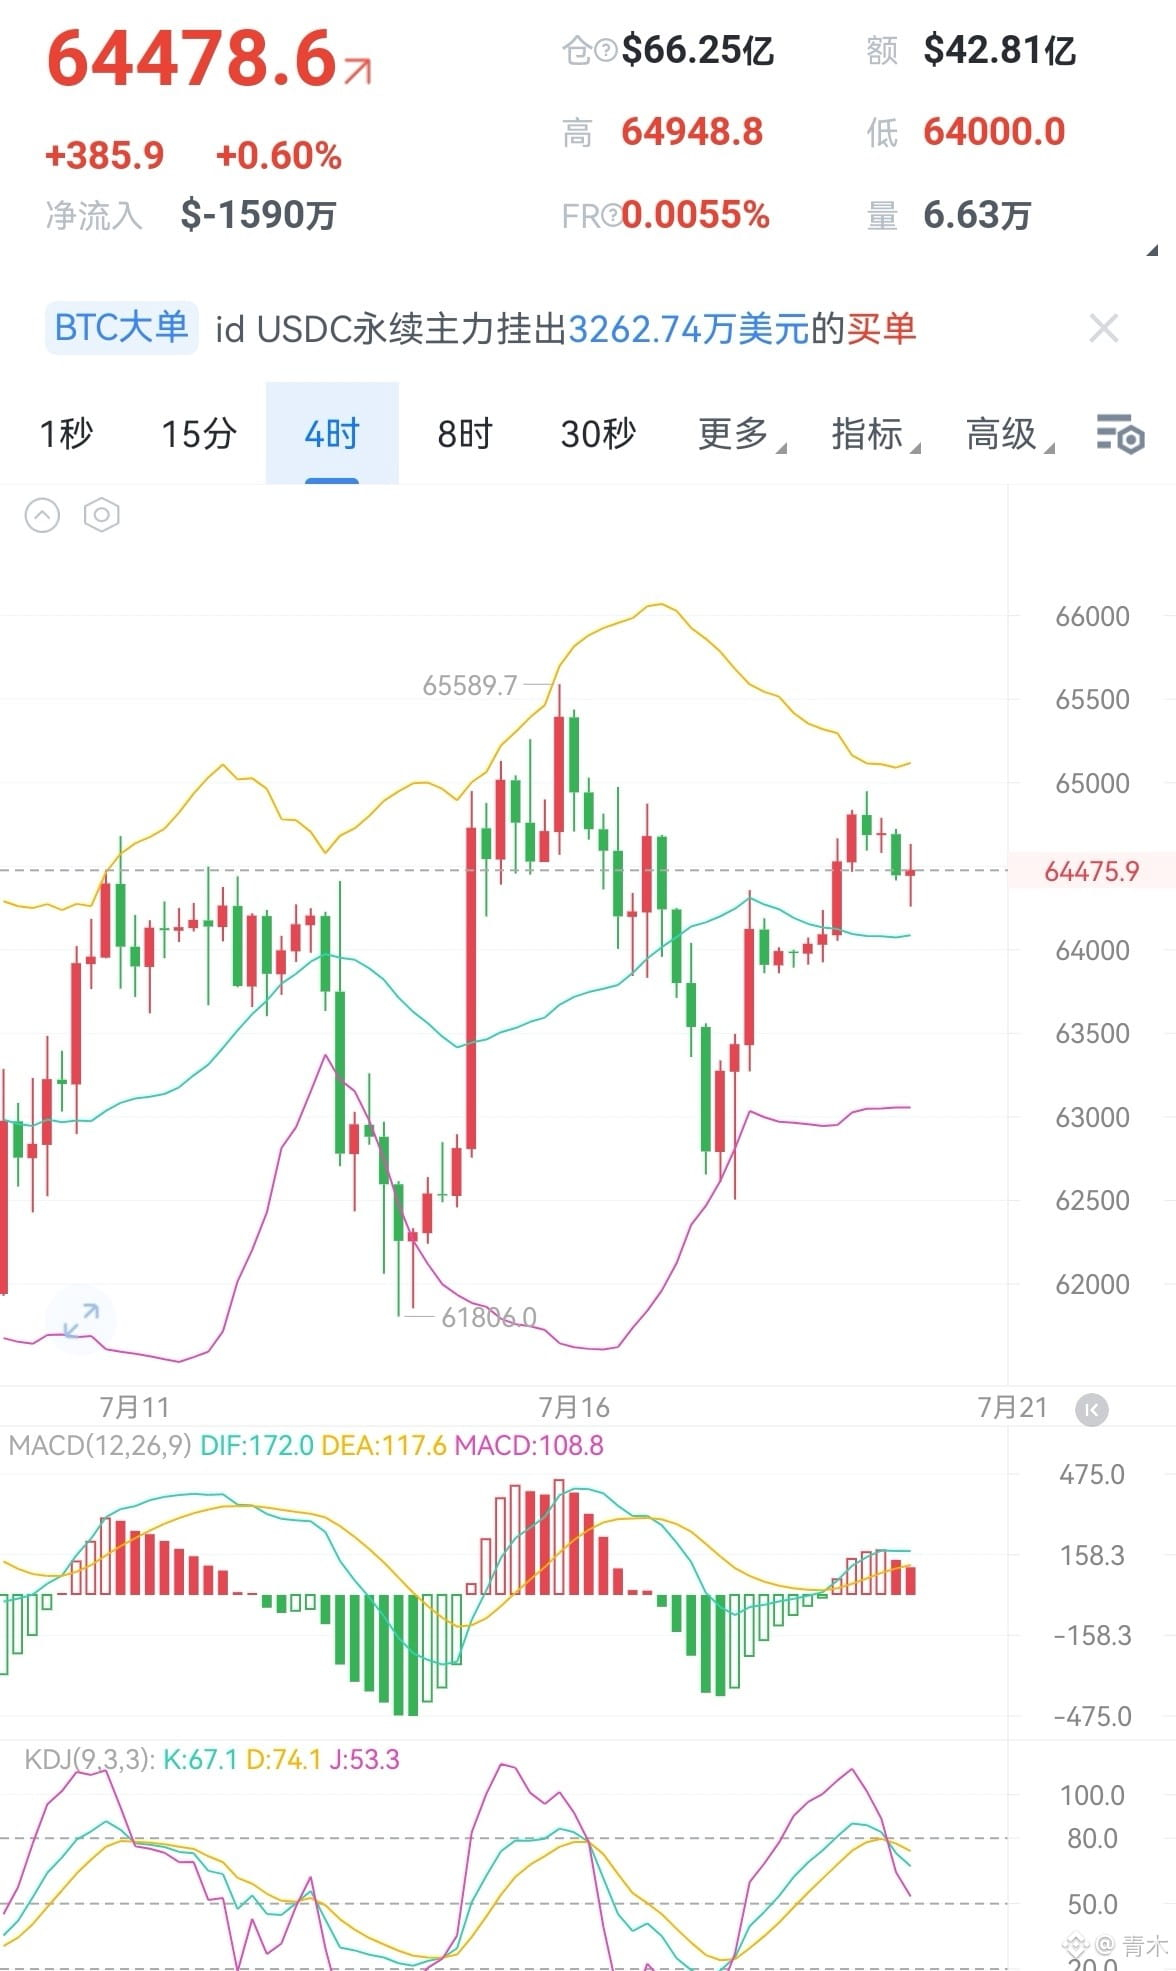
Both BTC and ETH are currently in a mild uptrend. The near-term outlook is relatively strong, and the overall price action is moving within a recent consolidation range. Key resistance and support levels are clearly defined. BTC is currently trading at 64,484. In the last 1 hour it is up 0.11%, in the last 4 hours it is slightly down 0.03%, and over the past 24 hours it is up 0.66%. Overall, it shows a narrow-range consolidation with a bullish bias, gradually rising as it leans on short-term moving averages.
First support: 64,000 (the lower edge of the recent consolidation base, and also the area with dense 24-hour trading)
Second support: 63,500 (the prior pullback low; if it breaks below, the short-term uptrend would be at risk)
First resistance: 65,000 (a round-number level + the recent rebound high; there is some selling pressure)
Second resistance: 65,500 (the upper boundary of the prior consolidation range; a breakout could open further upside room)
ETH is currently trading at 1,869. It is down 0.13% in the last 1 hour, down 0.28% in the last 4 hours, and up 1.41% over the past 24 hours. The percentage gain is stronger than BTC. It demonstrates relatively stronger upside correlation. The short-term pullback is a normal cooldown during an ongoing uptrend.
First support: 1,850 (the dense 24-hour trading area, and also support along the short-term uptrend line)
Second support: 1,820 (the prior consolidation range high; if it breaks, the strong short-term structure would weaken)
First resistance: 1,890 (the recent rebound high; noticeable selling pressure near the round-number area)
Second resistance: 1,920 (the upper edge of the prior consolidation range; a breakout would challenge the new highs within the year)
Recent trading results have not been ideal. Consult btc0796 and exchange market views together.
Long position suggestions:
BTC 63,500–64,000 for long; targets: 65,000–65,500; defense: 63,000
ETH 1,780–1,820 for long; targets: 1,900–1,940; defense: 1,740
Short position suggestions:
BTC 65,000–65,500 for short; targets: 64,000–63,000; defense: 65,700
ETH 1,890–1,940 for short; targets: 1,820–1,740; defense: 1,960
The viewpoints, conclusions, and suggestions in this article are for reference only and do not constitute investment advice. The market is risky; invest with caution.$BTC
{future}(BTCUSDT)
$ETH
{future}(ETHUSDT)
7.19 BTC and ETH current market situation and key price level analysis:
Both BTC and ETH are currently in a mild uptrend. The near-term outlook is relatively strong, and the overall price action is moving within a recent consolidation range. Key resistance and support levels are clearly defined. BTC is currently trading at 64,484. In the last 1 hour it is up 0.11%, in the last 4 hours it is slightly down 0.03%, and over the past 24 hours it is up 0.66%. Overall, it shows a narrow-range consolidation with a bullish bias, gradually rising as it leans on short-term moving averages.
First support: 64,000 (the lower edge of the recent consolidation base, and also the area with dense 24-hour trading)
Second support: 63,500 (the prior pullback low; if it breaks below, the short-term uptrend would be at risk)
First resistance: 65,000 (a round-number level + the recent rebound high; there is some selling pressure)
Second resistance: 65,500 (the upper boundary of the prior consolidation range; a breakout could open further upside room)
ETH is currently trading at 1,869. It is down 0.13% in the last 1 hour, down 0.28% in the last 4 hours, and up 1.41% over the past 24 hours. The percentage gain is stronger than BTC. It demonstrates relatively stronger upside correlation. The short-term pullback is a normal cooldown during an ongoing uptrend.
First support: 1,850 (the dense 24-hour trading area, and also support along the short-term uptrend line)
Second support: 1,820 (the prior consolidation range high; if it breaks, the strong short-term structure would weaken)
First resistance: 1,890 (the recent rebound high; noticeable selling pressure near the round-number area)
Second resistance: 1,920 (the upper edge of the prior consolidation range; a breakout would challenge the new highs within the year)
Recent trading results have not been ideal. Consult btc0796 and exchange market views together.
Long position suggestions:
BTC 63,500–64,000 for long; targets: 65,000–65,500; defense: 63,000
ETH 1,780–1,820 for long; targets: 1,900–1,940; defense: 1,740
Short position suggestions:
BTC 65,000–65,500 for short; targets: 64,000–63,000; defense: 65,700
ETH 1,890–1,940 for short; targets: 1,820–1,740; defense: 1,960
The viewpoints, conclusions, and suggestions in this article are for reference only and do not constitute investment advice. The market is risky; invest with caution.$BTC
$ETH
Both BTC and ETH are currently in a mild uptrend. The near-term outlook is relatively strong, and the overall price action is moving within a recent consolidation range. Key resistance and support levels are clearly defined. BTC is currently trading at 64,484. In the last 1 hour it is up 0.11%, in the last 4 hours it is slightly down 0.03%, and over the past 24 hours it is up 0.66%. Overall, it shows a narrow-range consolidation with a bullish bias, gradually rising as it leans on short-term moving averages.
First support: 64,000 (the lower edge of the recent consolidation base, and also the area with dense 24-hour trading)
Second support: 63,500 (the prior pullback low; if it breaks below, the short-term uptrend would be at risk)
First resistance: 65,000 (a round-number level + the recent rebound high; there is some selling pressure)
Second resistance: 65,500 (the upper boundary of the prior consolidation range; a breakout could open further upside room)
ETH is currently trading at 1,869. It is down 0.13% in the last 1 hour, down 0.28% in the last 4 hours, and up 1.41% over the past 24 hours. The percentage gain is stronger than BTC. It demonstrates relatively stronger upside correlation. The short-term pullback is a normal cooldown during an ongoing uptrend.
First support: 1,850 (the dense 24-hour trading area, and also support along the short-term uptrend line)
Second support: 1,820 (the prior consolidation range high; if it breaks, the strong short-term structure would weaken)
First resistance: 1,890 (the recent rebound high; noticeable selling pressure near the round-number area)
Second resistance: 1,920 (the upper edge of the prior consolidation range; a breakout would challenge the new highs within the year)
Recent trading results have not been ideal. Consult btc0796 and exchange market views together.
Long position suggestions:
BTC 63,500–64,000 for long; targets: 65,000–65,500; defense: 63,000
ETH 1,780–1,820 for long; targets: 1,900–1,940; defense: 1,740
Short position suggestions:
BTC 65,000–65,500 for short; targets: 64,000–63,000; defense: 65,700
ETH 1,890–1,940 for short; targets: 1,820–1,740; defense: 1,960
The viewpoints, conclusions, and suggestions in this article are for reference only and do not constitute investment advice. The market is risky; invest with caution.$BTC
$ETH
544
·
--
Bullish
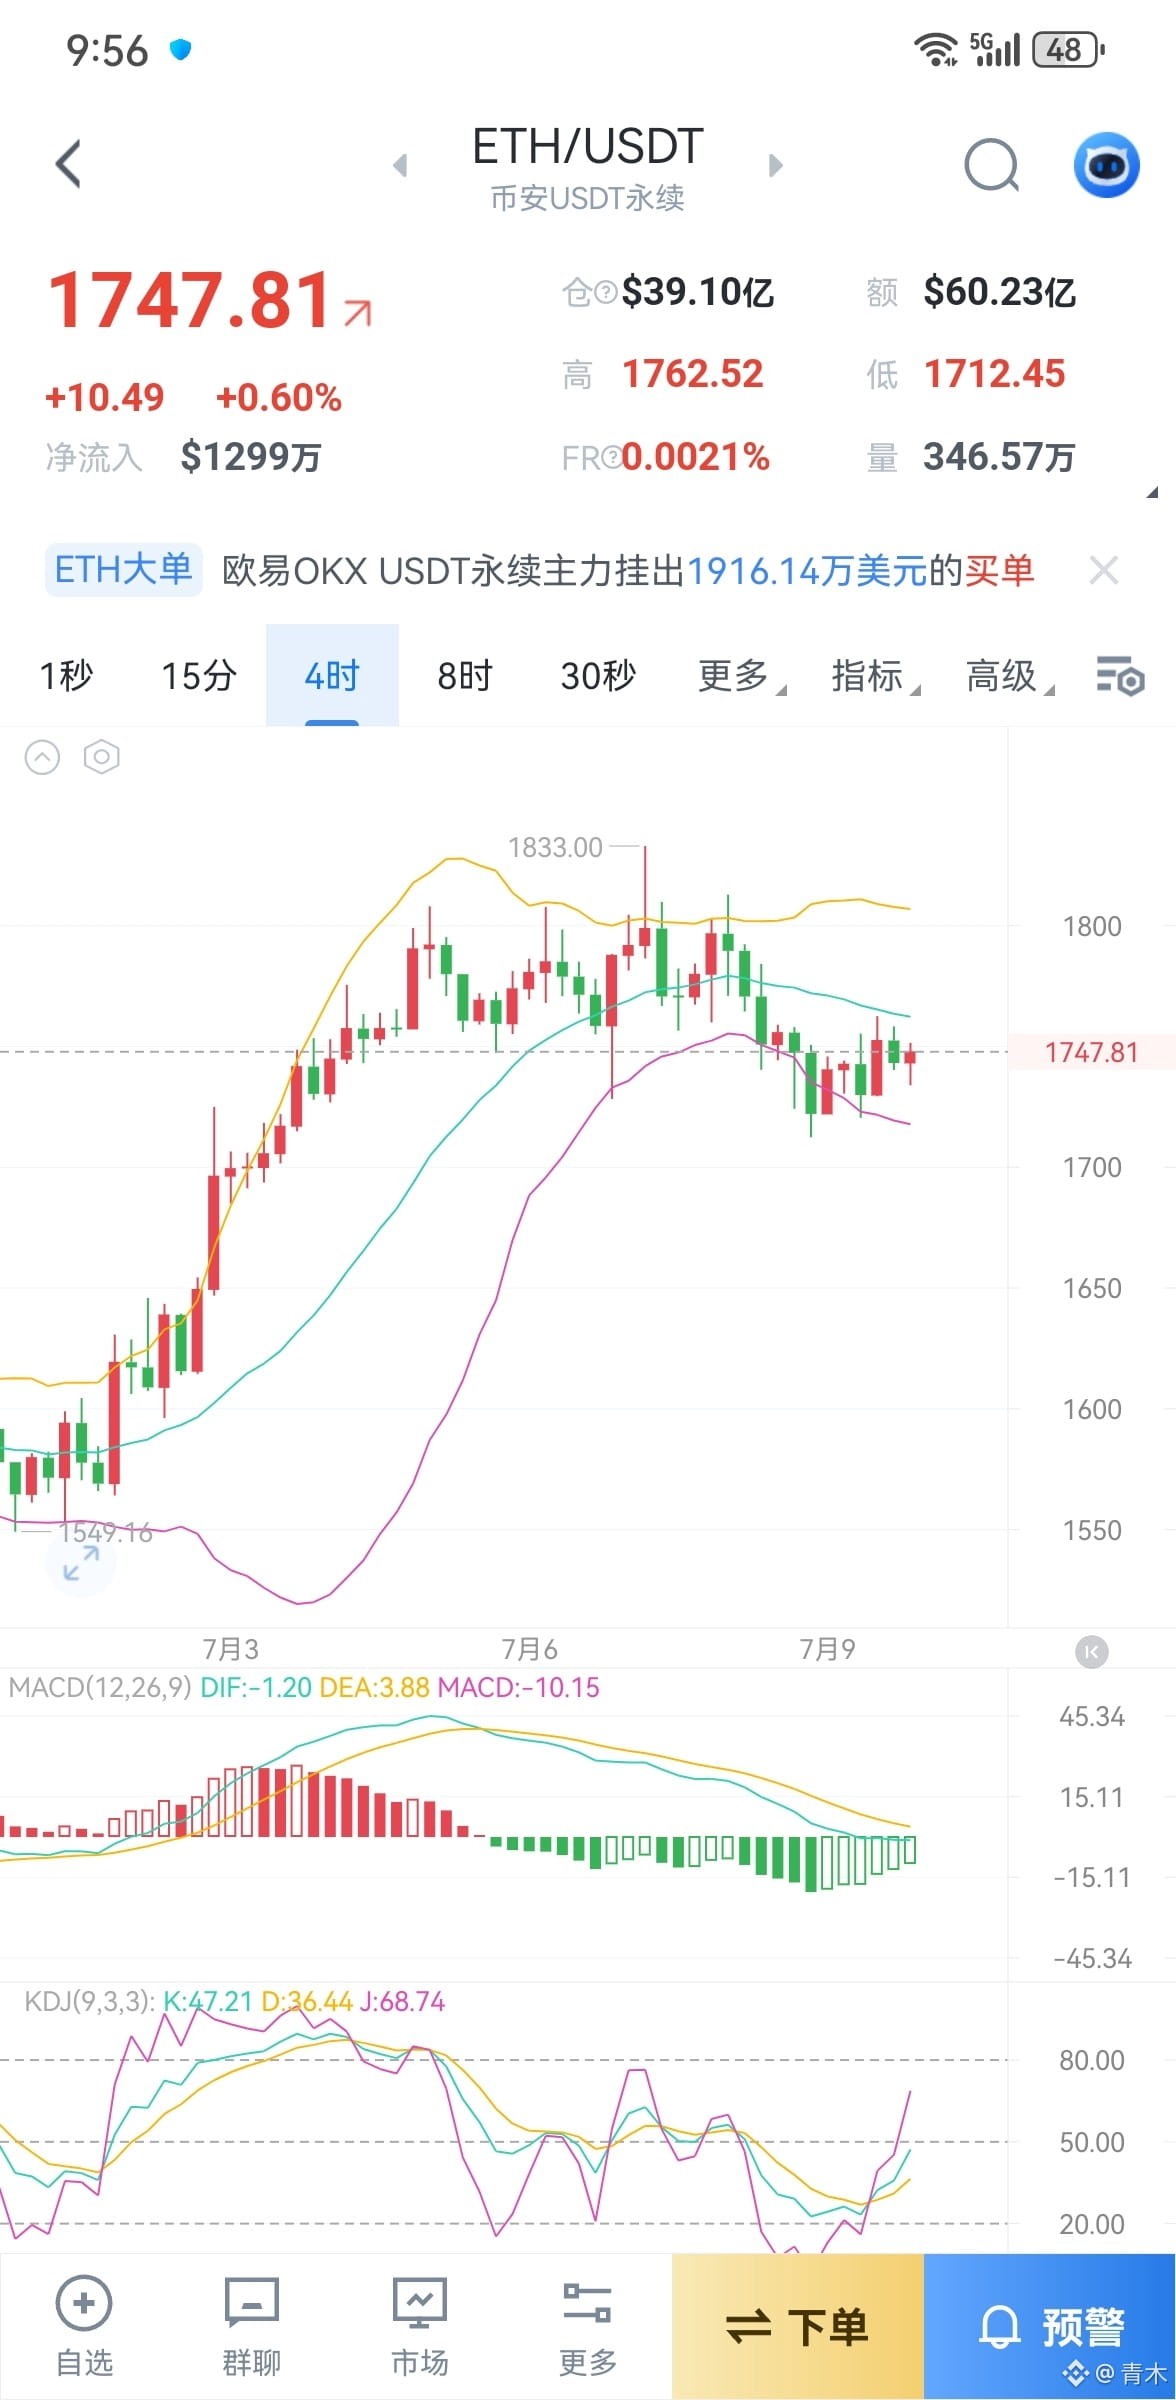
7.9: Iran–U.S. conflict escalates—can BTC at 62,000 hold up, and is ETH at 1,700 on the line of life and death?
After BTC surged to 64,500 and was suppressed by geopolitical tensions, it fell to around 61,500 at the lowest. This afternoon, there has been a strong intraday rebound, and it has already broken above 63,000 and is currently stabilizing. Resistance lies at 63,500–64,000 above; support sits at 61,500–61,800 below. If it breaks down, further downside could target 60,000–59,500.
ETH is also under pressure. Yesterday it pulled back from the 1,812 high to the 1,700–1,720 area, and is currently consolidating around 1,750. Resistance is at 1,760–1,780; if it holds, it may continue testing levels above 1,800. Support is at 1,680–1,700; if it breaks, it could drop further to 1,650.
The key variable in the market remains sustained pressure from geopolitical risk. Yesterday, the U.S. launched strikes on more than 80 military targets in Iran, and Trump announced the end of the Iran ceasefire agreement. International oil prices continue to rise, and risk assets are under broad pressure. After BTC hit 64,500, it retraced by more than $3,000; the technical-repair rally was interrupted by external factors. With long and short positions intertwined and direction unclear, the near-term market is in a tug-of-war between geopolitical suppression and institutions accumulating at low levels—let’s see who has the last laugh.
Recent trading hasn’t been ideal. Consult btc0796 to discuss the market together.
Trading suggestions:
Go long BTC from 61,500–62,000; target 63,000–64,000; defensive stop 61,000.
Go long ETH from 1,680–1,720; target 1,780–1,840; defensive stop 1,650.
The views, conclusions, and recommendations in this article are for reference only and do not constitute investment advice. The market is risky; invest with caution.$BTC
{future}(BTCUSDT)
$ETH
{future}(ETHUSDT)
7.9: Iran–U.S. conflict escalates—can BTC at 62,000 hold up, and is ETH at 1,700 on the line of life and death?
After BTC surged to 64,500 and was suppressed by geopolitical tensions, it fell to around 61,500 at the lowest. This afternoon, there has been a strong intraday rebound, and it has already broken above 63,000 and is currently stabilizing. Resistance lies at 63,500–64,000 above; support sits at 61,500–61,800 below. If it breaks down, further downside could target 60,000–59,500.
ETH is also under pressure. Yesterday it pulled back from the 1,812 high to the 1,700–1,720 area, and is currently consolidating around 1,750. Resistance is at 1,760–1,780; if it holds, it may continue testing levels above 1,800. Support is at 1,680–1,700; if it breaks, it could drop further to 1,650.
The key variable in the market remains sustained pressure from geopolitical risk. Yesterday, the U.S. launched strikes on more than 80 military targets in Iran, and Trump announced the end of the Iran ceasefire agreement. International oil prices continue to rise, and risk assets are under broad pressure. After BTC hit 64,500, it retraced by more than $3,000; the technical-repair rally was interrupted by external factors. With long and short positions intertwined and direction unclear, the near-term market is in a tug-of-war between geopolitical suppression and institutions accumulating at low levels—let’s see who has the last laugh.
Recent trading hasn’t been ideal. Consult btc0796 to discuss the market together.
Trading suggestions:
Go long BTC from 61,500–62,000; target 63,000–64,000; defensive stop 61,000.
Go long ETH from 1,680–1,720; target 1,780–1,840; defensive stop 1,650.
The views, conclusions, and recommendations in this article are for reference only and do not constitute investment advice. The market is risky; invest with caution.$BTC
$ETH
After BTC surged to 64,500 and was suppressed by geopolitical tensions, it fell to around 61,500 at the lowest. This afternoon, there has been a strong intraday rebound, and it has already broken above 63,000 and is currently stabilizing. Resistance lies at 63,500–64,000 above; support sits at 61,500–61,800 below. If it breaks down, further downside could target 60,000–59,500.
ETH is also under pressure. Yesterday it pulled back from the 1,812 high to the 1,700–1,720 area, and is currently consolidating around 1,750. Resistance is at 1,760–1,780; if it holds, it may continue testing levels above 1,800. Support is at 1,680–1,700; if it breaks, it could drop further to 1,650.
The key variable in the market remains sustained pressure from geopolitical risk. Yesterday, the U.S. launched strikes on more than 80 military targets in Iran, and Trump announced the end of the Iran ceasefire agreement. International oil prices continue to rise, and risk assets are under broad pressure. After BTC hit 64,500, it retraced by more than $3,000; the technical-repair rally was interrupted by external factors. With long and short positions intertwined and direction unclear, the near-term market is in a tug-of-war between geopolitical suppression and institutions accumulating at low levels—let’s see who has the last laugh.
Recent trading hasn’t been ideal. Consult btc0796 to discuss the market together.
Trading suggestions:
Go long BTC from 61,500–62,000; target 63,000–64,000; defensive stop 61,000.
Go long ETH from 1,680–1,720; target 1,780–1,840; defensive stop 1,650.
The views, conclusions, and recommendations in this article are for reference only and do not constitute investment advice. The market is risky; invest with caution.$BTC
$ETH
1
1
3.4k
·
--
Bullish
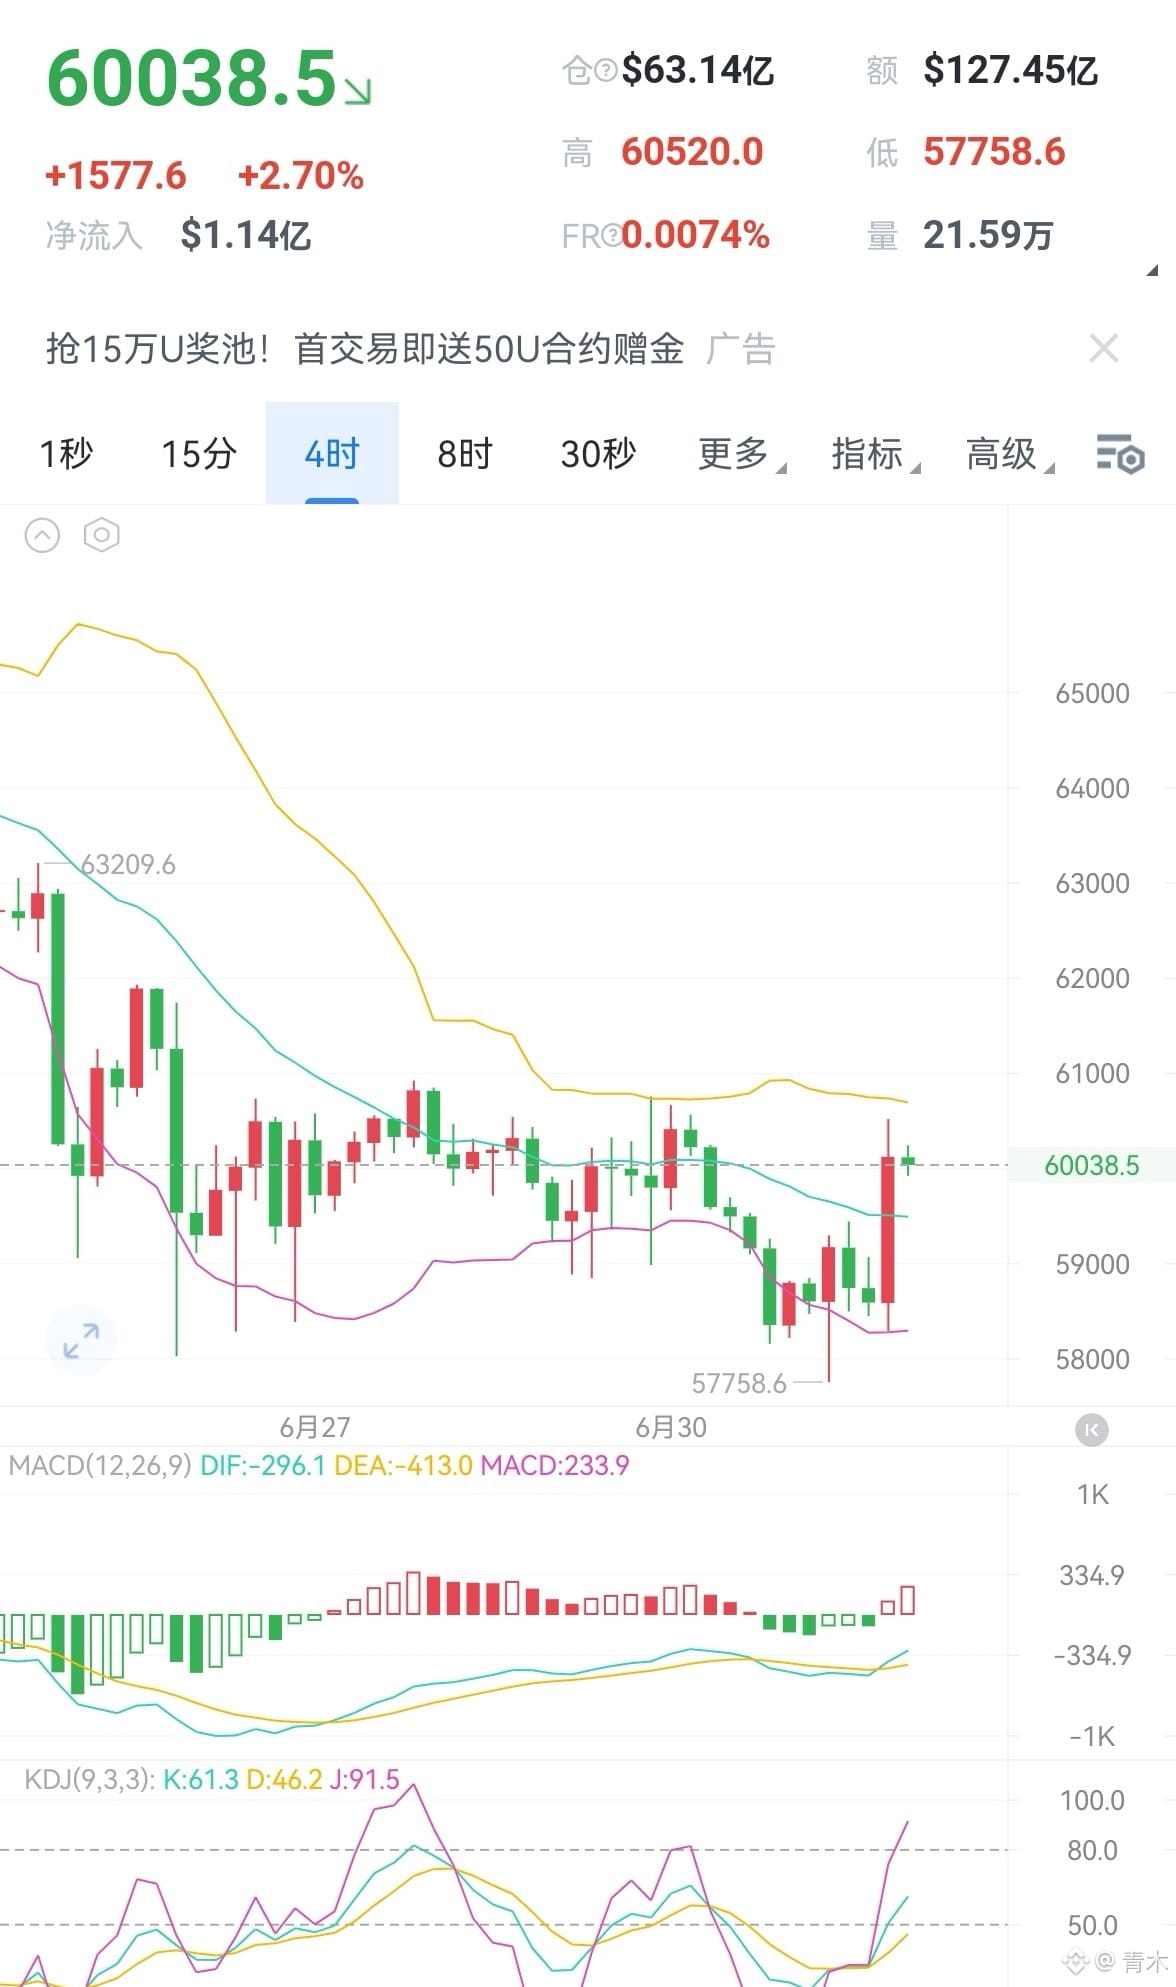
7.2 The Bitcoin dip-buying army counterattacks—has the market truly reversed, and the bulls are taking action?
Key takeaway: Bitcoin and Ethereum are both in short-term upward trends. Combined with current price and market sentiment, the key support and resistance zones are clear. Ethereum has stronger short-term momentum. Yesterday, after Bitcoin fell below 58,000, it quickly reclaimed lost ground in an instant. The dip-buyers are strong. Now the price is back around 60,000; the 60,000 level is still rock-solid. As long as this bullish move is a real reversal, the subsequent breakout is only a matter of time.
Bitcoin:
First support: 59,000. This corresponds to the key neckline level of the upward retracement on the 4-hour timeframe, and it is also the 50% retracement level of the 24-hour price gain.
Second support: 58,000. This is the upper edge of the recent consolidation range. If it breaks, it will confirm the end of the short-term uptrend.
First resistance: 61,000. This is the resistance level from a prior minor high. Given current market volume, a breakout needs supportive volume.
Second resistance: 62,000. This is near the previous secondary high from history, where sell pressure is expected to be stronger.
Ethereum:
First support: 1,580. This corresponds to the support of the upward trendline on the 4-hour timeframe, and it is also the key level where the 24-hour gain is given back.
Second support: 1,550. This is the core price level of the recent consolidation platform.
First resistance: 1,650. This is the upper edge of the prior ranging area. With ETH leading BTC in 24-hour gains, the probability of an ETH breakout is higher.
Second resistance: 1,700. This is the key resistance level since last year, with many investors trapped at higher prices. Recent operations have not been ideal—consult btc0796 to discuss the market together.
Trading suggestions:
BTC: Go long at 59,000–59,500. Targets: 61,000–62,000. Stop-loss/defense: 58,500.
ETH: Go long at 1,560–1,600. Targets: 1,680–1,760. Stop-loss/defense: 1,530.
The views, conclusions, and recommendations in this article are for reference only and do not constitute investment advice. The market is risky—invest carefully.
$BTC
{future}(BTCUSDT)
$ETH
{future}(ETHUSDT)
7.2 The Bitcoin dip-buying army counterattacks—has the market truly reversed, and the bulls are taking action?
Key takeaway: Bitcoin and Ethereum are both in short-term upward trends. Combined with current price and market sentiment, the key support and resistance zones are clear. Ethereum has stronger short-term momentum. Yesterday, after Bitcoin fell below 58,000, it quickly reclaimed lost ground in an instant. The dip-buyers are strong. Now the price is back around 60,000; the 60,000 level is still rock-solid. As long as this bullish move is a real reversal, the subsequent breakout is only a matter of time.
Bitcoin:
First support: 59,000. This corresponds to the key neckline level of the upward retracement on the 4-hour timeframe, and it is also the 50% retracement level of the 24-hour price gain.
Second support: 58,000. This is the upper edge of the recent consolidation range. If it breaks, it will confirm the end of the short-term uptrend.
First resistance: 61,000. This is the resistance level from a prior minor high. Given current market volume, a breakout needs supportive volume.
Second resistance: 62,000. This is near the previous secondary high from history, where sell pressure is expected to be stronger.
Ethereum:
First support: 1,580. This corresponds to the support of the upward trendline on the 4-hour timeframe, and it is also the key level where the 24-hour gain is given back.
Second support: 1,550. This is the core price level of the recent consolidation platform.
First resistance: 1,650. This is the upper edge of the prior ranging area. With ETH leading BTC in 24-hour gains, the probability of an ETH breakout is higher.
Second resistance: 1,700. This is the key resistance level since last year, with many investors trapped at higher prices. Recent operations have not been ideal—consult btc0796 to discuss the market together.
Trading suggestions:
BTC: Go long at 59,000–59,500. Targets: 61,000–62,000. Stop-loss/defense: 58,500.
ETH: Go long at 1,560–1,600. Targets: 1,680–1,760. Stop-loss/defense: 1,530.
The views, conclusions, and recommendations in this article are for reference only and do not constitute investment advice. The market is risky—invest carefully.
$BTC
$ETH
Key takeaway: Bitcoin and Ethereum are both in short-term upward trends. Combined with current price and market sentiment, the key support and resistance zones are clear. Ethereum has stronger short-term momentum. Yesterday, after Bitcoin fell below 58,000, it quickly reclaimed lost ground in an instant. The dip-buyers are strong. Now the price is back around 60,000; the 60,000 level is still rock-solid. As long as this bullish move is a real reversal, the subsequent breakout is only a matter of time.
Bitcoin:
First support: 59,000. This corresponds to the key neckline level of the upward retracement on the 4-hour timeframe, and it is also the 50% retracement level of the 24-hour price gain.
Second support: 58,000. This is the upper edge of the recent consolidation range. If it breaks, it will confirm the end of the short-term uptrend.
First resistance: 61,000. This is the resistance level from a prior minor high. Given current market volume, a breakout needs supportive volume.
Second resistance: 62,000. This is near the previous secondary high from history, where sell pressure is expected to be stronger.
Ethereum:
First support: 1,580. This corresponds to the support of the upward trendline on the 4-hour timeframe, and it is also the key level where the 24-hour gain is given back.
Second support: 1,550. This is the core price level of the recent consolidation platform.
First resistance: 1,650. This is the upper edge of the prior ranging area. With ETH leading BTC in 24-hour gains, the probability of an ETH breakout is higher.
Second resistance: 1,700. This is the key resistance level since last year, with many investors trapped at higher prices. Recent operations have not been ideal—consult btc0796 to discuss the market together.
Trading suggestions:
BTC: Go long at 59,000–59,500. Targets: 61,000–62,000. Stop-loss/defense: 58,500.
ETH: Go long at 1,560–1,600. Targets: 1,680–1,760. Stop-loss/defense: 1,530.
The views, conclusions, and recommendations in this article are for reference only and do not constitute investment advice. The market is risky—invest carefully.
$BTC
$ETH
1
2.3k
·
--
Bullish
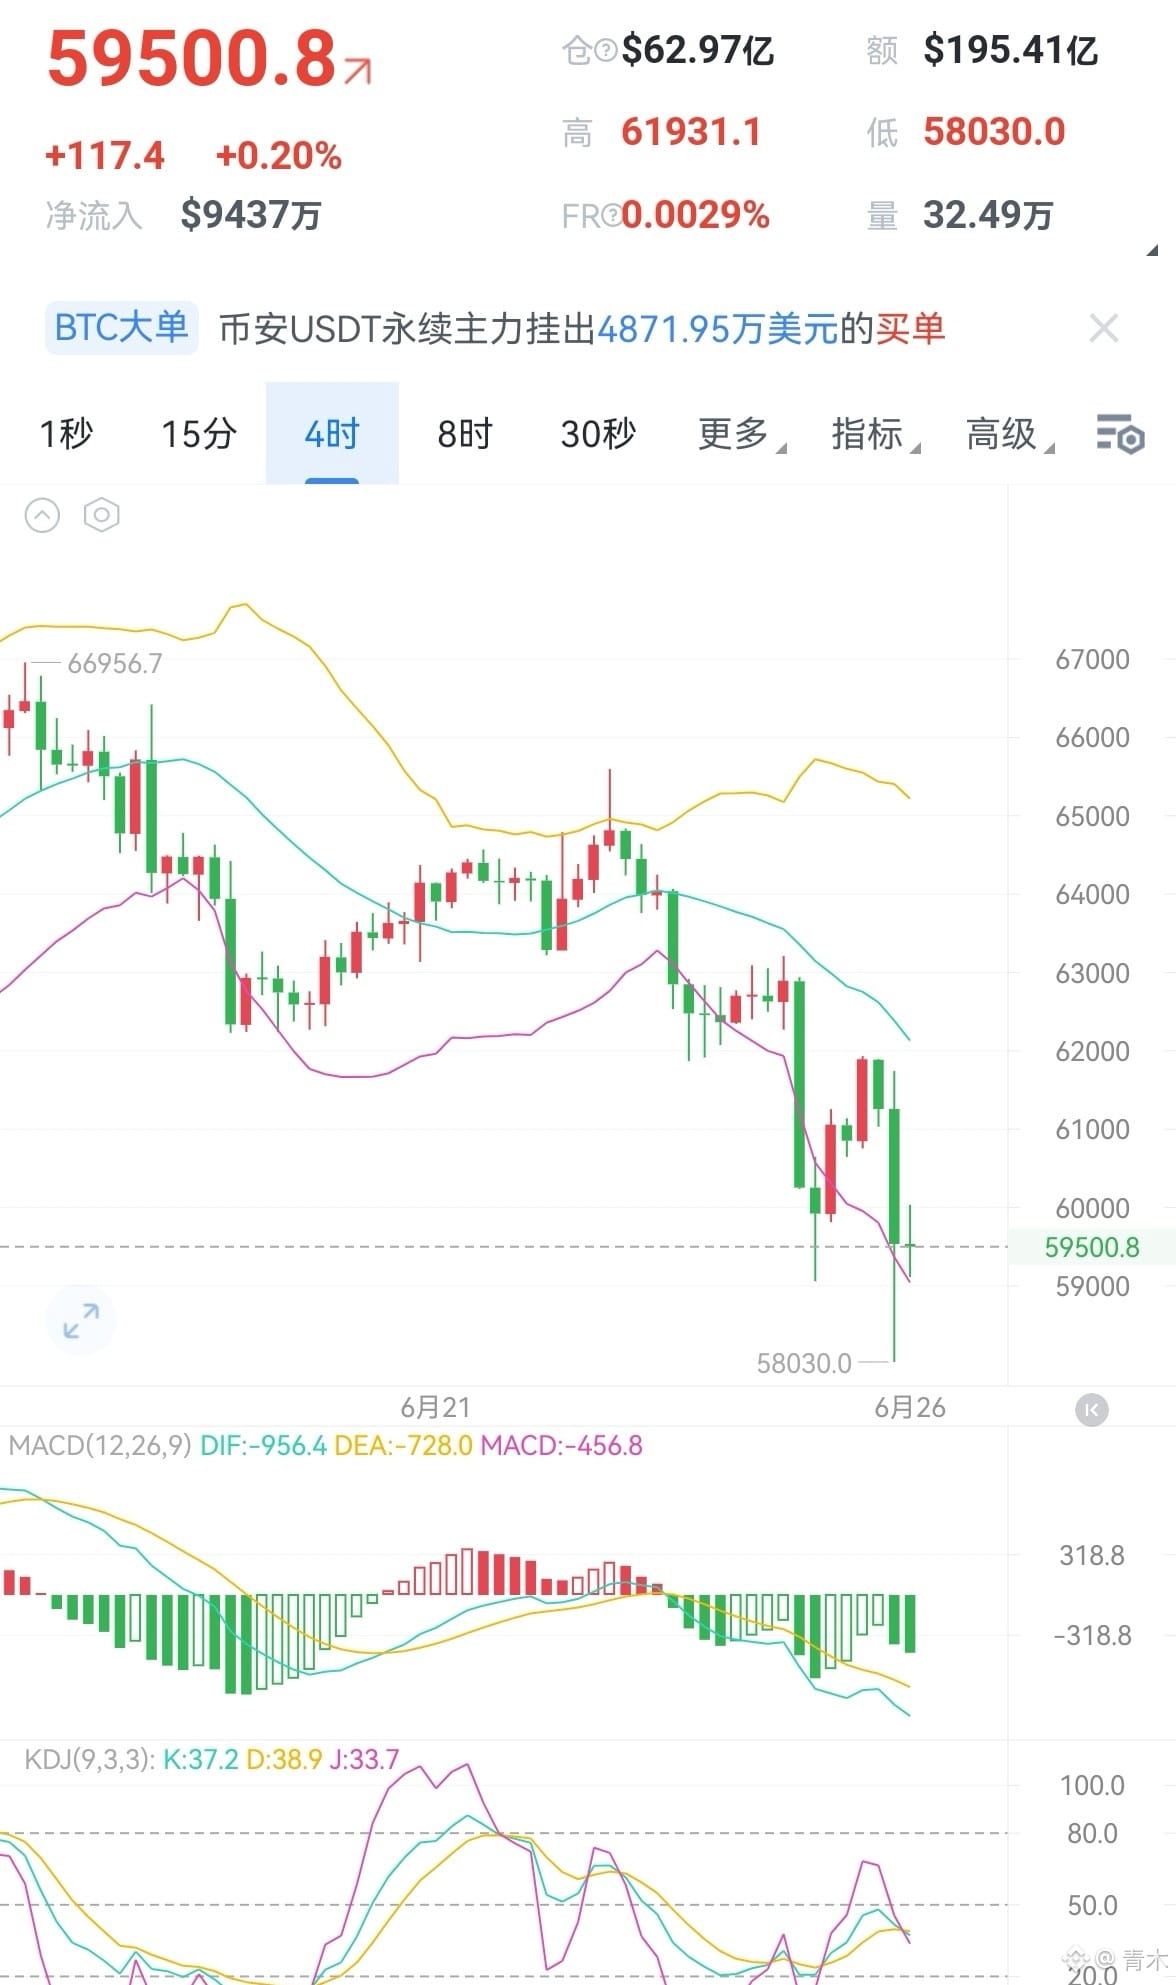
6.26: What are BTC’s key support and resistance levels going forward?
Based on the current BTC price trend and market data, we can clearly identify its key support and resistance zones:
I. Key Resistance Levels
1. First resistance zone: 60000-60500
This zone is the lower edge of the consolidation platform before this round of BTC’s decline, and it is also the target level for a rebound to recover the 24-hour drop. Considering the distribution characteristics of market short positions, there are many short stop-loss orders in this range. If there is a breakout with strong volume, it may further challenge the upper edge of the prior consolidation center at 61200-61500.
2. Strong resistance zone: 61500-62000
This is the area of BTC’s recent local highs, and it is also an important watershed for market sentiment between bulls and bears. If BTC can hold this range effectively, it will reverse the current bearish market structure.
II. Key Support Levels
1. First support zone: 58000-58500
This zone corresponds to the 0.382 Fibonacci retracement level of this round of the upward trend. Combined with the positioning characteristics of long capital across the entire market, there are many long dip-buying orders here. If price pulls back into this zone, a technical rebound is likely.
2. Strong support zone: 57000-57500
This is the key structural support for this round of the uptrend, and it is also a critical point for market sentiment. If this range is broken down effectively, it will confirm the end of the short-term uptrend, likely triggering a new wave of stop-loss selling and further probing into the 55000-56000 zone.
Recent trading has not been ideal. Consult btc0796 to exchange views and discuss the market.
Trading Suggestions:
BTC: Go long at 58000-58500, target 60500 - 61500, defense 57500
ETH: Go long at 1500-1530, target 1650 - 1750, defense 1460
The viewpoints, conclusions, and suggestions in this article are for reference only and do not constitute investment advice. The market is risky; invest with caution.
$BTC
{future}(BTCUSDT)
$ETH
{future}(ETHUSDT)
6.26: What are BTC’s key support and resistance levels going forward?
Based on the current BTC price trend and market data, we can clearly identify its key support and resistance zones:
I. Key Resistance Levels
1. First resistance zone: 60000-60500
This zone is the lower edge of the consolidation platform before this round of BTC’s decline, and it is also the target level for a rebound to recover the 24-hour drop. Considering the distribution characteristics of market short positions, there are many short stop-loss orders in this range. If there is a breakout with strong volume, it may further challenge the upper edge of the prior consolidation center at 61200-61500.
2. Strong resistance zone: 61500-62000
This is the area of BTC’s recent local highs, and it is also an important watershed for market sentiment between bulls and bears. If BTC can hold this range effectively, it will reverse the current bearish market structure.
II. Key Support Levels
1. First support zone: 58000-58500
This zone corresponds to the 0.382 Fibonacci retracement level of this round of the upward trend. Combined with the positioning characteristics of long capital across the entire market, there are many long dip-buying orders here. If price pulls back into this zone, a technical rebound is likely.
2. Strong support zone: 57000-57500
This is the key structural support for this round of the uptrend, and it is also a critical point for market sentiment. If this range is broken down effectively, it will confirm the end of the short-term uptrend, likely triggering a new wave of stop-loss selling and further probing into the 55000-56000 zone.
Recent trading has not been ideal. Consult btc0796 to exchange views and discuss the market.
Trading Suggestions:
BTC: Go long at 58000-58500, target 60500 - 61500, defense 57500
ETH: Go long at 1500-1530, target 1650 - 1750, defense 1460
The viewpoints, conclusions, and suggestions in this article are for reference only and do not constitute investment advice. The market is risky; invest with caution.
$BTC
$ETH
Based on the current BTC price trend and market data, we can clearly identify its key support and resistance zones:
I. Key Resistance Levels
1. First resistance zone: 60000-60500
This zone is the lower edge of the consolidation platform before this round of BTC’s decline, and it is also the target level for a rebound to recover the 24-hour drop. Considering the distribution characteristics of market short positions, there are many short stop-loss orders in this range. If there is a breakout with strong volume, it may further challenge the upper edge of the prior consolidation center at 61200-61500.
2. Strong resistance zone: 61500-62000
This is the area of BTC’s recent local highs, and it is also an important watershed for market sentiment between bulls and bears. If BTC can hold this range effectively, it will reverse the current bearish market structure.
II. Key Support Levels
1. First support zone: 58000-58500
This zone corresponds to the 0.382 Fibonacci retracement level of this round of the upward trend. Combined with the positioning characteristics of long capital across the entire market, there are many long dip-buying orders here. If price pulls back into this zone, a technical rebound is likely.
2. Strong support zone: 57000-57500
This is the key structural support for this round of the uptrend, and it is also a critical point for market sentiment. If this range is broken down effectively, it will confirm the end of the short-term uptrend, likely triggering a new wave of stop-loss selling and further probing into the 55000-56000 zone.
Recent trading has not been ideal. Consult btc0796 to exchange views and discuss the market.
Trading Suggestions:
BTC: Go long at 58000-58500, target 60500 - 61500, defense 57500
ETH: Go long at 1500-1530, target 1650 - 1750, defense 1460
The viewpoints, conclusions, and suggestions in this article are for reference only and do not constitute investment advice. The market is risky; invest with caution.
$BTC
$ETH
586
·
--
Bullish
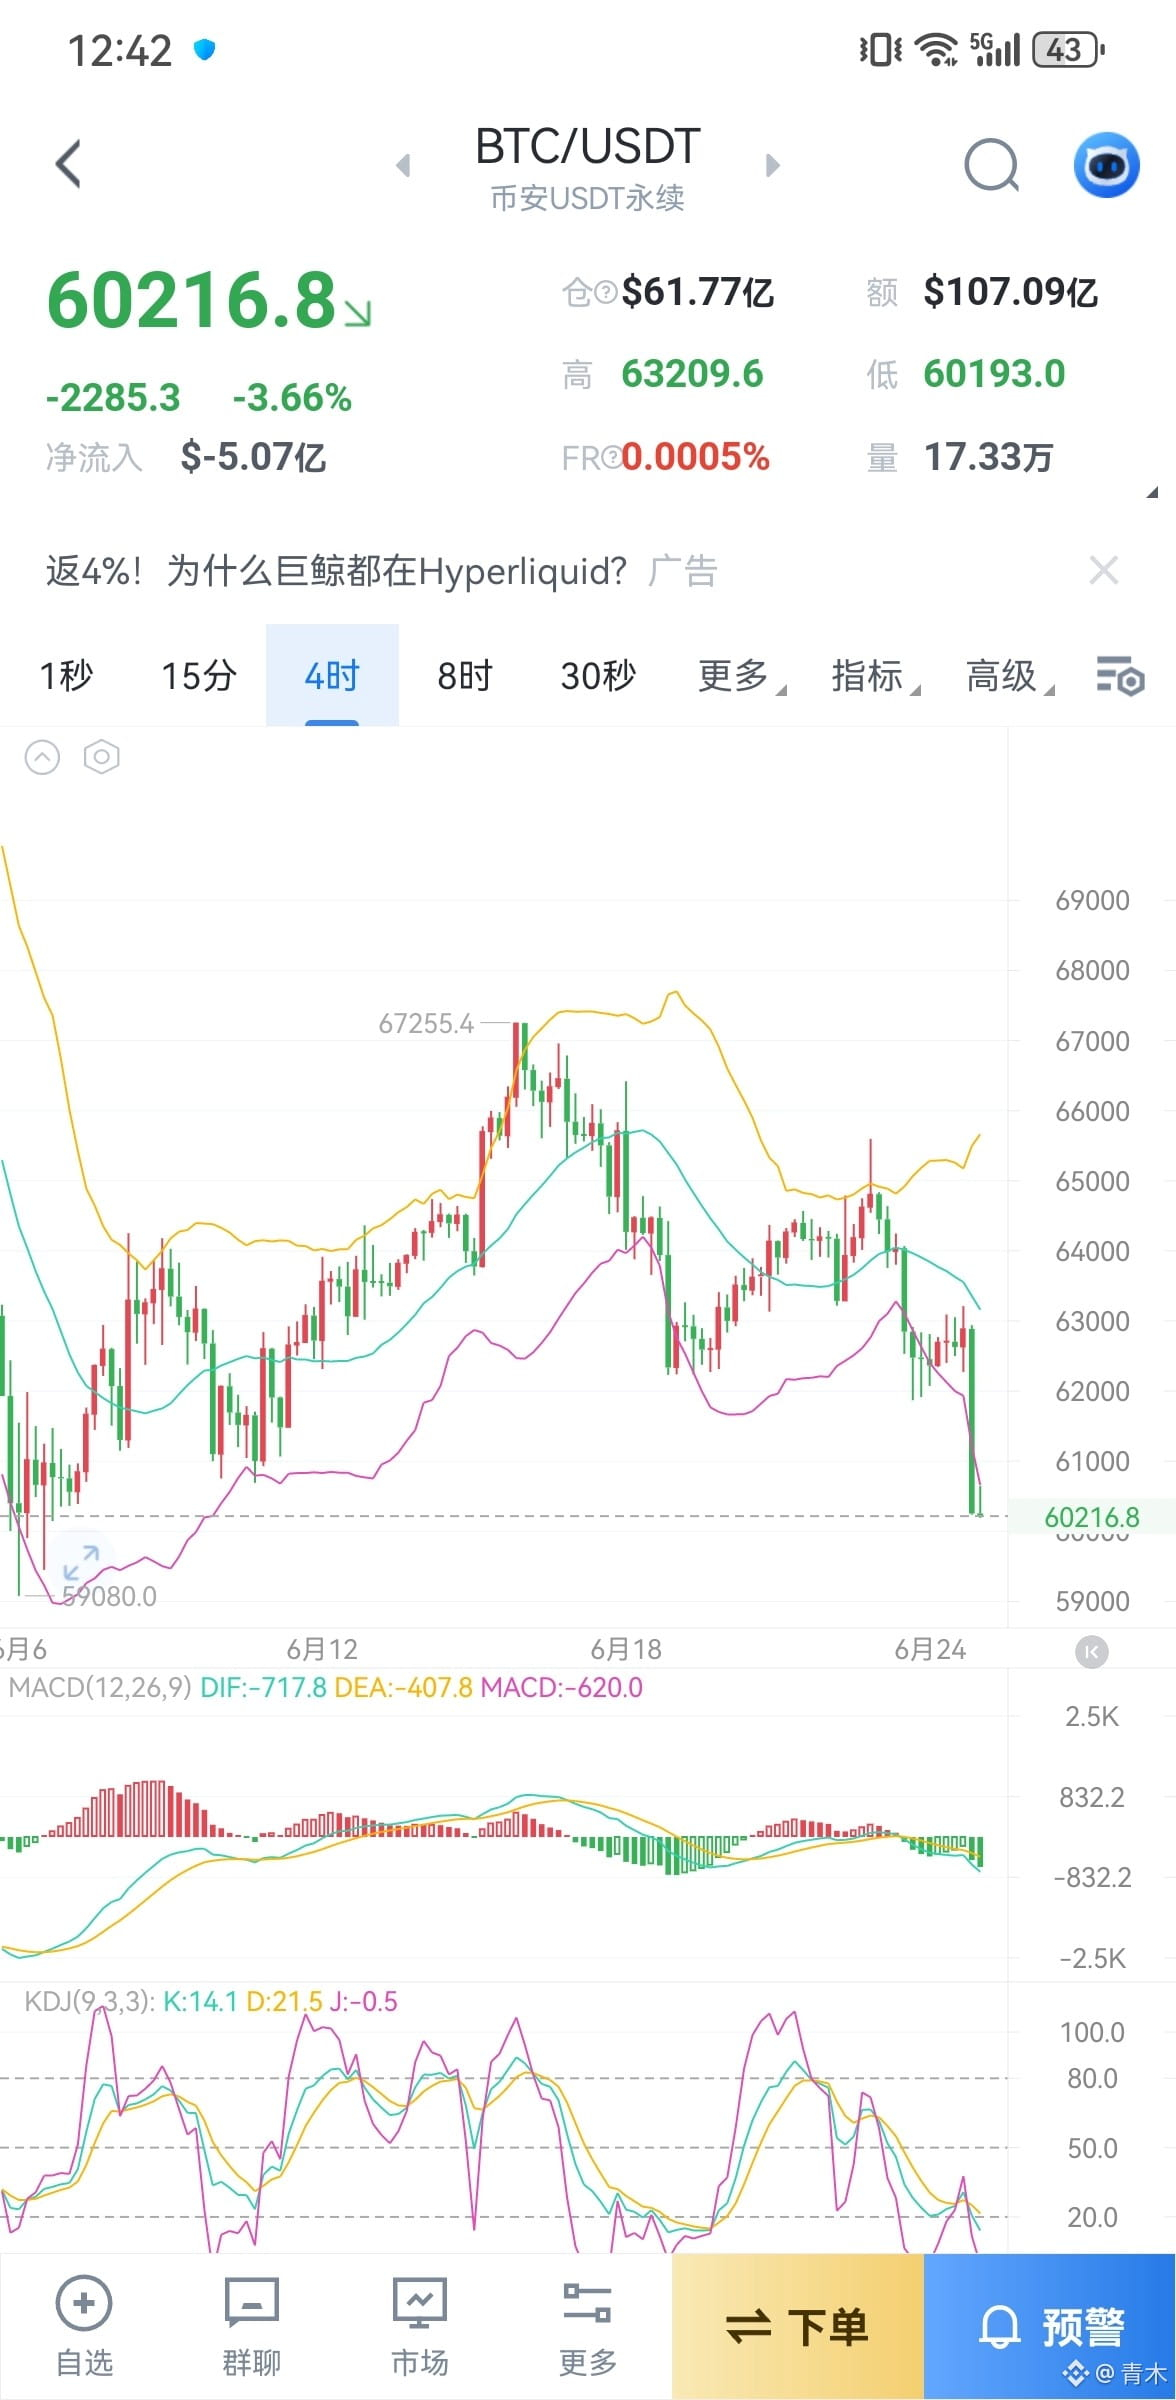
6.25 BTC volume is shrinking as it grinds the bottom, testing the waters around 59000 like crazy, ETH at 1580 on the brink of life and death, is a trend change window about to open?
BTC is currently oscillating around 60000. It dipped to a low of 59260 and is now hovering around 59800. After a deep correction, it's entering a phase of low-volume consolidation, with volatility continuing to compress as bulls and bears are locked in a standoff.
Key resistance above is at 63000 (first resistance), if it breaks and holds, we are looking at 66000, with crucial support below at 59000 (short-term defense).
ETH's movement is clearly lagging behind BTC. After a surge to 1779 two days ago, it plummeted to 1600 with increased volume, and it is currently weakly consolidating around 1585 with very little rebound strength. The Ethereum Foundation has undergone restructuring, cutting about 54 people (20%), raising concerns about the efficiency of ecosystem advancement.
Key levels: resistance above at 1680 (short-term first hurdle), 1720-1760 (strong sell-off zone); support below at 1530-1570 (today's low region), 1500 (the last line of defense for bulls). Recent trading has not been ideal; consult btc0796 for discussion on the market.
Trading suggestions:
BTC go long at 59300-59800, targeting 62000 - 64000 with a stop at 58800.
ETH go long at 1540-1580, targeting 1700 - 1800 with a stop at 1500.
The opinions, conclusions, and suggestions in this article are for reference only and do not constitute investment advice. The market is risky, and investors should exercise caution.
$BTC
{future}(BTCUSDT)
$ETH
{future}(ETHUSDT)
6.25 BTC volume is shrinking as it grinds the bottom, testing the waters around 59000 like crazy, ETH at 1580 on the brink of life and death, is a trend change window about to open?
BTC is currently oscillating around 60000. It dipped to a low of 59260 and is now hovering around 59800. After a deep correction, it's entering a phase of low-volume consolidation, with volatility continuing to compress as bulls and bears are locked in a standoff.
Key resistance above is at 63000 (first resistance), if it breaks and holds, we are looking at 66000, with crucial support below at 59000 (short-term defense).
ETH's movement is clearly lagging behind BTC. After a surge to 1779 two days ago, it plummeted to 1600 with increased volume, and it is currently weakly consolidating around 1585 with very little rebound strength. The Ethereum Foundation has undergone restructuring, cutting about 54 people (20%), raising concerns about the efficiency of ecosystem advancement.
Key levels: resistance above at 1680 (short-term first hurdle), 1720-1760 (strong sell-off zone); support below at 1530-1570 (today's low region), 1500 (the last line of defense for bulls). Recent trading has not been ideal; consult btc0796 for discussion on the market.
Trading suggestions:
BTC go long at 59300-59800, targeting 62000 - 64000 with a stop at 58800.
ETH go long at 1540-1580, targeting 1700 - 1800 with a stop at 1500.
The opinions, conclusions, and suggestions in this article are for reference only and do not constitute investment advice. The market is risky, and investors should exercise caution.
$BTC
$ETH
BTC is currently oscillating around 60000. It dipped to a low of 59260 and is now hovering around 59800. After a deep correction, it's entering a phase of low-volume consolidation, with volatility continuing to compress as bulls and bears are locked in a standoff.
Key resistance above is at 63000 (first resistance), if it breaks and holds, we are looking at 66000, with crucial support below at 59000 (short-term defense).
ETH's movement is clearly lagging behind BTC. After a surge to 1779 two days ago, it plummeted to 1600 with increased volume, and it is currently weakly consolidating around 1585 with very little rebound strength. The Ethereum Foundation has undergone restructuring, cutting about 54 people (20%), raising concerns about the efficiency of ecosystem advancement.
Key levels: resistance above at 1680 (short-term first hurdle), 1720-1760 (strong sell-off zone); support below at 1530-1570 (today's low region), 1500 (the last line of defense for bulls). Recent trading has not been ideal; consult btc0796 for discussion on the market.
Trading suggestions:
BTC go long at 59300-59800, targeting 62000 - 64000 with a stop at 58800.
ETH go long at 1540-1580, targeting 1700 - 1800 with a stop at 1500.
The opinions, conclusions, and suggestions in this article are for reference only and do not constitute investment advice. The market is risky, and investors should exercise caution.
$BTC
$ETH
2
2.3k
·
--
Bullish
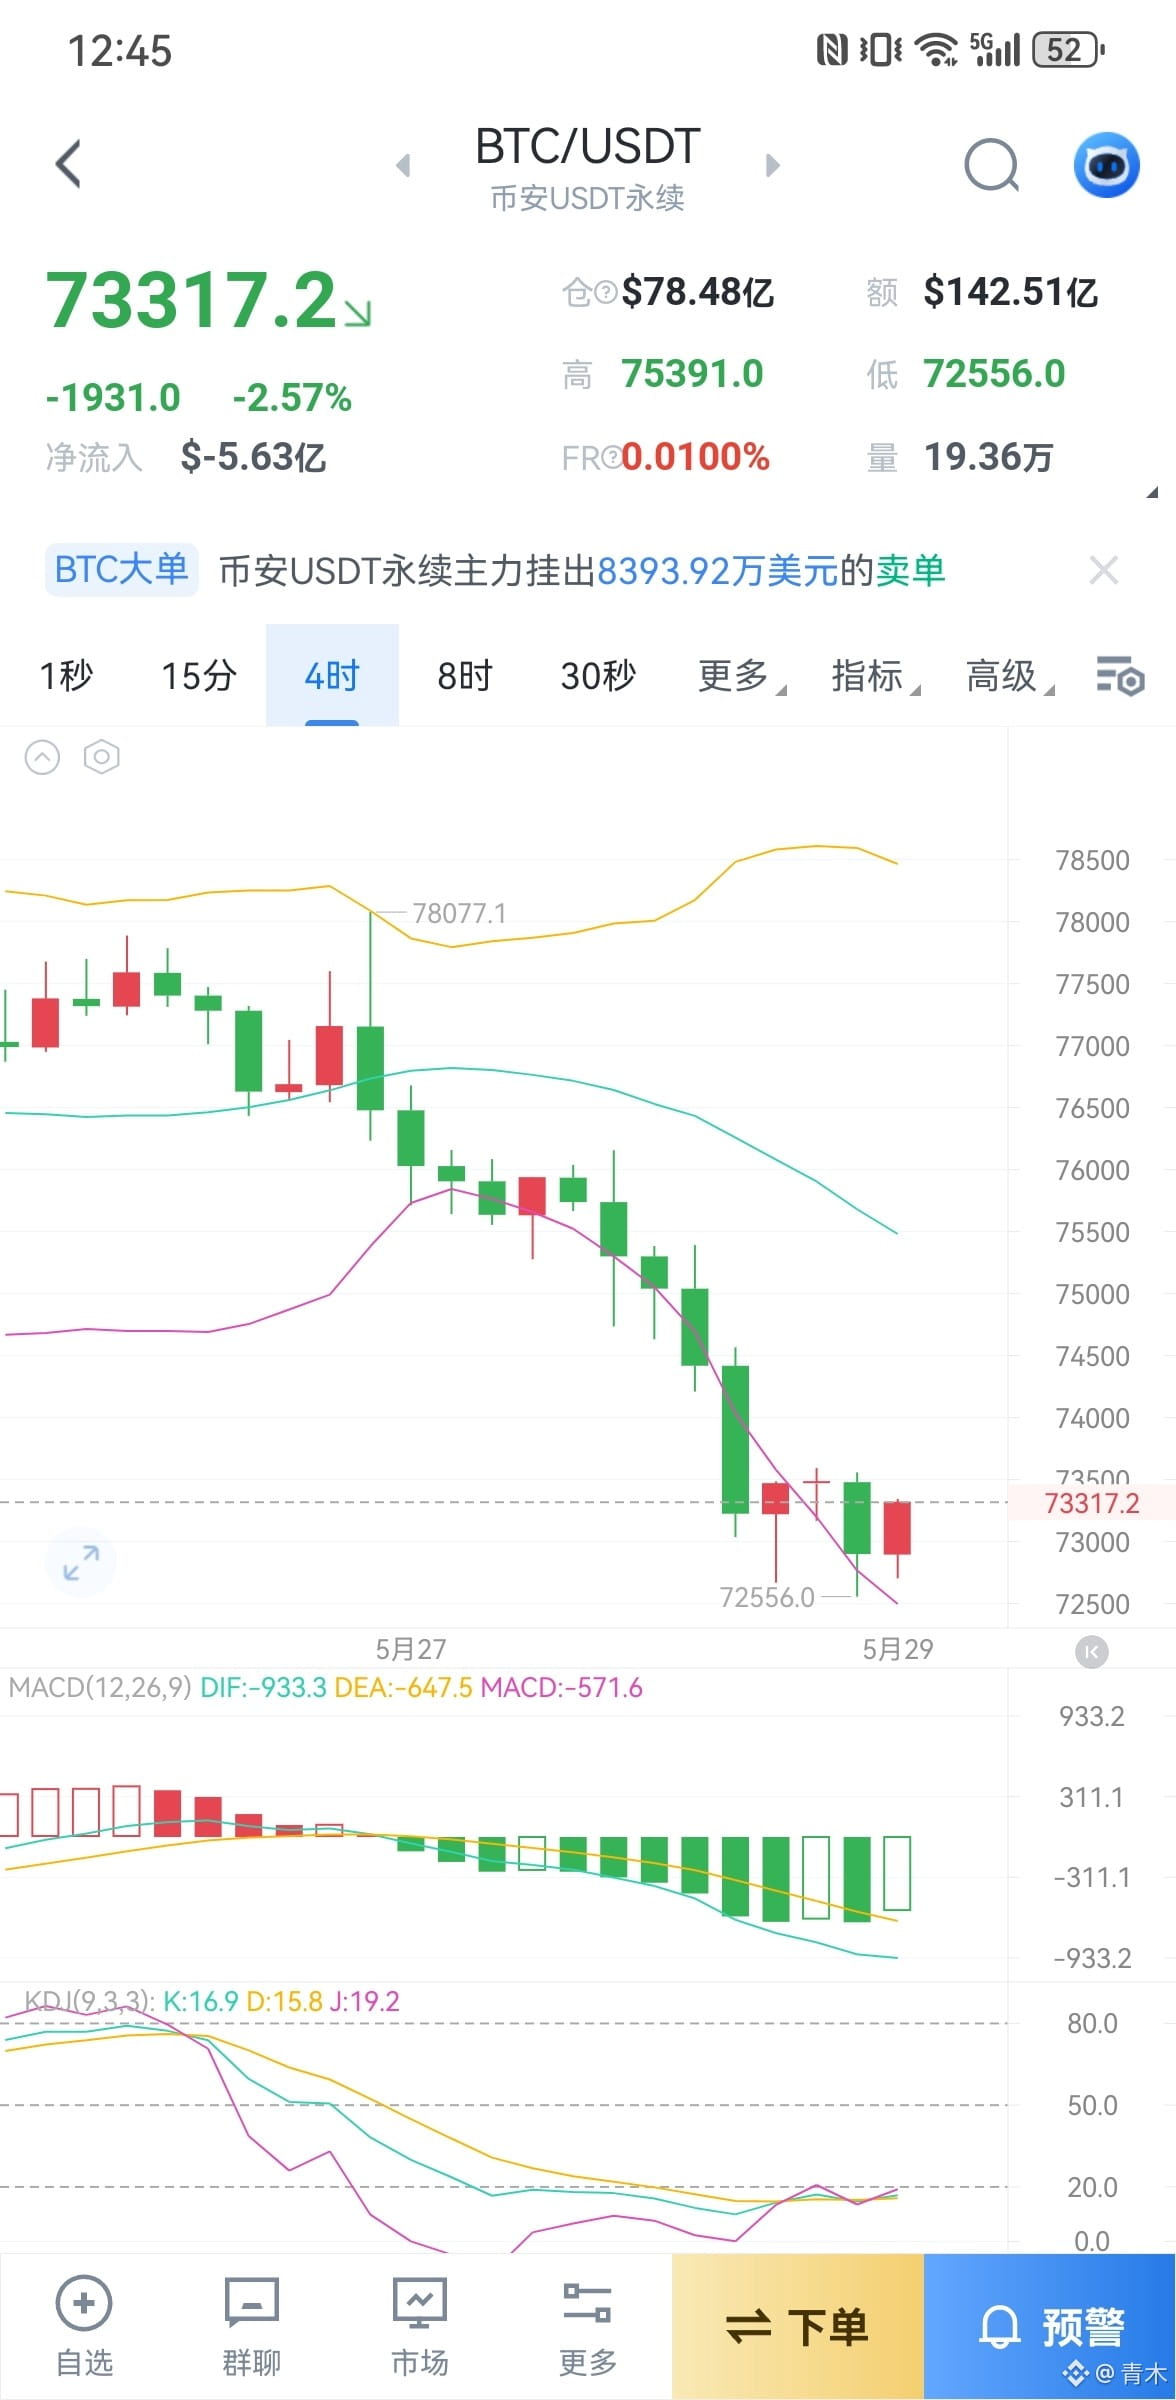
May 29th Market Analysis: BTC $74,000 Bull vs Bear Showdown! Is the rebound for real? Can Ethereum's structure repair continue?
BTC: The $74,000 support line has been breached. It plummeted from $74,239 to $73,464 in the early hours, and later hit a low of $72,709 due to market news, currently oscillating weakly below $74,000. The key question: Where is the real support below?
ETH: Also breaking down, falling below the psychological $2,000 mark. In the early hours, it dropped from $2,014 to $1,971, currently testing around $2,000 repeatedly, with $1,950 support to watch below.
Next, we're starting a new setup. Looking at the monthly chart, Bitcoin has already touched the MA5 moving average, and the daily MA120 is also around this area. This price could spike down further. However, any spikes down are expected to be retracted, so maintain a low long strategy; if it spikes down, just go long, only going long.
BTC's lower limit around $71,500 is already this week's extreme; definitely don't flip to short at this level again.
Current price is near $73,000. You can go long directly, don't be afraid, let's hold together.
Trading Suggestions:
BTC $72,800-$73,300 go long, target $74,800 - $76,000, stop at $72,300.
ETH $1,960-$2,000 go long, target $2,150 - $2,250, stop at $1,920.
The views, conclusions, and suggestions in this article are for reference only and do not constitute investment advice. The market carries risks; invest cautiously.
$BTC
{future}(BTCUSDT)
$ETH
{future}(ETHUSDT)
May 29th Market Analysis: BTC $74,000 Bull vs Bear Showdown! Is the rebound for real? Can Ethereum's structure repair continue?
BTC: The $74,000 support line has been breached. It plummeted from $74,239 to $73,464 in the early hours, and later hit a low of $72,709 due to market news, currently oscillating weakly below $74,000. The key question: Where is the real support below?
ETH: Also breaking down, falling below the psychological $2,000 mark. In the early hours, it dropped from $2,014 to $1,971, currently testing around $2,000 repeatedly, with $1,950 support to watch below.
Next, we're starting a new setup. Looking at the monthly chart, Bitcoin has already touched the MA5 moving average, and the daily MA120 is also around this area. This price could spike down further. However, any spikes down are expected to be retracted, so maintain a low long strategy; if it spikes down, just go long, only going long.
BTC's lower limit around $71,500 is already this week's extreme; definitely don't flip to short at this level again.
Current price is near $73,000. You can go long directly, don't be afraid, let's hold together.
Trading Suggestions:
BTC $72,800-$73,300 go long, target $74,800 - $76,000, stop at $72,300.
ETH $1,960-$2,000 go long, target $2,150 - $2,250, stop at $1,920.
The views, conclusions, and suggestions in this article are for reference only and do not constitute investment advice. The market carries risks; invest cautiously.
$BTC
$ETH
BTC: The $74,000 support line has been breached. It plummeted from $74,239 to $73,464 in the early hours, and later hit a low of $72,709 due to market news, currently oscillating weakly below $74,000. The key question: Where is the real support below?
ETH: Also breaking down, falling below the psychological $2,000 mark. In the early hours, it dropped from $2,014 to $1,971, currently testing around $2,000 repeatedly, with $1,950 support to watch below.
Next, we're starting a new setup. Looking at the monthly chart, Bitcoin has already touched the MA5 moving average, and the daily MA120 is also around this area. This price could spike down further. However, any spikes down are expected to be retracted, so maintain a low long strategy; if it spikes down, just go long, only going long.
BTC's lower limit around $71,500 is already this week's extreme; definitely don't flip to short at this level again.
Current price is near $73,000. You can go long directly, don't be afraid, let's hold together.
Trading Suggestions:
BTC $72,800-$73,300 go long, target $74,800 - $76,000, stop at $72,300.
ETH $1,960-$2,000 go long, target $2,150 - $2,250, stop at $1,920.
The views, conclusions, and suggestions in this article are for reference only and do not constitute investment advice. The market carries risks; invest cautiously.
$BTC
$ETH
1
1.8k
·
--
Bullish
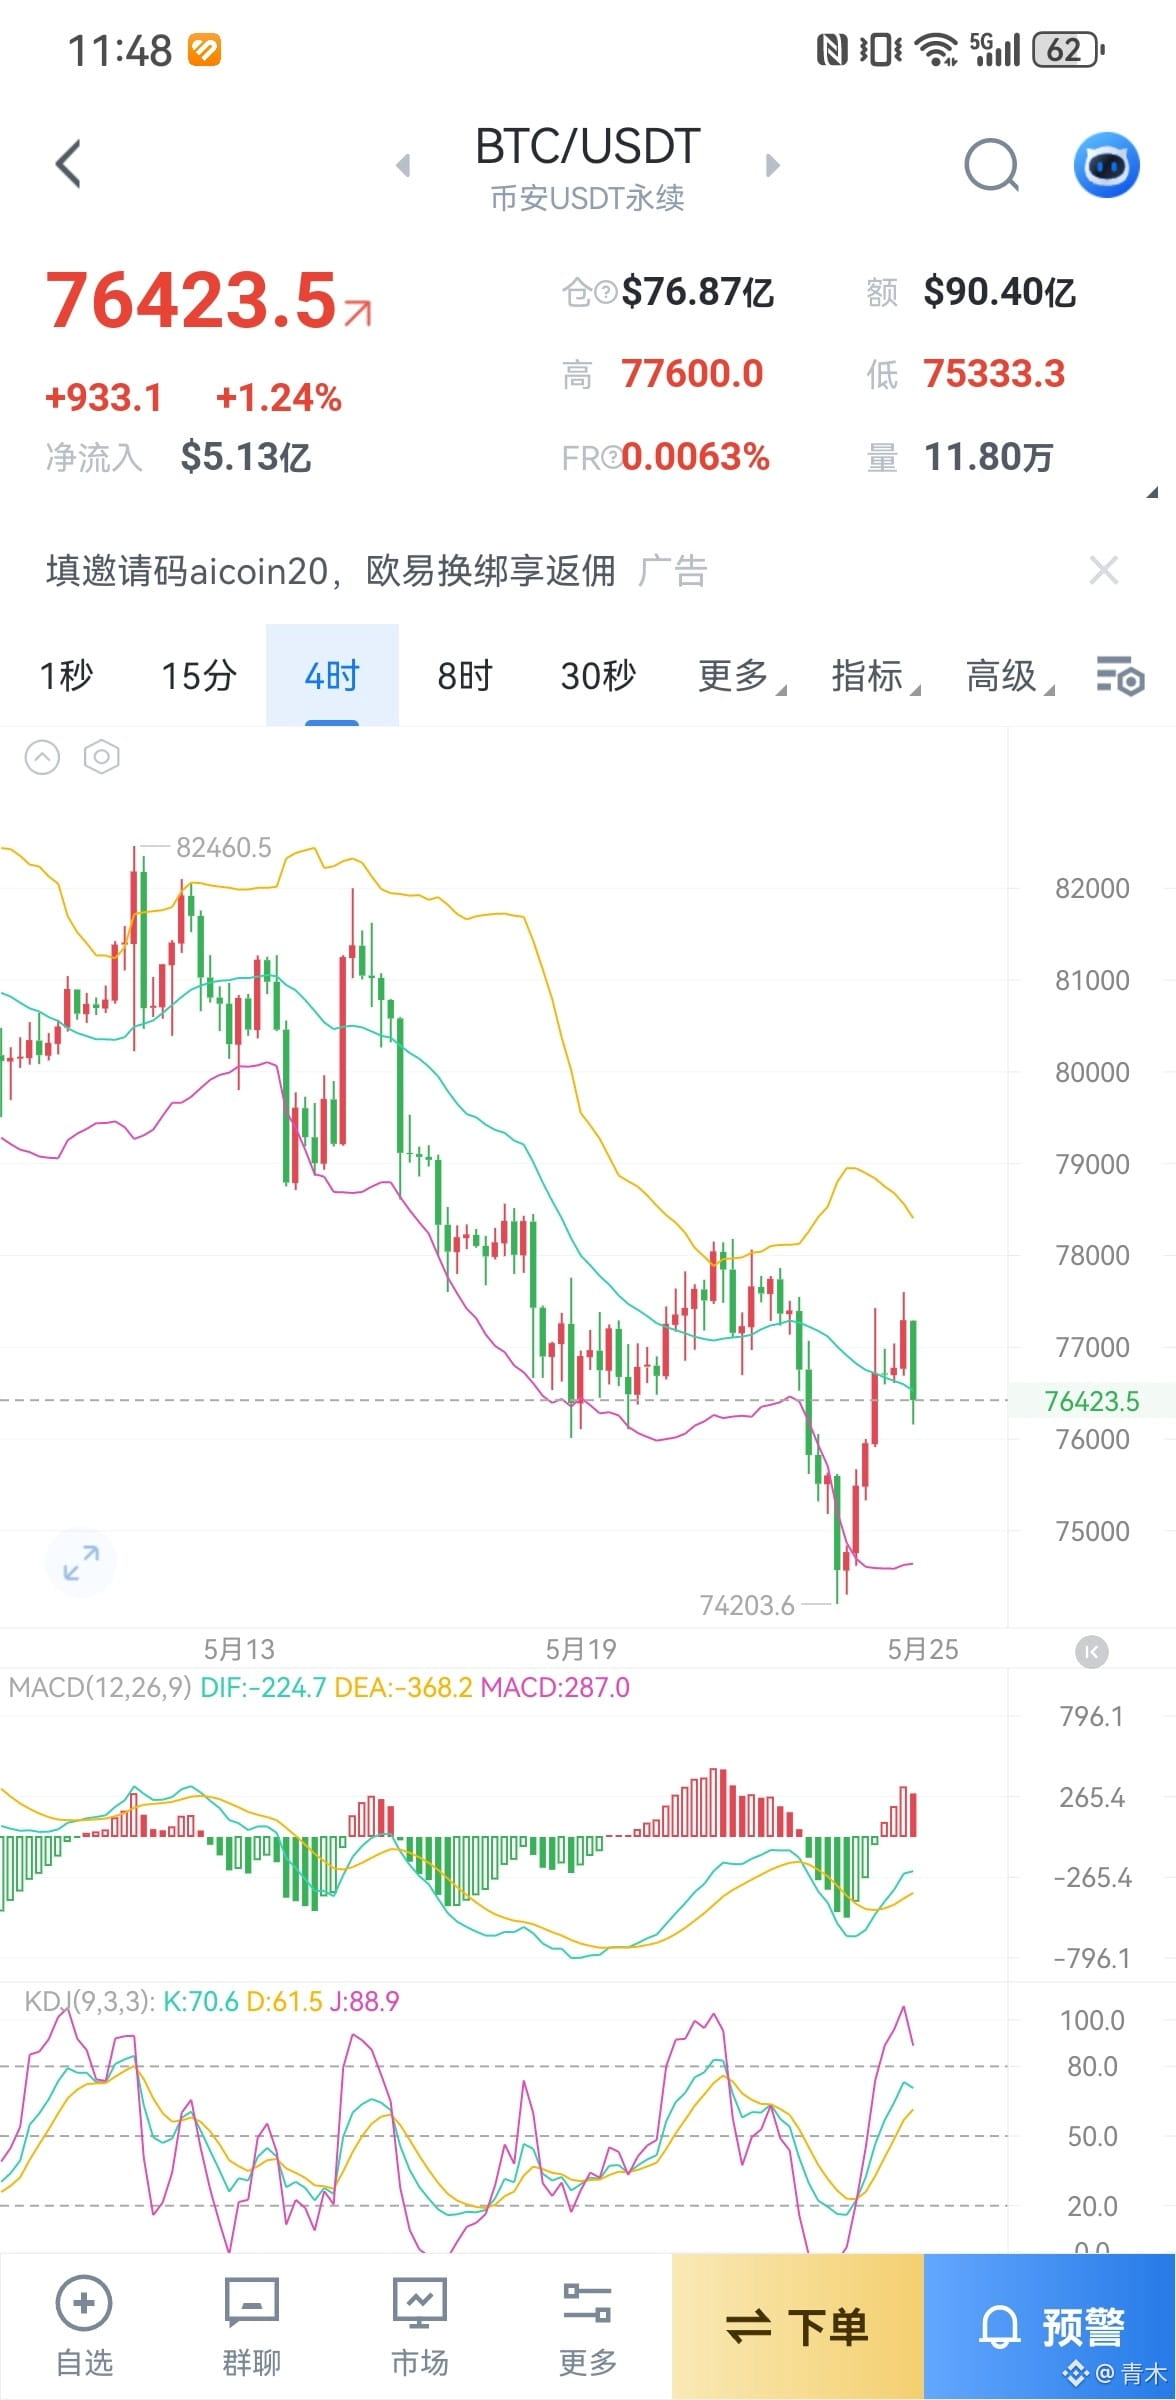
May 25th Market Analysis: BTC Deep V Recovers All Losses, Is the Real Bottom Signal Here?
The crypto market has been dominated by bears, with continuous declines for over 12 days. This drop is different from the past, with no rebounds in between—just a series of dips and consolidation, cycling through this pattern for over half a month. Multiple bullish cycles have all ended in consolidation. The daily chart shows signs of bottoming out; as of May 17, we entered the bottoming cycle, and the decline post-bottom has intensified. Until yesterday, both BTC and ETH broke through their critical support levels (BTC at 75000, crashing nearly 1000 points, and ETH at 2050, breaking 43 points). The technical analysis was completely wrecked, but last night brought some good news; the classic narrative of US-Iran negotiations might lead to an agreement.
Coupled with the existing bullish resonance logic, this news became the catalyst for a rebound. All the daytime losses were recovered. The pressure points were all broken through, leading to a massive liquidation of long positions: the daily liquidation scale was approximately $229-250 million, second only to BTC. By another metric, this week's total liquidation reached as high as $439 million. The market is showing clear signs of liquidity hunting, with prices likely to sweep through concentrated long areas before breaking downwards past 2179. Major CEXs could see short liquidations totaling up to $1.056 billion, potentially triggering a short squeeze. The medium to long-term downtrend remains unchanged. Recent trades haven't been ideal; consult btc0796 for market discussions.
Trading Recommendations:
BTC 75700-76200 go long, target 77200 - 78200, stop-loss at 75200.
ETH 2040-2080 go long, target 2160 - 2240, stop-loss at 2000.
The views, conclusions, and recommendations in this article are for reference only and do not constitute investment advice. The market carries risks; invest with caution.
$BTC
{future}(BTCUSDT)
$ETH
{future}(ETHUSDT)
May 25th Market Analysis: BTC Deep V Recovers All Losses, Is the Real Bottom Signal Here?
The crypto market has been dominated by bears, with continuous declines for over 12 days. This drop is different from the past, with no rebounds in between—just a series of dips and consolidation, cycling through this pattern for over half a month. Multiple bullish cycles have all ended in consolidation. The daily chart shows signs of bottoming out; as of May 17, we entered the bottoming cycle, and the decline post-bottom has intensified. Until yesterday, both BTC and ETH broke through their critical support levels (BTC at 75000, crashing nearly 1000 points, and ETH at 2050, breaking 43 points). The technical analysis was completely wrecked, but last night brought some good news; the classic narrative of US-Iran negotiations might lead to an agreement.
Coupled with the existing bullish resonance logic, this news became the catalyst for a rebound. All the daytime losses were recovered. The pressure points were all broken through, leading to a massive liquidation of long positions: the daily liquidation scale was approximately $229-250 million, second only to BTC. By another metric, this week's total liquidation reached as high as $439 million. The market is showing clear signs of liquidity hunting, with prices likely to sweep through concentrated long areas before breaking downwards past 2179. Major CEXs could see short liquidations totaling up to $1.056 billion, potentially triggering a short squeeze. The medium to long-term downtrend remains unchanged. Recent trades haven't been ideal; consult btc0796 for market discussions.
Trading Recommendations:
BTC 75700-76200 go long, target 77200 - 78200, stop-loss at 75200.
ETH 2040-2080 go long, target 2160 - 2240, stop-loss at 2000.
The views, conclusions, and recommendations in this article are for reference only and do not constitute investment advice. The market carries risks; invest with caution.
$BTC
$ETH
The crypto market has been dominated by bears, with continuous declines for over 12 days. This drop is different from the past, with no rebounds in between—just a series of dips and consolidation, cycling through this pattern for over half a month. Multiple bullish cycles have all ended in consolidation. The daily chart shows signs of bottoming out; as of May 17, we entered the bottoming cycle, and the decline post-bottom has intensified. Until yesterday, both BTC and ETH broke through their critical support levels (BTC at 75000, crashing nearly 1000 points, and ETH at 2050, breaking 43 points). The technical analysis was completely wrecked, but last night brought some good news; the classic narrative of US-Iran negotiations might lead to an agreement.
Coupled with the existing bullish resonance logic, this news became the catalyst for a rebound. All the daytime losses were recovered. The pressure points were all broken through, leading to a massive liquidation of long positions: the daily liquidation scale was approximately $229-250 million, second only to BTC. By another metric, this week's total liquidation reached as high as $439 million. The market is showing clear signs of liquidity hunting, with prices likely to sweep through concentrated long areas before breaking downwards past 2179. Major CEXs could see short liquidations totaling up to $1.056 billion, potentially triggering a short squeeze. The medium to long-term downtrend remains unchanged. Recent trades haven't been ideal; consult btc0796 for market discussions.
Trading Recommendations:
BTC 75700-76200 go long, target 77200 - 78200, stop-loss at 75200.
ETH 2040-2080 go long, target 2160 - 2240, stop-loss at 2000.
The views, conclusions, and recommendations in this article are for reference only and do not constitute investment advice. The market carries risks; invest with caution.
$BTC
$ETH
1
632
·
--
Bullish
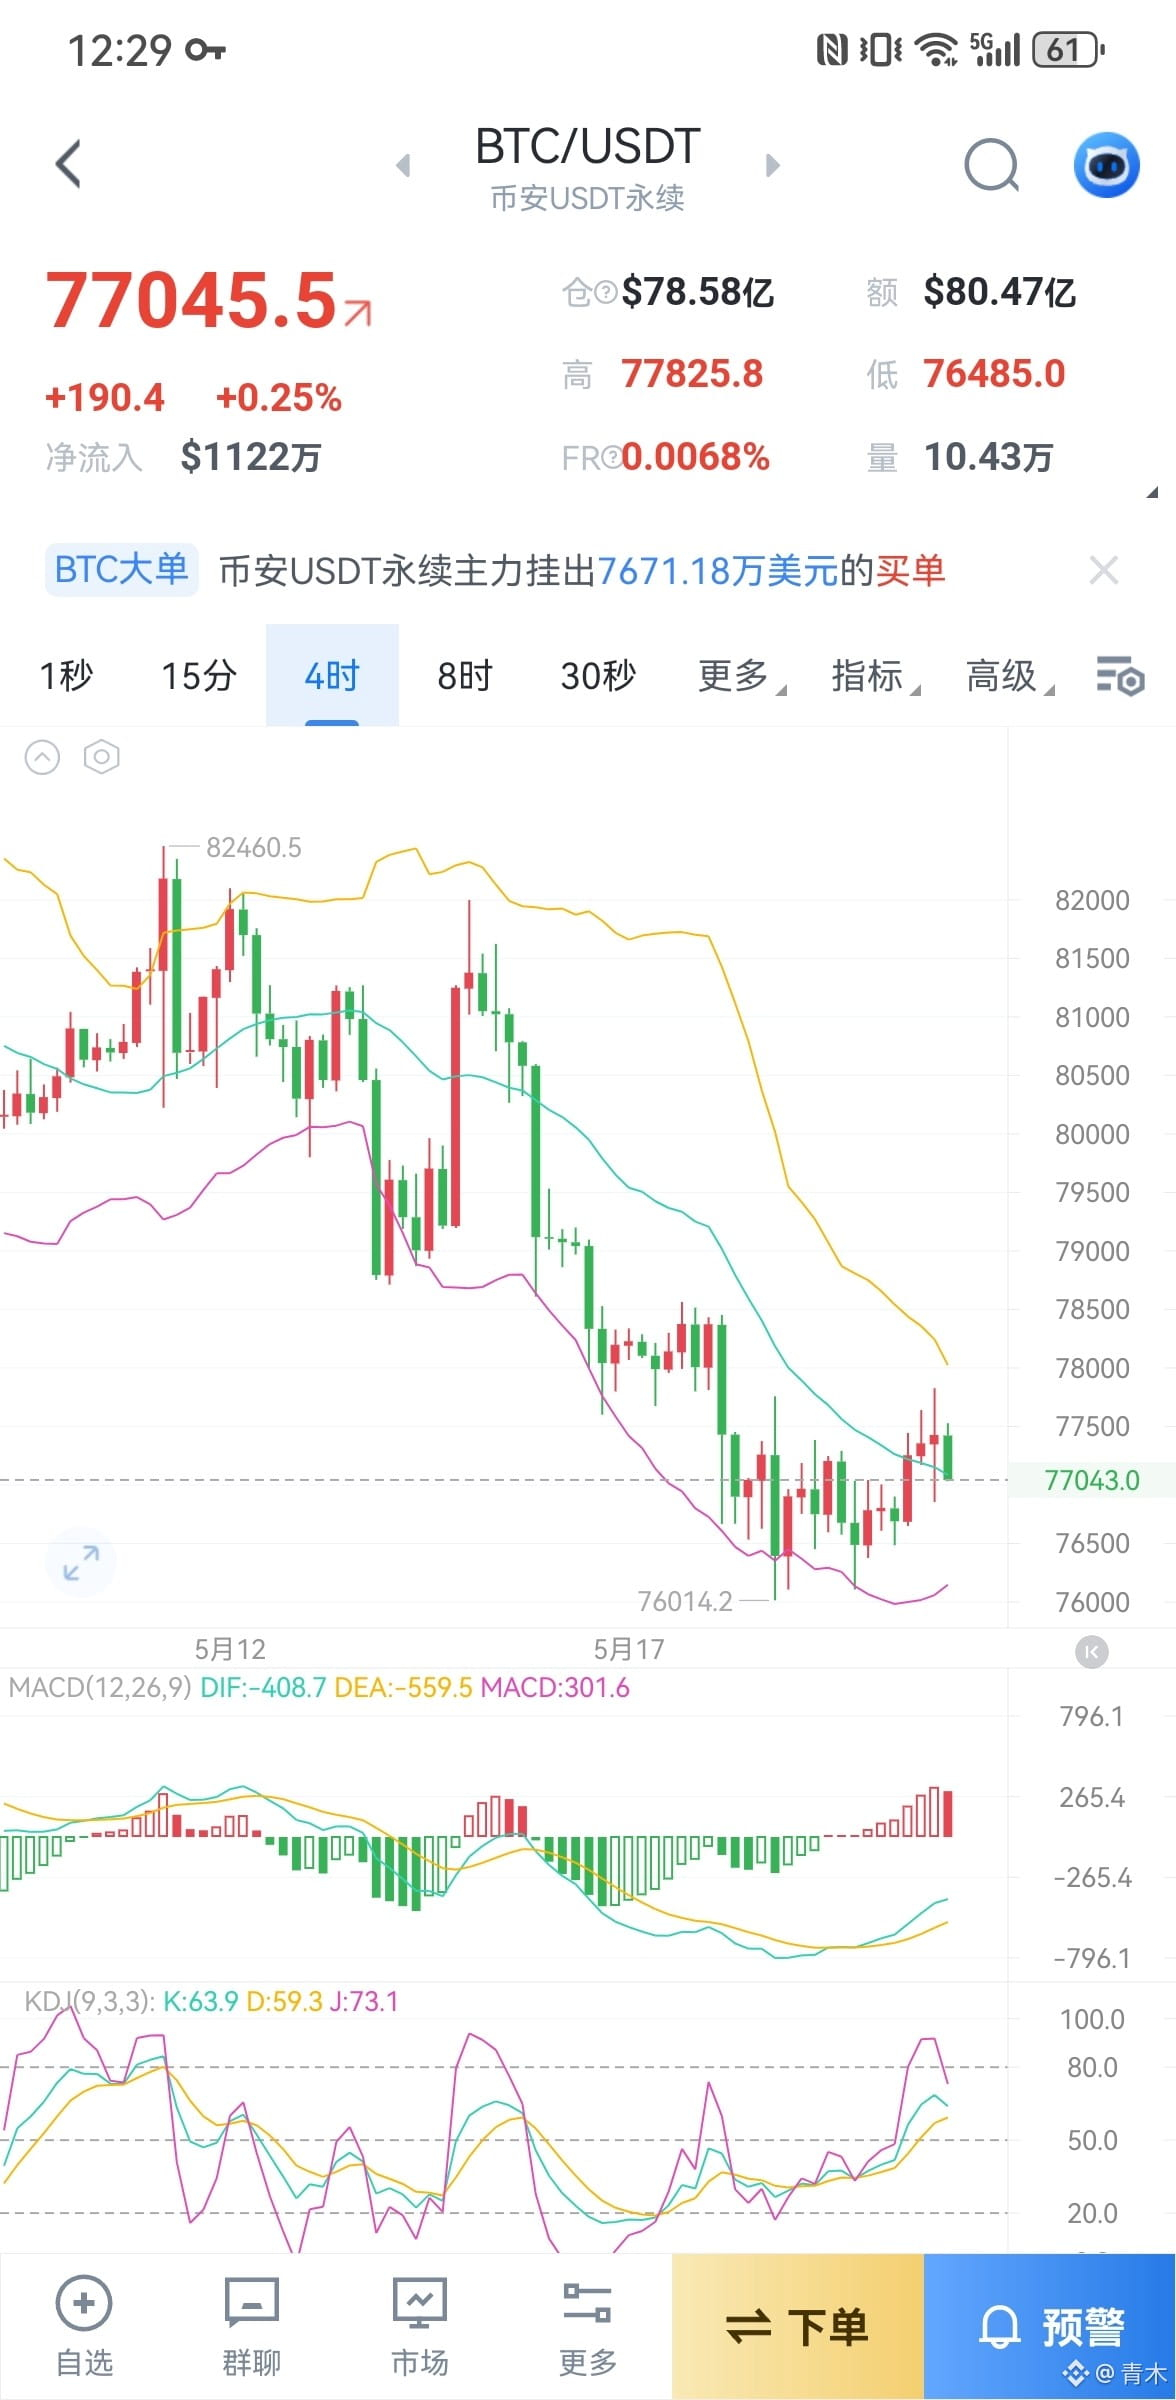
May 20th Trend Analysis: Daily Chart Continues to Decline, When Will It Reverse?
Bitcoin started to turn bearish around 77800 after a bounce, with the daily chart consistently moving downward. This morning's 8:00 weekly close also showed a full bearish candle. If we’re talking about a major reversal from this position, the downside potential for Bitcoin won’t be too significant. Looking at the weekly chart, the 75000 level is crucial. If we don’t see a solid bounce around 75000, this minor retracement phase will likely come to an end. 75000 is Bitcoin's lifeline; if it breaks decisively this week, we could see a cliff dive.
Today's outlook: Bitcoin is expected to have a base-building bounce around 76000. If 76000 is breached again, we could see levels down near 74500. Currently, with prices around 77000, it might be worth entering a long position, with stops set at the 76000 mark. As for Ethereum, the 2050 level is also a key support; if it holds, it could be a good spot to take a shot at a mid-term bounce, with stops at 2050!
Trading Suggestions:
BTC Long at 76500-77000, aiming for 77500 - 78500, stop at 76000.
ETH Long at 2090-2130, aiming for 2210 - 2290, stop at 2050.
The views, conclusions, and suggestions in this article are for reference only and do not constitute investment advice. The market carries risks; invest cautiously.
$BTC
{future}(BTCUSDT)
$ETH
{future}(ETHUSDT)
May 20th Trend Analysis: Daily Chart Continues to Decline, When Will It Reverse?
Bitcoin started to turn bearish around 77800 after a bounce, with the daily chart consistently moving downward. This morning's 8:00 weekly close also showed a full bearish candle. If we’re talking about a major reversal from this position, the downside potential for Bitcoin won’t be too significant. Looking at the weekly chart, the 75000 level is crucial. If we don’t see a solid bounce around 75000, this minor retracement phase will likely come to an end. 75000 is Bitcoin's lifeline; if it breaks decisively this week, we could see a cliff dive.
Today's outlook: Bitcoin is expected to have a base-building bounce around 76000. If 76000 is breached again, we could see levels down near 74500. Currently, with prices around 77000, it might be worth entering a long position, with stops set at the 76000 mark. As for Ethereum, the 2050 level is also a key support; if it holds, it could be a good spot to take a shot at a mid-term bounce, with stops at 2050!
Trading Suggestions:
BTC Long at 76500-77000, aiming for 77500 - 78500, stop at 76000.
ETH Long at 2090-2130, aiming for 2210 - 2290, stop at 2050.
The views, conclusions, and suggestions in this article are for reference only and do not constitute investment advice. The market carries risks; invest cautiously.
$BTC
$ETH
Bitcoin started to turn bearish around 77800 after a bounce, with the daily chart consistently moving downward. This morning's 8:00 weekly close also showed a full bearish candle. If we’re talking about a major reversal from this position, the downside potential for Bitcoin won’t be too significant. Looking at the weekly chart, the 75000 level is crucial. If we don’t see a solid bounce around 75000, this minor retracement phase will likely come to an end. 75000 is Bitcoin's lifeline; if it breaks decisively this week, we could see a cliff dive.
Today's outlook: Bitcoin is expected to have a base-building bounce around 76000. If 76000 is breached again, we could see levels down near 74500. Currently, with prices around 77000, it might be worth entering a long position, with stops set at the 76000 mark. As for Ethereum, the 2050 level is also a key support; if it holds, it could be a good spot to take a shot at a mid-term bounce, with stops at 2050!
Trading Suggestions:
BTC Long at 76500-77000, aiming for 77500 - 78500, stop at 76000.
ETH Long at 2090-2130, aiming for 2210 - 2290, stop at 2050.
The views, conclusions, and suggestions in this article are for reference only and do not constitute investment advice. The market carries risks; invest cautiously.
$BTC
$ETH
1.1k
·
--
Bearish
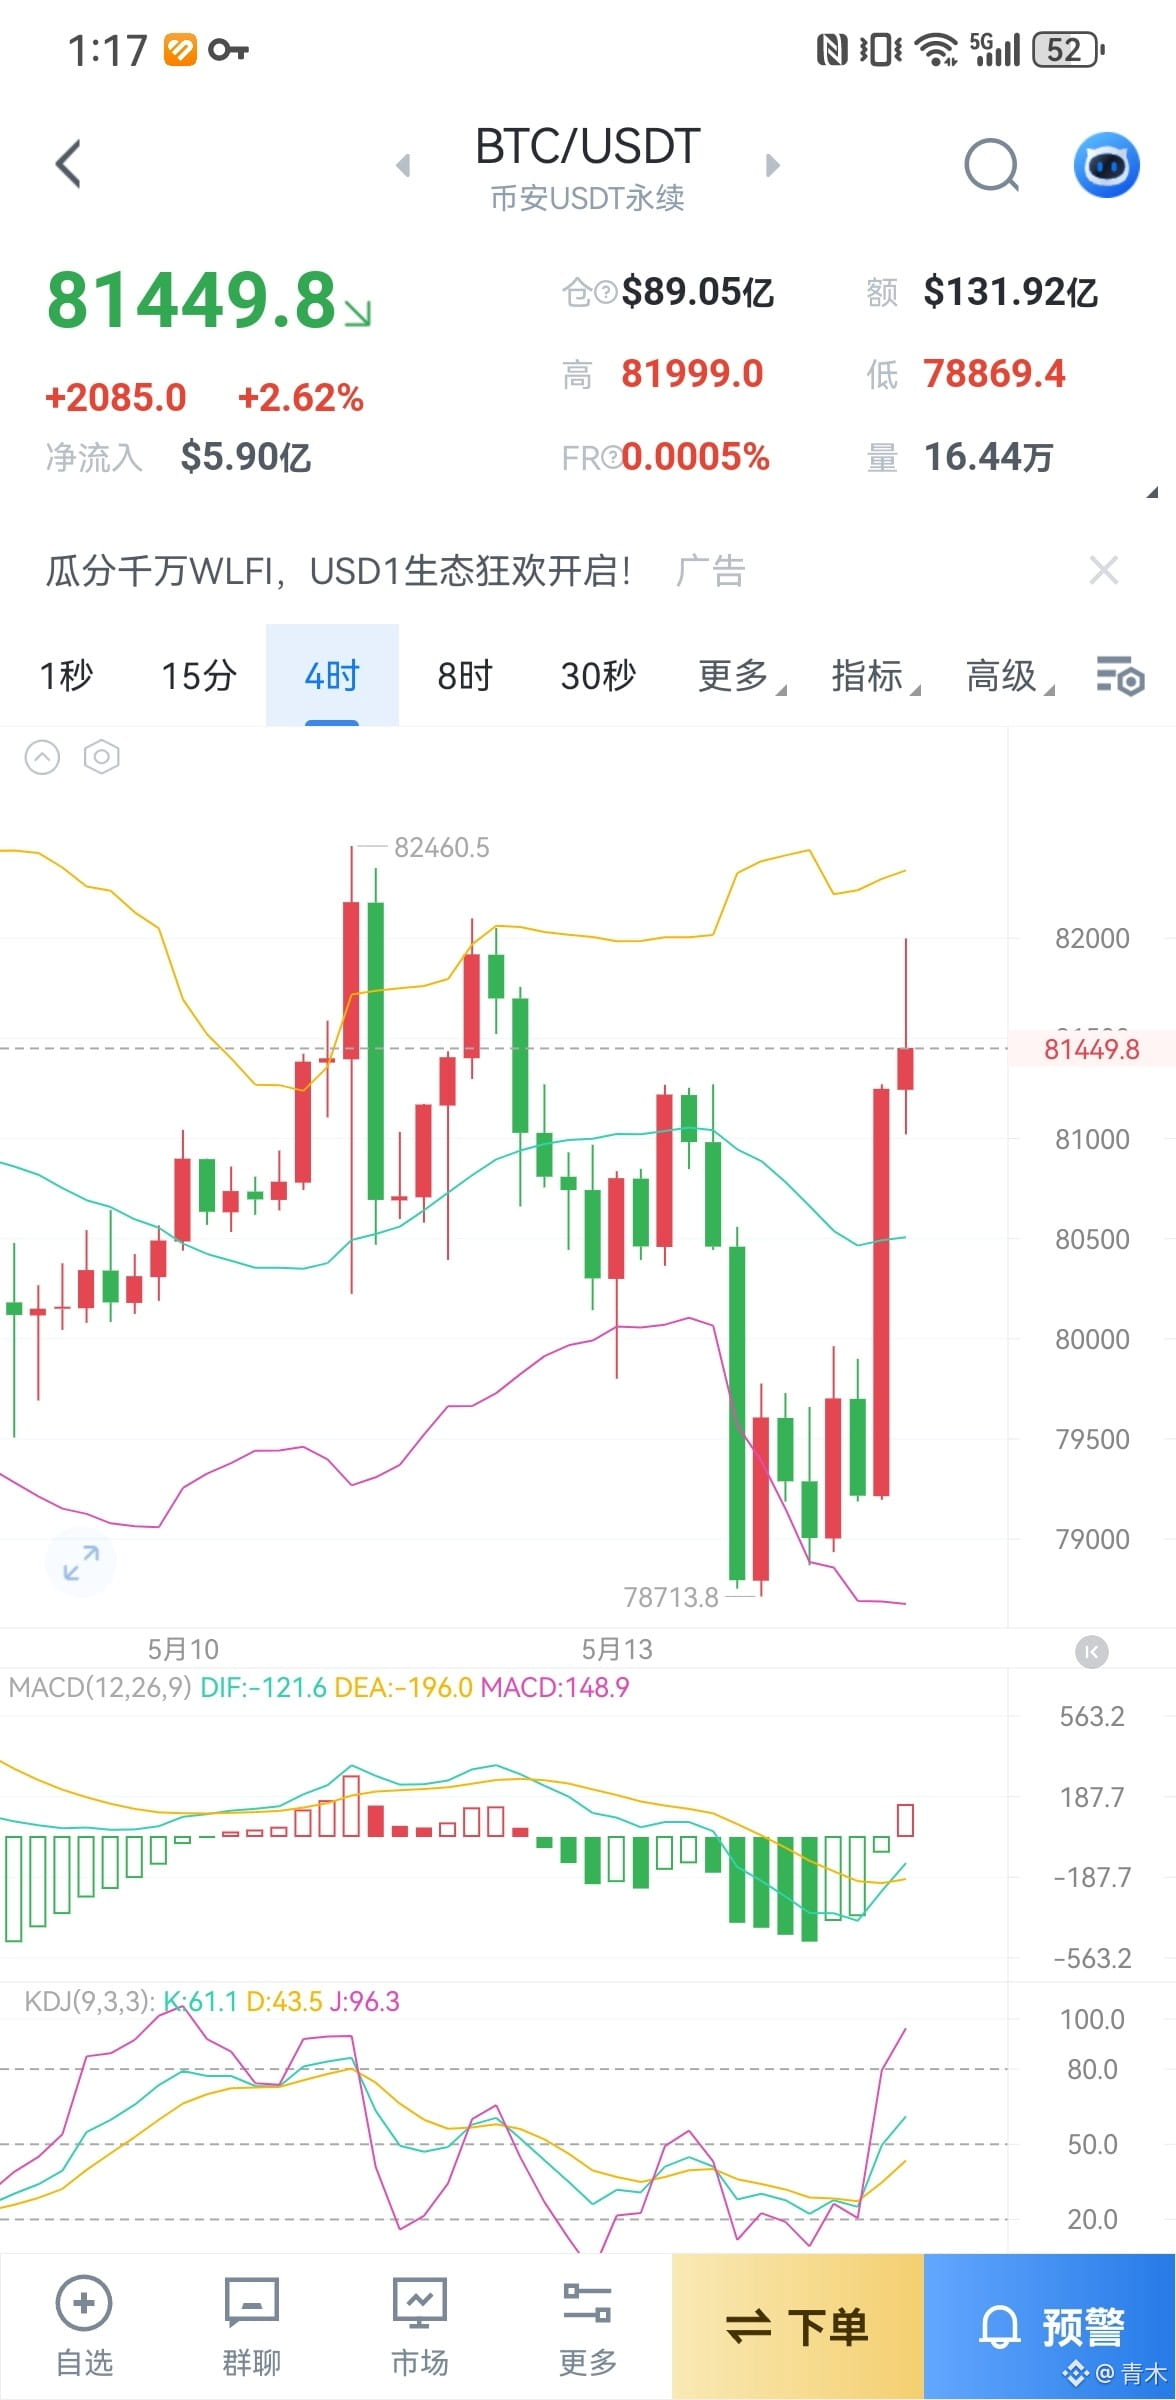
May 15 Price Analysis: A Shift is Coming, BTC Double Top Faces Pressure Again, Has ETH Confirmed the Downtrend After a Long Consolidation?
On the daily chart for BTC, the short-term price structure is clearer. Bitcoin attempted to break above 83,000 for the first time on May 6 but failed and retraced. On May 11, a second attempt also couldn't effectively surpass the previous high. After two failed tops, a clear double top pattern is forming on the naked candlestick chart, leading to a weakening trend as it begins to test previous low support levels.
On the upside, 82,000 USD is the first psychological barrier, which has previously served as a boundary for price testing multiple times. If the price cannot break through here, the short-term downtrend will be hard to reverse. On the downside, 79,200 USD is the recent short-term support level, while 78,800 USD is the previous swing low support where the price had previously bounced. The critical range further below is between 76,000 and 77,000 USD.
For ETH on the daily chart and lower timeframes, ETH's performance is clearly weaker than Bitcoin. The current price is oscillating between 2,285 and 2,300 USD, showing typical characteristics of a low-volume consolidation. On the 4-hour chart, the price is caught in a narrow range between EMA50 (around 2,275) and EMA20 (around 2,318), with neither an upward breakout nor a downward breach.
On the downside, 2,250 USD is the most urgent defensive line, where EMA50 is located, and it is also near the daily low from May 12, which has seen multiple tests without breaking. If this area is lost, the next support is at 2,020 USD. On the upside, 2,310 to 2,320 USD is the near-term resistance zone, with 2,318 as the 24-hour high and around 2,320 being the intersection of the 4-hour MA30 and MA120. Stronger resistance is found between 2,336 and 2,367 USD, an area where previous support has turned into resistance, tested multiple times without effective breakouts. Recent trading has been suboptimal; consult btc0796 for market discussions.
Trading Recommendations:
BTC Short at 81,500-82,000 with a target of 78,000 - 76,000, stop-loss at 82,500.
ETH Short at 2,310-2,350 with a target of 2,200 - 2,000, stop-loss at 2,390.
The views, conclusions, and suggestions in this article are for reference only and do not constitute investment advice. The market carries risks, and investment should be done with caution. $BTC $ETH
May 15 Price Analysis: A Shift is Coming, BTC Double Top Faces Pressure Again, Has ETH Confirmed the Downtrend After a Long Consolidation?
On the daily chart for BTC, the short-term price structure is clearer. Bitcoin attempted to break above 83,000 for the first time on May 6 but failed and retraced. On May 11, a second attempt also couldn't effectively surpass the previous high. After two failed tops, a clear double top pattern is forming on the naked candlestick chart, leading to a weakening trend as it begins to test previous low support levels.
On the upside, 82,000 USD is the first psychological barrier, which has previously served as a boundary for price testing multiple times. If the price cannot break through here, the short-term downtrend will be hard to reverse. On the downside, 79,200 USD is the recent short-term support level, while 78,800 USD is the previous swing low support where the price had previously bounced. The critical range further below is between 76,000 and 77,000 USD.
For ETH on the daily chart and lower timeframes, ETH's performance is clearly weaker than Bitcoin. The current price is oscillating between 2,285 and 2,300 USD, showing typical characteristics of a low-volume consolidation. On the 4-hour chart, the price is caught in a narrow range between EMA50 (around 2,275) and EMA20 (around 2,318), with neither an upward breakout nor a downward breach.
On the downside, 2,250 USD is the most urgent defensive line, where EMA50 is located, and it is also near the daily low from May 12, which has seen multiple tests without breaking. If this area is lost, the next support is at 2,020 USD. On the upside, 2,310 to 2,320 USD is the near-term resistance zone, with 2,318 as the 24-hour high and around 2,320 being the intersection of the 4-hour MA30 and MA120. Stronger resistance is found between 2,336 and 2,367 USD, an area where previous support has turned into resistance, tested multiple times without effective breakouts. Recent trading has been suboptimal; consult btc0796 for market discussions.
Trading Recommendations:
BTC Short at 81,500-82,000 with a target of 78,000 - 76,000, stop-loss at 82,500.
ETH Short at 2,310-2,350 with a target of 2,200 - 2,000, stop-loss at 2,390.
The views, conclusions, and suggestions in this article are for reference only and do not constitute investment advice. The market carries risks, and investment should be done with caution. $BTC $ETH
On the daily chart for BTC, the short-term price structure is clearer. Bitcoin attempted to break above 83,000 for the first time on May 6 but failed and retraced. On May 11, a second attempt also couldn't effectively surpass the previous high. After two failed tops, a clear double top pattern is forming on the naked candlestick chart, leading to a weakening trend as it begins to test previous low support levels.
On the upside, 82,000 USD is the first psychological barrier, which has previously served as a boundary for price testing multiple times. If the price cannot break through here, the short-term downtrend will be hard to reverse. On the downside, 79,200 USD is the recent short-term support level, while 78,800 USD is the previous swing low support where the price had previously bounced. The critical range further below is between 76,000 and 77,000 USD.
For ETH on the daily chart and lower timeframes, ETH's performance is clearly weaker than Bitcoin. The current price is oscillating between 2,285 and 2,300 USD, showing typical characteristics of a low-volume consolidation. On the 4-hour chart, the price is caught in a narrow range between EMA50 (around 2,275) and EMA20 (around 2,318), with neither an upward breakout nor a downward breach.
On the downside, 2,250 USD is the most urgent defensive line, where EMA50 is located, and it is also near the daily low from May 12, which has seen multiple tests without breaking. If this area is lost, the next support is at 2,020 USD. On the upside, 2,310 to 2,320 USD is the near-term resistance zone, with 2,318 as the 24-hour high and around 2,320 being the intersection of the 4-hour MA30 and MA120. Stronger resistance is found between 2,336 and 2,367 USD, an area where previous support has turned into resistance, tested multiple times without effective breakouts. Recent trading has been suboptimal; consult btc0796 for market discussions.
Trading Recommendations:
BTC Short at 81,500-82,000 with a target of 78,000 - 76,000, stop-loss at 82,500.
ETH Short at 2,310-2,350 with a target of 2,200 - 2,000, stop-loss at 2,390.
The views, conclusions, and suggestions in this article are for reference only and do not constitute investment advice. The market carries risks, and investment should be done with caution. $BTC $ETH
1.5k
·
--
Bearish
May 11th Market Analysis: Bitcoin Faces Resistance on Bounce, Ethereum Pulls Back from Highs, Trend Leans Bearish
Bitcoin's four-hour candlestick chart is showing resistance at 82500, pulling back to a range between 80500 and 81500. The EMA15 moving average is starting to flatten, indicating a slowdown in the short-term bounce. The MACD green bars are continuously shortening, and the fast and slow lines are about to cross, suggesting that the short-term downward momentum is weakening and there is a demand for a bounce. The middle line of the Bollinger Bands is providing support around 80500, while the upper line is under pressure near 81500. The short-term movement is likely to oscillate within this range, and the direction of the breakout needs further confirmation.
Ethereum’s four-hour candlestick chart is in a dense cluster of multiple EMA moving averages, with both bulls and bears showing balanced strength. The Bollinger Bands are currently flat, with the upper band at 2370 and the lower band at 2270, indicating significant oscillation around the middle band. The MACD indicator has formed a golden cross, with red bars gradually expanding, signaling a slight increase in upward momentum. However, the resistance level near 2380 has been tested multiple times without breaking, limiting the bounce momentum. The recent low at 2310 is still holding as effective support, but the overall trend has not escaped the oscillation box, lacking clear trending signals. In this type of market, it’s better to hold off than to make unnecessary moves; if you don’t trade, you won’t lose, so wait for a breakout before making decisive trades.
Trading Suggestions:
BTC: Short at 81500-82000, target 78000 - 75000, stop loss at 82500
ETH: Short at 2350-2390, target 2200 - 2000, stop loss at 2430
The views, conclusions, and suggestions in this article are for reference only and do not constitute investment advice. The market carries risks, and investing requires caution. $BTC
{future}(BTCUSDT)
$ETH
{future}(ETHUSDT)
May 11th Market Analysis: Bitcoin Faces Resistance on Bounce, Ethereum Pulls Back from Highs, Trend Leans Bearish
Bitcoin's four-hour candlestick chart is showing resistance at 82500, pulling back to a range between 80500 and 81500. The EMA15 moving average is starting to flatten, indicating a slowdown in the short-term bounce. The MACD green bars are continuously shortening, and the fast and slow lines are about to cross, suggesting that the short-term downward momentum is weakening and there is a demand for a bounce. The middle line of the Bollinger Bands is providing support around 80500, while the upper line is under pressure near 81500. The short-term movement is likely to oscillate within this range, and the direction of the breakout needs further confirmation.
Ethereum’s four-hour candlestick chart is in a dense cluster of multiple EMA moving averages, with both bulls and bears showing balanced strength. The Bollinger Bands are currently flat, with the upper band at 2370 and the lower band at 2270, indicating significant oscillation around the middle band. The MACD indicator has formed a golden cross, with red bars gradually expanding, signaling a slight increase in upward momentum. However, the resistance level near 2380 has been tested multiple times without breaking, limiting the bounce momentum. The recent low at 2310 is still holding as effective support, but the overall trend has not escaped the oscillation box, lacking clear trending signals. In this type of market, it’s better to hold off than to make unnecessary moves; if you don’t trade, you won’t lose, so wait for a breakout before making decisive trades.
Trading Suggestions:
BTC: Short at 81500-82000, target 78000 - 75000, stop loss at 82500
ETH: Short at 2350-2390, target 2200 - 2000, stop loss at 2430
The views, conclusions, and suggestions in this article are for reference only and do not constitute investment advice. The market carries risks, and investing requires caution. $BTC
$ETH
Bitcoin's four-hour candlestick chart is showing resistance at 82500, pulling back to a range between 80500 and 81500. The EMA15 moving average is starting to flatten, indicating a slowdown in the short-term bounce. The MACD green bars are continuously shortening, and the fast and slow lines are about to cross, suggesting that the short-term downward momentum is weakening and there is a demand for a bounce. The middle line of the Bollinger Bands is providing support around 80500, while the upper line is under pressure near 81500. The short-term movement is likely to oscillate within this range, and the direction of the breakout needs further confirmation.
Ethereum’s four-hour candlestick chart is in a dense cluster of multiple EMA moving averages, with both bulls and bears showing balanced strength. The Bollinger Bands are currently flat, with the upper band at 2370 and the lower band at 2270, indicating significant oscillation around the middle band. The MACD indicator has formed a golden cross, with red bars gradually expanding, signaling a slight increase in upward momentum. However, the resistance level near 2380 has been tested multiple times without breaking, limiting the bounce momentum. The recent low at 2310 is still holding as effective support, but the overall trend has not escaped the oscillation box, lacking clear trending signals. In this type of market, it’s better to hold off than to make unnecessary moves; if you don’t trade, you won’t lose, so wait for a breakout before making decisive trades.
Trading Suggestions:
BTC: Short at 81500-82000, target 78000 - 75000, stop loss at 82500
ETH: Short at 2350-2390, target 2200 - 2000, stop loss at 2430
The views, conclusions, and suggestions in this article are for reference only and do not constitute investment advice. The market carries risks, and investing requires caution. $BTC
$ETH
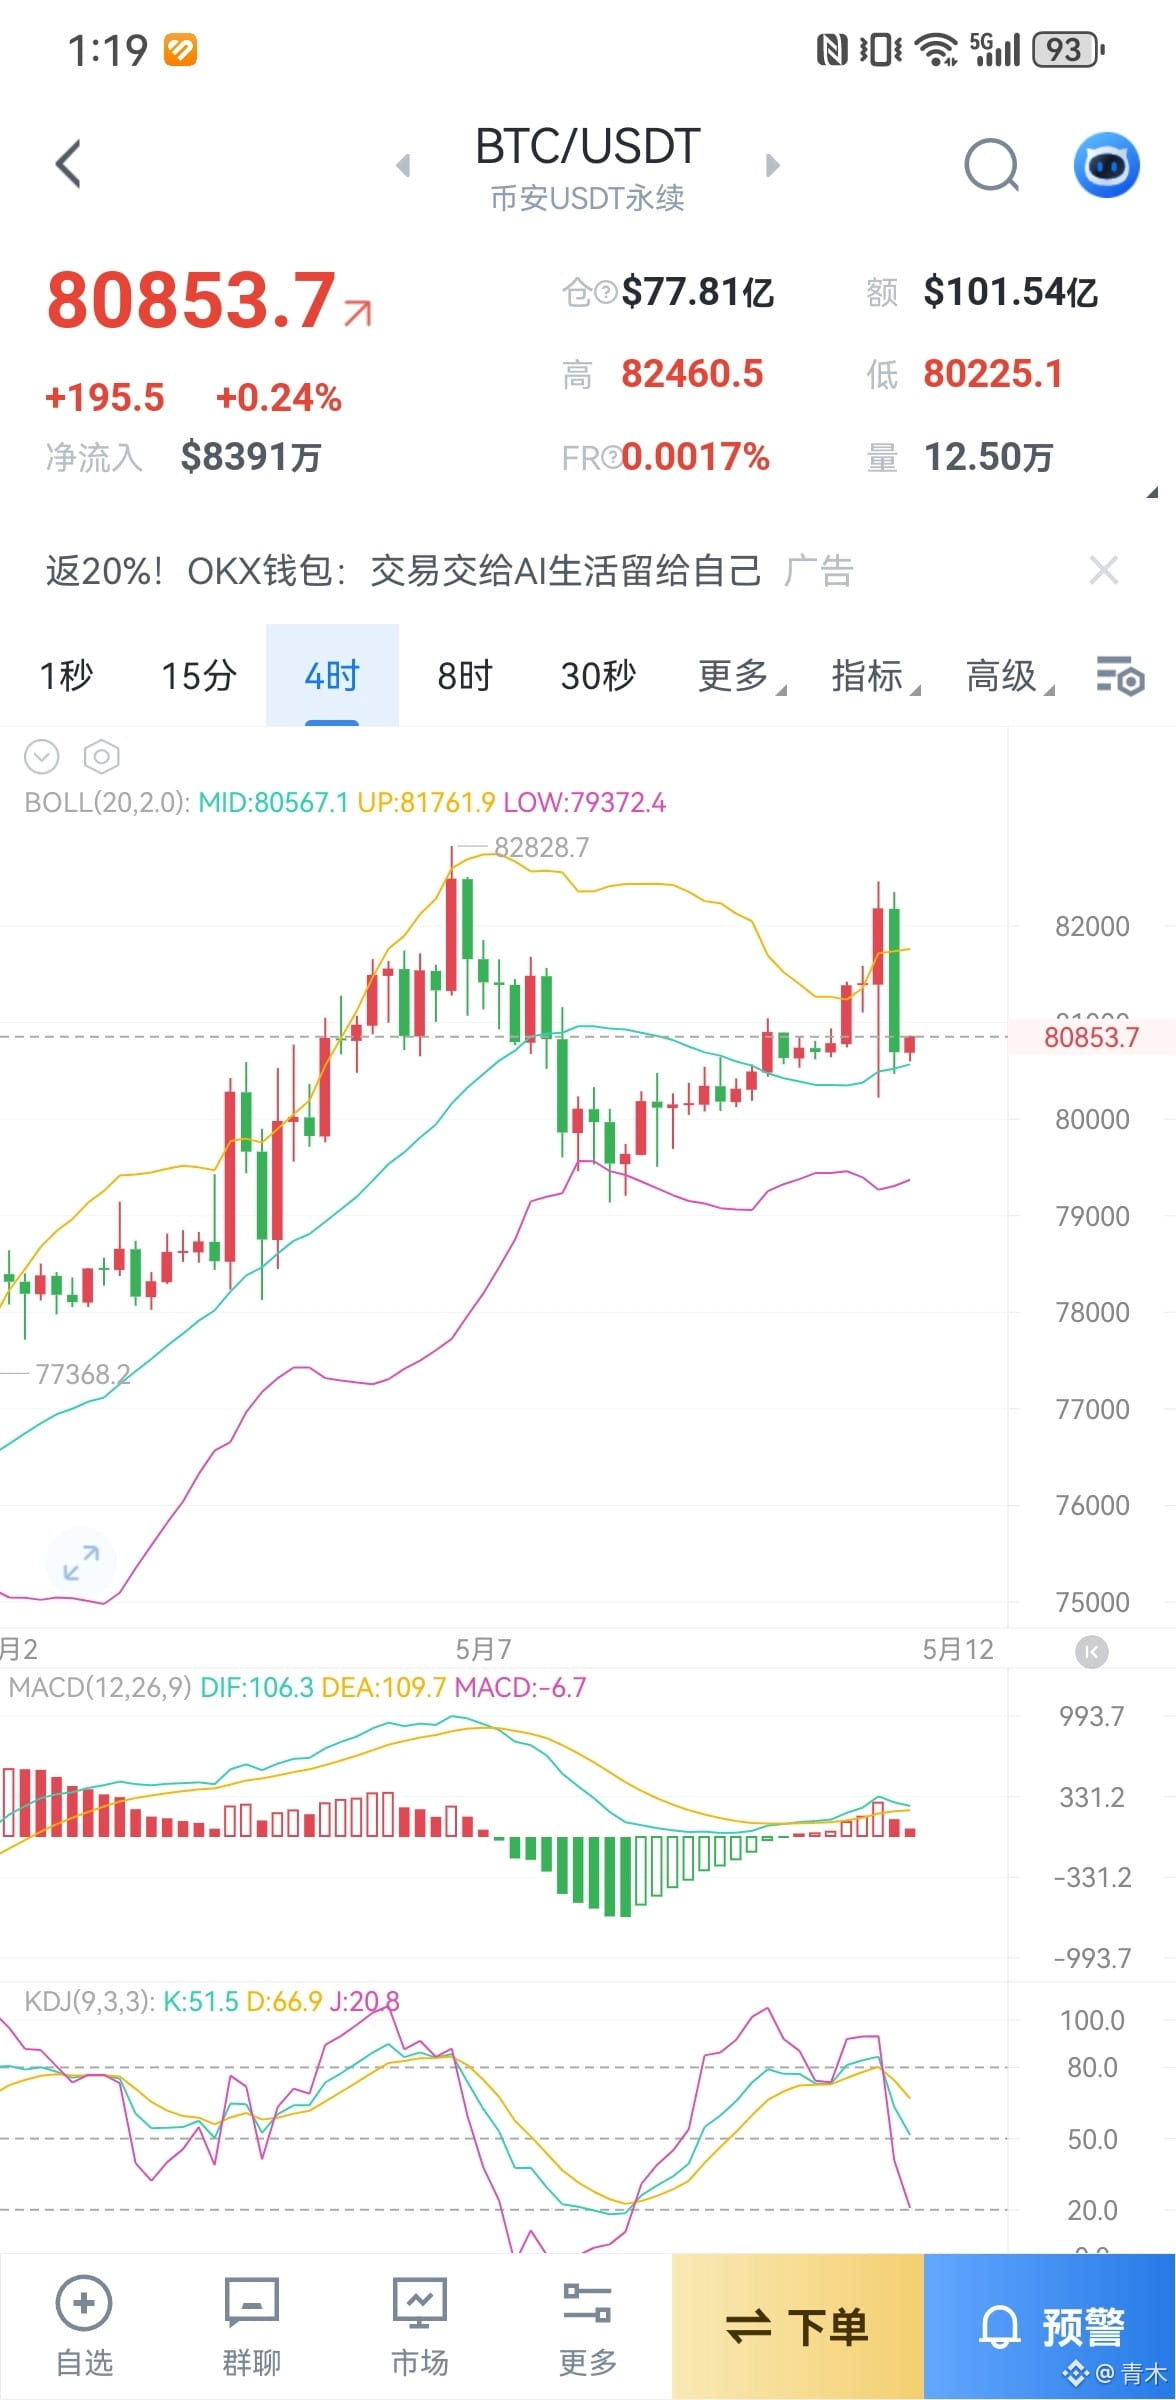
583
·
--
Bearish
May 7th Trend Analysis: Bitcoin Facing Key Resistance, Ethereum Continues to Slide, Are Bears Taking Over?
The Bitcoin market yesterday pretty much hit our previously discussed range of 82000~83000, but now it's facing pressure and pulling back. The long positions were spot on, going long from 75000 to around 83000! Currently, the weekly and monthly moving averages are a struggle; if we can't hold above 83000, it looks like we've hit the top of this bounce, and we might be heading for a significant drop, with a long-term target eyeing the previous support around 60000.
From a technical perspective, Ethereum is looking weak, having faced strong resistance multiple times before. This time it barely tested 2420 before quickly retreating. The support gap has now risen to around 2000, and we could see a sharp drop towards that level in the short term.
Trading Suggestions:
BTC Short at 81000-81500, targeting 78000 - 75000, with a stop-loss at 82000.
ETH Short at 2350-2390, targeting 2200 - 2000, with a stop-loss at 2430.
The views, conclusions, and suggestions in this article are for reference only and do not constitute investment advice. The market carries risks; invest cautiously.
$BTC
{future}(BTCUSDT)
$ETH
{future}(ETHUSDT)
May 7th Trend Analysis: Bitcoin Facing Key Resistance, Ethereum Continues to Slide, Are Bears Taking Over?
The Bitcoin market yesterday pretty much hit our previously discussed range of 82000~83000, but now it's facing pressure and pulling back. The long positions were spot on, going long from 75000 to around 83000! Currently, the weekly and monthly moving averages are a struggle; if we can't hold above 83000, it looks like we've hit the top of this bounce, and we might be heading for a significant drop, with a long-term target eyeing the previous support around 60000.
From a technical perspective, Ethereum is looking weak, having faced strong resistance multiple times before. This time it barely tested 2420 before quickly retreating. The support gap has now risen to around 2000, and we could see a sharp drop towards that level in the short term.
Trading Suggestions:
BTC Short at 81000-81500, targeting 78000 - 75000, with a stop-loss at 82000.
ETH Short at 2350-2390, targeting 2200 - 2000, with a stop-loss at 2430.
The views, conclusions, and suggestions in this article are for reference only and do not constitute investment advice. The market carries risks; invest cautiously.
$BTC
$ETH
The Bitcoin market yesterday pretty much hit our previously discussed range of 82000~83000, but now it's facing pressure and pulling back. The long positions were spot on, going long from 75000 to around 83000! Currently, the weekly and monthly moving averages are a struggle; if we can't hold above 83000, it looks like we've hit the top of this bounce, and we might be heading for a significant drop, with a long-term target eyeing the previous support around 60000.
From a technical perspective, Ethereum is looking weak, having faced strong resistance multiple times before. This time it barely tested 2420 before quickly retreating. The support gap has now risen to around 2000, and we could see a sharp drop towards that level in the short term.
Trading Suggestions:
BTC Short at 81000-81500, targeting 78000 - 75000, with a stop-loss at 82000.
ETH Short at 2350-2390, targeting 2200 - 2000, with a stop-loss at 2430.
The views, conclusions, and suggestions in this article are for reference only and do not constitute investment advice. The market carries risks; invest cautiously.
$BTC
$ETH
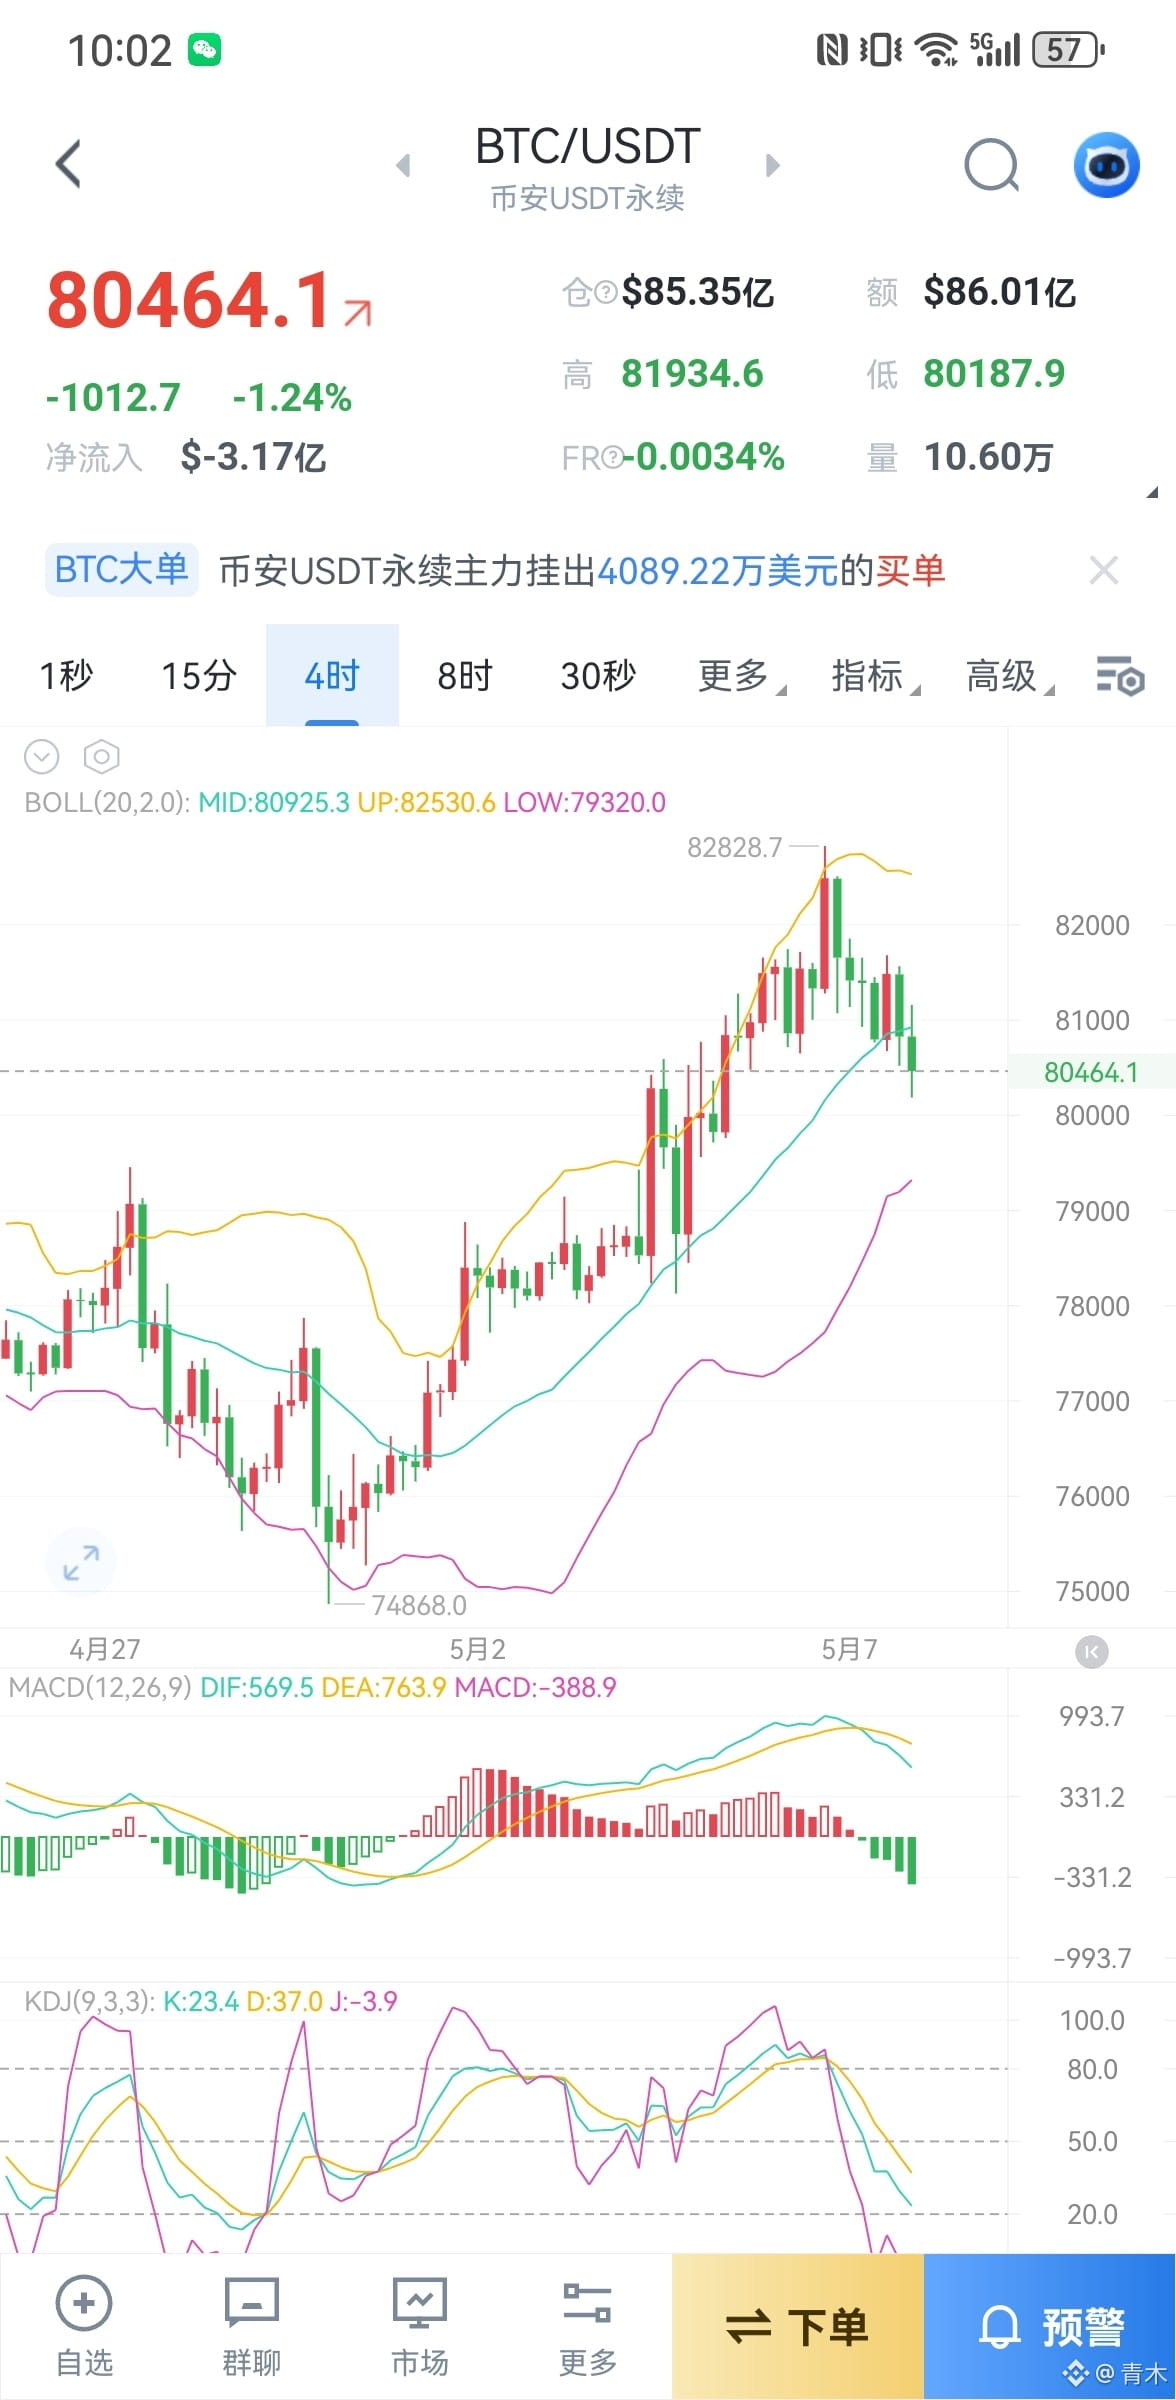
1
563
·
--
Bullish
May 6th Market Analysis: Bitcoin Confirms Breakout with Volume, Ethereum's Weak Follow-Up?
Bitcoin has effectively stabilized above $77,000 and broke through the psychological barrier of $80,000 at the start of May, hitting a three-month high with a 30-day increase of 21%. The current price is hovering around $81,500, showing a bullish trend on the daily chart.
The first resistance level is in the range of $81,800-$82,000. This area is not only near recent price highs but also has seen significant selling pressure, leaving a long upper shadow; it's the first psychological and technical barrier for the bulls. More importantly, $83,000 is the current key macro barrier on the daily chart, representing the most crucial psychological and structural obstacle. If we can close above this level on the daily, it will open the door for macro expansion.
The first support level is in the $80,000-$80,150 range. This area aligns with the recent candlestick structure's pullback stabilization point and the ascending trend line support on the hourly chart. Additionally, the 24-hour low is also within this range, serving as the last psychological defense line for short-term bulls.
Ethereum is currently priced at $2,360, following Bitcoin's upward trend but showing noticeable weakness in comparison. Its structure displays features of linked corrective rally and a slightly bullish but momentum-lacking oscillation. The first resistance level is in the $2,375-$2,400 range, which has been a strong resistance zone repeatedly tested in recent candlestick charts. This area is also a key liquidation line in the derivatives market—data shows about $403 million in short positions above $2,412. A breakout here would trigger massive short squeezes. If $2,400 is effectively broken on the daily close, the next target range looks toward $2,550-$2,650 (about 7% upside potential), further pointing towards the historically significant resistance zone at $2,800.
If this breakout fails to continue, the price is likely to linger within the current range. The first support level is in the $2,330-$2,360 range, including the 4-hour moving average support and the intraday pullback stabilization point; the core structural support is around $2,300, which is a critical defense line for the recent upward trend. A drop below this level would invalidate the short-term bullish logic.
Trading Suggestions:
BTC Long at $80,100-$80,600 with a target of $82,000 - $83,500 and a stop-loss at $79,500.
ETH Long at $2,280-$2,320 with a target of $2,500 - $2,600 and a stop-loss at $2,240.
The views, conclusions, and suggestions in this article are for reference only and do not constitute investment advice. The market has risks; invest cautiously.
$BTC
{future}(BTCUSDT)
$ETH
{future}(ETHUSDT)
May 6th Market Analysis: Bitcoin Confirms Breakout with Volume, Ethereum's Weak Follow-Up?
Bitcoin has effectively stabilized above $77,000 and broke through the psychological barrier of $80,000 at the start of May, hitting a three-month high with a 30-day increase of 21%. The current price is hovering around $81,500, showing a bullish trend on the daily chart.
The first resistance level is in the range of $81,800-$82,000. This area is not only near recent price highs but also has seen significant selling pressure, leaving a long upper shadow; it's the first psychological and technical barrier for the bulls. More importantly, $83,000 is the current key macro barrier on the daily chart, representing the most crucial psychological and structural obstacle. If we can close above this level on the daily, it will open the door for macro expansion.
The first support level is in the $80,000-$80,150 range. This area aligns with the recent candlestick structure's pullback stabilization point and the ascending trend line support on the hourly chart. Additionally, the 24-hour low is also within this range, serving as the last psychological defense line for short-term bulls.
Ethereum is currently priced at $2,360, following Bitcoin's upward trend but showing noticeable weakness in comparison. Its structure displays features of linked corrective rally and a slightly bullish but momentum-lacking oscillation. The first resistance level is in the $2,375-$2,400 range, which has been a strong resistance zone repeatedly tested in recent candlestick charts. This area is also a key liquidation line in the derivatives market—data shows about $403 million in short positions above $2,412. A breakout here would trigger massive short squeezes. If $2,400 is effectively broken on the daily close, the next target range looks toward $2,550-$2,650 (about 7% upside potential), further pointing towards the historically significant resistance zone at $2,800.
If this breakout fails to continue, the price is likely to linger within the current range. The first support level is in the $2,330-$2,360 range, including the 4-hour moving average support and the intraday pullback stabilization point; the core structural support is around $2,300, which is a critical defense line for the recent upward trend. A drop below this level would invalidate the short-term bullish logic.
Trading Suggestions:
BTC Long at $80,100-$80,600 with a target of $82,000 - $83,500 and a stop-loss at $79,500.
ETH Long at $2,280-$2,320 with a target of $2,500 - $2,600 and a stop-loss at $2,240.
The views, conclusions, and suggestions in this article are for reference only and do not constitute investment advice. The market has risks; invest cautiously.
$BTC
$ETH
Bitcoin has effectively stabilized above $77,000 and broke through the psychological barrier of $80,000 at the start of May, hitting a three-month high with a 30-day increase of 21%. The current price is hovering around $81,500, showing a bullish trend on the daily chart.
The first resistance level is in the range of $81,800-$82,000. This area is not only near recent price highs but also has seen significant selling pressure, leaving a long upper shadow; it's the first psychological and technical barrier for the bulls. More importantly, $83,000 is the current key macro barrier on the daily chart, representing the most crucial psychological and structural obstacle. If we can close above this level on the daily, it will open the door for macro expansion.
The first support level is in the $80,000-$80,150 range. This area aligns with the recent candlestick structure's pullback stabilization point and the ascending trend line support on the hourly chart. Additionally, the 24-hour low is also within this range, serving as the last psychological defense line for short-term bulls.
Ethereum is currently priced at $2,360, following Bitcoin's upward trend but showing noticeable weakness in comparison. Its structure displays features of linked corrective rally and a slightly bullish but momentum-lacking oscillation. The first resistance level is in the $2,375-$2,400 range, which has been a strong resistance zone repeatedly tested in recent candlestick charts. This area is also a key liquidation line in the derivatives market—data shows about $403 million in short positions above $2,412. A breakout here would trigger massive short squeezes. If $2,400 is effectively broken on the daily close, the next target range looks toward $2,550-$2,650 (about 7% upside potential), further pointing towards the historically significant resistance zone at $2,800.
If this breakout fails to continue, the price is likely to linger within the current range. The first support level is in the $2,330-$2,360 range, including the 4-hour moving average support and the intraday pullback stabilization point; the core structural support is around $2,300, which is a critical defense line for the recent upward trend. A drop below this level would invalidate the short-term bullish logic.
Trading Suggestions:
BTC Long at $80,100-$80,600 with a target of $82,000 - $83,500 and a stop-loss at $79,500.
ETH Long at $2,280-$2,320 with a target of $2,500 - $2,600 and a stop-loss at $2,240.
The views, conclusions, and suggestions in this article are for reference only and do not constitute investment advice. The market has risks; invest cautiously.
$BTC
$ETH
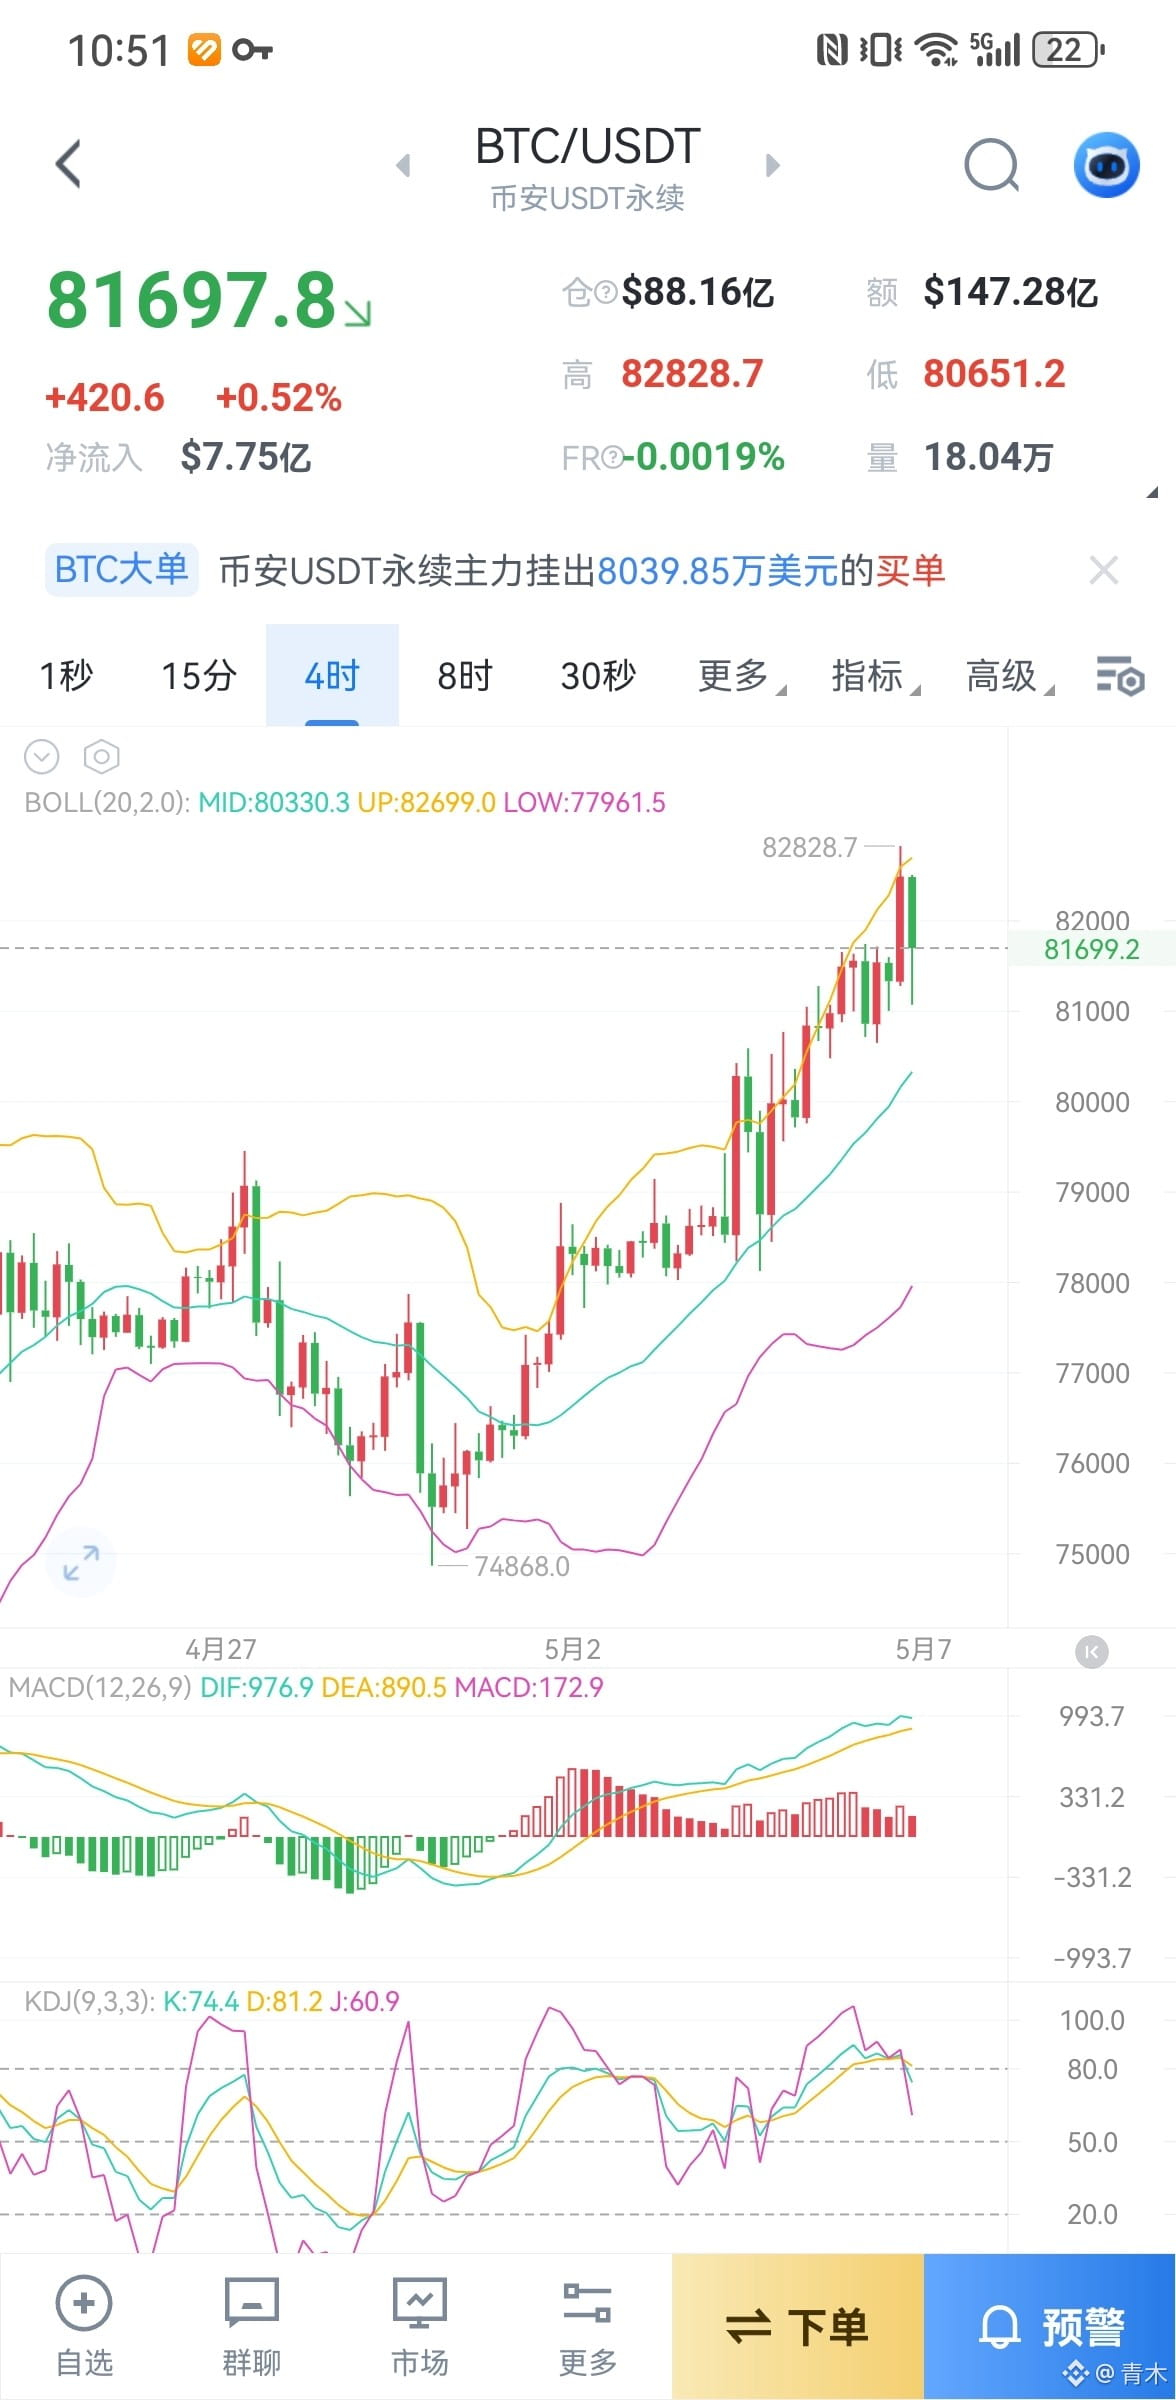
2
391
·
--
Bullish
May 5th Market Analysis: Bitcoin Breaks Out, Ethereum Poised for a Rally.
The market has been pretty stagnant for the past couple of days with no significant movement. This morning, Trump's comments sparked a candlestick surge, pushing prices up. The day session has been tricky with both FOMO and shorting opportunities. The initial breakout was a false move, followed by a real breakout. Over the past month, it’s clear that altcoins are dancing wildly—are we entering alt season or is this just a final hurrah?
Bitcoin's breakout point is at 79500, establishing a solid foothold. We might see some high-level consolidation before continuing the upward trend, targeting the 8.2-8.3 region for a weekly reversal, potentially higher.
Ethereum has its trend resistance line drawn between 2463-2400, with 2355 being a key resistance level. This morning, it also had an entity breakthrough and has since retraced. We expect another leg up, and it’s all about whether Ethereum will catch up. Previously, Bitcoin hit 79k while Ethereum surged to 2460; now at 80k, Ethereum is still near 2370. This time we can expect Ethereum to aim for a rally up to the 2500-2600 zone—let's hold strong!
Trading Recommendations:
BTC 78500-79000 long, target 80500 - 81500, stop-loss at 78000
ETH 2260-2300 long, target 2450 - 2600, stop-loss at 2220
The views, conclusions, and suggestions in this article are for reference only and do not constitute investment advice. The market carries risks; invest cautiously.
$BTC
{future}(BTCUSDT)
$ETH
{future}(ETHUSDT)
May 5th Market Analysis: Bitcoin Breaks Out, Ethereum Poised for a Rally.
The market has been pretty stagnant for the past couple of days with no significant movement. This morning, Trump's comments sparked a candlestick surge, pushing prices up. The day session has been tricky with both FOMO and shorting opportunities. The initial breakout was a false move, followed by a real breakout. Over the past month, it’s clear that altcoins are dancing wildly—are we entering alt season or is this just a final hurrah?
Bitcoin's breakout point is at 79500, establishing a solid foothold. We might see some high-level consolidation before continuing the upward trend, targeting the 8.2-8.3 region for a weekly reversal, potentially higher.
Ethereum has its trend resistance line drawn between 2463-2400, with 2355 being a key resistance level. This morning, it also had an entity breakthrough and has since retraced. We expect another leg up, and it’s all about whether Ethereum will catch up. Previously, Bitcoin hit 79k while Ethereum surged to 2460; now at 80k, Ethereum is still near 2370. This time we can expect Ethereum to aim for a rally up to the 2500-2600 zone—let's hold strong!
Trading Recommendations:
BTC 78500-79000 long, target 80500 - 81500, stop-loss at 78000
ETH 2260-2300 long, target 2450 - 2600, stop-loss at 2220
The views, conclusions, and suggestions in this article are for reference only and do not constitute investment advice. The market carries risks; invest cautiously.
$BTC
$ETH
The market has been pretty stagnant for the past couple of days with no significant movement. This morning, Trump's comments sparked a candlestick surge, pushing prices up. The day session has been tricky with both FOMO and shorting opportunities. The initial breakout was a false move, followed by a real breakout. Over the past month, it’s clear that altcoins are dancing wildly—are we entering alt season or is this just a final hurrah?
Bitcoin's breakout point is at 79500, establishing a solid foothold. We might see some high-level consolidation before continuing the upward trend, targeting the 8.2-8.3 region for a weekly reversal, potentially higher.
Ethereum has its trend resistance line drawn between 2463-2400, with 2355 being a key resistance level. This morning, it also had an entity breakthrough and has since retraced. We expect another leg up, and it’s all about whether Ethereum will catch up. Previously, Bitcoin hit 79k while Ethereum surged to 2460; now at 80k, Ethereum is still near 2370. This time we can expect Ethereum to aim for a rally up to the 2500-2600 zone—let's hold strong!
Trading Recommendations:
BTC 78500-79000 long, target 80500 - 81500, stop-loss at 78000
ETH 2260-2300 long, target 2450 - 2600, stop-loss at 2220
The views, conclusions, and suggestions in this article are for reference only and do not constitute investment advice. The market carries risks; invest cautiously.
$BTC
$ETH
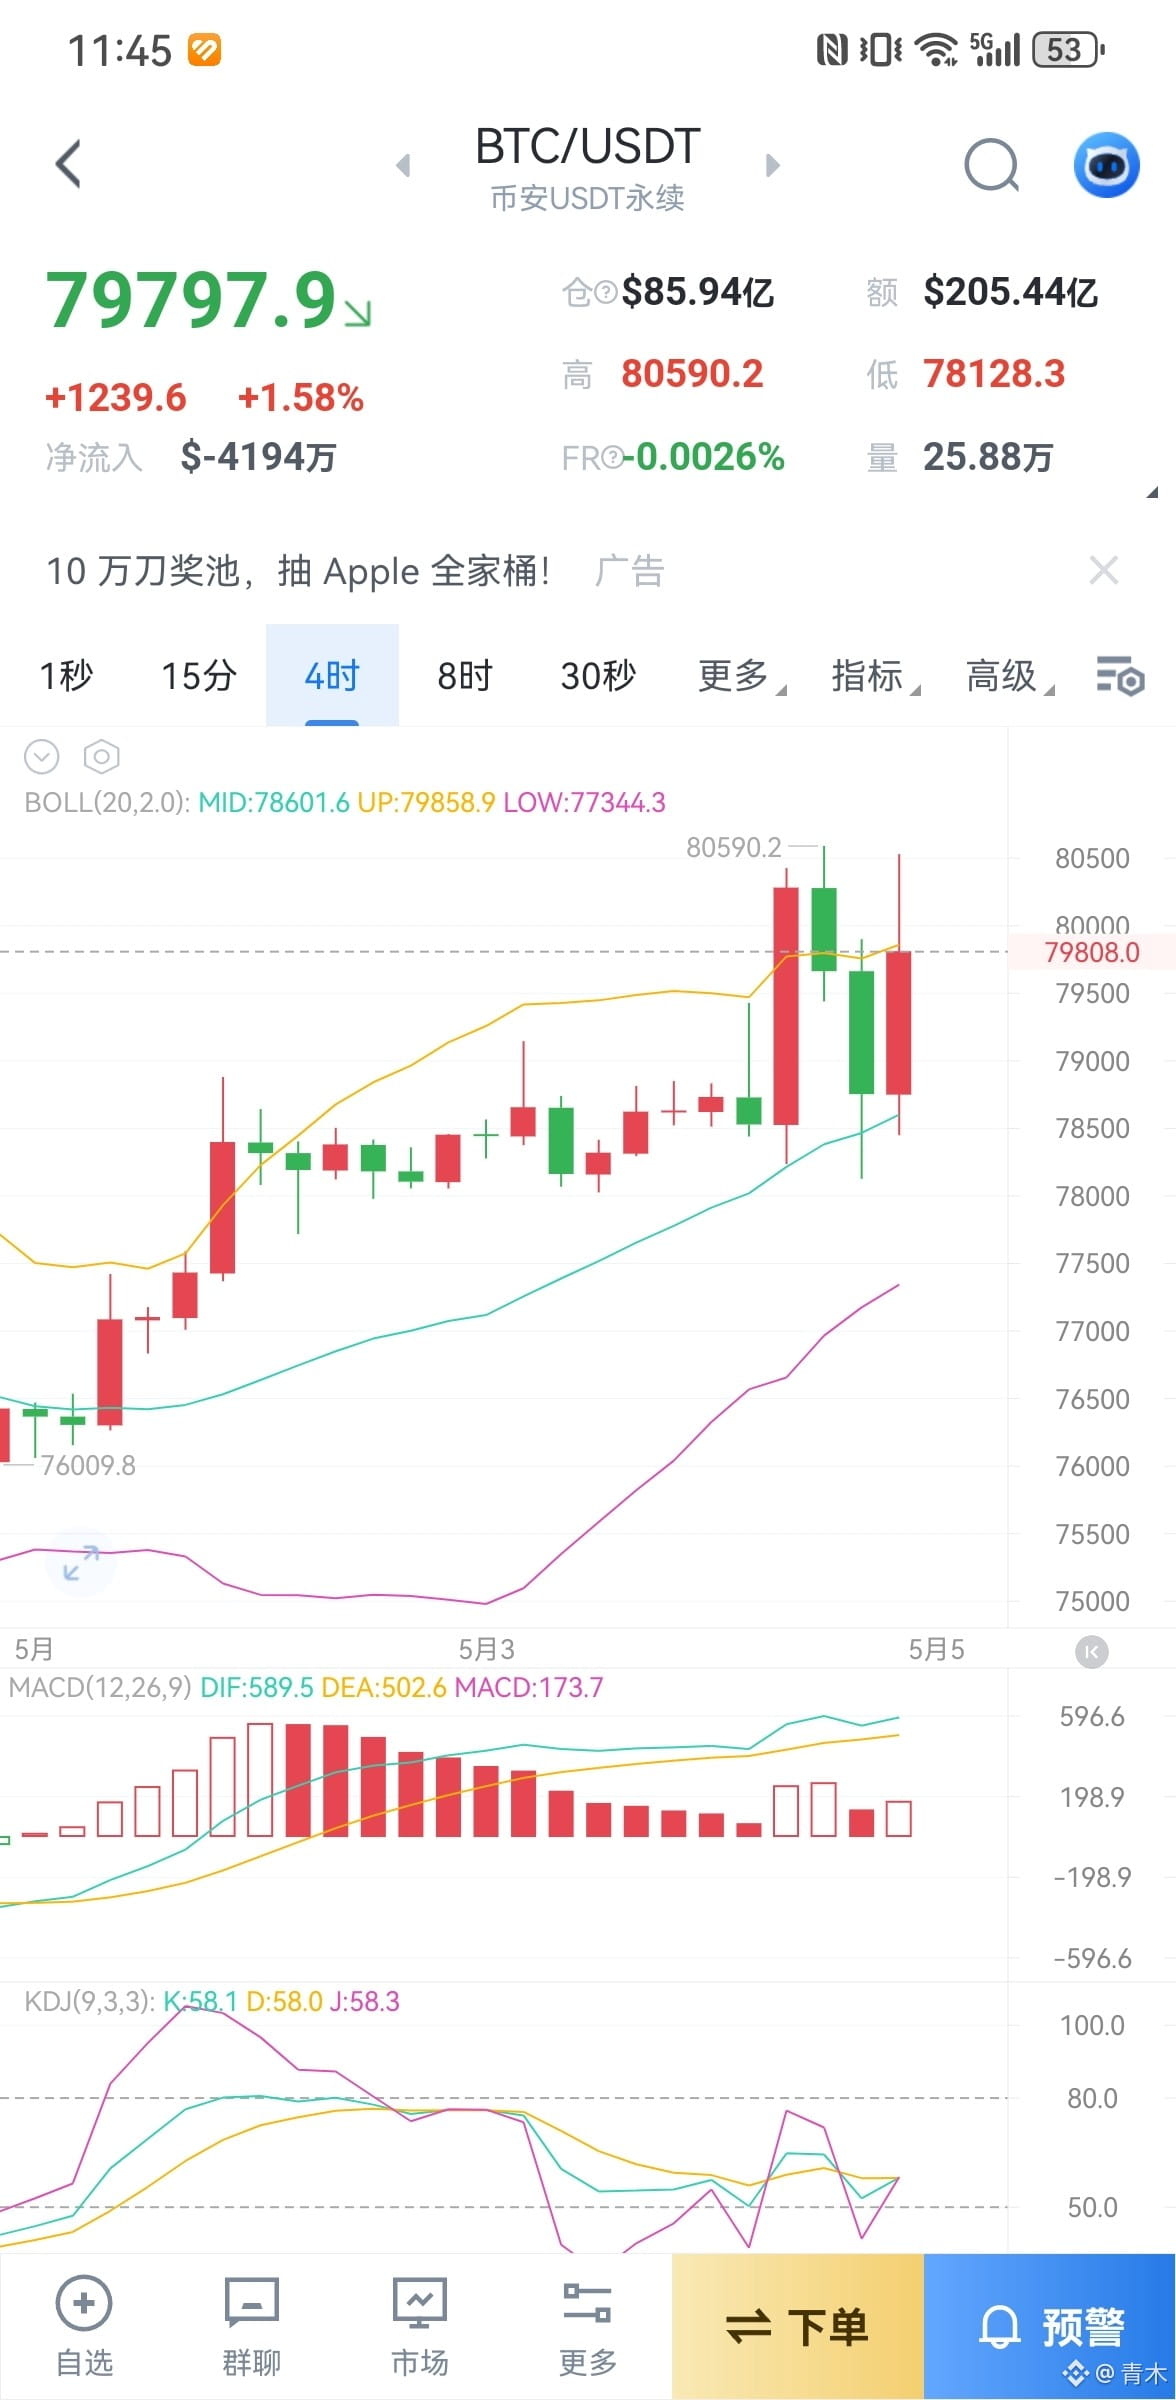
3
5
1k
·
--
Bullish
May 2nd Market Analysis: Bitcoin continues to eye breaking the 80k mark, while Ethereum bulls are closely following with momentum.
The recent outlook has been bullish since 75k, and today we’re still holding that long position. Short-term targets are set to break 80k and test the 81k-84k range, with the overall direction still pointing towards a significant rally, and short-term longs are in profit. From a technical perspective, Bitcoin's upward channel resistance has been raised to around 83k, while trend support has been lifted to about 76k, with short-term parallel resistance at 80.5k.
For Ethereum, the technical setup shows that channel resistance has increased to around 2515, support has been raised to near 2000, mid-channel support at around 2250, and the strongest parallel resistance remains unchanged at 2620!
Trading Recommendations:
BTC long between 77k-77.5k, targeting 79k-80.5k with a stop-loss at 76.5k.
ETH long between 2240-2280, targeting 2450-2550 with a stop-loss at 2200.
The opinions, conclusions, and suggestions in this article are for reference only and do not constitute investment advice. The market carries risks; invest with caution.
$BTC
{future}(BTCUSDT)
$ETH
{future}(ETHUSDT)
May 2nd Market Analysis: Bitcoin continues to eye breaking the 80k mark, while Ethereum bulls are closely following with momentum.
The recent outlook has been bullish since 75k, and today we’re still holding that long position. Short-term targets are set to break 80k and test the 81k-84k range, with the overall direction still pointing towards a significant rally, and short-term longs are in profit. From a technical perspective, Bitcoin's upward channel resistance has been raised to around 83k, while trend support has been lifted to about 76k, with short-term parallel resistance at 80.5k.
For Ethereum, the technical setup shows that channel resistance has increased to around 2515, support has been raised to near 2000, mid-channel support at around 2250, and the strongest parallel resistance remains unchanged at 2620!
Trading Recommendations:
BTC long between 77k-77.5k, targeting 79k-80.5k with a stop-loss at 76.5k.
ETH long between 2240-2280, targeting 2450-2550 with a stop-loss at 2200.
The opinions, conclusions, and suggestions in this article are for reference only and do not constitute investment advice. The market carries risks; invest with caution.
$BTC
$ETH
The recent outlook has been bullish since 75k, and today we’re still holding that long position. Short-term targets are set to break 80k and test the 81k-84k range, with the overall direction still pointing towards a significant rally, and short-term longs are in profit. From a technical perspective, Bitcoin's upward channel resistance has been raised to around 83k, while trend support has been lifted to about 76k, with short-term parallel resistance at 80.5k.
For Ethereum, the technical setup shows that channel resistance has increased to around 2515, support has been raised to near 2000, mid-channel support at around 2250, and the strongest parallel resistance remains unchanged at 2620!
Trading Recommendations:
BTC long between 77k-77.5k, targeting 79k-80.5k with a stop-loss at 76.5k.
ETH long between 2240-2280, targeting 2450-2550 with a stop-loss at 2200.
The opinions, conclusions, and suggestions in this article are for reference only and do not constitute investment advice. The market carries risks; invest with caution.
$BTC
$ETH
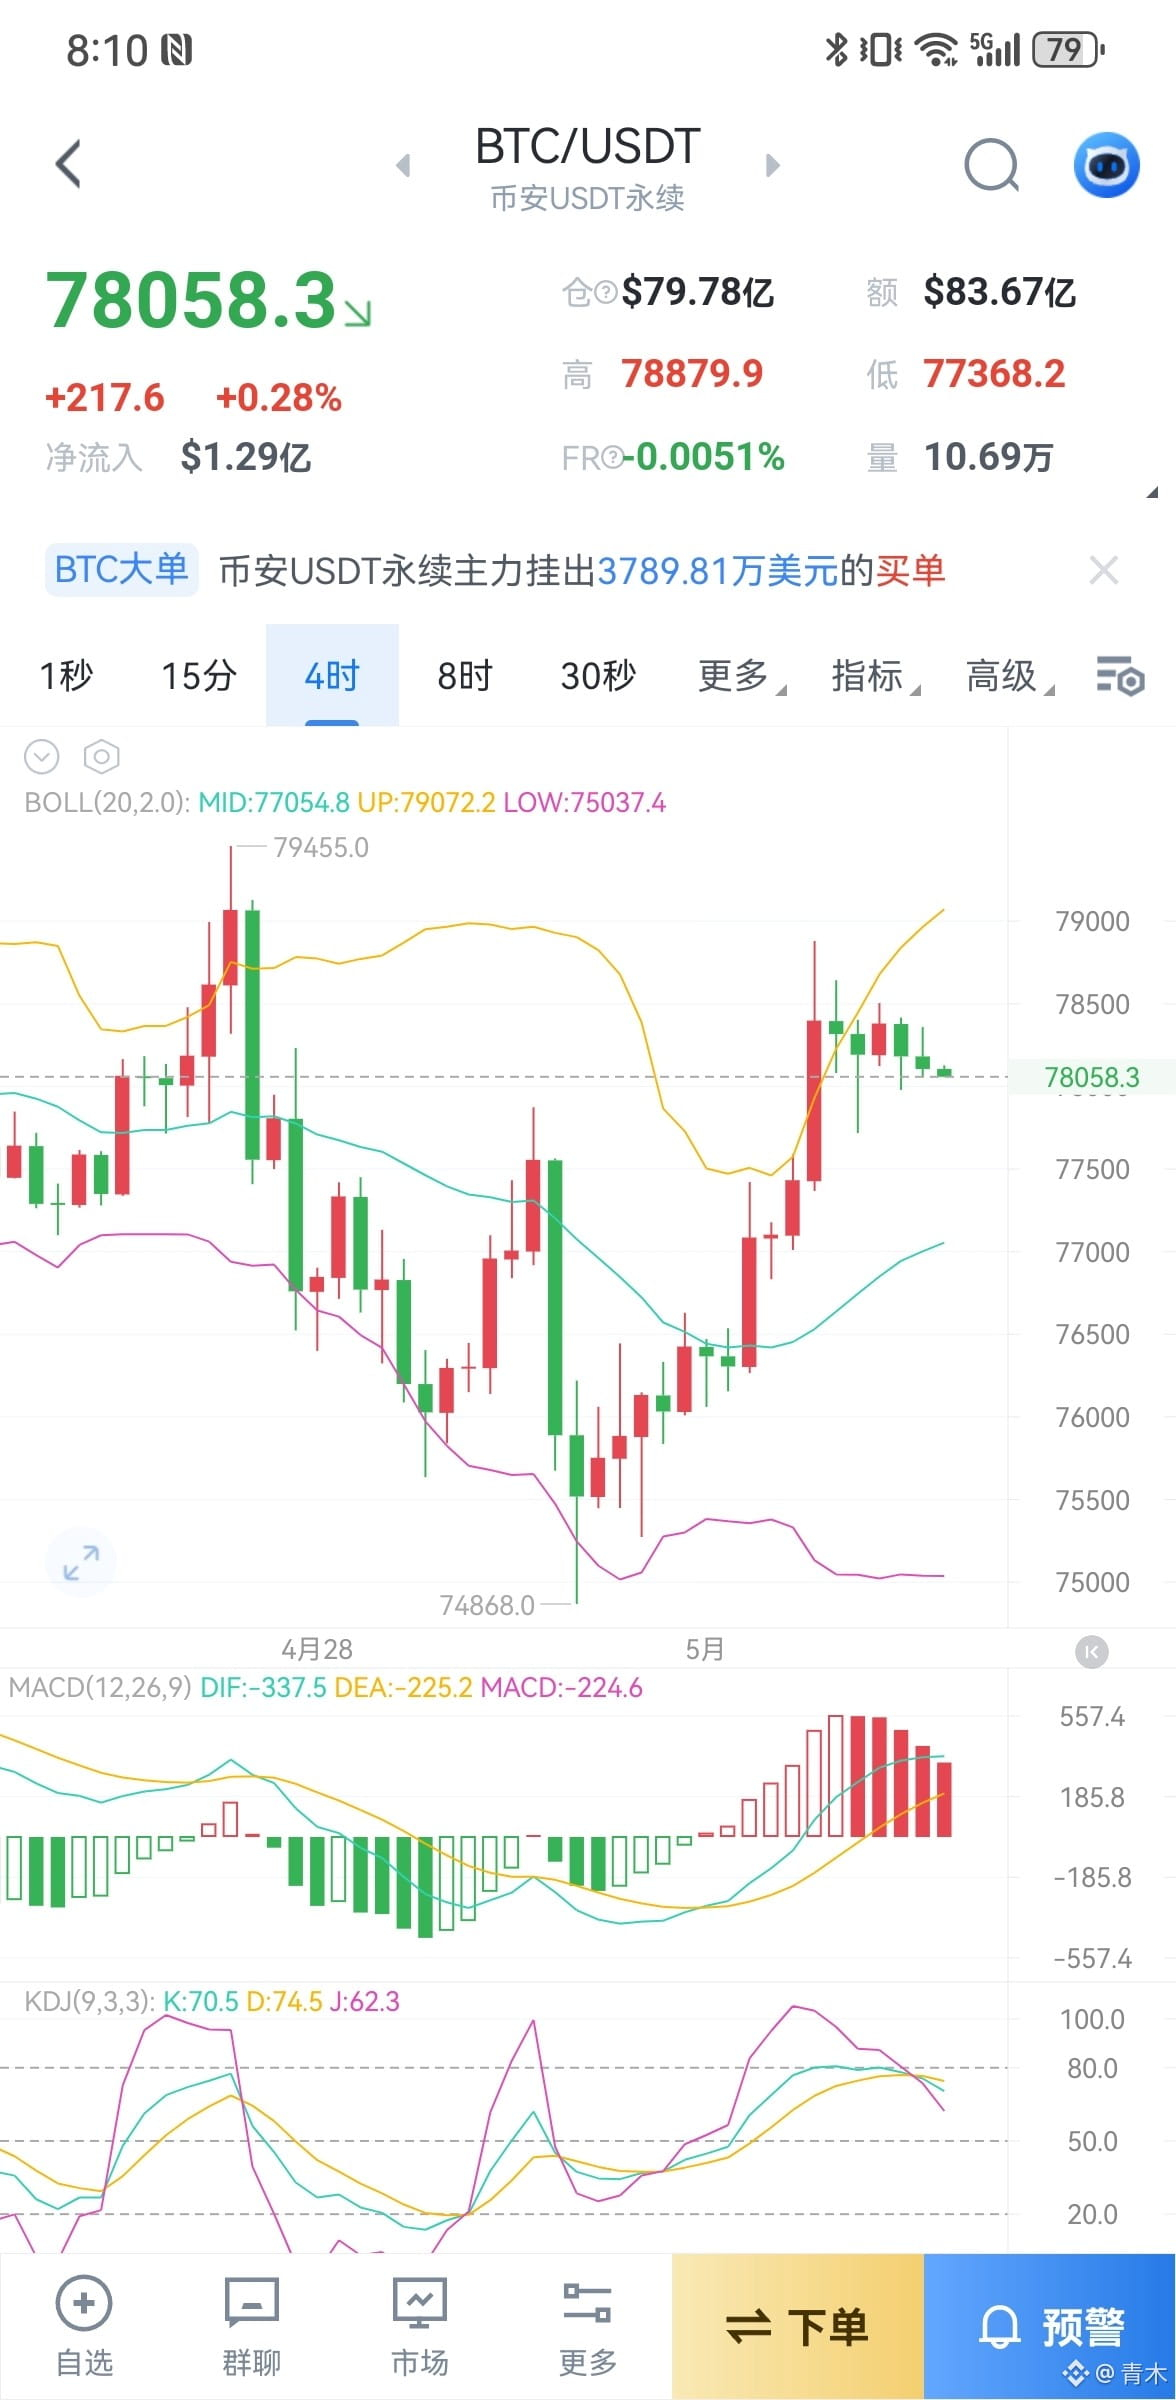
2
678
·
--
Bullish
My mindset is shot; it's been a whole day and night, and the market is still stuck in place. This is really dragging on and messing with my head. It looks like unless we see a deep dip or a sharp drop, we won't easily see a pump. It's like this same old story keeps playing out. Come on, drop already! I'm just waiting to DCA hard when it does.
$BTC
{future}(BTCUSDT)
$ETH
{future}(ETHUSDT)
My mindset is shot; it's been a whole day and night, and the market is still stuck in place. This is really dragging on and messing with my head. It looks like unless we see a deep dip or a sharp drop, we won't easily see a pump. It's like this same old story keeps playing out. Come on, drop already! I'm just waiting to DCA hard when it does.
$BTC
$ETH
$BTC
$ETH
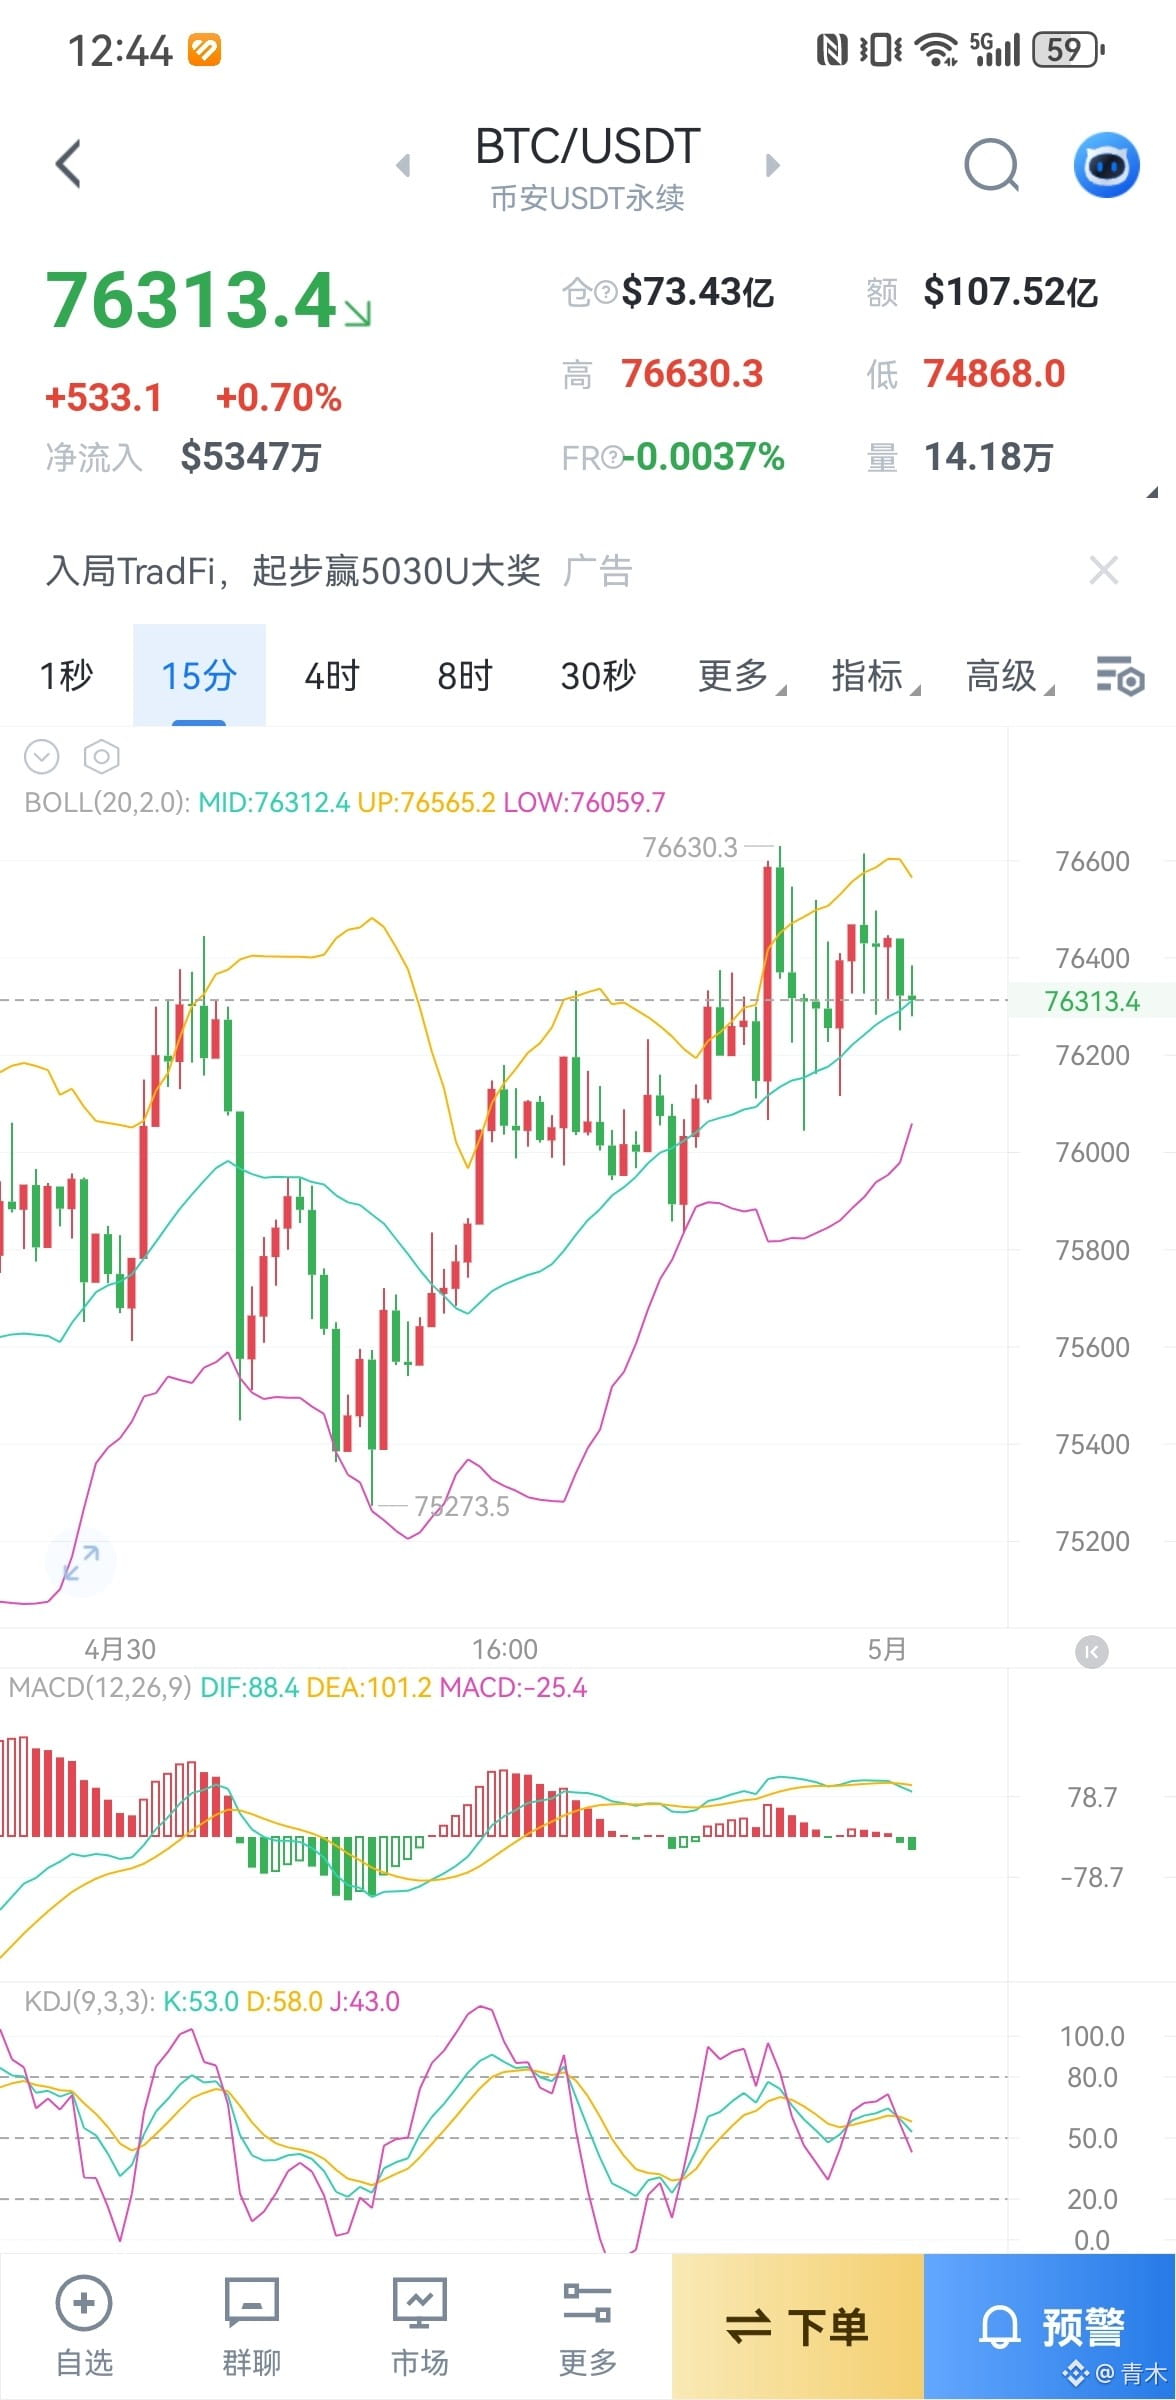
青木
·
--
BullishApril 30 Market Analysis: US-Iran Talks Completely Collapse! BTC and ETH Face Off at a Critical Juncture, Tonight Will Set the Direction.
The crypto market is gearing up for a storm. With the Federal Reserve's interest rate decision approaching, Bitcoin is maintaining a narrow range between $75,500 and $77,000, while Ethereum is consolidating in the $2,250 to $2,300 zone, both showing signs of reduced volume and market indecision. From a naked candlestick perspective, prices are encountering clear resistance at key levels and are testing support below, with the market awaiting macro catalysts to confirm the next phase of movement.
BTC's main resistance is at $77,150. If the daily close holds above this level, it may trigger a bounce back towards $77,500. Strong support exists below $75,500, where approximately 298,560 BTC have accumulated purchases, aligning with the 20-day moving average and the lower boundary of the 100-day upward channel. A significant breakdown would target $74,000 next, and if $73,000 is lost, the daily uptrend structure could face substantial damage.
From the candlestick patterns, ETH has repeatedly tested the $2,350-$2,400 resistance zone since mid-March, with each attempt ending in rejection marked by long upper wicks. Recently, it has formed several engulfing bearish candles, dropping to around $2,256. The hourly MACD shows increasing bearish momentum, indicating that sellers are still firmly in control and have not eased up.
Ethereum's main resistance lies in the $2,330-$2,350 range, where it faces pressure from the 21-period moving average and EMA50. A volume-driven breakout above $2,400 with a daily close could open up space for a rally towards $2,500-$2,550. Support is at $2,220, and a clear breakdown would target $2,180 next, with deeper critical support around $2,120. Long-term value remains concentrated in the prior accumulation zone of $1,980-$2,277.
Trading Advice:
BTC Long at $75,000-$75,500 Targeting $77,500-$79,500 Stop Loss at $74,500
ETH Long at $2,210-$2,250 Targeting $2,350-$2,450 Stop Loss at $2,170
The views, conclusions, and recommendations in this article are for reference only and do not constitute investment advice. The market carries risks, and investments should be made cautiously.
$BTC
$ETH
The crypto market is gearing up for a storm. With the Federal Reserve's interest rate decision approaching, Bitcoin is maintaining a narrow range between $75,500 and $77,000, while Ethereum is consolidating in the $2,250 to $2,300 zone, both showing signs of reduced volume and market indecision. From a naked candlestick perspective, prices are encountering clear resistance at key levels and are testing support below, with the market awaiting macro catalysts to confirm the next phase of movement.
BTC's main resistance is at $77,150. If the daily close holds above this level, it may trigger a bounce back towards $77,500. Strong support exists below $75,500, where approximately 298,560 BTC have accumulated purchases, aligning with the 20-day moving average and the lower boundary of the 100-day upward channel. A significant breakdown would target $74,000 next, and if $73,000 is lost, the daily uptrend structure could face substantial damage.
From the candlestick patterns, ETH has repeatedly tested the $2,350-$2,400 resistance zone since mid-March, with each attempt ending in rejection marked by long upper wicks. Recently, it has formed several engulfing bearish candles, dropping to around $2,256. The hourly MACD shows increasing bearish momentum, indicating that sellers are still firmly in control and have not eased up.
Ethereum's main resistance lies in the $2,330-$2,350 range, where it faces pressure from the 21-period moving average and EMA50. A volume-driven breakout above $2,400 with a daily close could open up space for a rally towards $2,500-$2,550. Support is at $2,220, and a clear breakdown would target $2,180 next, with deeper critical support around $2,120. Long-term value remains concentrated in the prior accumulation zone of $1,980-$2,277.
Trading Advice:
BTC Long at $75,000-$75,500 Targeting $77,500-$79,500 Stop Loss at $74,500
ETH Long at $2,210-$2,250 Targeting $2,350-$2,450 Stop Loss at $2,170
The views, conclusions, and recommendations in this article are for reference only and do not constitute investment advice. The market carries risks, and investments should be made cautiously.
$BTC
$ETH
1
561
Log in to explore more content
Join global crypto users on Binance Square
⚡️ Get latest and useful information about crypto.
💬 Trusted by the world’s largest crypto exchange.
👍 Discover real insights from verified creators.
Email / Phone number
Trending Topics
CircleTetherFreezeBitgetHackerWallet
17,999 views
183 Discussing
#circletetherfreezebitgethackerwallet 🚨 CIRCLE & TETHER FREEZE BITGET HACKER WALLET
A major crypto security incident has triggered another important debate around stablecoin controls.
Bitget reported a massive security breach on September 24, with the initial loss estimated at $351.6M. The exchange later revised the affected-asset estimate to approximately $387.5M, after accounting for additional assets including Zcash and TRON.
🔒 Circle & Tether Take Action
Circle blacklisted a wallet identified as “Bitget Exploiter 8”, while Tether subsequently blocked the same address.
The wallet contained approximately:
• 99,990 USDC
• 218,023 USDT
• 170.47 ETH
The freeze effectively locked around $318,000 worth of USDC and USDT.
⚠️ But there is a major limitation:
Stablecoin issuers can freeze their own tokens, but they cannot freeze native ETH. Reports indicate that other exploiter wallets still held more than 63,000 ETH.
Bitget CEO Gracy Chen said the attackers compromised a backend system in the exchange's wallet infrastructure and spoofed transaction data, rather than obtaining users' private keys. Bitget says its cold wallets were unaffected and its User Protection Fund holds more than $464M.
📌 The bigger takeaway:
This incident shows both the power and limits of centralized stablecoin controls. USDC and USDT can potentially be frozen at the token-contract level, while assets such as ETH cannot be frozen by stablecoin issuers.
👀 Assets to watch:
$BTC • $ETH • $XRP
#Bitget #CryptoSecurity #Circle #Tether #USDC #USDT #CryptoNews
Ayeshg
·2 Likes
·9.3k views
SECSaysTokenBuybacksNotAutoSecurities
1,310 views
67 Discussing
ChinaUSAgreeOn$30BTariffCut
140 views
3 Discussing