

看盘猫
2.3k Posts

看盘猫
Report
Block User

ETH Holder
Occasional Trader
5.5 Years
4 Following
90 Followers
116 Liked
Posts
All
Quotes
·
--
If you come across “SEC shutdown: more than 90 crypto ETFs frozen,” don’t immediately treat it as the start of a countdown to SOL and XRP approvals. Whether approvals will be paused depends not on how many times the claim is reposted on trending feeds, but on whether the U.S. government has actually run out of funding.
The U.S. continuing appropriations law for fiscal year 2027, signed on September 2, extends funding for the relevant agencies through December 11. On October 2, the SEC website also published an exchange rule approval involving leveraged Bitcoin and Ethereum ETFs. A “shutdown contingency plan” explains what happens after funding lapses; it is not proof that a shutdown has already begun in October.
So the claim that “all new crypto ETFs are frozen and their deadlines have collectively been pushed back” is not supported at this point. To assess a particular product’s progress, check its specific SEC filings and exchange announcements. Don’t let an urgent-sounding headline make the decision for you.
If you come across “SEC shutdown: more than 90 crypto ETFs frozen,” don’t immediately treat it as the start of a countdown to SOL and XRP approvals. Whether approvals will be paused depends not on how many times the claim is reposted on trending feeds, but on whether the U.S. government has actually run out of funding.
The U.S. continuing appropriations law for fiscal year 2027, signed on September 2, extends funding for the relevant agencies through December 11. On October 2, the SEC website also published an exchange rule approval involving leveraged Bitcoin and Ethereum ETFs. A “shutdown contingency plan” explains what happens after funding lapses; it is not proof that a shutdown has already begun in October.
So the claim that “all new crypto ETFs are frozen and their deadlines have collectively been pushed back” is not supported at this point. To assess a particular product’s progress, check its specific SEC filings and exchange announcements. Don’t let an urgent-sounding headline make the decision for you.
The U.S. continuing appropriations law for fiscal year 2027, signed on September 2, extends funding for the relevant agencies through December 11. On October 2, the SEC website also published an exchange rule approval involving leveraged Bitcoin and Ethereum ETFs. A “shutdown contingency plan” explains what happens after funding lapses; it is not proof that a shutdown has already begun in October.
So the claim that “all new crypto ETFs are frozen and their deadlines have collectively been pushed back” is not supported at this point. To assess a particular product’s progress, check its specific SEC filings and exchange announcements. Don’t let an urgent-sounding headline make the decision for you.
75
·
--
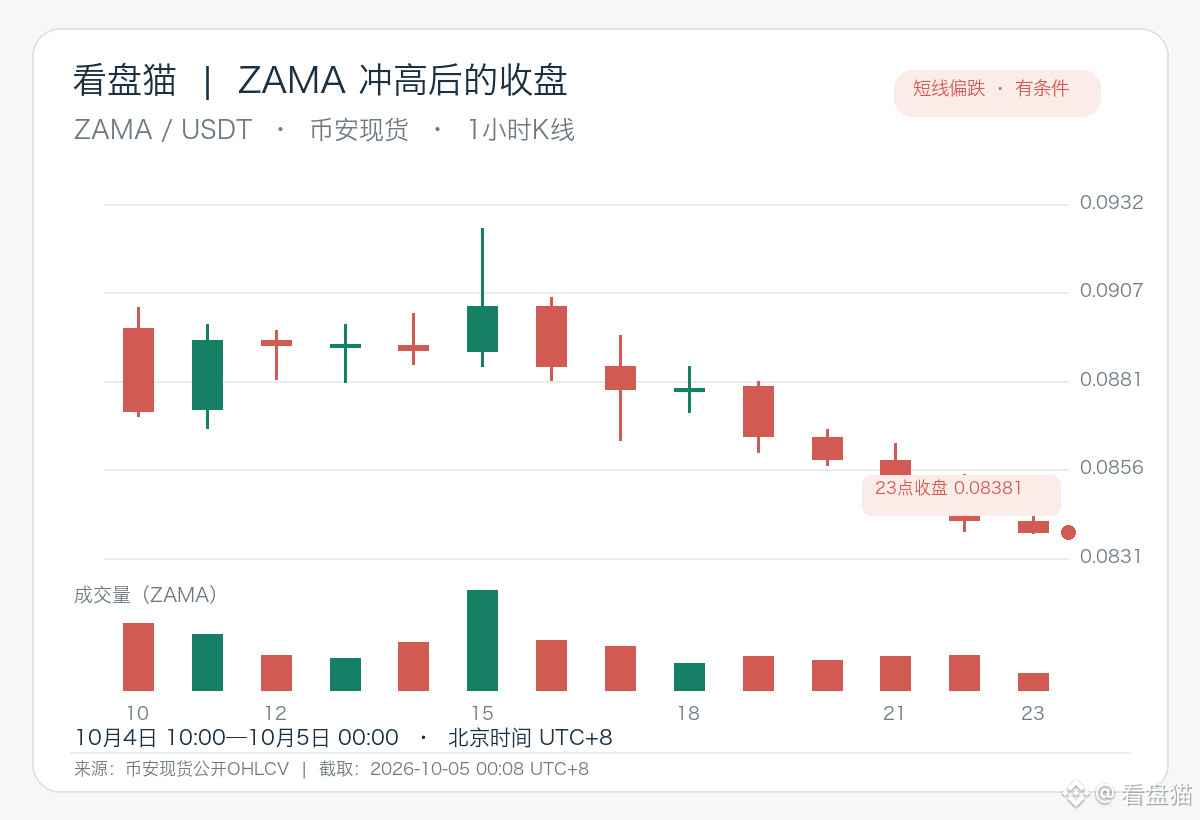
ZAMA hot post is still up with “+16% and surge to 0.09.” Some people are calling for a privacy-sector comeback, while others are waiting to short. If you saw an old screenshot and want to chase, first check whether the spike left anything behind at the close: it didn’t.
As of 00:00 Beijing time on October 5, Binance spot ZAMA/USDT on the 4-day 15:00 hourly candle reached a high of $0.09250 and closed at $0.09028, with about 7.73 million coins traded. The 23:00 candle closed at $0.08381 with about 1.29 million coins traded, less than half of the 22:00 candle. During the same period, BTC rose from $85,106 to $85,256—ZAMA wasn’t dropping along with the broader market.
From 00:00 to 04:00, the short-term bias is bearish. The reason is that after the spike, closes continued to fall. If before 04:00 there is an already completed hourly close above the 22:00 high of $0.08547, and volume exceeds the 23:00 amount of about 1.29 million coins, then the bearish thesis is invalidated. 0.09 is the price it touched yesterday—don’t use old posts as your current “entry” signal.
ZAMA hot post is still up with “+16% and surge to 0.09.” Some people are calling for a privacy-sector comeback, while others are waiting to short. If you saw an old screenshot and want to chase, first check whether the spike left anything behind at the close: it didn’t.
As of 00:00 Beijing time on October 5, Binance spot ZAMA/USDT on the 4-day 15:00 hourly candle reached a high of $0.09250 and closed at $0.09028, with about 7.73 million coins traded. The 23:00 candle closed at $0.08381 with about 1.29 million coins traded, less than half of the 22:00 candle. During the same period, BTC rose from $85,106 to $85,256—ZAMA wasn’t dropping along with the broader market.
From 00:00 to 04:00, the short-term bias is bearish. The reason is that after the spike, closes continued to fall. If before 04:00 there is an already completed hourly close above the 22:00 high of $0.08547, and volume exceeds the 23:00 amount of about 1.29 million coins, then the bearish thesis is invalidated. 0.09 is the price it touched yesterday—don’t use old posts as your current “entry” signal.
As of 00:00 Beijing time on October 5, Binance spot ZAMA/USDT on the 4-day 15:00 hourly candle reached a high of $0.09250 and closed at $0.09028, with about 7.73 million coins traded. The 23:00 candle closed at $0.08381 with about 1.29 million coins traded, less than half of the 22:00 candle. During the same period, BTC rose from $85,106 to $85,256—ZAMA wasn’t dropping along with the broader market.
From 00:00 to 04:00, the short-term bias is bearish. The reason is that after the spike, closes continued to fall. If before 04:00 there is an already completed hourly close above the 22:00 high of $0.08547, and volume exceeds the 23:00 amount of about 1.29 million coins, then the bearish thesis is invalidated. 0.09 is the price it touched yesterday—don’t use old posts as your current “entry” signal.
204
·
--
In a BNB hot post, someone is urgently asking: Binance, what exactly will you announce tomorrow—and is it still too late to jump in? You can guess the new product and even guess the burn, but the easiest pitfall to fall into is treating a “guess that correctly predicts the announcement” as if it directly means “BNB will immediately get an extra spot buy demand.”
If it’s indeed a quarterly burn, the official mechanism calculates based on the BNB price and the quarterly block volume. During execution, the coins are transferred to an address that’s unusable. That reduces total supply, but it doesn’t go into the spot market to buy coins for you. The last official record was the 36th burn in July; for the next burn’s date and quantity, you can’t take guesses from the forum as confirmation.
Once the announcement comes out, first check whether it truly involves BNB. Look at whether it says it has already been executed, is about to be executed, or merely that a plan will be released. If it involves burns, then verify with on-chain transactions. Previews can stir emotions, but they can’t replace real demand. Filling in a potential price increase for information that hasn’t been revealed yet is often more expensive than missing out on a move for a while.
In a BNB hot post, someone is urgently asking: Binance, what exactly will you announce tomorrow—and is it still too late to jump in? You can guess the new product and even guess the burn, but the easiest pitfall to fall into is treating a “guess that correctly predicts the announcement” as if it directly means “BNB will immediately get an extra spot buy demand.”
If it’s indeed a quarterly burn, the official mechanism calculates based on the BNB price and the quarterly block volume. During execution, the coins are transferred to an address that’s unusable. That reduces total supply, but it doesn’t go into the spot market to buy coins for you. The last official record was the 36th burn in July; for the next burn’s date and quantity, you can’t take guesses from the forum as confirmation.
Once the announcement comes out, first check whether it truly involves BNB. Look at whether it says it has already been executed, is about to be executed, or merely that a plan will be released. If it involves burns, then verify with on-chain transactions. Previews can stir emotions, but they can’t replace real demand. Filling in a potential price increase for information that hasn’t been revealed yet is often more expensive than missing out on a move for a while.
If it’s indeed a quarterly burn, the official mechanism calculates based on the BNB price and the quarterly block volume. During execution, the coins are transferred to an address that’s unusable. That reduces total supply, but it doesn’t go into the spot market to buy coins for you. The last official record was the 36th burn in July; for the next burn’s date and quantity, you can’t take guesses from the forum as confirmation.
Once the announcement comes out, first check whether it truly involves BNB. Look at whether it says it has already been executed, is about to be executed, or merely that a plan will be released. If it involves burns, then verify with on-chain transactions. Previews can stir emotions, but they can’t replace real demand. Filling in a potential price increase for information that hasn’t been revealed yet is often more expensive than missing out on a move for a while.
213
·
--
Seeing “850,000 ETH queued to exit”—don’t treat it as a sell order for tonight’s spot market. If you actually have a staked position, the question to ask is: once you click exit now, how long until you get back usable ETH?
As of 22:08 Beijing time, the validator queue page shows about 823,000 ETH waiting to exit, with an estimated wait of 14 days and 7 hours; the page was last updated about two hours ago. Once the queue is cleared, the validator duties are completed, but the balance still has to wait until it reaches a withdrawable state, after which it is transferred on-chain in batches. MetaMask said on September 30 that, due to a security incident affecting some infrastructure, it is proactively exiting affected validators; the announcement didn’t say anything about selling the tokens after exiting.
If you participate via a staking pool, your actual received funds will also depend on the provider’s redemption rules and available liquidity. The exit queue is a withdrawal progress tracker, not a trade execution order. First, check when the platform you use allows redemptions and when the funds will be available; based on queue numbers alone, you can’t infer the ETH price movement in the next hour.
Seeing “850,000 ETH queued to exit”—don’t treat it as a sell order for tonight’s spot market. If you actually have a staked position, the question to ask is: once you click exit now, how long until you get back usable ETH?
As of 22:08 Beijing time, the validator queue page shows about 823,000 ETH waiting to exit, with an estimated wait of 14 days and 7 hours; the page was last updated about two hours ago. Once the queue is cleared, the validator duties are completed, but the balance still has to wait until it reaches a withdrawable state, after which it is transferred on-chain in batches. MetaMask said on September 30 that, due to a security incident affecting some infrastructure, it is proactively exiting affected validators; the announcement didn’t say anything about selling the tokens after exiting.
If you participate via a staking pool, your actual received funds will also depend on the provider’s redemption rules and available liquidity. The exit queue is a withdrawal progress tracker, not a trade execution order. First, check when the platform you use allows redemptions and when the funds will be available; based on queue numbers alone, you can’t infer the ETH price movement in the next hour.
As of 22:08 Beijing time, the validator queue page shows about 823,000 ETH waiting to exit, with an estimated wait of 14 days and 7 hours; the page was last updated about two hours ago. Once the queue is cleared, the validator duties are completed, but the balance still has to wait until it reaches a withdrawable state, after which it is transferred on-chain in batches. MetaMask said on September 30 that, due to a security incident affecting some infrastructure, it is proactively exiting affected validators; the announcement didn’t say anything about selling the tokens after exiting.
If you participate via a staking pool, your actual received funds will also depend on the provider’s redemption rules and available liquidity. The exit queue is a withdrawal progress tracker, not a trade execution order. First, check when the platform you use allows redemptions and when the funds will be available; based on queue numbers alone, you can’t infer the ETH price movement in the next hour.
143
·
--
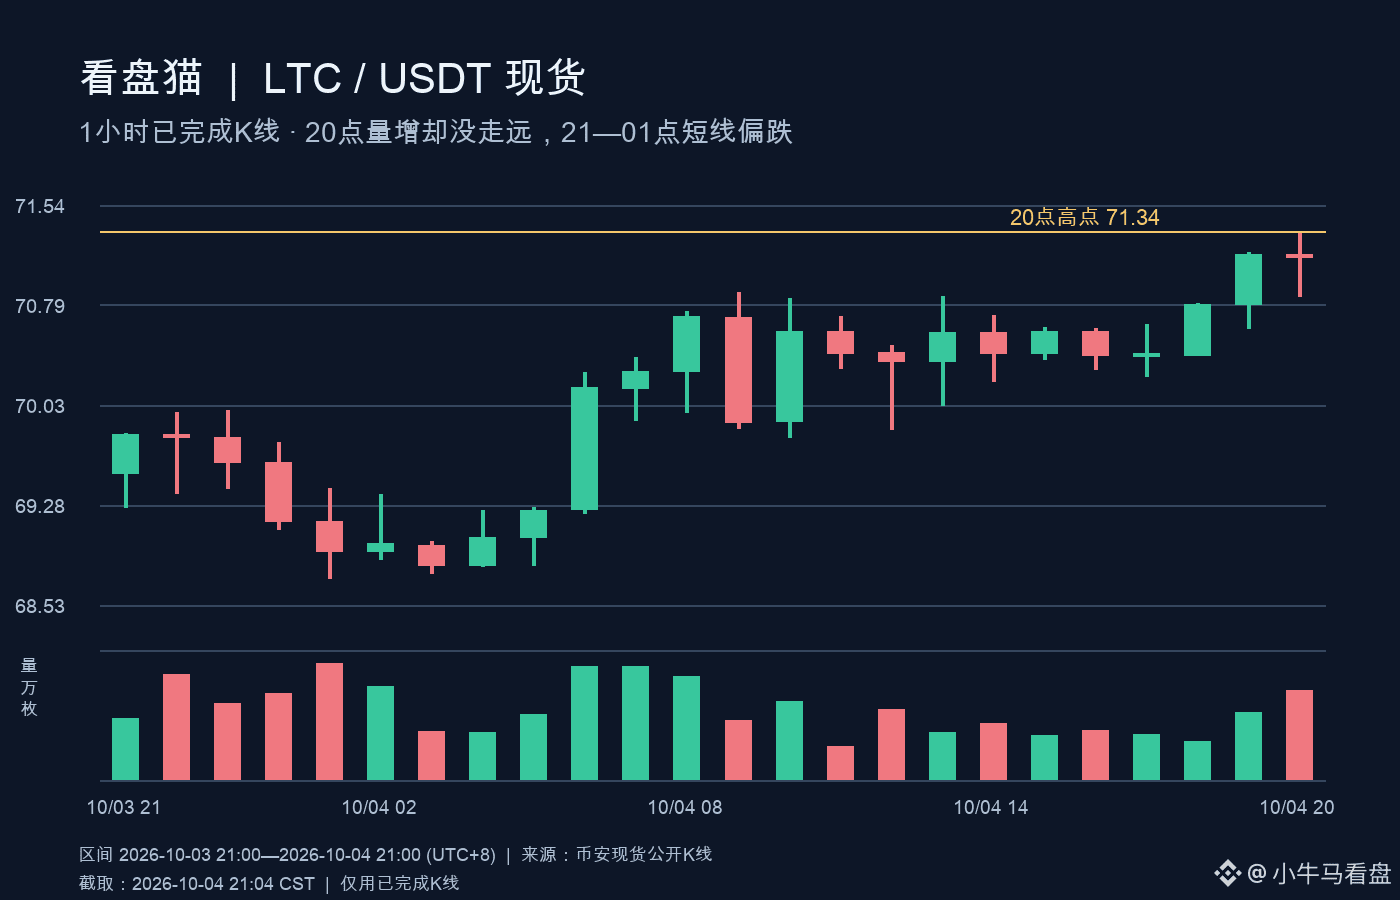
LTC hot post turns 70.88 into “it only counts once it breaks above.” As the price keeps hovering near the old line, chasing the previous thresholds can make people think it can keep rising; but within the last hour that just closed, while trading got livelier, the close didn’t move forward.
As of 21:00 Beijing time, Binance spot LTC/USDT’s 19:00 hourly candle rose from 70.79 to 71.17 dollars, with about 11.9 thousand coins traded. At 20:00, the high was 71.34 and it closed at 71.15, with about 16.0 thousand coins traded—around 34% more than the previous hour. In the same period, BTC’s 20:00 hourly candle fell from 85,309 to 85,128 dollars, and LTC showed relative resilience; however, after the increased volume, it still didn’t close above the 19:00 high of 71.18, and the follow-through still isn’t solid.
From 21:00 to 01:00 the next day, the short-term bias is slightly bearish: volume increases but the close doesn’t push up. The old post’s “break above” needs to be re-tested. If, during this period, a completed 1-hour K-line closes above the 20:00 high of 71.34, then this judgment would no longer hold. 71.34 is only a test level for the current hour, not a long-term resistance—first, see whether the close can keep lifting.
LTC hot post turns 70.88 into “it only counts once it breaks above.” As the price keeps hovering near the old line, chasing the previous thresholds can make people think it can keep rising; but within the last hour that just closed, while trading got livelier, the close didn’t move forward.
As of 21:00 Beijing time, Binance spot LTC/USDT’s 19:00 hourly candle rose from 70.79 to 71.17 dollars, with about 11.9 thousand coins traded. At 20:00, the high was 71.34 and it closed at 71.15, with about 16.0 thousand coins traded—around 34% more than the previous hour. In the same period, BTC’s 20:00 hourly candle fell from 85,309 to 85,128 dollars, and LTC showed relative resilience; however, after the increased volume, it still didn’t close above the 19:00 high of 71.18, and the follow-through still isn’t solid.
From 21:00 to 01:00 the next day, the short-term bias is slightly bearish: volume increases but the close doesn’t push up. The old post’s “break above” needs to be re-tested. If, during this period, a completed 1-hour K-line closes above the 20:00 high of 71.34, then this judgment would no longer hold. 71.34 is only a test level for the current hour, not a long-term resistance—first, see whether the close can keep lifting.
As of 21:00 Beijing time, Binance spot LTC/USDT’s 19:00 hourly candle rose from 70.79 to 71.17 dollars, with about 11.9 thousand coins traded. At 20:00, the high was 71.34 and it closed at 71.15, with about 16.0 thousand coins traded—around 34% more than the previous hour. In the same period, BTC’s 20:00 hourly candle fell from 85,309 to 85,128 dollars, and LTC showed relative resilience; however, after the increased volume, it still didn’t close above the 19:00 high of 71.18, and the follow-through still isn’t solid.
From 21:00 to 01:00 the next day, the short-term bias is slightly bearish: volume increases but the close doesn’t push up. The old post’s “break above” needs to be re-tested. If, during this period, a completed 1-hour K-line closes above the 20:00 high of 71.34, then this judgment would no longer hold. 71.34 is only a test level for the current hour, not a long-term resistance—first, see whether the close can keep lifting.
428
·
--
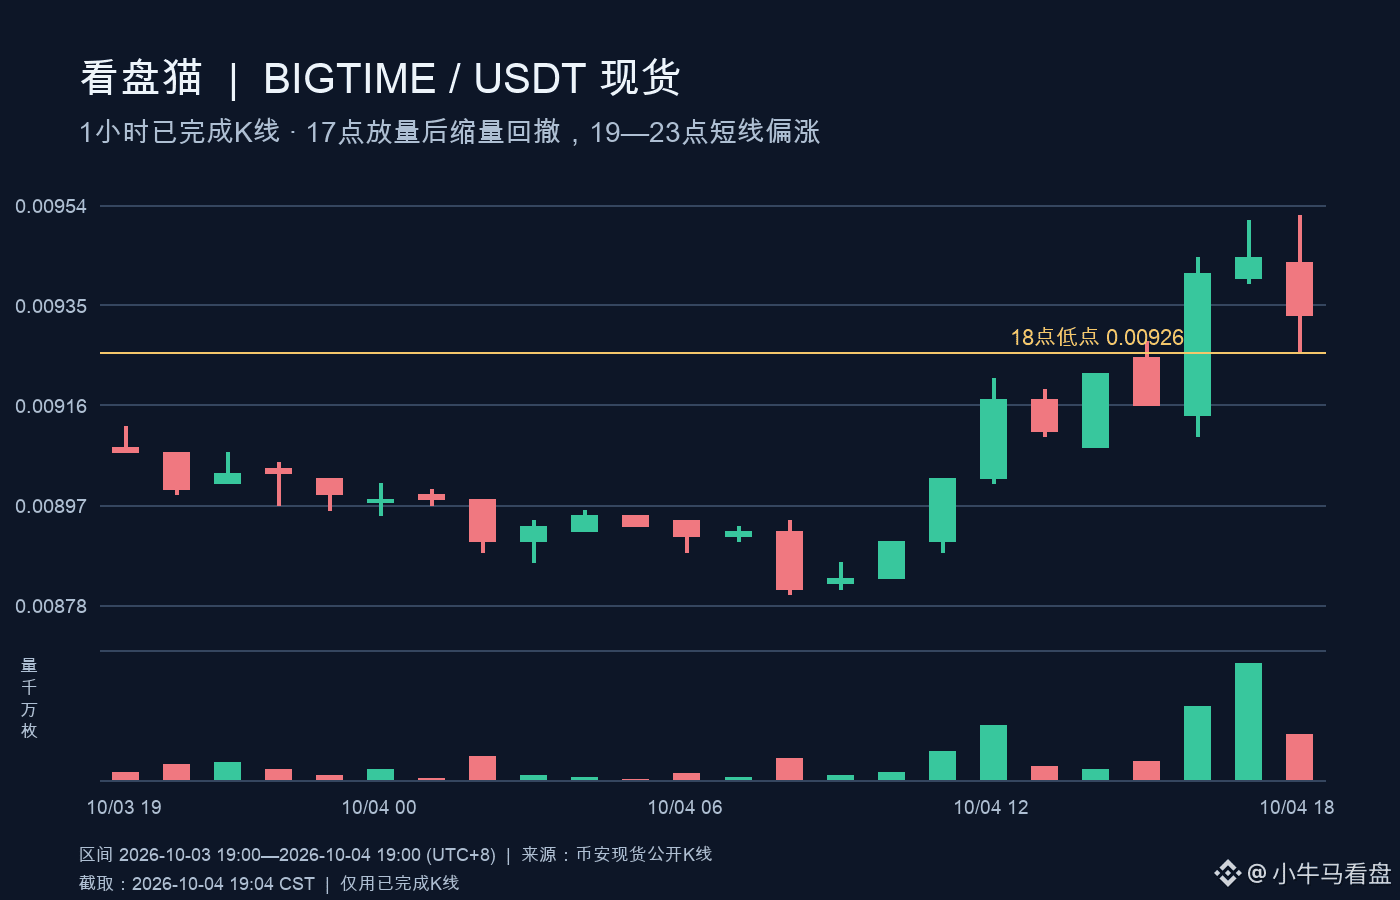
BIGTIME hot post: while calling 0.0088–0.0092 the “order-acceptance zone,” it writes 0.0102 as the target. Once you see the post, and then keep staring at the old price levels, it’s easy to miss the recent volume surge pushing up—and then the pullback. Now you need to tell whether the bid has actually retreated, or whether it’s just pausing for an hour.
As of 19:00 Beijing time, on Binance spot BIGTIME/USDT, the 17:00 hour has completed the hourly candle, closing at 0.00944, with about 11.46 million coins traded. The 18:00 candle pulled back to close at 0.00933, with volume dropping to about 4.53 million. From the open at 16:00 to the close at 18:00, it rose about 2.1%, while BTC was up about 0.2% over the same period. The pullback volume was smaller than the surge volume, and the close still remained above the 16:00 opening level.
Looking at 19:00–23:00, the short-term bias is bullish. The reason is that after the volume-driven surge, the pullback hasn’t yet swallowed the gains. If, during this period, there is a completed 1-hour K-line that closes below the 18:00 low of 0.00926, then this assessment will no longer hold. 0.00926 is only the test level for this move—not a long-term support. The old target can’t replace the new closing price.
BIGTIME hot post: while calling 0.0088–0.0092 the “order-acceptance zone,” it writes 0.0102 as the target. Once you see the post, and then keep staring at the old price levels, it’s easy to miss the recent volume surge pushing up—and then the pullback. Now you need to tell whether the bid has actually retreated, or whether it’s just pausing for an hour.
As of 19:00 Beijing time, on Binance spot BIGTIME/USDT, the 17:00 hour has completed the hourly candle, closing at 0.00944, with about 11.46 million coins traded. The 18:00 candle pulled back to close at 0.00933, with volume dropping to about 4.53 million. From the open at 16:00 to the close at 18:00, it rose about 2.1%, while BTC was up about 0.2% over the same period. The pullback volume was smaller than the surge volume, and the close still remained above the 16:00 opening level.
Looking at 19:00–23:00, the short-term bias is bullish. The reason is that after the volume-driven surge, the pullback hasn’t yet swallowed the gains. If, during this period, there is a completed 1-hour K-line that closes below the 18:00 low of 0.00926, then this assessment will no longer hold. 0.00926 is only the test level for this move—not a long-term support. The old target can’t replace the new closing price.
As of 19:00 Beijing time, on Binance spot BIGTIME/USDT, the 17:00 hour has completed the hourly candle, closing at 0.00944, with about 11.46 million coins traded. The 18:00 candle pulled back to close at 0.00933, with volume dropping to about 4.53 million. From the open at 16:00 to the close at 18:00, it rose about 2.1%, while BTC was up about 0.2% over the same period. The pullback volume was smaller than the surge volume, and the close still remained above the 16:00 opening level.
Looking at 19:00–23:00, the short-term bias is bullish. The reason is that after the volume-driven surge, the pullback hasn’t yet swallowed the gains. If, during this period, there is a completed 1-hour K-line that closes below the 18:00 low of 0.00926, then this assessment will no longer hold. 0.00926 is only the test level for this move—not a long-term support. The old target can’t replace the new closing price.
58
·
--
“Bought” SHIB—“Exchange reserves back to 880 trillion; selling pressure is coming.” People with heavy positions may easily treat it like a countdown to selling. If tokens are transferred into an exchange, it only means the storage location has changed; it has not yet become a spot sell order. That hot post didn’t provide the data platform, which exchanges are covered, or the statistical time window—so this figure can’t be independently verified.
On-chain reserve statistics rely on identifying exchange wallets. Address label updates and wallet reallocations can all rewrite the displayed balances; those transferring in may not necessarily be preparing to sell immediately. Even Glassnode, which does this kind of data work, notes that exchange balances may miss some addresses, and historical numbers may be revised as labels get updated.
If you’re truly worried about selling pressure, first find the original data and the time convention, then check whether SHIB spot trading activity and price weaken during the same period. Without these two steps, “reserves increasing = will drop within two hours” is just speculation. Don’t let a chart with no source determine your position.
“Bought” SHIB—“Exchange reserves back to 880 trillion; selling pressure is coming.” People with heavy positions may easily treat it like a countdown to selling. If tokens are transferred into an exchange, it only means the storage location has changed; it has not yet become a spot sell order. That hot post didn’t provide the data platform, which exchanges are covered, or the statistical time window—so this figure can’t be independently verified.
On-chain reserve statistics rely on identifying exchange wallets. Address label updates and wallet reallocations can all rewrite the displayed balances; those transferring in may not necessarily be preparing to sell immediately. Even Glassnode, which does this kind of data work, notes that exchange balances may miss some addresses, and historical numbers may be revised as labels get updated.
If you’re truly worried about selling pressure, first find the original data and the time convention, then check whether SHIB spot trading activity and price weaken during the same period. Without these two steps, “reserves increasing = will drop within two hours” is just speculation. Don’t let a chart with no source determine your position.
On-chain reserve statistics rely on identifying exchange wallets. Address label updates and wallet reallocations can all rewrite the displayed balances; those transferring in may not necessarily be preparing to sell immediately. Even Glassnode, which does this kind of data work, notes that exchange balances may miss some addresses, and historical numbers may be revised as labels get updated.
If you’re truly worried about selling pressure, first find the original data and the time convention, then check whether SHIB spot trading activity and price weaken during the same period. Without these two steps, “reserves increasing = will drop within two hours” is just speculation. Don’t let a chart with no source determine your position.
193
·
--
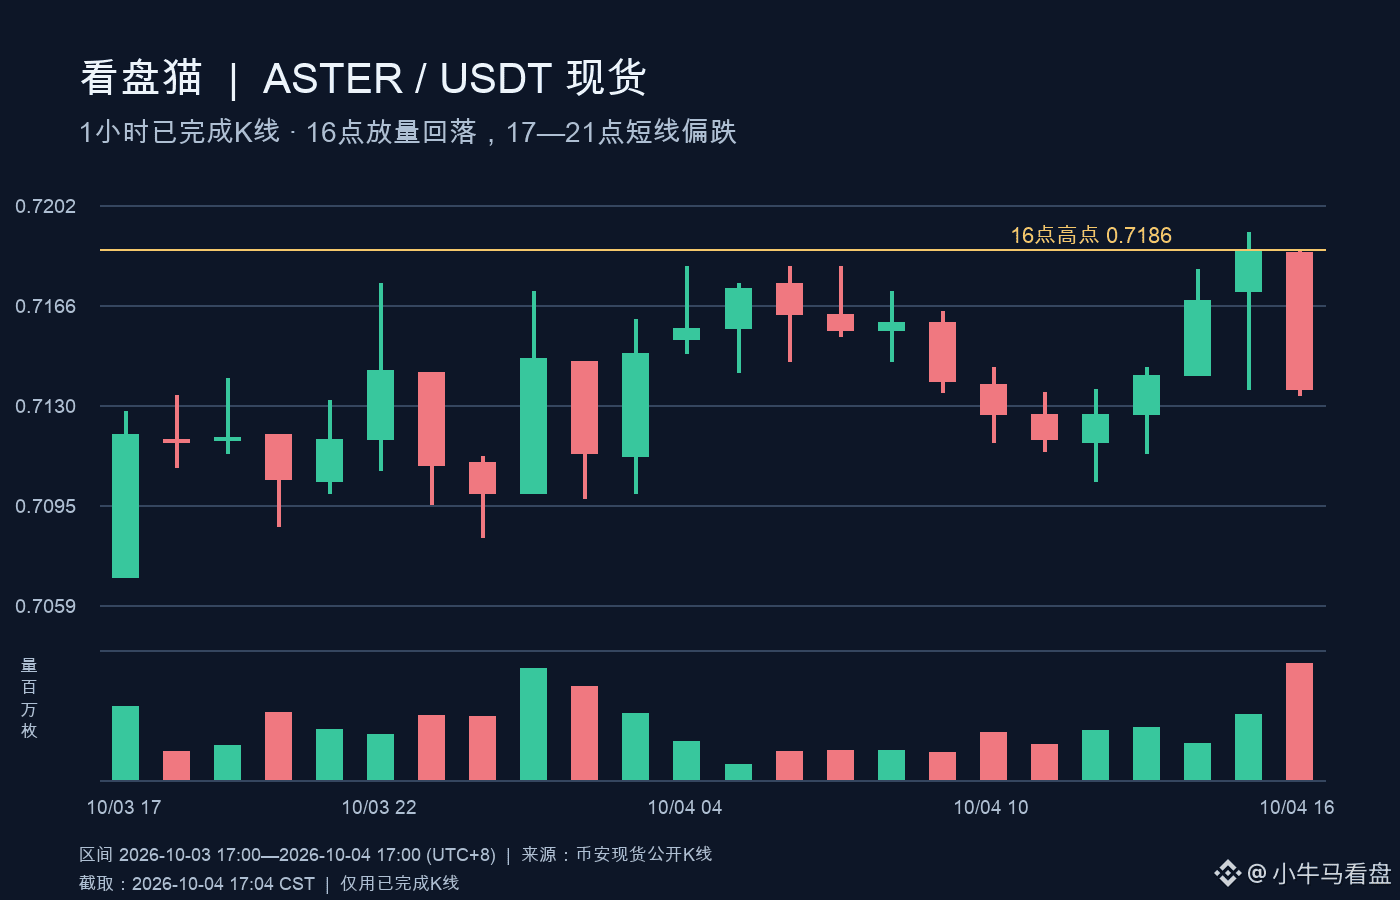
The same ASTER—out in the square, some people shout to short with high leverage, and others say, “The institution is accumulating.” Just pick the line you like, and you might easily miss that just-captured high-volume bearish candle. First, see what the trading has already left behind; then look at the slogans.
As of 17:00 Beijing time, on Binance spot ASTER/USDT, the 12:00–15:00 hourly candles closed after lifting from 0.7127 to 0.7186. But the 16:00 candle pulled back and closed at 0.7136, with about 1.13 million ASTR traded—1.8 times the roughly 640,000 from the previous hour. In the same period, BTC’s 16:00 hourly candle was nearly flat. The sell-side during this hour pushed most of the rebound back down; for now, there’s no sign of upward follow-through.
From 17:00 to 21:00, the short-term bias is slightly bearish. If, during that window, there’s a completed 1-hour K-line that closes back above 0.7186, then the bearish interpretation would be invalid. That would just mean the 16:00 K-line’s high was reclaimed—not a long-term ceiling. Before you watch other people’s take-profit targets, first check whether the next candle’s close can recapture the spot that was just lost. Don’t use an old script to decide what’s happening in the live chart.
The same ASTER—out in the square, some people shout to short with high leverage, and others say, “The institution is accumulating.” Just pick the line you like, and you might easily miss that just-captured high-volume bearish candle. First, see what the trading has already left behind; then look at the slogans.
As of 17:00 Beijing time, on Binance spot ASTER/USDT, the 12:00–15:00 hourly candles closed after lifting from 0.7127 to 0.7186. But the 16:00 candle pulled back and closed at 0.7136, with about 1.13 million ASTR traded—1.8 times the roughly 640,000 from the previous hour. In the same period, BTC’s 16:00 hourly candle was nearly flat. The sell-side during this hour pushed most of the rebound back down; for now, there’s no sign of upward follow-through.
From 17:00 to 21:00, the short-term bias is slightly bearish. If, during that window, there’s a completed 1-hour K-line that closes back above 0.7186, then the bearish interpretation would be invalid. That would just mean the 16:00 K-line’s high was reclaimed—not a long-term ceiling. Before you watch other people’s take-profit targets, first check whether the next candle’s close can recapture the spot that was just lost. Don’t use an old script to decide what’s happening in the live chart.
As of 17:00 Beijing time, on Binance spot ASTER/USDT, the 12:00–15:00 hourly candles closed after lifting from 0.7127 to 0.7186. But the 16:00 candle pulled back and closed at 0.7136, with about 1.13 million ASTR traded—1.8 times the roughly 640,000 from the previous hour. In the same period, BTC’s 16:00 hourly candle was nearly flat. The sell-side during this hour pushed most of the rebound back down; for now, there’s no sign of upward follow-through.
From 17:00 to 21:00, the short-term bias is slightly bearish. If, during that window, there’s a completed 1-hour K-line that closes back above 0.7186, then the bearish interpretation would be invalid. That would just mean the 16:00 K-line’s high was reclaimed—not a long-term ceiling. Before you watch other people’s take-profit targets, first check whether the next candle’s close can recapture the spot that was just lost. Don’t use an old script to decide what’s happening in the live chart.
1
421
·
--
Getting “AAVE to set up a foundation” might lead people to assume the trademark, code, and so on have already been handed over to the community—maybe even that it’s being treated as a token so there’s instant extra revenue. But this proposal, for now, only outlines the first step: setting up a legal entity that can hold these assets.
In a governance proposal submitted on October 2, Aave Labs broke the work into phases. In the first phase, it would establish a non-member foundation, appoint independent directors and overseers; the transfer of the trademark, the main domain name, and the protocol code would happen later through separate governance processes. The proposal also states that the foundation would grant a free license of the brand name to be used for product development, while decisions about on-chain governance, parameters, and budget would still be made by token holders.
This distinction is very real for ordinary readers. Just because someone can hold and protect the protocol, trademark, and code doesn’t mean that anyone holding AAVE automatically gets a share of profits. To judge how things progress, first check whether the proposal passes, then verify that the assets genuinely get transferred and that permissions are executed according to the commitments—don’t treat “setting up a safe” as “the contents of the safe have already arrived.”
Getting “AAVE to set up a foundation” might lead people to assume the trademark, code, and so on have already been handed over to the community—maybe even that it’s being treated as a token so there’s instant extra revenue. But this proposal, for now, only outlines the first step: setting up a legal entity that can hold these assets.
In a governance proposal submitted on October 2, Aave Labs broke the work into phases. In the first phase, it would establish a non-member foundation, appoint independent directors and overseers; the transfer of the trademark, the main domain name, and the protocol code would happen later through separate governance processes. The proposal also states that the foundation would grant a free license of the brand name to be used for product development, while decisions about on-chain governance, parameters, and budget would still be made by token holders.
This distinction is very real for ordinary readers. Just because someone can hold and protect the protocol, trademark, and code doesn’t mean that anyone holding AAVE automatically gets a share of profits. To judge how things progress, first check whether the proposal passes, then verify that the assets genuinely get transferred and that permissions are executed according to the commitments—don’t treat “setting up a safe” as “the contents of the safe have already arrived.”
In a governance proposal submitted on October 2, Aave Labs broke the work into phases. In the first phase, it would establish a non-member foundation, appoint independent directors and overseers; the transfer of the trademark, the main domain name, and the protocol code would happen later through separate governance processes. The proposal also states that the foundation would grant a free license of the brand name to be used for product development, while decisions about on-chain governance, parameters, and budget would still be made by token holders.
This distinction is very real for ordinary readers. Just because someone can hold and protect the protocol, trademark, and code doesn’t mean that anyone holding AAVE automatically gets a share of profits. To judge how things progress, first check whether the proposal passes, then verify that the assets genuinely get transferred and that permissions are executed according to the commitments—don’t treat “setting up a safe” as “the contents of the safe have already arrived.”
1
322
·
--
Seeing those AVAX long posts in the square, people gave several take-profit levels—yet the easiest thing to overlook is actually this: if price really reaches the first take-profit, why should the remaining position still be held?
In *Market Wizards*, trader Michael Marcus recalls that back then, during a surge in soybeans, he impulsively sold all his profitable positions; meanwhile, Ed Sekota, who worked in the same office, didn’t leave just because he’d made money—he waited for the trend to change. After that, soybeans kept hitting limit-ups for multiple trading days, and Marcus could only watch from outside. What he lost wasn’t just an on-paper drawdown; it was the gap/missed upside—the regret of exiting too early and staying sidelined.
This story doesn’t mean “never take profit.” For those watching AVAX right now, what’s more practical is to write out before entering: what portion will be taken off at each price level, and what conditions will guide you to exit the rest. If those conditions don’t appear, don’t let excitement or fear temporarily rewrite your plan for you. Have you ever sold once, only to realize you’d never actually decided what to do with the remaining position?
Seeing those AVAX long posts in the square, people gave several take-profit levels—yet the easiest thing to overlook is actually this: if price really reaches the first take-profit, why should the remaining position still be held?
In *Market Wizards*, trader Michael Marcus recalls that back then, during a surge in soybeans, he impulsively sold all his profitable positions; meanwhile, Ed Sekota, who worked in the same office, didn’t leave just because he’d made money—he waited for the trend to change. After that, soybeans kept hitting limit-ups for multiple trading days, and Marcus could only watch from outside. What he lost wasn’t just an on-paper drawdown; it was the gap/missed upside—the regret of exiting too early and staying sidelined.
This story doesn’t mean “never take profit.” For those watching AVAX right now, what’s more practical is to write out before entering: what portion will be taken off at each price level, and what conditions will guide you to exit the rest. If those conditions don’t appear, don’t let excitement or fear temporarily rewrite your plan for you. Have you ever sold once, only to realize you’d never actually decided what to do with the remaining position?
In *Market Wizards*, trader Michael Marcus recalls that back then, during a surge in soybeans, he impulsively sold all his profitable positions; meanwhile, Ed Sekota, who worked in the same office, didn’t leave just because he’d made money—he waited for the trend to change. After that, soybeans kept hitting limit-ups for multiple trading days, and Marcus could only watch from outside. What he lost wasn’t just an on-paper drawdown; it was the gap/missed upside—the regret of exiting too early and staying sidelined.
This story doesn’t mean “never take profit.” For those watching AVAX right now, what’s more practical is to write out before entering: what portion will be taken off at each price level, and what conditions will guide you to exit the rest. If those conditions don’t appear, don’t let excitement or fear temporarily rewrite your plan for you. Have you ever sold once, only to realize you’d never actually decided what to do with the remaining position?
285
·
--
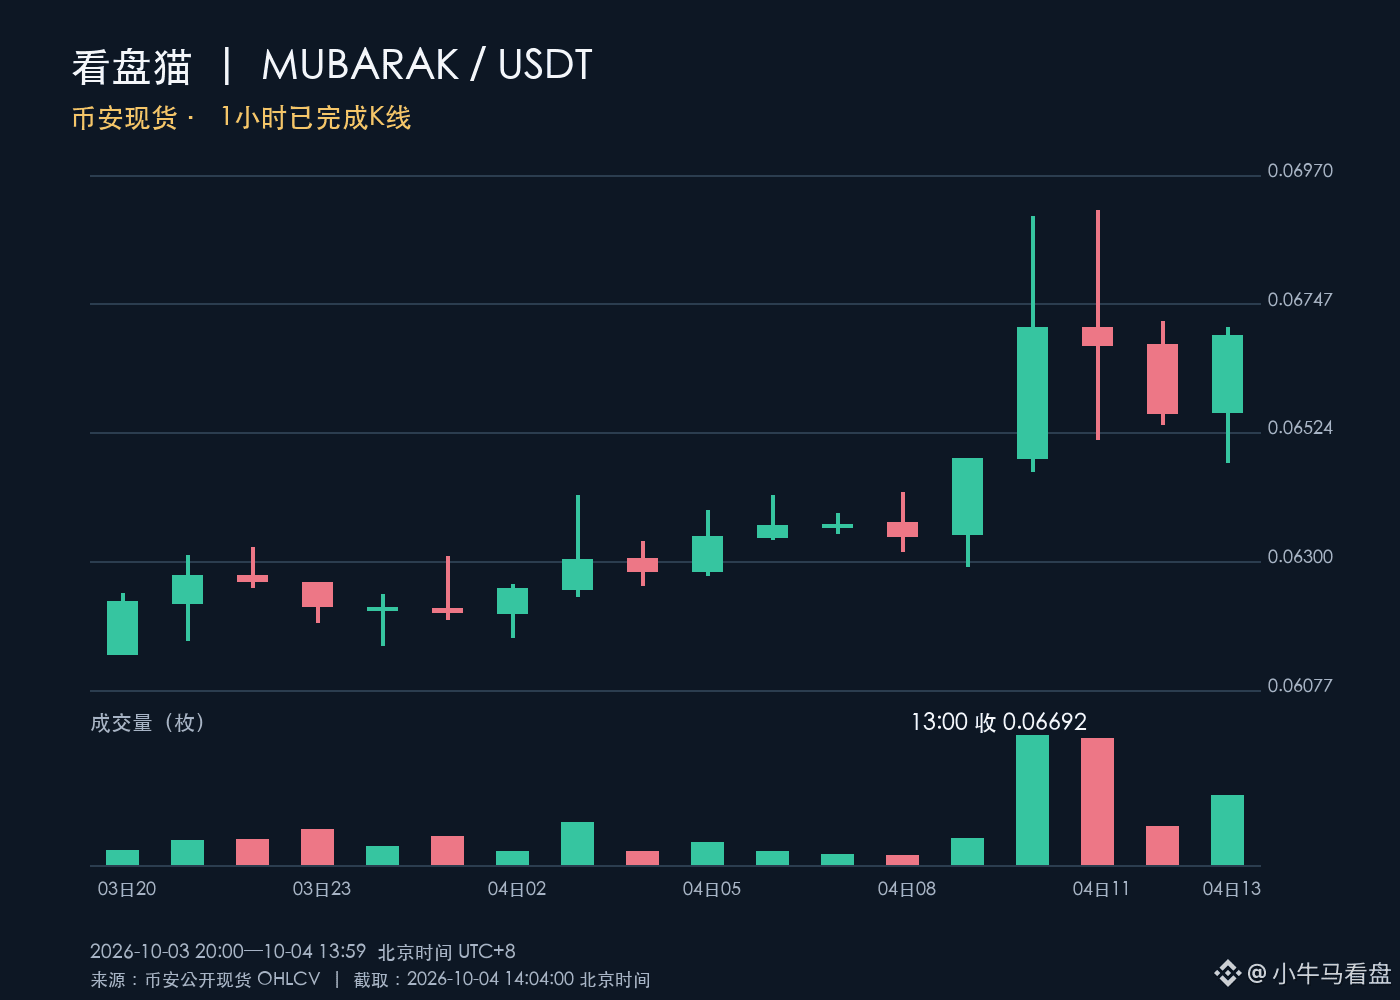
Caught “MUBARAK 0.069 will break through immediately” — it’s the easiest to treat a touch during the session as if the buy order has already stabilized. The entry zone suggested in the hot post is still 0.064—0.066; by the time you see it, both the price and the remaining room may have changed.
As of 14:00 Beijing time, for Binance spot, the 10 o’clock and 11 o’clock candles have each completed their hourly lines with approximately 16.61 million and 16.20 million coins traded, respectively. The 11 o’clock high was 0.06908, but it closed at 0.06674. The 12 o’clock candle fell back and closed at 0.06556. The 13 o’clock candle rebounded and closed at 0.06692, with about 8.82 million coins traded—only around half of the 11 o’clock level. During the same period, BTC was only slightly up; it’s still stronger than the broader market, but follow-through has not been restored.
To test the breakout, first check whether subsequent closes can hold. Then see whether volume can keep up. From 14:00 to 18:00 the short-term bias is bearish; if during that window there is a full hourly candle closing above 0.06715 with成交 (volume) exceeding the 8.82 million coins from the 13:00 candle, then this assessment would be invalid. 0.06715 is just the high of the 12 o’clock hourly candle, not a long-term resistance level.
Caught “MUBARAK 0.069 will break through immediately” — it’s the easiest to treat a touch during the session as if the buy order has already stabilized. The entry zone suggested in the hot post is still 0.064—0.066; by the time you see it, both the price and the remaining room may have changed.
As of 14:00 Beijing time, for Binance spot, the 10 o’clock and 11 o’clock candles have each completed their hourly lines with approximately 16.61 million and 16.20 million coins traded, respectively. The 11 o’clock high was 0.06908, but it closed at 0.06674. The 12 o’clock candle fell back and closed at 0.06556. The 13 o’clock candle rebounded and closed at 0.06692, with about 8.82 million coins traded—only around half of the 11 o’clock level. During the same period, BTC was only slightly up; it’s still stronger than the broader market, but follow-through has not been restored.
To test the breakout, first check whether subsequent closes can hold. Then see whether volume can keep up. From 14:00 to 18:00 the short-term bias is bearish; if during that window there is a full hourly candle closing above 0.06715 with成交 (volume) exceeding the 8.82 million coins from the 13:00 candle, then this assessment would be invalid. 0.06715 is just the high of the 12 o’clock hourly candle, not a long-term resistance level.
As of 14:00 Beijing time, for Binance spot, the 10 o’clock and 11 o’clock candles have each completed their hourly lines with approximately 16.61 million and 16.20 million coins traded, respectively. The 11 o’clock high was 0.06908, but it closed at 0.06674. The 12 o’clock candle fell back and closed at 0.06556. The 13 o’clock candle rebounded and closed at 0.06692, with about 8.82 million coins traded—only around half of the 11 o’clock level. During the same period, BTC was only slightly up; it’s still stronger than the broader market, but follow-through has not been restored.
To test the breakout, first check whether subsequent closes can hold. Then see whether volume can keep up. From 14:00 to 18:00 the short-term bias is bearish; if during that window there is a full hourly candle closing above 0.06715 with成交 (volume) exceeding the 8.82 million coins from the 13:00 candle, then this assessment would be invalid. 0.06715 is just the high of the 12 o’clock hourly candle, not a long-term resistance level.
333
·
--
See “SEC pauses crypto ETF review due to government shutdown,” don’t rush to treat it as a signal that a batch of new ETFs are collectively being delayed. That claim only holds if the U.S. government truly cut off funding starting October 1; otherwise, the idea that “over 90 applications are stuck” can’t be used to bet on the timing of the approvals.
On September 2, the U.S. signed a temporary appropriations law, extending federal agency funding through December 11. The White House Office of Management and Budget also released a funding plan starting October 1 on September 28. The SEC’s “funding lapse contingency plan” refers to what would happen if funds were cut off—not an announcement that operations have already stopped.
When watching a specific ETF, check the SEC’s official documents, its status of effectiveness, and the exchange listing announcements. The “shutdown countdown” in hot posts can’t replace the actual approval progress; using it as a catalyst to chase gains can easily lead you to buy into a nonexistent timeline.
See “SEC pauses crypto ETF review due to government shutdown,” don’t rush to treat it as a signal that a batch of new ETFs are collectively being delayed. That claim only holds if the U.S. government truly cut off funding starting October 1; otherwise, the idea that “over 90 applications are stuck” can’t be used to bet on the timing of the approvals.
On September 2, the U.S. signed a temporary appropriations law, extending federal agency funding through December 11. The White House Office of Management and Budget also released a funding plan starting October 1 on September 28. The SEC’s “funding lapse contingency plan” refers to what would happen if funds were cut off—not an announcement that operations have already stopped.
When watching a specific ETF, check the SEC’s official documents, its status of effectiveness, and the exchange listing announcements. The “shutdown countdown” in hot posts can’t replace the actual approval progress; using it as a catalyst to chase gains can easily lead you to buy into a nonexistent timeline.
On September 2, the U.S. signed a temporary appropriations law, extending federal agency funding through December 11. The White House Office of Management and Budget also released a funding plan starting October 1 on September 28. The SEC’s “funding lapse contingency plan” refers to what would happen if funds were cut off—not an announcement that operations have already stopped.
When watching a specific ETF, check the SEC’s official documents, its status of effectiveness, and the exchange listing announcements. The “shutdown countdown” in hot posts can’t replace the actual approval progress; using it as a catalyst to chase gains can easily lead you to buy into a nonexistent timeline.
51
·
--
“SEC allows crypto assets self-custody” gets a lot of attention. Some treat it as a new permission for ordinary wallets, while others immediately think about whether institutions are about to buy coins. The first thing to clarify isn’t how big the potential upside is, but who is controlling whose money.
What the U.S. SEC proposed on October 1 is a revision to custody rules for registered investment advisers and regulated funds: under certain conditions, those entities may self-custody crypto assets, or consider using state trust companies. It’s still a proposal—there’s a public comment period calculated from the date the notice is published in the Federal Register. The rules do not take effect the moment the hot thread goes up, and they don’t require ordinary coin holders to switch wallets.
For everyday readers, what’s truly useful is to look at who will actually manage the private keys for future specific products, and how customers’ assets will be protected—not to directly translate “self-custody” into “institutional funds have already entered the market.” Clearer custody pathways and new buy-side demand are two different things. Verify who the rules apply to and what the final requirements are, then discuss what (if anything) it means for coin holders’ decisions.
“SEC allows crypto assets self-custody” gets a lot of attention. Some treat it as a new permission for ordinary wallets, while others immediately think about whether institutions are about to buy coins. The first thing to clarify isn’t how big the potential upside is, but who is controlling whose money.
What the U.S. SEC proposed on October 1 is a revision to custody rules for registered investment advisers and regulated funds: under certain conditions, those entities may self-custody crypto assets, or consider using state trust companies. It’s still a proposal—there’s a public comment period calculated from the date the notice is published in the Federal Register. The rules do not take effect the moment the hot thread goes up, and they don’t require ordinary coin holders to switch wallets.
For everyday readers, what’s truly useful is to look at who will actually manage the private keys for future specific products, and how customers’ assets will be protected—not to directly translate “self-custody” into “institutional funds have already entered the market.” Clearer custody pathways and new buy-side demand are two different things. Verify who the rules apply to and what the final requirements are, then discuss what (if anything) it means for coin holders’ decisions.
What the U.S. SEC proposed on October 1 is a revision to custody rules for registered investment advisers and regulated funds: under certain conditions, those entities may self-custody crypto assets, or consider using state trust companies. It’s still a proposal—there’s a public comment period calculated from the date the notice is published in the Federal Register. The rules do not take effect the moment the hot thread goes up, and they don’t require ordinary coin holders to switch wallets.
For everyday readers, what’s truly useful is to look at who will actually manage the private keys for future specific products, and how customers’ assets will be protected—not to directly translate “self-custody” into “institutional funds have already entered the market.” Clearer custody pathways and new buy-side demand are two different things. Verify who the rules apply to and what the final requirements are, then discuss what (if anything) it means for coin holders’ decisions.
1
76
·
--
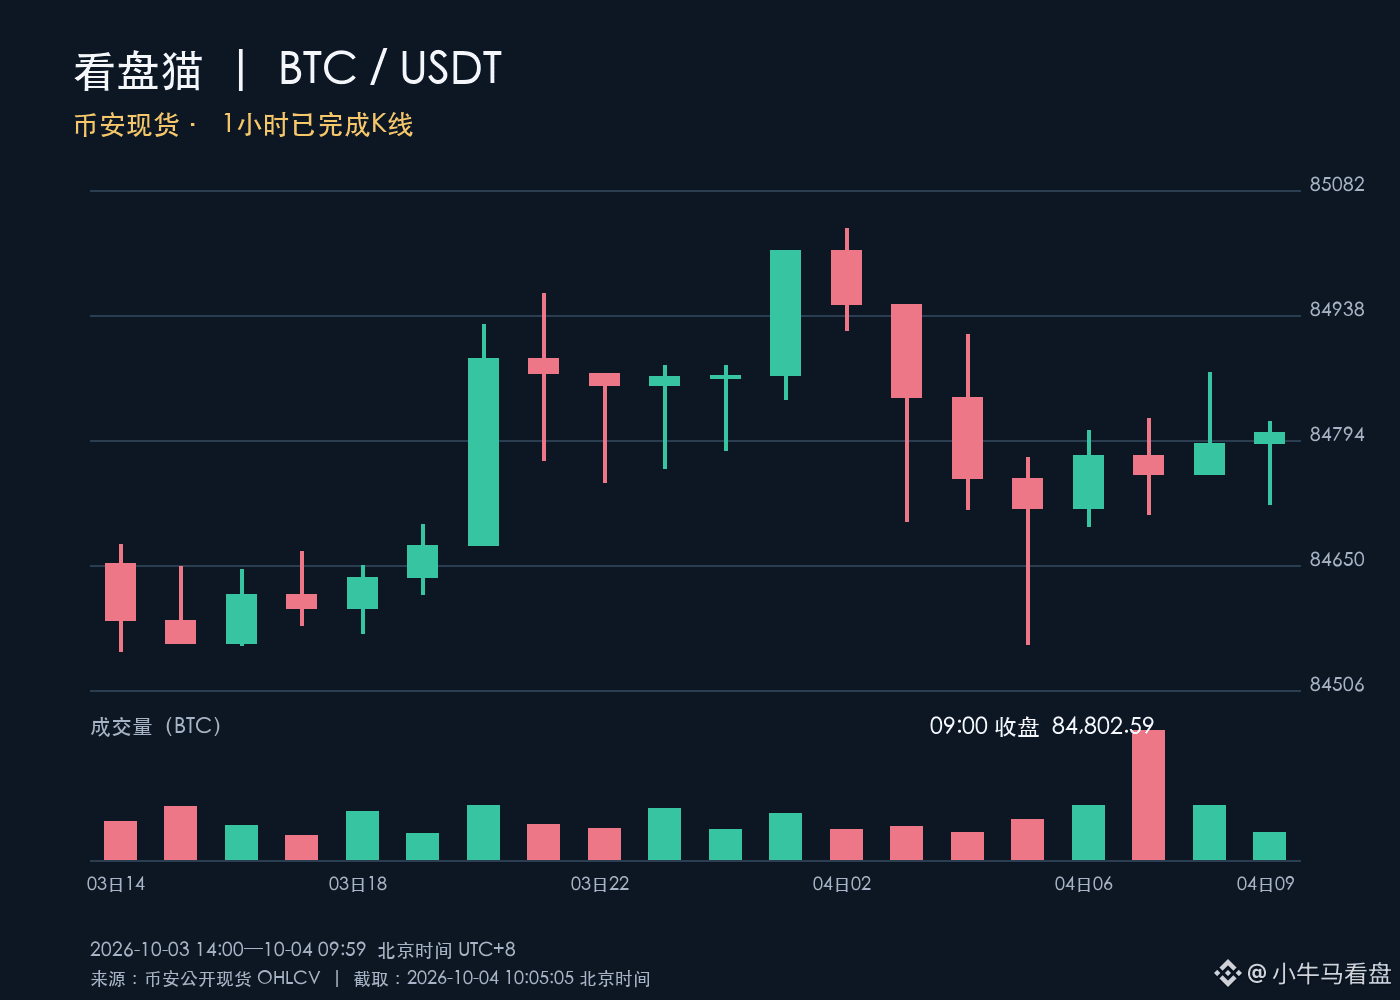
After BTC touched 87,000+ USD and pulled back last night, today some people are treating 84,800 as “a sufficient drop,” while others think that if the attempt to push higher failed, the price should continue falling. The easiest thing to misread is this: a sudden spike in intraday trading volume doesn’t necessarily mean someone is catching the downside.
As of 10:00 Beijing time on October 4, Binance spot BTC/USDT’s 09:00 hourly candle closed at $84,802.59, below the $85,012.01 opening at 02:00. The 07:00 hour saw about 919 BTC traded—by far the busiest of the past few hours—but the close slid from $84,776.02 down to $84,753.56. Over the next two hours combined, roughly 576 BTC changed hands, and the price only rebounded slightly. After the flurry, the closing price still hadn’t returned to the 02:00 opening level.
From 10:00 to 14:00, the short-term bias is slightly bearish. The reasons are the reduced rebound volume and the fact that the price still hasn’t reclaimed the early-morning drop. If, before 14:00, a completed 1-hour candle closes at $85,037.63, then this judgment will no longer hold. That $85,037.63 is the high of the 02:00 hour—use it only as a checkpoint for this particular stretch of price action; don’t use last night’s needle tip to decide today’s close.
After BTC touched 87,000+ USD and pulled back last night, today some people are treating 84,800 as “a sufficient drop,” while others think that if the attempt to push higher failed, the price should continue falling. The easiest thing to misread is this: a sudden spike in intraday trading volume doesn’t necessarily mean someone is catching the downside.
As of 10:00 Beijing time on October 4, Binance spot BTC/USDT’s 09:00 hourly candle closed at $84,802.59, below the $85,012.01 opening at 02:00. The 07:00 hour saw about 919 BTC traded—by far the busiest of the past few hours—but the close slid from $84,776.02 down to $84,753.56. Over the next two hours combined, roughly 576 BTC changed hands, and the price only rebounded slightly. After the flurry, the closing price still hadn’t returned to the 02:00 opening level.
From 10:00 to 14:00, the short-term bias is slightly bearish. The reasons are the reduced rebound volume and the fact that the price still hasn’t reclaimed the early-morning drop. If, before 14:00, a completed 1-hour candle closes at $85,037.63, then this judgment will no longer hold. That $85,037.63 is the high of the 02:00 hour—use it only as a checkpoint for this particular stretch of price action; don’t use last night’s needle tip to decide today’s close.
As of 10:00 Beijing time on October 4, Binance spot BTC/USDT’s 09:00 hourly candle closed at $84,802.59, below the $85,012.01 opening at 02:00. The 07:00 hour saw about 919 BTC traded—by far the busiest of the past few hours—but the close slid from $84,776.02 down to $84,753.56. Over the next two hours combined, roughly 576 BTC changed hands, and the price only rebounded slightly. After the flurry, the closing price still hadn’t returned to the 02:00 opening level.
From 10:00 to 14:00, the short-term bias is slightly bearish. The reasons are the reduced rebound volume and the fact that the price still hasn’t reclaimed the early-morning drop. If, before 14:00, a completed 1-hour candle closes at $85,037.63, then this judgment will no longer hold. That $85,037.63 is the high of the 02:00 hour—use it only as a checkpoint for this particular stretch of price action; don’t use last night’s needle tip to decide today’s close.
227
·
--
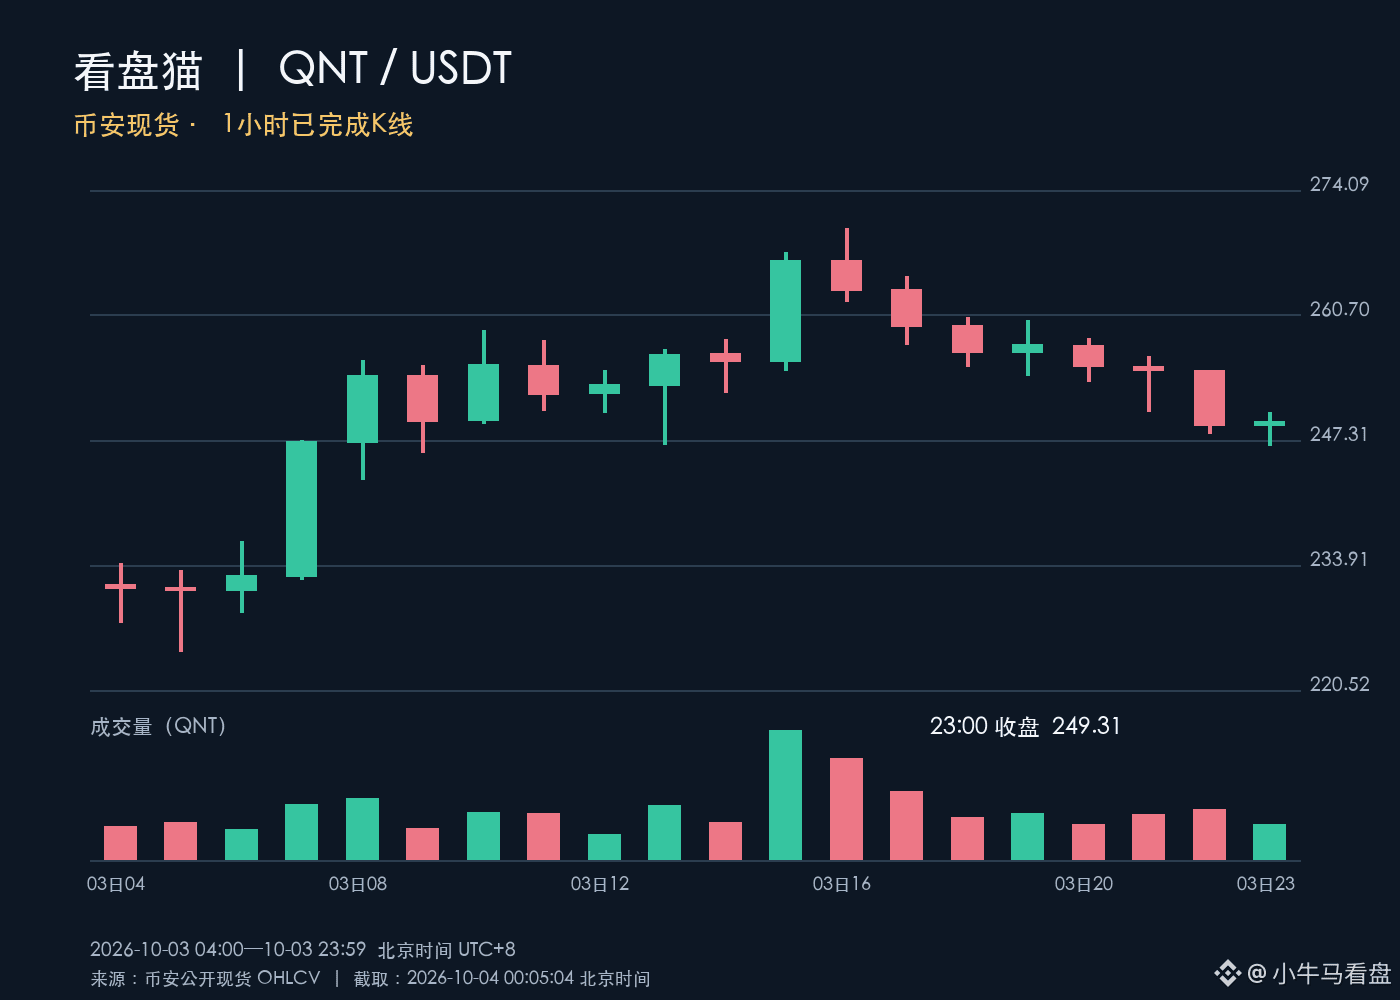
In QNT-related discussions, some people ask whether the 305 entry price can still hold up; others call 245—250 a “pickup of multiple zones.” After a sharp drop, the first minor rebound is very tempting, but whether it can absorb the sell orders before it matters more than “how much it has already fallen.”
On Binance spot market time (Beijing time) from 22:00 to 23:00, QNT fell from $254.74 to $248.81, with about 10.4k coins traded. Then from 23:00 to 24:00, the high reached only $250.30, closing at $249.31, and trading volume dropped to about 7,452 coins. In the same period, BTC basically moved sideways. Even after the small rebound, the closing price of QNT still didn’t return to the lowest point of the 21:00 hourly line at $250.34, let alone confirm that the selling had ended.
Looking at the next day from 00:00 to 04:00, the short-term bias is temporarily bearish: the hours during which it fell had higher trading volume than the rebound hours, and the price also remained below the pre-drop range. If, before 04:00, there is a completed 1-hour K-line close above the 22:00 high at $254.76, then this judgment would be invalidated. The 305 buy price is your personal cost, not a reason the market will come back to rescue you.
In QNT-related discussions, some people ask whether the 305 entry price can still hold up; others call 245—250 a “pickup of multiple zones.” After a sharp drop, the first minor rebound is very tempting, but whether it can absorb the sell orders before it matters more than “how much it has already fallen.”
On Binance spot market time (Beijing time) from 22:00 to 23:00, QNT fell from $254.74 to $248.81, with about 10.4k coins traded. Then from 23:00 to 24:00, the high reached only $250.30, closing at $249.31, and trading volume dropped to about 7,452 coins. In the same period, BTC basically moved sideways. Even after the small rebound, the closing price of QNT still didn’t return to the lowest point of the 21:00 hourly line at $250.34, let alone confirm that the selling had ended.
Looking at the next day from 00:00 to 04:00, the short-term bias is temporarily bearish: the hours during which it fell had higher trading volume than the rebound hours, and the price also remained below the pre-drop range. If, before 04:00, there is a completed 1-hour K-line close above the 22:00 high at $254.76, then this judgment would be invalidated. The 305 buy price is your personal cost, not a reason the market will come back to rescue you.
On Binance spot market time (Beijing time) from 22:00 to 23:00, QNT fell from $254.74 to $248.81, with about 10.4k coins traded. Then from 23:00 to 24:00, the high reached only $250.30, closing at $249.31, and trading volume dropped to about 7,452 coins. In the same period, BTC basically moved sideways. Even after the small rebound, the closing price of QNT still didn’t return to the lowest point of the 21:00 hourly line at $250.34, let alone confirm that the selling had ended.
Looking at the next day from 00:00 to 04:00, the short-term bias is temporarily bearish: the hours during which it fell had higher trading volume than the rebound hours, and the price also remained below the pre-drop range. If, before 04:00, there is a completed 1-hour K-line close above the 22:00 high at $254.76, then this judgment would be invalidated. The 305 buy price is your personal cost, not a reason the market will come back to rescue you.
529
·
--
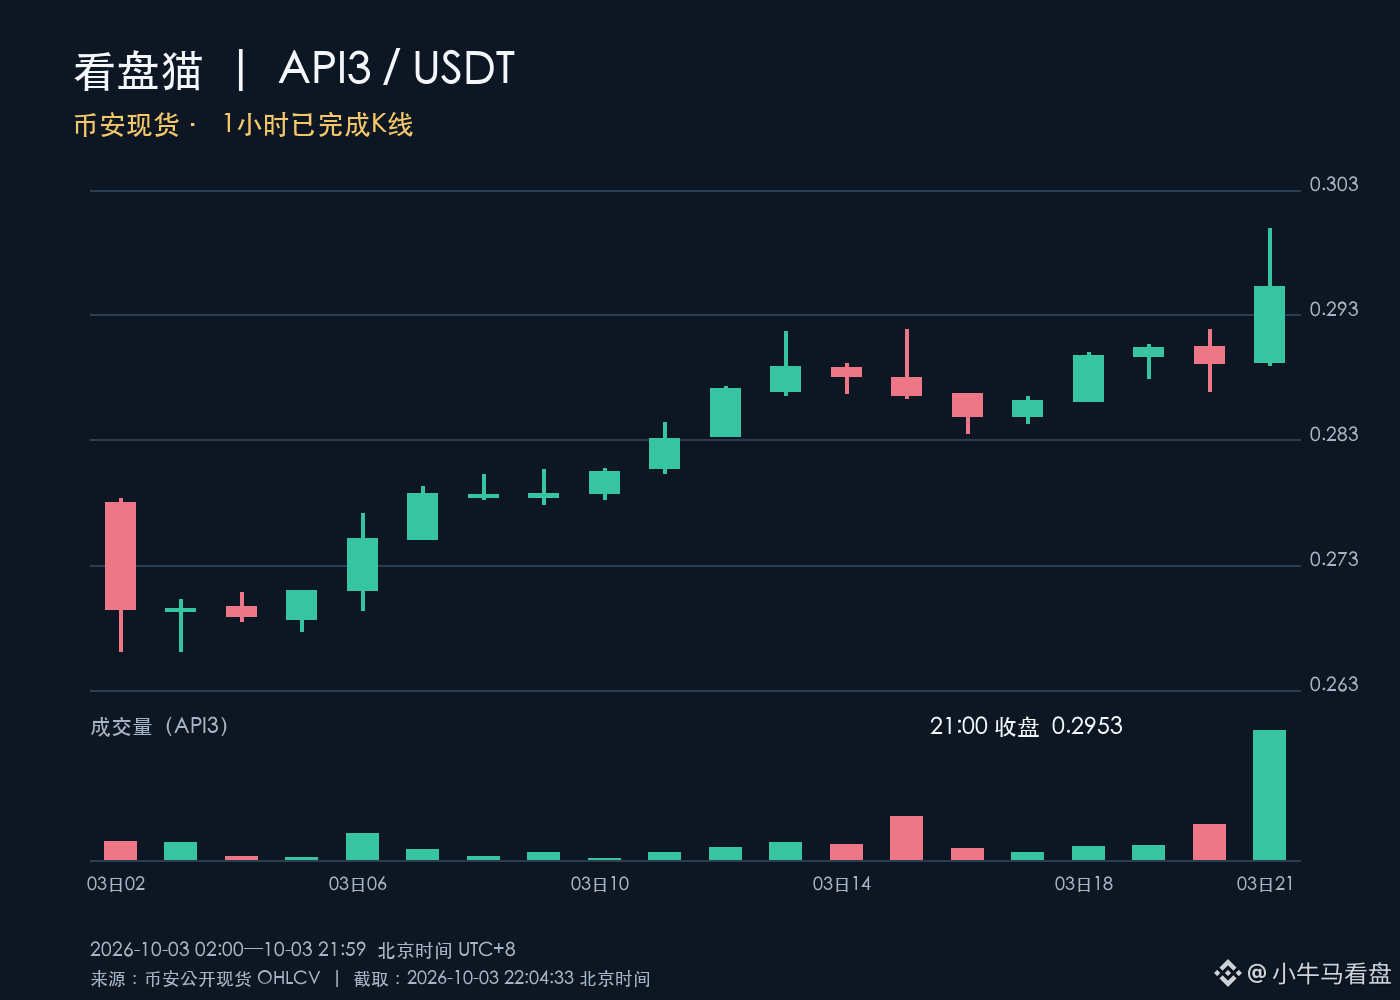
API3 just surged to 0.30, and some people are shouting “breakout,” while others are saying “the rebound is over.” With this kind of disagreement, don’t just focus on that one highest price: intraday pushing up and closing to hold are two different things.
That completed 1-hour K-line on Binance Spot, Beijing time 21:00–22:00, has a high of 0.3000 and closed at 0.2953. The trading volume is about 1.38 million coins, which is 3.7 times the roughly 370,000 coins in the previous hour. It closed above the previous hour’s high of 0.2919, while Bitcoin during the same period was nearly flat. API3 is stronger than the overall market, but the long upper wick shows that there are still sellers near 0.30. Bigger volume doesn’t mean there’s no resistance overhead.
For the next 4 hours, the bias is temporarily bullish. The reason is that after the volume spike, the close still remains above the previous hour’s high. If, by before 02:00 Beijing time the next day, any completed 1-hour K-line closes back below 0.2919, then this short-term judgment is invalid. Whether to chase that spike first depends on whether it can hold at the close—this is more useful than watching intraday wick spikes.
API3 just surged to 0.30, and some people are shouting “breakout,” while others are saying “the rebound is over.” With this kind of disagreement, don’t just focus on that one highest price: intraday pushing up and closing to hold are two different things.
That completed 1-hour K-line on Binance Spot, Beijing time 21:00–22:00, has a high of 0.3000 and closed at 0.2953. The trading volume is about 1.38 million coins, which is 3.7 times the roughly 370,000 coins in the previous hour. It closed above the previous hour’s high of 0.2919, while Bitcoin during the same period was nearly flat. API3 is stronger than the overall market, but the long upper wick shows that there are still sellers near 0.30. Bigger volume doesn’t mean there’s no resistance overhead.
For the next 4 hours, the bias is temporarily bullish. The reason is that after the volume spike, the close still remains above the previous hour’s high. If, by before 02:00 Beijing time the next day, any completed 1-hour K-line closes back below 0.2919, then this short-term judgment is invalid. Whether to chase that spike first depends on whether it can hold at the close—this is more useful than watching intraday wick spikes.
That completed 1-hour K-line on Binance Spot, Beijing time 21:00–22:00, has a high of 0.3000 and closed at 0.2953. The trading volume is about 1.38 million coins, which is 3.7 times the roughly 370,000 coins in the previous hour. It closed above the previous hour’s high of 0.2919, while Bitcoin during the same period was nearly flat. API3 is stronger than the overall market, but the long upper wick shows that there are still sellers near 0.30. Bigger volume doesn’t mean there’s no resistance overhead.
For the next 4 hours, the bias is temporarily bullish. The reason is that after the volume spike, the close still remains above the previous hour’s high. If, by before 02:00 Beijing time the next day, any completed 1-hour K-line closes back below 0.2919, then this short-term judgment is invalid. Whether to chase that spike first depends on whether it can hold at the close—this is more useful than watching intraday wick spikes.
131
·
--
Seeing “PEPE spot ETF re-file,” some people have already started calculating how much institutional capital might buy the coin. But even now, the exact figure—how much PEPE will be bought when the fund opens—has not been determined; using the application documents as a spot order makes it easy to track the wrong rationale.
On October 2, the U.S. SEC received a revised version submitted before it became effective. The filing states that BitGo would hold the PEPE, and that the net asset value would be calculated by reference to CoinDesk prices; however, the purchase date, quantity, and amount for the first tranche of shares are still left blank, and the listing ticker and management fee rate are also not filled in. The cover page also says: before the registration statement becomes effective, the shares cannot be sold. Even after filling in the service provider’s name, there are still a few steps before the real funds arrive.
This does not mean the application will definitely fail, nor does it mean PEPE will inevitably fall next. The more useful sequence for holders is: first check whether the registration statement is effective and whether the product is listed; then check whether the fund’s actual holdings increase. What can be confirmed today is that the issuer is moving the paperwork forward; what cannot be confirmed is the size of new buying. Don’t treat “getting ready to open a store” as “customers have already queued up to pay.”
Seeing “PEPE spot ETF re-file,” some people have already started calculating how much institutional capital might buy the coin. But even now, the exact figure—how much PEPE will be bought when the fund opens—has not been determined; using the application documents as a spot order makes it easy to track the wrong rationale.
On October 2, the U.S. SEC received a revised version submitted before it became effective. The filing states that BitGo would hold the PEPE, and that the net asset value would be calculated by reference to CoinDesk prices; however, the purchase date, quantity, and amount for the first tranche of shares are still left blank, and the listing ticker and management fee rate are also not filled in. The cover page also says: before the registration statement becomes effective, the shares cannot be sold. Even after filling in the service provider’s name, there are still a few steps before the real funds arrive.
This does not mean the application will definitely fail, nor does it mean PEPE will inevitably fall next. The more useful sequence for holders is: first check whether the registration statement is effective and whether the product is listed; then check whether the fund’s actual holdings increase. What can be confirmed today is that the issuer is moving the paperwork forward; what cannot be confirmed is the size of new buying. Don’t treat “getting ready to open a store” as “customers have already queued up to pay.”
On October 2, the U.S. SEC received a revised version submitted before it became effective. The filing states that BitGo would hold the PEPE, and that the net asset value would be calculated by reference to CoinDesk prices; however, the purchase date, quantity, and amount for the first tranche of shares are still left blank, and the listing ticker and management fee rate are also not filled in. The cover page also says: before the registration statement becomes effective, the shares cannot be sold. Even after filling in the service provider’s name, there are still a few steps before the real funds arrive.
This does not mean the application will definitely fail, nor does it mean PEPE will inevitably fall next. The more useful sequence for holders is: first check whether the registration statement is effective and whether the product is listed; then check whether the fund’s actual holdings increase. What can be confirmed today is that the issuer is moving the paperwork forward; what cannot be confirmed is the size of new buying. Don’t treat “getting ready to open a store” as “customers have already queued up to pay.”

1
127
·
--
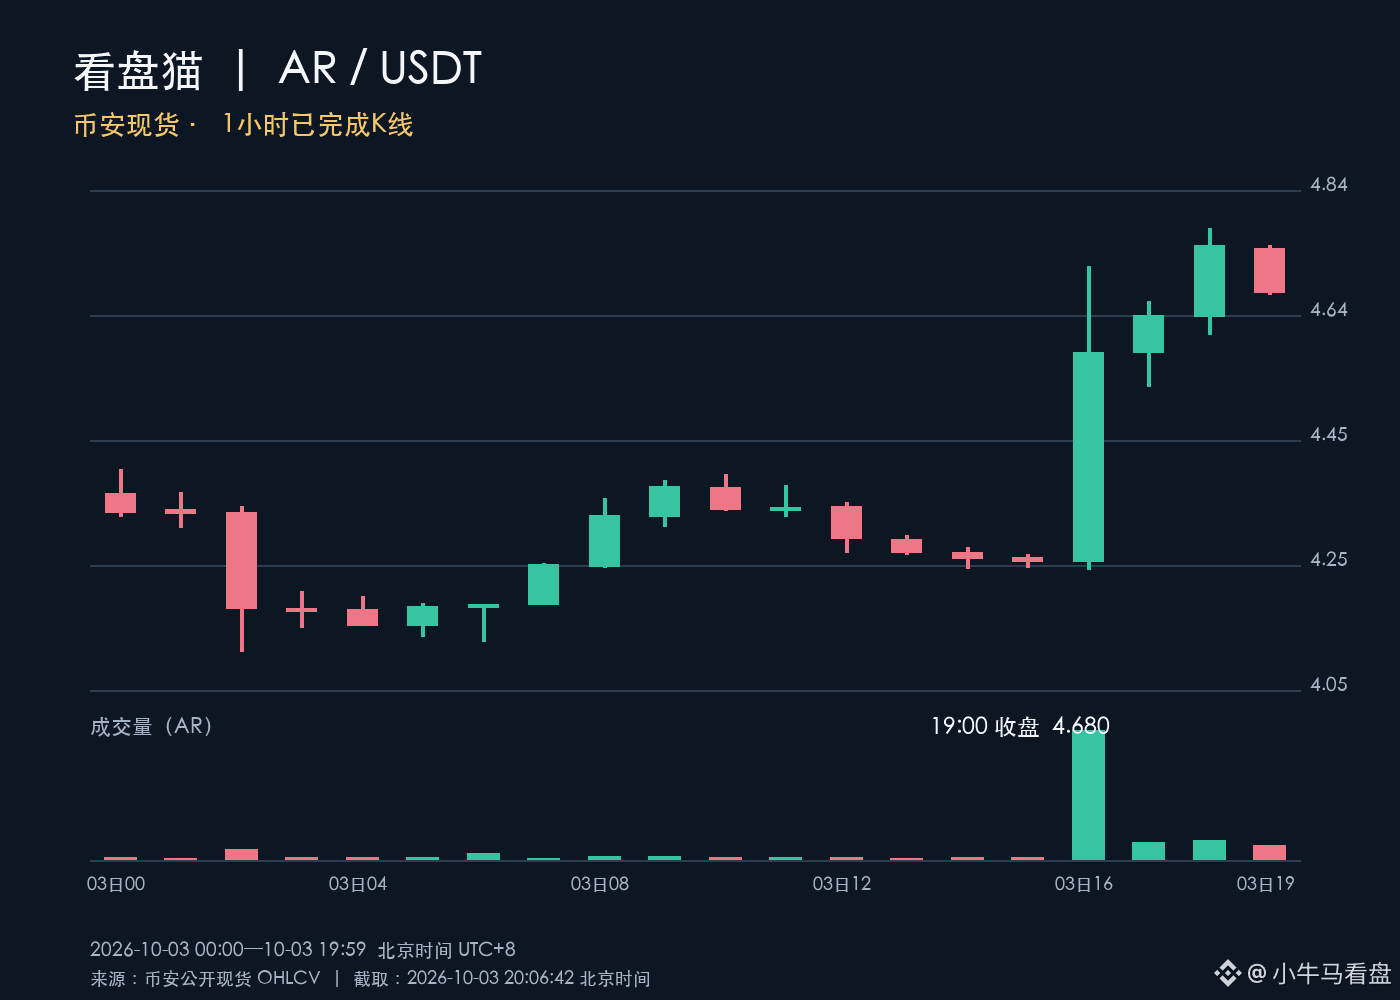
After AR surged hard for an hour, the hardest part is figuring out whether there’s truly someone taking it—or if it’s only the momentum from that one hour. On the square, some people are shouting about a breakout, while others worry that they’re just chasing the tail end; if you only watch the real-time jump in price, it’s easy to confuse the two.
As of 20:00 Beijing time, on Binance spot AR/USDT, the 16:00 hourly candle has completed at 4.585, with about 976,000 units traded. The 17:00 and 18:00 candles continued rising to 4.643 and 4.753, but volume shrank to roughly 131,000 and 149,000 units, respectively. At 19:00 it pulled back and closed at 4.680, with about 110,000 units traded. During the same period, BTC was almost flat, so AR’s strength is mainly reflected in its own price.
When looking at the follow-through after an expansion-led rally, don’t just focus on that one massive launch candle: whether the price can hold and whether trading volume can keep up must be evaluated together. From 20:00 to 24:00 it is temporarily biased to the upside, provided that the completed hourly candles still close above 4.585; if any of them closes below it, the conclusion is invalid. Sudden large orders or news can quickly make this short-term read outdated.
After AR surged hard for an hour, the hardest part is figuring out whether there’s truly someone taking it—or if it’s only the momentum from that one hour. On the square, some people are shouting about a breakout, while others worry that they’re just chasing the tail end; if you only watch the real-time jump in price, it’s easy to confuse the two.
As of 20:00 Beijing time, on Binance spot AR/USDT, the 16:00 hourly candle has completed at 4.585, with about 976,000 units traded. The 17:00 and 18:00 candles continued rising to 4.643 and 4.753, but volume shrank to roughly 131,000 and 149,000 units, respectively. At 19:00 it pulled back and closed at 4.680, with about 110,000 units traded. During the same period, BTC was almost flat, so AR’s strength is mainly reflected in its own price.
When looking at the follow-through after an expansion-led rally, don’t just focus on that one massive launch candle: whether the price can hold and whether trading volume can keep up must be evaluated together. From 20:00 to 24:00 it is temporarily biased to the upside, provided that the completed hourly candles still close above 4.585; if any of them closes below it, the conclusion is invalid. Sudden large orders or news can quickly make this short-term read outdated.
As of 20:00 Beijing time, on Binance spot AR/USDT, the 16:00 hourly candle has completed at 4.585, with about 976,000 units traded. The 17:00 and 18:00 candles continued rising to 4.643 and 4.753, but volume shrank to roughly 131,000 and 149,000 units, respectively. At 19:00 it pulled back and closed at 4.680, with about 110,000 units traded. During the same period, BTC was almost flat, so AR’s strength is mainly reflected in its own price.
When looking at the follow-through after an expansion-led rally, don’t just focus on that one massive launch candle: whether the price can hold and whether trading volume can keep up must be evaluated together. From 20:00 to 24:00 it is temporarily biased to the upside, provided that the completed hourly candles still close above 4.585; if any of them closes below it, the conclusion is invalid. Sudden large orders or news can quickly make this short-term read outdated.
1
588
·
--
After BTC surged and then pulled back, some people in the plaza shouted, “Buy the dip here,” while others said, “If the direction is wrong, run immediately.” But when the market crashes sharply, between wanting to exit and actually being able to get a trade filled, there’s still the order book of the counterparty. A cotton trade Paul Tudor Jones made early in his career also cost him on exactly this point.
In his firsthand account in *Market Wizards*, he said that in 1979 he already held around 400 cotton futures long contracts, and he added two more orders of 100 contracts each. Once he realized his judgment was wrong, he immediately instructed his broker to sell; within one minute, the price hit the daily limit down. At that time, he only managed to sell 220 contracts. The next day, he sold the rest, but the execution prices for some of the contracts were another 4 cents lower than when he had realized his mistake. That one trade caused his managed account to lose roughly 60–70%.
This old story can’t be used to predict today’s BTC, but it does highlight a very real cost: the larger your position, the harder it is to fully get out at the price in your mind when there’s a sudden selloff. Think back to the last time you tried to stop out—how far off was the actual fill price from your intended level?
After BTC surged and then pulled back, some people in the plaza shouted, “Buy the dip here,” while others said, “If the direction is wrong, run immediately.” But when the market crashes sharply, between wanting to exit and actually being able to get a trade filled, there’s still the order book of the counterparty. A cotton trade Paul Tudor Jones made early in his career also cost him on exactly this point.
In his firsthand account in *Market Wizards*, he said that in 1979 he already held around 400 cotton futures long contracts, and he added two more orders of 100 contracts each. Once he realized his judgment was wrong, he immediately instructed his broker to sell; within one minute, the price hit the daily limit down. At that time, he only managed to sell 220 contracts. The next day, he sold the rest, but the execution prices for some of the contracts were another 4 cents lower than when he had realized his mistake. That one trade caused his managed account to lose roughly 60–70%.
This old story can’t be used to predict today’s BTC, but it does highlight a very real cost: the larger your position, the harder it is to fully get out at the price in your mind when there’s a sudden selloff. Think back to the last time you tried to stop out—how far off was the actual fill price from your intended level?
In his firsthand account in *Market Wizards*, he said that in 1979 he already held around 400 cotton futures long contracts, and he added two more orders of 100 contracts each. Once he realized his judgment was wrong, he immediately instructed his broker to sell; within one minute, the price hit the daily limit down. At that time, he only managed to sell 220 contracts. The next day, he sold the rest, but the execution prices for some of the contracts were another 4 cents lower than when he had realized his mistake. That one trade caused his managed account to lose roughly 60–70%.
This old story can’t be used to predict today’s BTC, but it does highlight a very real cost: the larger your position, the harder it is to fully get out at the price in your mind when there’s a sudden selloff. Think back to the last time you tried to stop out—how far off was the actual fill price from your intended level?
87
·
--
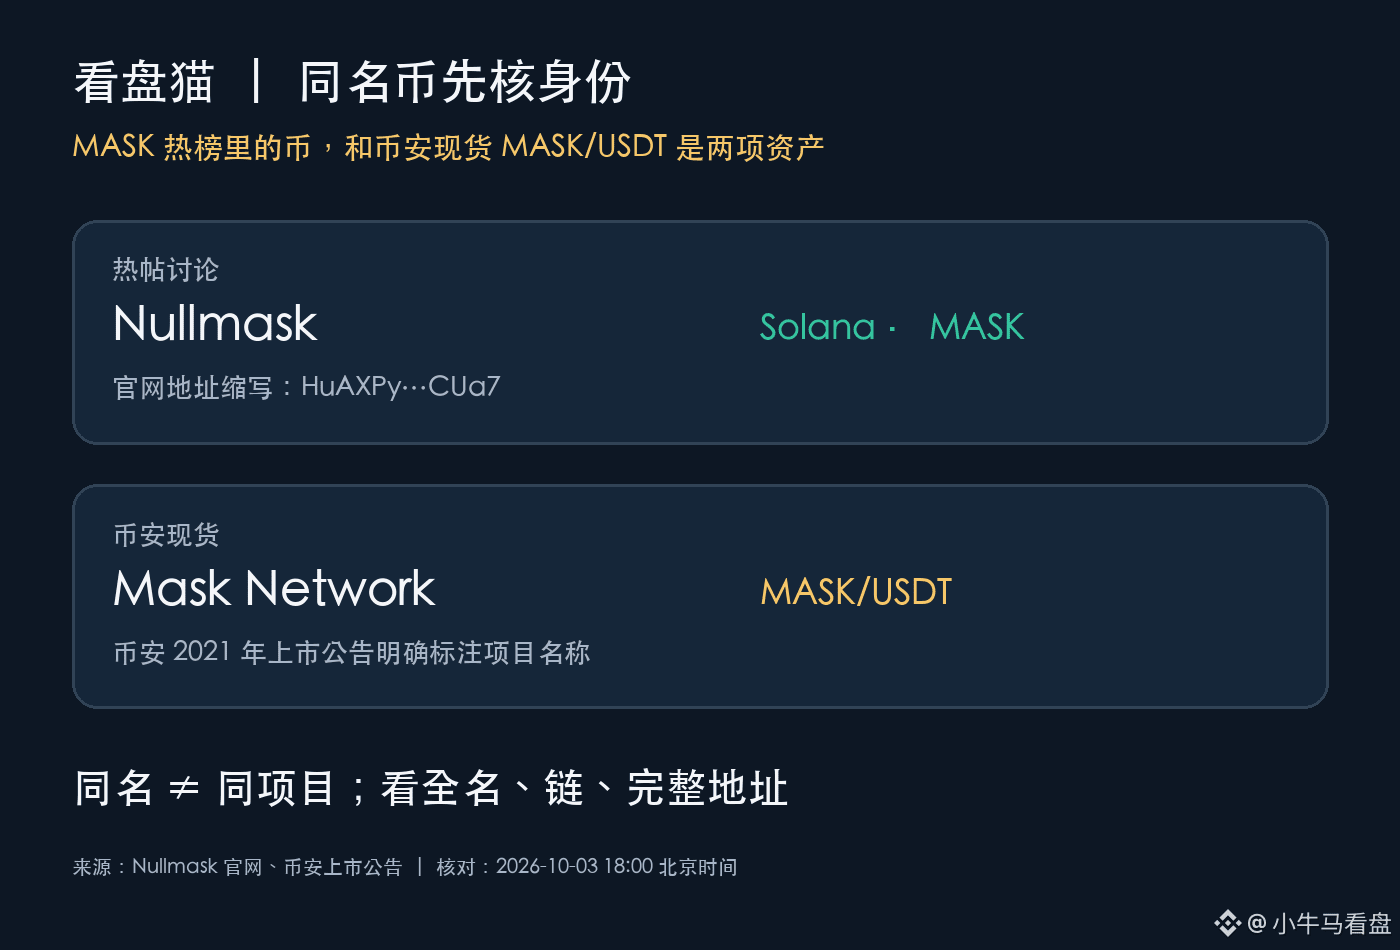
I saw “MASK market cap breaks through $35 million” and, in passing, I opened Binance to check the upside for MASK/USDT—maybe I got the coin wrong. The hot discussion is about Nullmask on Solana; however, MASK listed on Binance spot was launched as early as 2021 and is Mask Network. The same code doesn’t mean the same project.
On the Nullmask official website, the token is written as MASK and the address is abbreviated as HuAXPy…CUa7; Binance’s listing announcement clearly states Mask Network. There are posts on the forum that put this round of gains side by side with the social products of the long-established Mask Network. If readers only recognize the three-letter name, they may even misunderstand “who is pumping.”
When you see a hot coin with the same name, first verify the full project name, the chain it’s on, and the complete token address—then check what the trading page labels as the asset. The trending board can tell you what people are talking about, but it can’t confirm the counterparty for buying or selling. If the identities don’t match, then the subsequent assessments of price gains, liquidity, and risk also don’t hold.
I saw “MASK market cap breaks through $35 million” and, in passing, I opened Binance to check the upside for MASK/USDT—maybe I got the coin wrong. The hot discussion is about Nullmask on Solana; however, MASK listed on Binance spot was launched as early as 2021 and is Mask Network. The same code doesn’t mean the same project.
On the Nullmask official website, the token is written as MASK and the address is abbreviated as HuAXPy…CUa7; Binance’s listing announcement clearly states Mask Network. There are posts on the forum that put this round of gains side by side with the social products of the long-established Mask Network. If readers only recognize the three-letter name, they may even misunderstand “who is pumping.”
When you see a hot coin with the same name, first verify the full project name, the chain it’s on, and the complete token address—then check what the trading page labels as the asset. The trending board can tell you what people are talking about, but it can’t confirm the counterparty for buying or selling. If the identities don’t match, then the subsequent assessments of price gains, liquidity, and risk also don’t hold.
On the Nullmask official website, the token is written as MASK and the address is abbreviated as HuAXPy…CUa7; Binance’s listing announcement clearly states Mask Network. There are posts on the forum that put this round of gains side by side with the social products of the long-established Mask Network. If readers only recognize the three-letter name, they may even misunderstand “who is pumping.”
When you see a hot coin with the same name, first verify the full project name, the chain it’s on, and the complete token address—then check what the trading page labels as the asset. The trending board can tell you what people are talking about, but it can’t confirm the counterparty for buying or selling. If the identities don’t match, then the subsequent assessments of price gains, liquidity, and risk also don’t hold.
88
Log in to explore more content
Join global crypto users on Binance Square
⚡️ Get latest and useful information about crypto.
💬 Trusted by the world’s largest crypto exchange.
👍 Discover real insights from verified creators.
Email / Phone number
Trending Topics
Nikkei225Jumps2.5%ToThreeMonthHigh
538 views
98 Discussing
🔥 Nikkei Breaks Above 70,000!
Japan’s stock market just delivered a serious momentum signal. 🇯🇵📊
Nikkei surged 2.5%, powered by AI and semiconductor stocks, while weaker U.S. jobs data reduced expectations of another Fed hike.
Keep $BTC $ETH $BNB on your watchlist.
#nikkei225jumps2.5%tothreemonthhigh
CryptoMahibaloch
·0 Likes
·23 views
DriftHackVictimsBeginClaims
71,659 views
791 Discussing
SolanaTokenizedStockVolumeTops$4.4BInSeptember
7,664 views
82 Discussing