
Muanaz
114 Posts

Muanaz
Report
Block User
Open Trade
High-Frequency Trader
2.3 Years
7 Following
84 Followers
88 Liked
Posts
Portfolio
All
Quotes
·
--
Watch out for the market. There are buyers who entered from levels 68, 72, 76, and 81, so a rebound is possible. However, there’s nothing certain—follow liquidity, price movement, and risk management before making any decision.
#BTC☀️
Watch out for the market. There are buyers who entered from levels 68, 72, 76, and 81, so a rebound is possible. However, there’s nothing certain—follow liquidity, price movement, and risk management before making any decision.
#BTC☀️
#BTC☀️
1
188
·
--
#ETH
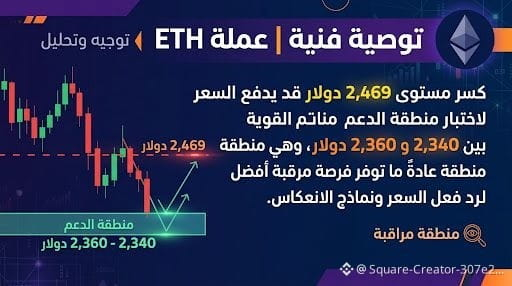
> Analyze $ETH > There is significant liquidity accumulated below the price at the following levels: > 2590$ - 2560$ - 2540$ - 2490$
> The current price is approaching this liquidity—meaning a break of the 2590$ area will open the way directly to 2560$ and 2540$ , which are considered potential rebound zones, while 2490$ represents the final liquidity and the golden buy zone if it is reached.
> We are monitoring the price reaction at these levels.
#ETH
> Analyze $ETH > There is significant liquidity accumulated below the price at the following levels: > 2590$ - 2560$ - 2540$ - 2490$
> The current price is approaching this liquidity—meaning a break of the 2590$ area will open the way directly to 2560$ and 2540$ , which are considered potential rebound zones, while 2490$ represents the final liquidity and the golden buy zone if it is reached.
> We are monitoring the price reaction at these levels.
> Analyze $ETH > There is significant liquidity accumulated below the price at the following levels: > 2590$ - 2560$ - 2540$ - 2490$
> The current price is approaching this liquidity—meaning a break of the 2590$ area will open the way directly to 2560$ and 2540$ , which are considered potential rebound zones, while 2490$ represents the final liquidity and the golden buy zone if it is reached.
> We are monitoring the price reaction at these levels.
1
464
·
--
#ETH $ETH has major Sell-Side Liquidity resting below:
2590 - 2560 - 2540 - 2490
Expect liquidity sweep before any real bounce. Watch price reaction at these levels, don't long into liquidity.
#ETH $ETH has major Sell-Side Liquidity resting below:
2590 - 2560 - 2540 - 2490
Expect liquidity sweep before any real bounce. Watch price reaction at these levels, don't long into liquidity.
2590 - 2560 - 2540 - 2490
Expect liquidity sweep before any real bounce. Watch price reaction at these levels, don't long into liquidity.
1
114
·
--
Is there hope that it will rise?
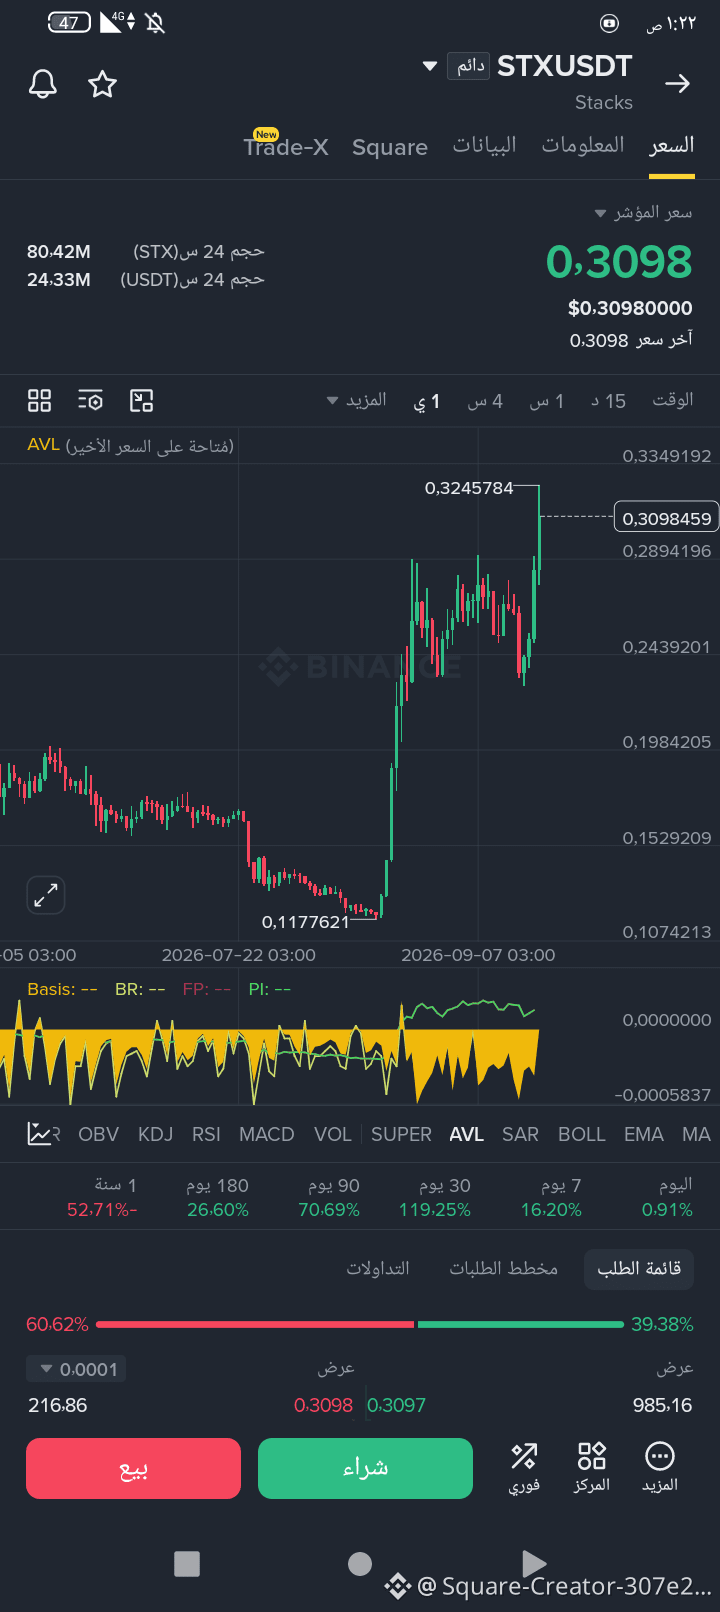
* **Current trend:** The last strong upward move indicates buying momentum and growing interest in the coin. The price is currently close to local resistance levels that recently reached around $0.3245.
* **Technical outlook:** Since the coin has achieved a significant and sudden increase in the short term (more than doubled within a month), the chances of continued upside are possible if it can break through and hold above the resistance level ($0.3245). However, cryptocurrencies that rise this sharply often see profit-taking waves and a temporary correction before continuing the upward journey.
*(Note: This is an illustrative technical analysis based on the image shown #STX/USDT and is not investment advice; the digital market is highly volatile.)*
Is there hope that it will rise?
* **Current trend:** The last strong upward move indicates buying momentum and growing interest in the coin. The price is currently close to local resistance levels that recently reached around $0.3245.
* **Technical outlook:** Since the coin has achieved a significant and sudden increase in the short term (more than doubled within a month), the chances of continued upside are possible if it can break through and hold above the resistance level ($0.3245). However, cryptocurrencies that rise this sharply often see profit-taking waves and a temporary correction before continuing the upward journey.
*(Note: This is an illustrative technical analysis based on the image shown #STX/USDT and is not investment advice; the digital market is highly volatile.)*
* **Current trend:** The last strong upward move indicates buying momentum and growing interest in the coin. The price is currently close to local resistance levels that recently reached around $0.3245.
* **Technical outlook:** Since the coin has achieved a significant and sudden increase in the short term (more than doubled within a month), the chances of continued upside are possible if it can break through and hold above the resistance level ($0.3245). However, cryptocurrencies that rise this sharply often see profit-taking waves and a temporary correction before continuing the upward journey.
*(Note: This is an illustrative technical analysis based on the image shown #STX/USDT and is not investment advice; the digital market is highly volatile.)*
1
121
·
--
Bearish
{spot}(BTCUSDT)
Price now when it reaches 83, buy
The target is 80800
Price now when it reaches 83, buy
The target is 80800
The target is 80800
13
·
--
Advice: Don’t get involved in this trading during this period #ParadigmDisclosesZECHolding #MemeLaunchpads82%OfArcDayOneVolume
Advice: Don’t get involved in this trading during this period #ParadigmDisclosesZECHolding #MemeLaunchpads82%OfArcDayOneVolume
1
101
·
--
Where are we going?
Where are we going?
Muanaz
·
--
As I mentioned earlier, BTC reached the 77–76k zone after the dip, and thank God the outlook was correct. Now the most important thing is to monitor how the price reacts with this zone to see whether a rebound will appear or selling pressure will continue.#BTC走势分析 #BTC
13
·
--
I suggest the following: #FedRateWatch XRP #Xrp🔥🔥
I suggest the following: #FedRateWatch XRP #Xrp🔥🔥
152

·
--
As I mentioned earlier, BTC reached the 77–76k zone after the dip, and thank God the outlook was correct. Now the most important thing is to monitor how price reacts to this area to determine whether a bounce will appear or if selling pressure will continue.
As I mentioned earlier, BTC reached the 77–76k zone after the dip, and thank God the outlook was correct. Now the most important thing is to monitor how price reacts to this area to determine whether a bounce will appear or if selling pressure will continue.
Muanaz
·
--
Bearish#شارك_أفكارك_حول_BTC will drop further to 75 74 77
4
·
--
Muanaz
·
--
The market will fall more #TWT/USDT
1
24
·
--
[https://app.binance.com/uni-qr/cpos/363903576586699?r=GTMKH55Z&l=ar&uco=qanifYZPW3mQR0SCXtsQCw&uc=app_square_share_link&us=copylink](https://app.binance.com/uni-qr/cpos/363903576586699?r=GTMKH55Z&l=ar&uco=qanifYZPW3mQR0SCXtsQCw&uc=app_square_share_link&us=copylink)
https://app.binance.com/uni-qr/cpos/363903576586699?r=GTMKH55Z&l=ar&uco=qanifYZPW3mQR0SCXtsQCw&uc=app_square_share_link&us=copylink
3
·
--
*1. Current Situation*
- *Price*: $24.27
- *Last peak*: $26.11 just a while ago, and it corrected from it
- *24H Volume*: 349.05M USDT — high trading volume
- *Order Book*: 59.10% buy vs 40.90% sell = stronger buying pressure right now
*2. The Indicators You’re Seeing*
- *SAR*: 16.62 and the price is above it by $24.27. As long as the price stays above the yellow SAR points, the overall trend is bullish. The points have not flipped above the price yet.
- *Performance*:
- Today: +1.42%
- 7 days: +51.49%
- 30 days: +105.02%
- 90 days: +83.94%
- 1 year: +829.68%
The coin is rising strongly from a bottom of $9.85 on 22-7 to $26.11 on 9-9. That’s roughly ×2.6 in about a month and a half.
*3. What’s Happening on the Chart*
1. *Strong rise*: After $9.85, there was an upward wave without a major correction, reaching $26.11
2. *Current correction*: It fell from the top of $26.11 to $24.27. This is a normal correction after a 51% jump in a week
3. *Near support*: The $23.5 - $24 area is the first support. If it breaks, we could see $19.77
4. *Resistance*: The last high is $26.11. A breakout with volume could push it to test $27+
*4. Quick Summary*
- *Positive*: Uptrend, SAR under the price, 59% buying pressure, strong momentum on the larger 30D and 90D timeframes
- *Negative*: Fast vertical rise + pullback from the top. We may see more profit-taking before it continues
*Important Note*: This is a technical analysis of the chart you sent only and not investment advice. The crypto market is extremely volatile. Don’t put in money you can’t afford to lose, and set a stop-loss.#VVV
*1. Current Situation*
- *Price*: $24.27
- *Last peak*: $26.11 just a while ago, and it corrected from it
- *24H Volume*: 349.05M USDT — high trading volume
- *Order Book*: 59.10% buy vs 40.90% sell = stronger buying pressure right now
*2. The Indicators You’re Seeing*
- *SAR*: 16.62 and the price is above it by $24.27. As long as the price stays above the yellow SAR points, the overall trend is bullish. The points have not flipped above the price yet.
- *Performance*:
- Today: +1.42%
- 7 days: +51.49%
- 30 days: +105.02%
- 90 days: +83.94%
- 1 year: +829.68%
The coin is rising strongly from a bottom of $9.85 on 22-7 to $26.11 on 9-9. That’s roughly ×2.6 in about a month and a half.
*3. What’s Happening on the Chart*
1. *Strong rise*: After $9.85, there was an upward wave without a major correction, reaching $26.11
2. *Current correction*: It fell from the top of $26.11 to $24.27. This is a normal correction after a 51% jump in a week
3. *Near support*: The $23.5 - $24 area is the first support. If it breaks, we could see $19.77
4. *Resistance*: The last high is $26.11. A breakout with volume could push it to test $27+
*4. Quick Summary*
- *Positive*: Uptrend, SAR under the price, 59% buying pressure, strong momentum on the larger 30D and 90D timeframes
- *Negative*: Fast vertical rise + pullback from the top. We may see more profit-taking before it continues
*Important Note*: This is a technical analysis of the chart you sent only and not investment advice. The crypto market is extremely volatile. Don’t put in money you can’t afford to lose, and set a stop-loss.#VVV
- *Price*: $24.27
- *Last peak*: $26.11 just a while ago, and it corrected from it
- *24H Volume*: 349.05M USDT — high trading volume
- *Order Book*: 59.10% buy vs 40.90% sell = stronger buying pressure right now
*2. The Indicators You’re Seeing*
- *SAR*: 16.62 and the price is above it by $24.27. As long as the price stays above the yellow SAR points, the overall trend is bullish. The points have not flipped above the price yet.
- *Performance*:
- Today: +1.42%
- 7 days: +51.49%
- 30 days: +105.02%
- 90 days: +83.94%
- 1 year: +829.68%
The coin is rising strongly from a bottom of $9.85 on 22-7 to $26.11 on 9-9. That’s roughly ×2.6 in about a month and a half.
*3. What’s Happening on the Chart*
1. *Strong rise*: After $9.85, there was an upward wave without a major correction, reaching $26.11
2. *Current correction*: It fell from the top of $26.11 to $24.27. This is a normal correction after a 51% jump in a week
3. *Near support*: The $23.5 - $24 area is the first support. If it breaks, we could see $19.77
4. *Resistance*: The last high is $26.11. A breakout with volume could push it to test $27+
*4. Quick Summary*
- *Positive*: Uptrend, SAR under the price, 59% buying pressure, strong momentum on the larger 30D and 90D timeframes
- *Negative*: Fast vertical rise + pullback from the top. We may see more profit-taking before it continues
*Important Note*: This is a technical analysis of the chart you sent only and not investment advice. The crypto market is extremely volatile. Don’t put in money you can’t afford to lose, and set a stop-loss.#VVV
140
·
--
Bearish
#شارك_أفكارك_حول_BTC will drop further to 75 74 77
#شارك_أفكارك_حول_BTC will drop further to 75 74 77
1
12
·
--
https://www.binance.com/activity/word-of-the-day/Fueling-the-Next-Rally?ref=CPA_00BD8GHZ0C
https://www.binance.com/activity/word-of-the-day/Fueling-the-Next-Rally?ref=CPA_00BD8GHZ0C

3
Log in to explore more content
Join global crypto users on Binance Square
⚡️ Get latest and useful information about crypto.
💬 Trusted by the world’s largest crypto exchange.
👍 Discover real insights from verified creators.
Email / Phone number
Trending Topics
WhoWillSucceedJensenHuangatNvidia?
65,691 views
872 Discussing
Nvidia Says No CEO Talks Underway as "Stand With Jensen" Petition Tops 77,900 Signatures
Binance News
·20 Likes
·28k views
WhatWillDriveCryptoandStocks’NextRebound?
402,985 views
2,824 Discussing
BitcoinActiveSupplyInProfitDropsBelow45%
7,608 views
180 Discussing