MR-SHAHEEN

64 Following
60 Followers
89 Liked
Posts
·
--
Bullish
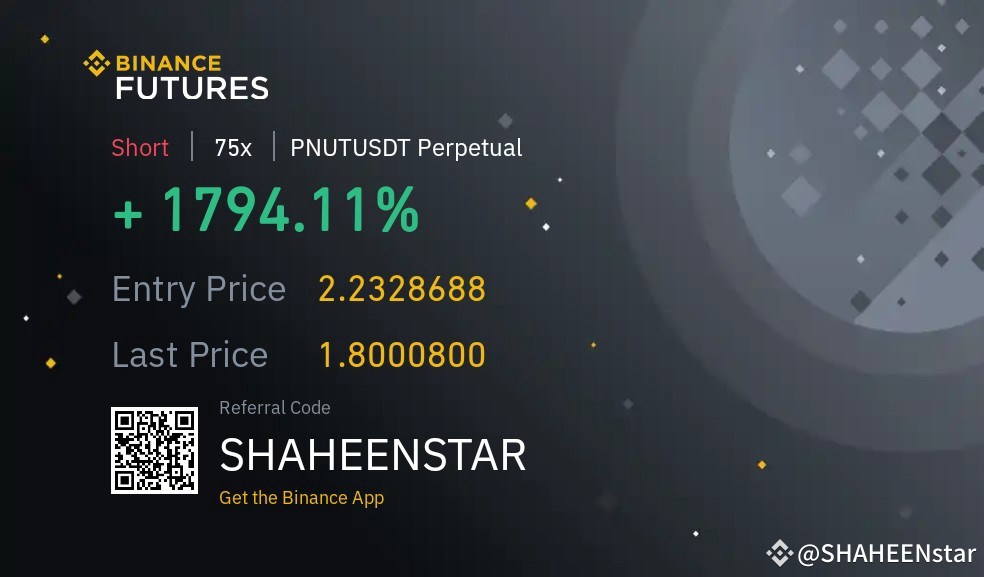
😂 Bro was not trading PEANUT… he was predicting the future! 🥜📉 "Bro didn't predict the market, he predicted PEANUT'S funeral. 💀🥜" Everyone: "Bro, what are you doing?" 🤡 Today: PEANUT looking like it forgot how to go UP. 📉😂 Some people follow the trend… Legends see the future! 🔮 Respect the OG short seller! 🫡 #PNUT #Binance #Crypto #Trading #ShortKing $PNUT
😂 Bro was not trading PEANUT… he was predicting the future! 🥜📉

"Bro didn't predict the market, he predicted PEANUT'S funeral. 💀🥜"

Everyone: "Bro, what are you doing?" 🤡

Today: PEANUT looking like it forgot how to go UP. 📉😂

Some people follow the trend… Legends see the future! 🔮

Respect the OG short seller! 🫡

#PNUT #Binance #Crypto #Trading #ShortKing
$PNUT
this is your shape so $ waliii
Emily_Crypto-2
·
--
I don't care about -98000$, i want to make 500,000 from $SOL
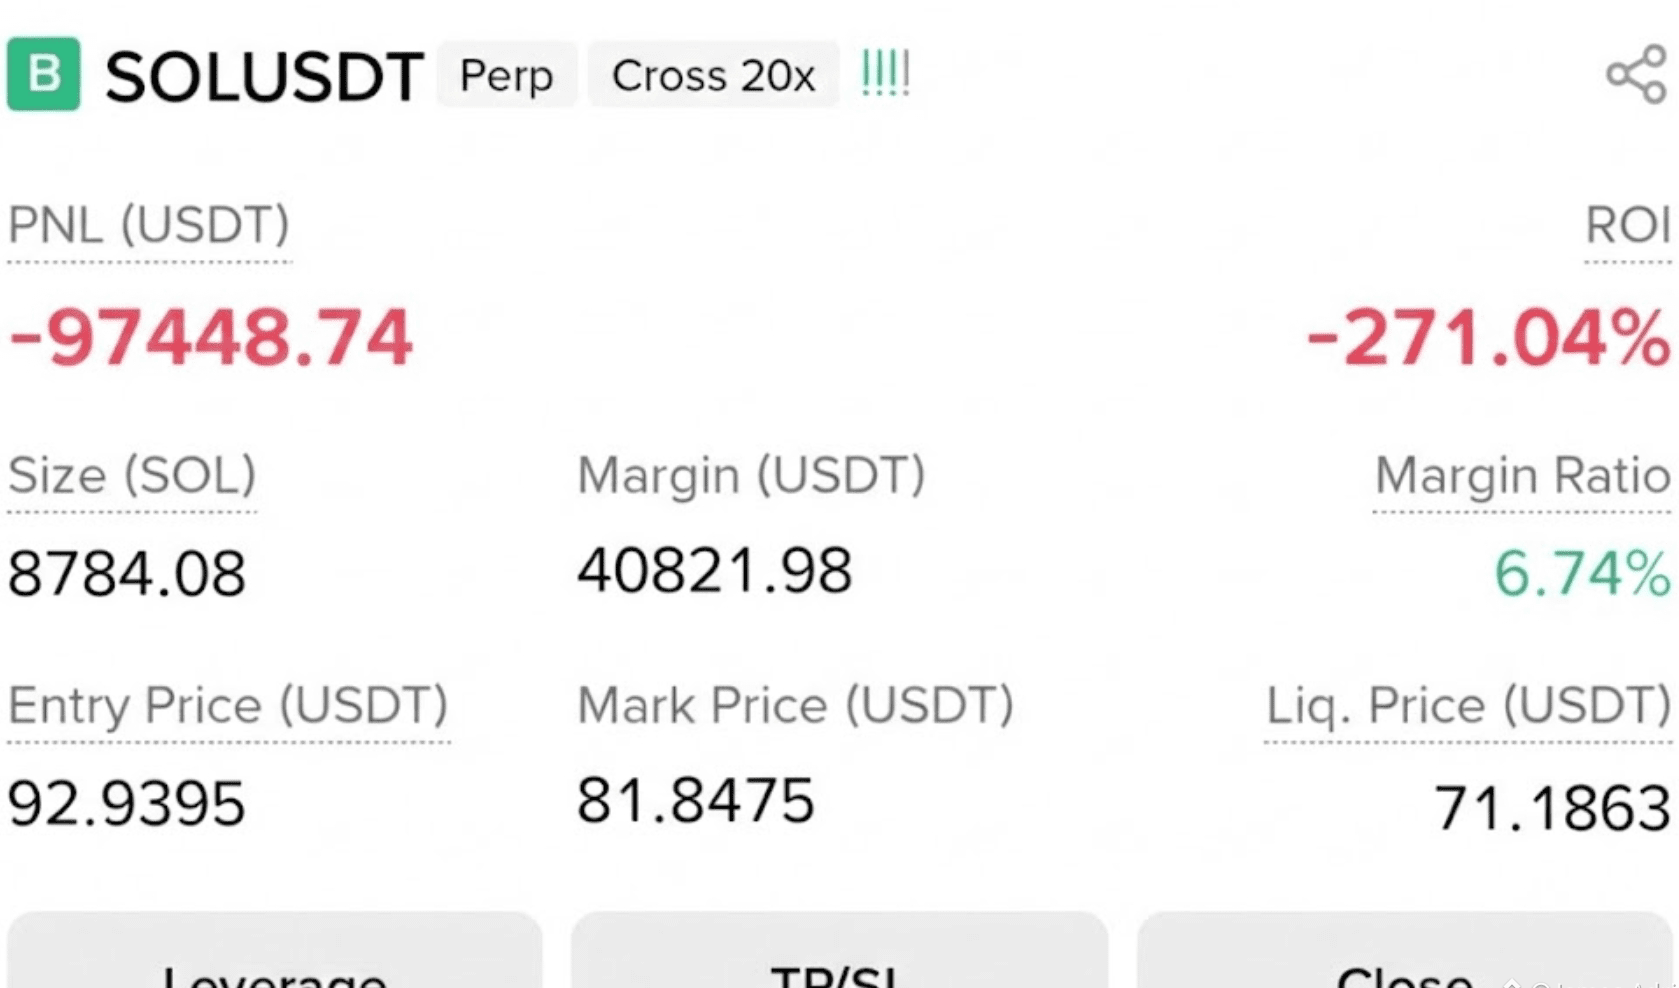
scammer screen shot copyright
Emily_Crypto-2
·
--
I don't care about -98000$, i want to make 500,000 from $SOL
·
--
Bearish
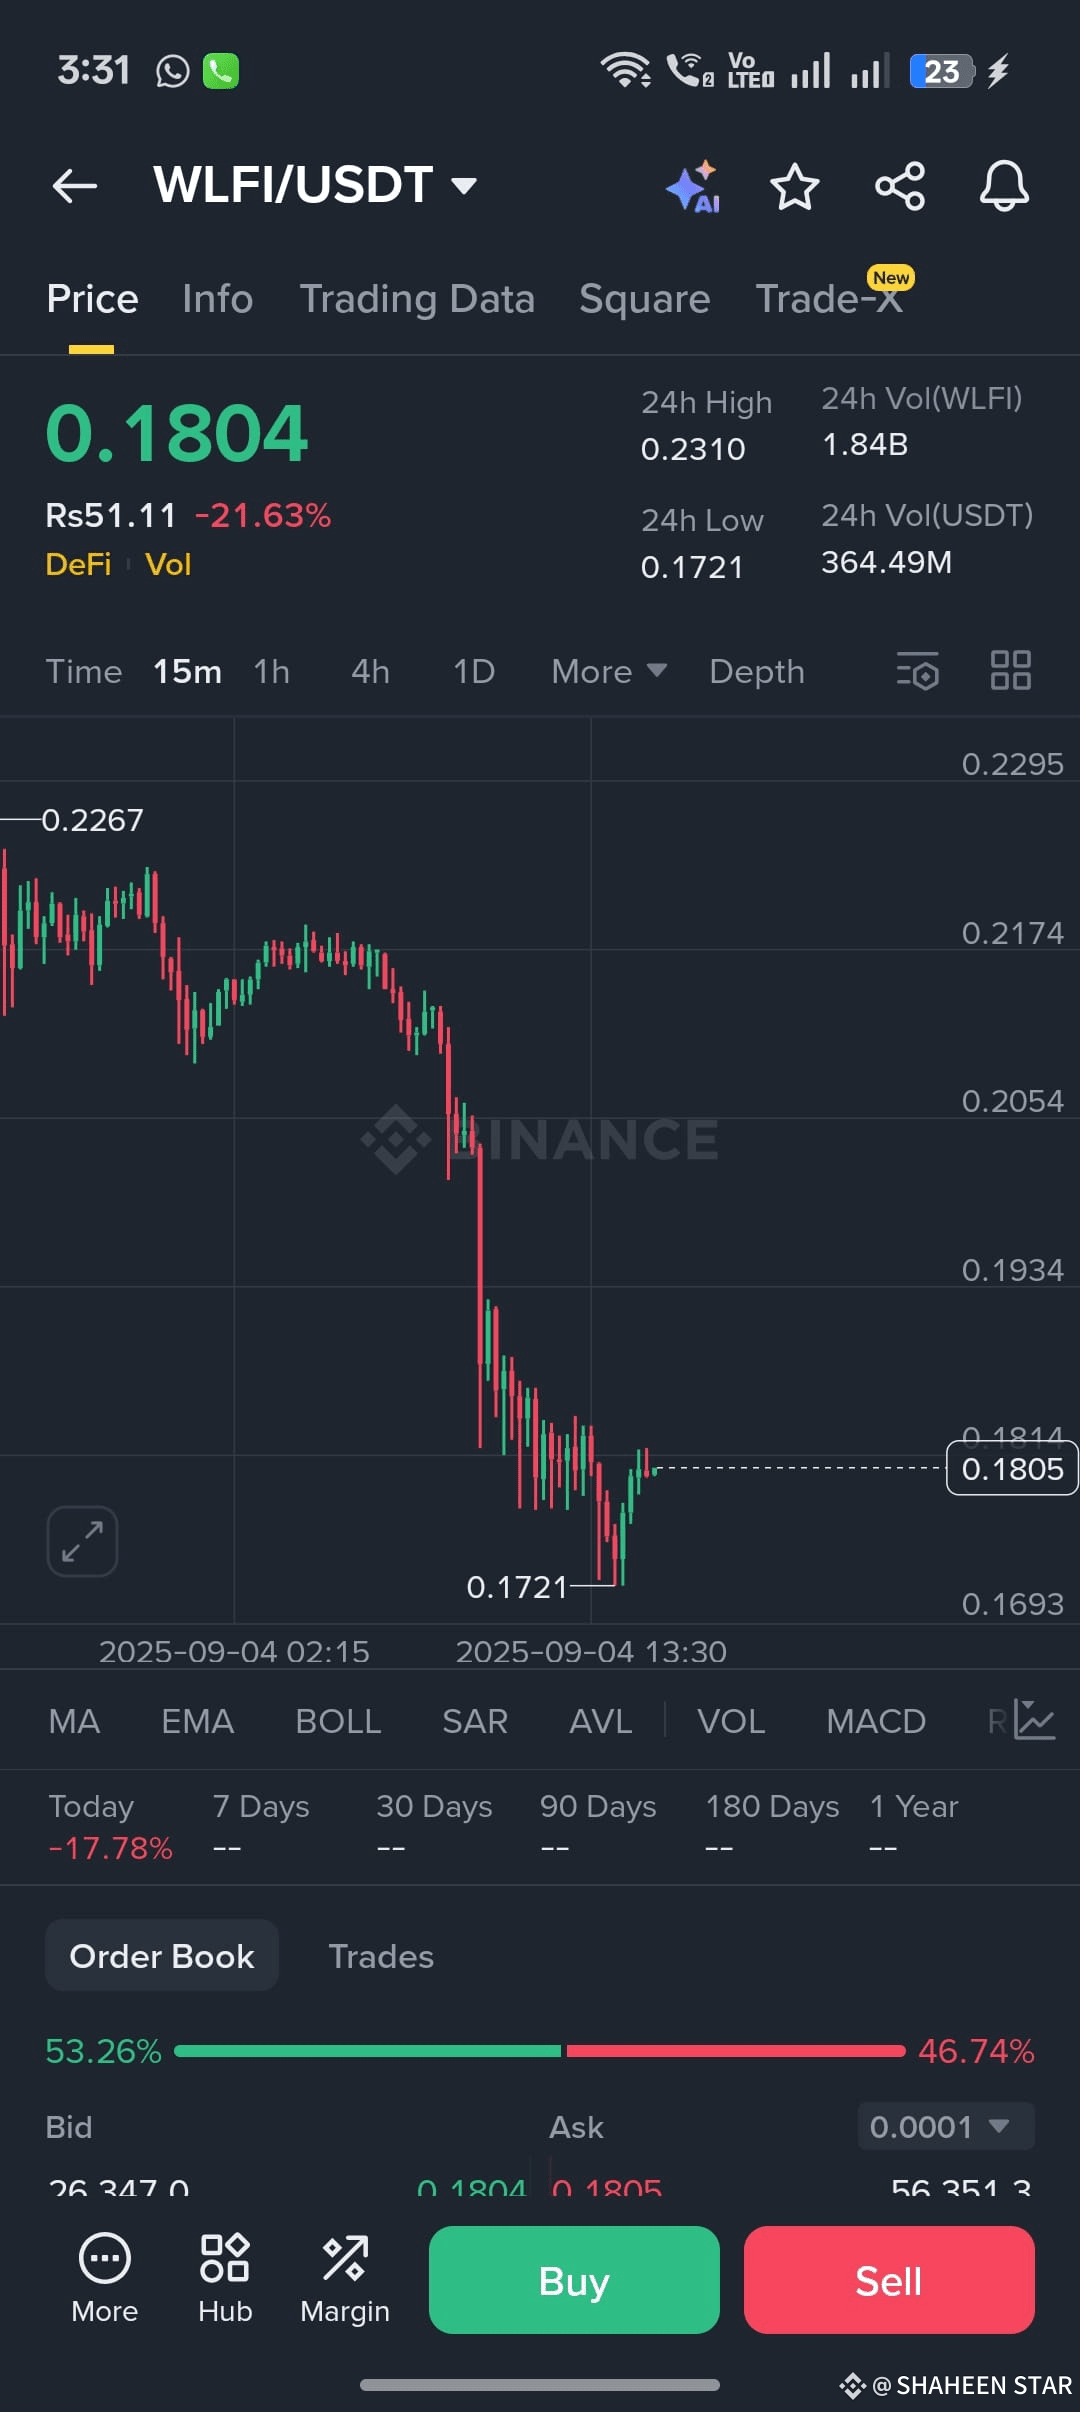
fukkkk of wlfi
fukkkk of wlfi
MissBlockChain_01
·
--
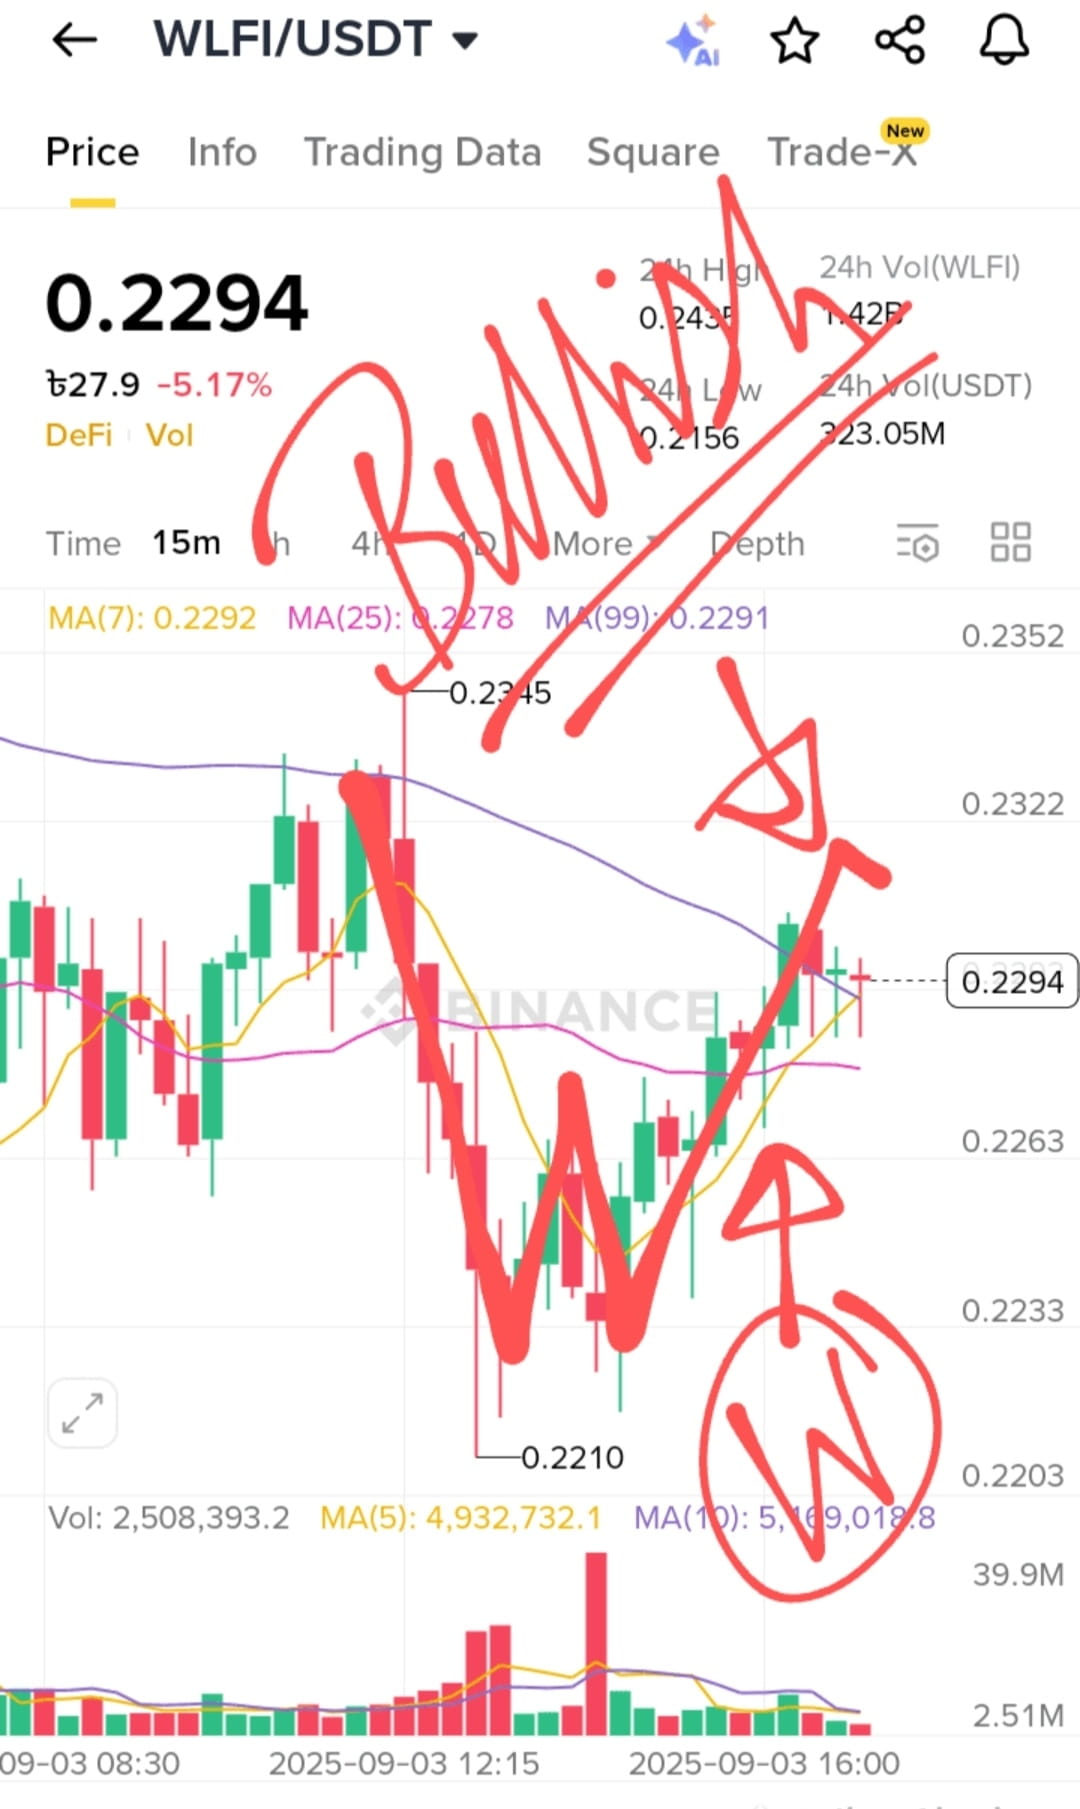
$WLFI /USDT – BULLISH REVERSAL LOADING! 🔥🚀

If you’re holding cash, this is the moment to act! 💵
Buy $WLFI today and tomorrow you’ll see why I said it. This coin is showing a strong bullish W-pattern after hitting the $0.2210 low and bouncing back with solid momentum. 📈

📊 Why I’m Bullish on WLFI:

Clear reversal setup forming on short-term charts

Strong support building near $0.2210

Increasing buy volume = early signs of a pump coming

This isn’t just speculation — it’s a chance to catch the wave before it takes off. Smart money always moves first. Don’t wait until it’s too late. ⏳

Who’s buying $WLFI with me? Let’s ride this pump together 🚀💎

#WLFI #Altcoins #TradingSignal #Binance #Crypto
still hold 2,3 day's just
کندهار ګيمينګ
·
--
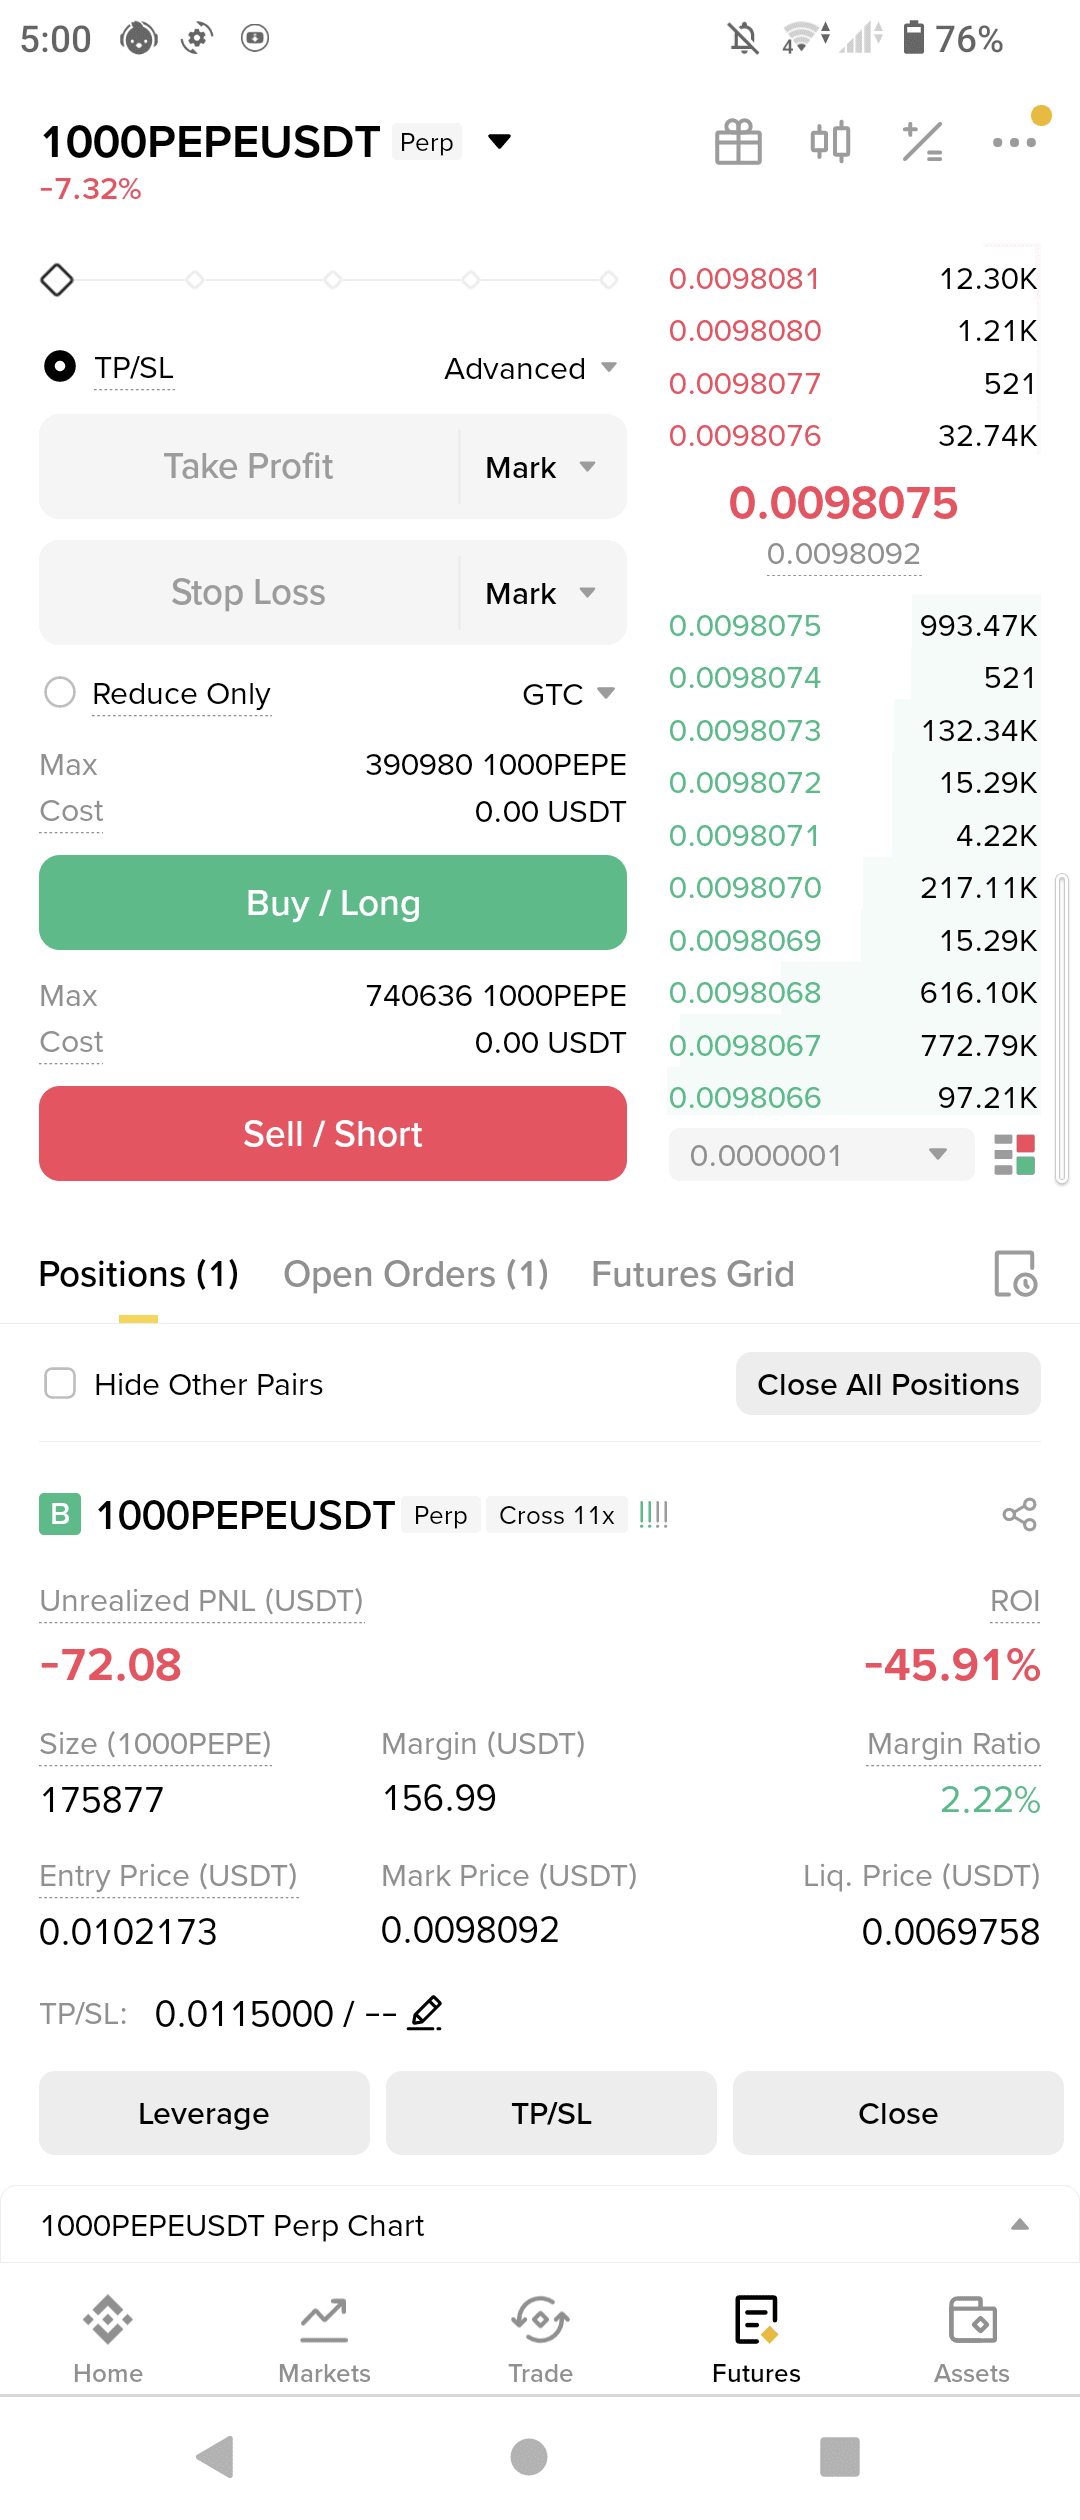
Friends, please give a more accurate analysis — should I wait until I see the result in green running?
·
--
Bullish
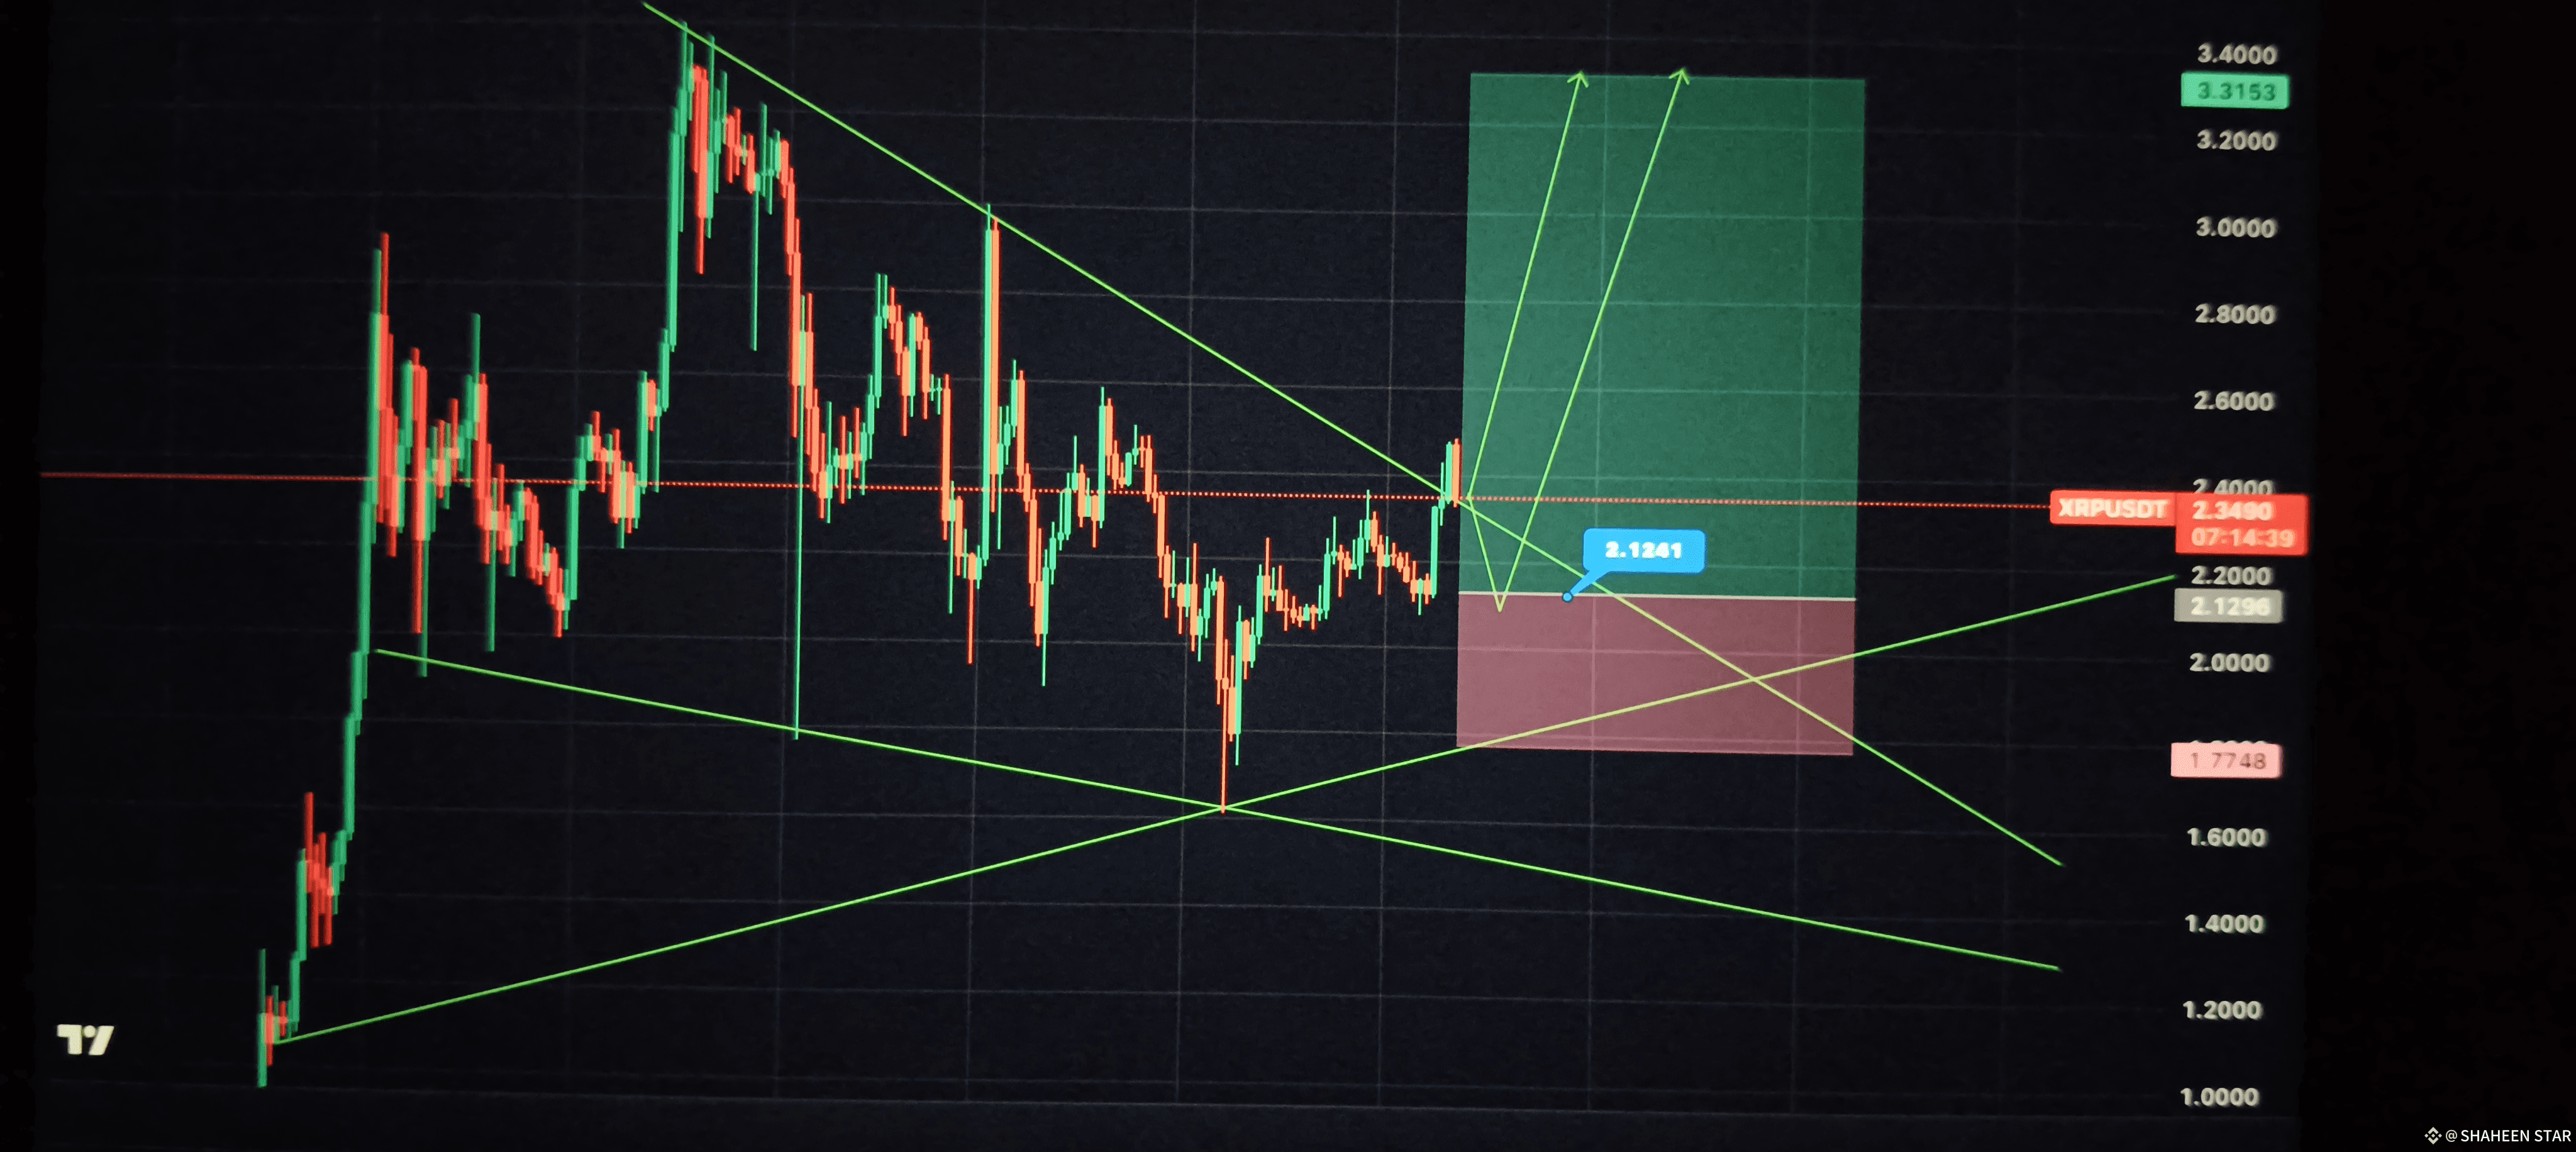
$XRP Chart Breakdown: Pair: XRP/USDT Current Price: 2.3490 (highlighted in red) Support Zone: Around 2.12 Stop-Loss Level: 1.7748 (marked in red box below) Target (TP): 3.3153 Risk-Reward Ratio (RRR): Favorable (approximately 3:1) Chart Patterns: Falling Wedge Breakout: Price has broken above a descending resistance trendline — this is generally a bullish breakout signal. Higher Low Formation: Price has formed higher lows, suggesting bullish strength. Volume Not Visible: Volume confirmation would help strengthen the signal. Trading Signal: Buy Signal (Buy Position): Entry: 2.35 (current price) Stop-Loss: 1.77 Target 1: 2.47 Target 2: 2.80 Target 3: 2.95 Target 4: 3.31 (final TP) Reason: Breakout from falling wedge pattern + successful retest suggests upside continuation. --- Risk Management: Do not risk more than 10/15% of your capital on this trade. Watch for fakeouts — if price drops below 2.12 support, reduce exposure or exit early. #SaylorBTCPurchase #BinanceAlphaAlert #AltcoinTrade #xrp #Xrp🔥🔥
$XRP Chart Breakdown:

Pair: XRP/USDT

Current Price: 2.3490 (highlighted in red)

Support Zone: Around 2.12

Stop-Loss Level: 1.7748 (marked in red box below)

Target (TP): 3.3153

Risk-Reward Ratio (RRR): Favorable (approximately 3:1)

Chart Patterns:

Falling Wedge Breakout: Price has broken above a descending resistance trendline — this is generally a bullish breakout signal.

Higher Low Formation: Price has formed higher lows, suggesting bullish strength.

Volume Not Visible: Volume confirmation would help strengthen the signal.

Trading Signal:

Buy Signal (Buy Position):

Entry: 2.35 (current price)

Stop-Loss: 1.77

Target 1: 2.47

Target 2: 2.80

Target 3: 2.95

Target 4: 3.31 (final TP)

Reason: Breakout from falling wedge pattern + successful retest suggests upside continuation.

---

Risk Management:

Do not risk more than 10/15% of your capital on this trade.

Watch for fakeouts — if price drops below 2.12 support, reduce exposure or exit early.
#SaylorBTCPurchase #BinanceAlphaAlert #AltcoinTrade #xrp #Xrp🔥🔥
·
--
Bullish
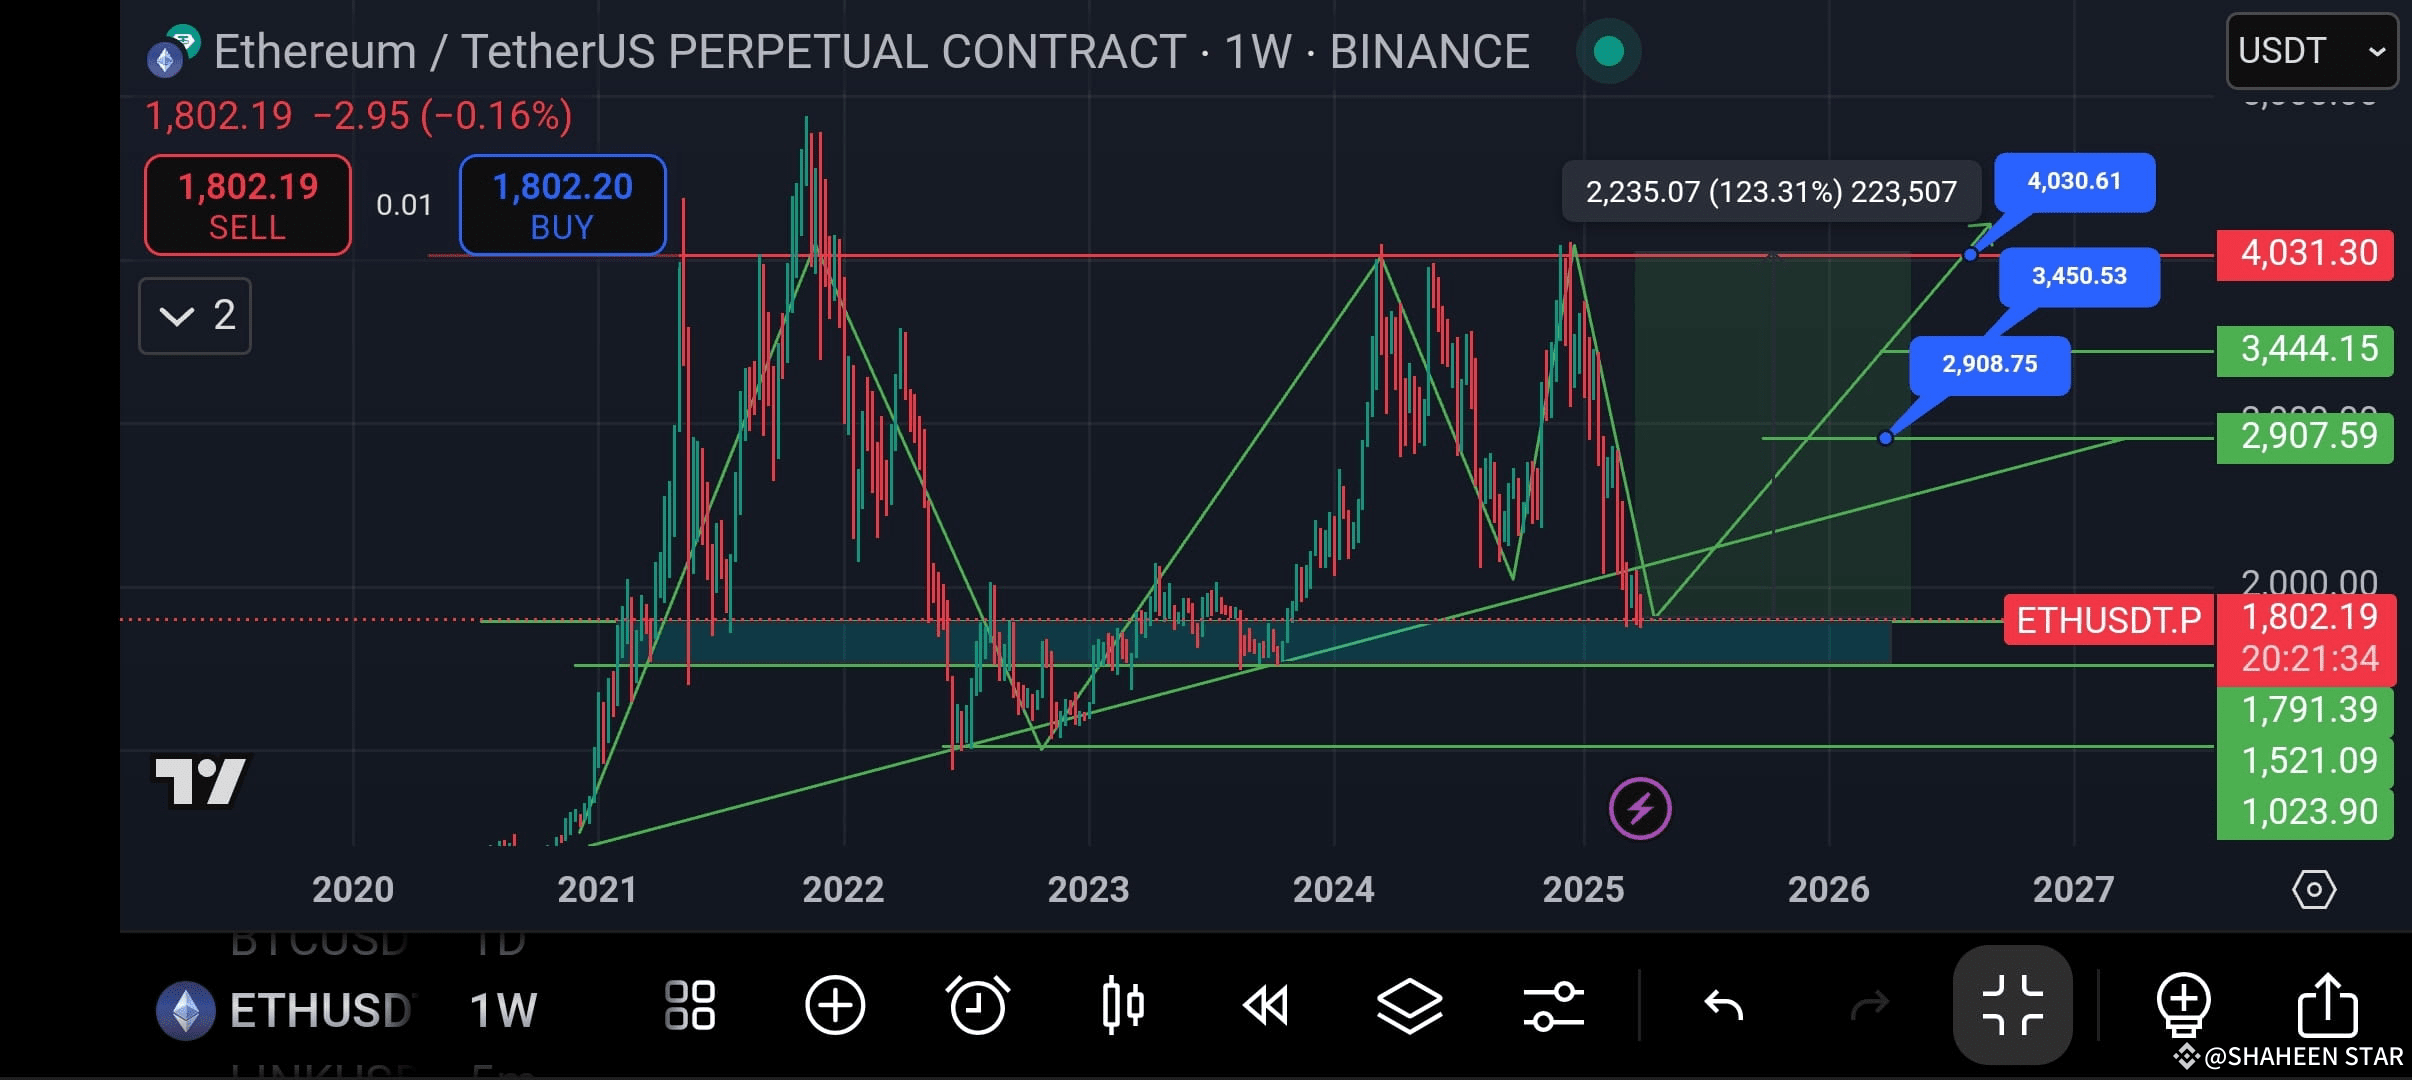
#ETH: 2021-26 1. 2021 Bull Run: The chart clearly shows that the price had a massive rally in 2021. All-time high around $4800 was made, this will be remembered by everyone in the market — true. 2. 2022 Crash: In 2022, the price showed a sharp decline — there are vertical red candles on the chart. This aligns with the actual events: LUNA crash, FTX collapse, inflation fear. Correct: ETH saw a drop to the $1,000–$1200 range. 3. 2023 Consolidation: The chart shows horizontal movement, it went sideways for several months. True: ETH attempted to recover, but remained range-bound. A strong base has formed near $1,500–$1,800 — correct observation. 4. 2024 Current Price Action: The price is currently around $1,800 — both the chart and Binance are matching. Trendline retest & potential breakout zone are visible — this is a classic bullish setup. The green box shows "target zone" — correct: resistance levels at $2,900, $3,450, $4030. 5. 2025–2026 Projection: The chart contains Fibonacci-based extension and trendline projection. #DiversifyYourAssets #PowellRemarks #NextCryptoETFs? #CryptoTariffDrop #TrumpTariffs $ETH {spot}(ETHUSDT)
#ETH: 2021-26

1. 2021 Bull Run:

The chart clearly shows that the price had a massive rally in 2021.

All-time high around $4800 was made, this will be remembered by everyone in the market — true.

2. 2022 Crash:

In 2022, the price showed a sharp decline — there are vertical red candles on the chart.

This aligns with the actual events: LUNA crash, FTX collapse, inflation fear.

Correct: ETH saw a drop to the $1,000–$1200 range.

3. 2023 Consolidation:

The chart shows horizontal movement, it went sideways for several months.

True: ETH attempted to recover, but remained range-bound.

A strong base has formed near $1,500–$1,800 — correct observation.

4. 2024 Current Price Action:

The price is currently around $1,800 — both the chart and Binance are matching.

Trendline retest & potential breakout zone are visible — this is a classic bullish setup.

The green box shows "target zone" — correct: resistance levels at $2,900, $3,450, $4030.

5. 2025–2026 Projection:

The chart contains Fibonacci-based extension and trendline projection.

#DiversifyYourAssets #PowellRemarks #NextCryptoETFs? #CryptoTariffDrop #TrumpTariffs $ETH
butt 👇👎
butt 👇👎
Kai Merce
·
--
Bullish
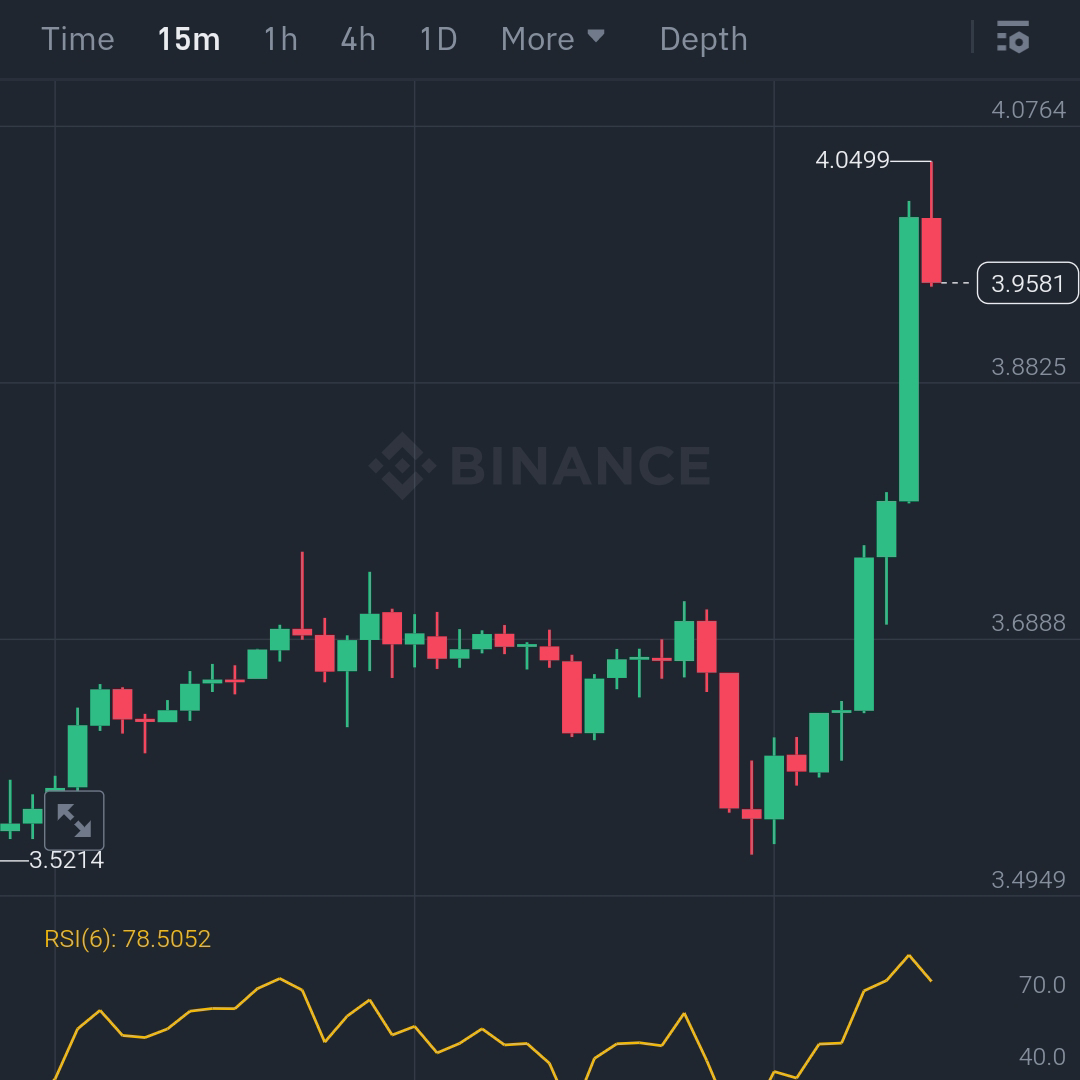
$SUI /USDT Breakout in Action – Targets Within Reach!


SUI is riding a bullish wave, currently trading at $3.959 on the 15-minute chart. With strong momentum and controlled price action, traders should consider entering a long position above $3.96. Key resistance lies at $4.05, while support at $3.90 provides a solid safety net. The short-term take-profit targets are set close at $4.00, $4.02, and $4.05 to capitalize on the current rally while minimizing risk. To manage downside, a stop-loss at $3.92 is recommended.

With RSI nearing 78.50, SUI is approaching overbought conditions, signaling caution. However, the bullish trend remains intact, offering an excellent opportunity for traders to capture gains as SUI approaches its critical resistance levels. Stay vigilant and trade smart!

#SUI #ETHOnTheRise #CryptoZombieUprising
hold
hold
Harsha wedikkara
·
--
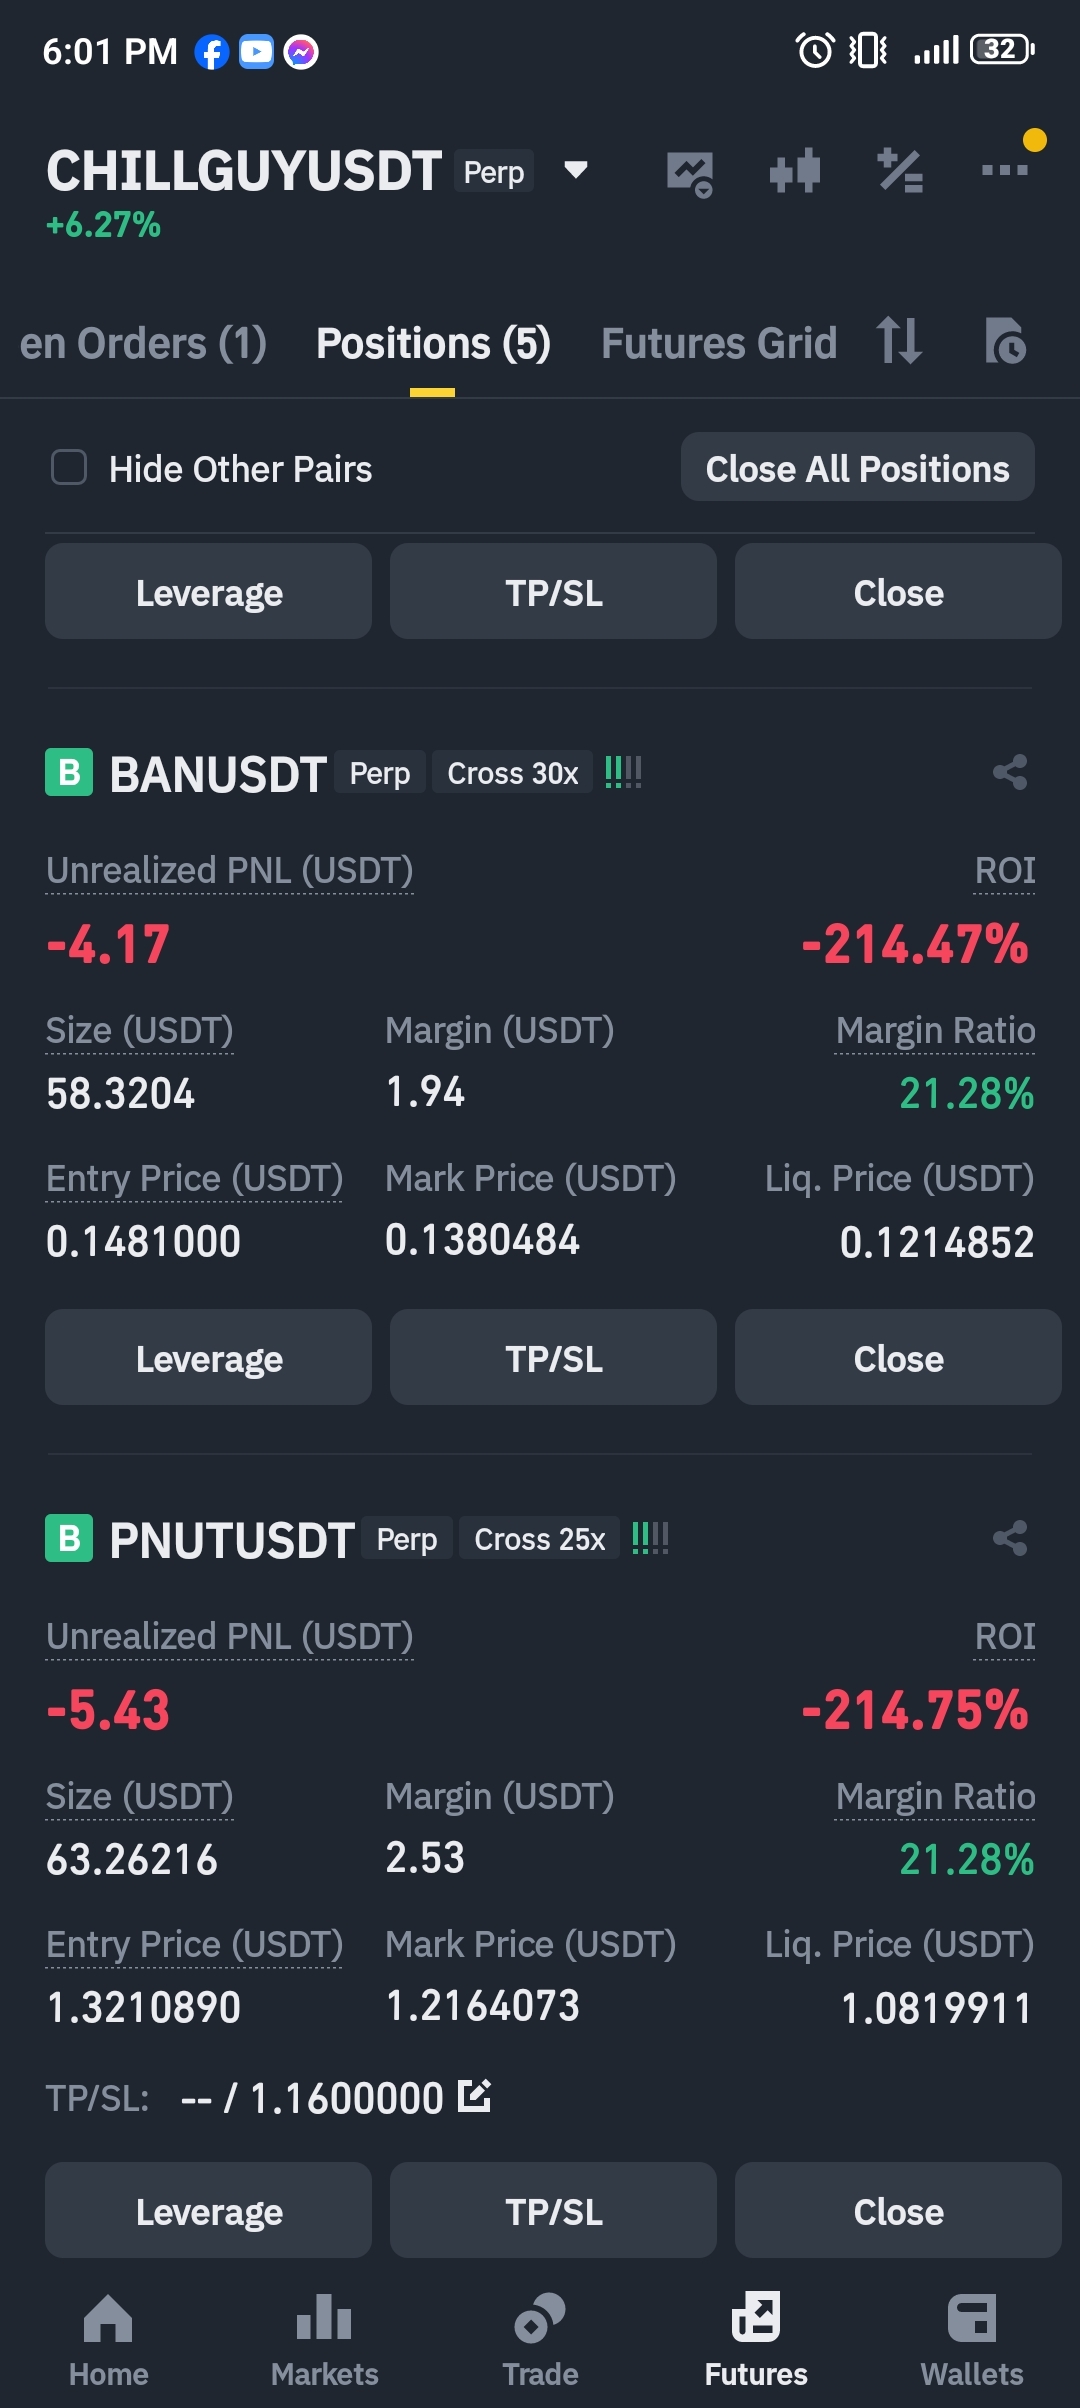
hold or close #Ban #Pnut
·
--
Bullish
·
--
Bullish
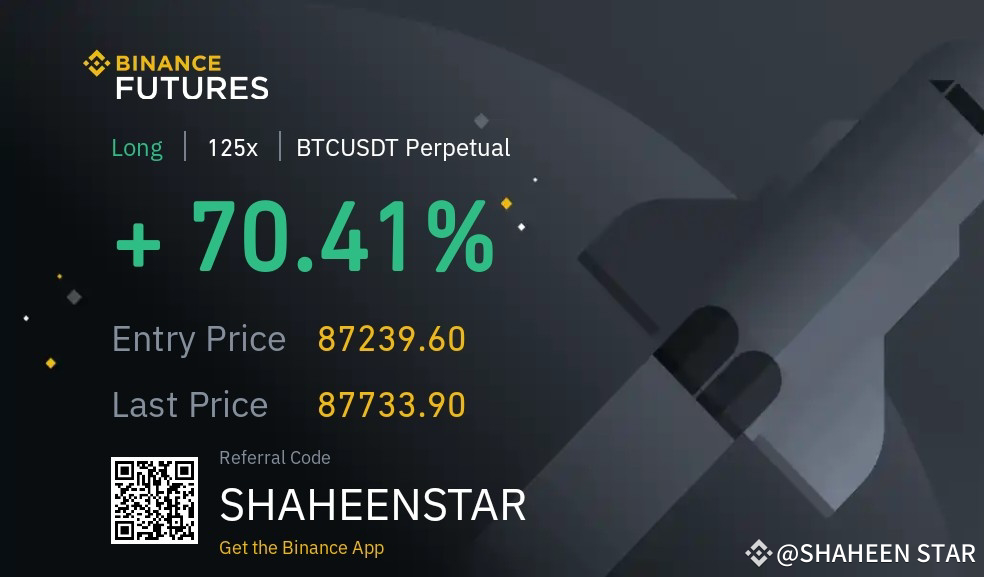
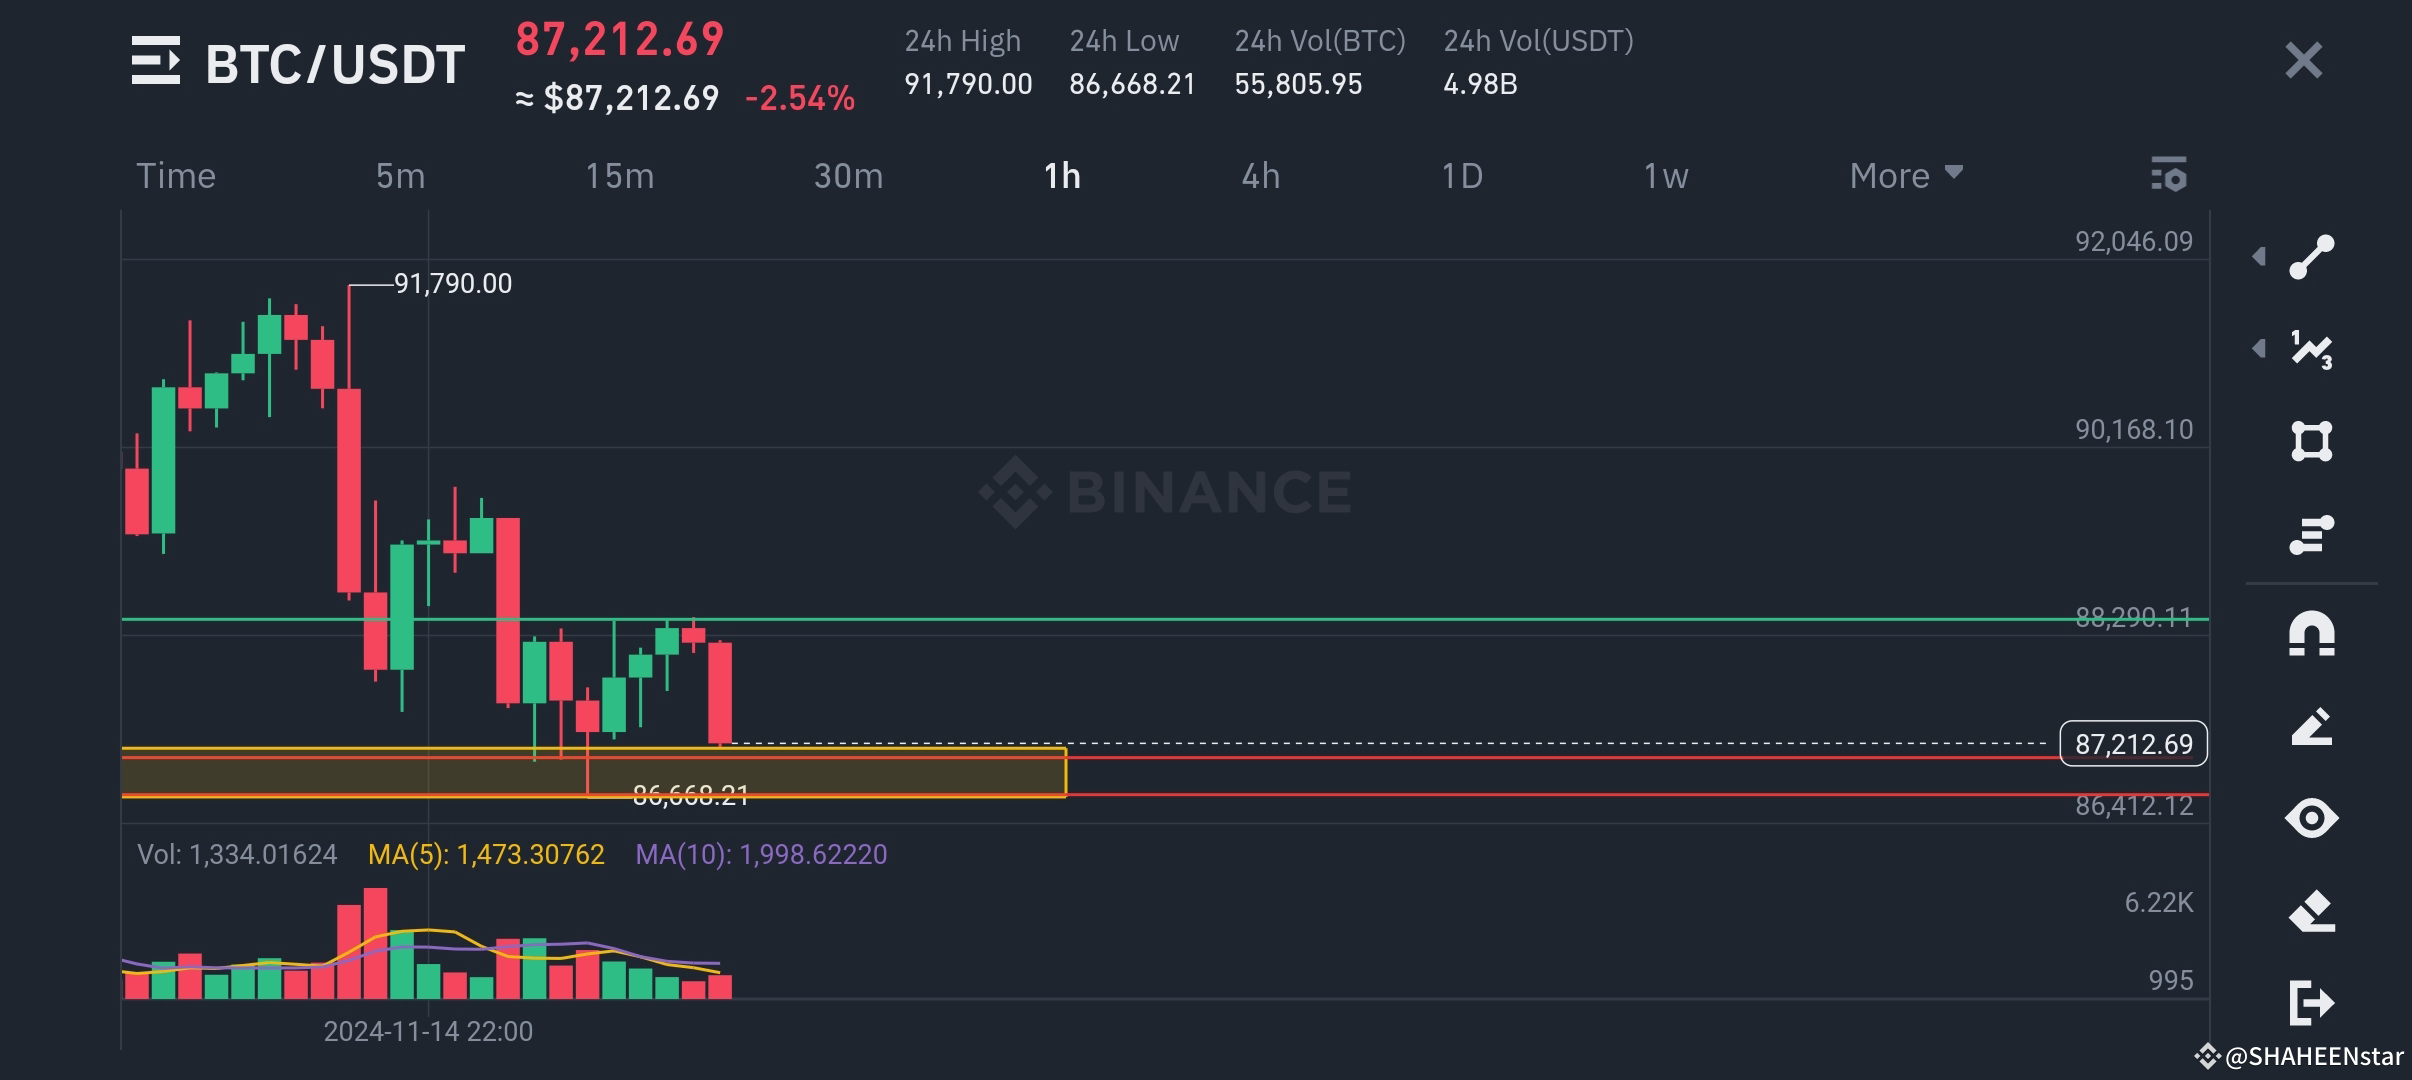
⭐ LONG BTC/USDT entry 87k_86.5k ✨ TP 1-88000 ✨ TP 2-89000 ✨ TP 3-90000 ✨ SL -85000 $BTC #BTC☀
⭐ LONG
BTC/USDT entry 87k_86.5k

✨ TP 1-88000
✨ TP 2-89000
✨ TP 3-90000

✨ SL -85000
$BTC

#BTC☀
Log in to explore more content
Join global crypto users on Binance Square
⚡️ Get latest and useful information about crypto.
💬 Trusted by the world’s largest crypto exchange.
👍 Discover real insights from verified creators.
Email / Phone number
Sitemap
Cookie Preferences
Platform T&Cs