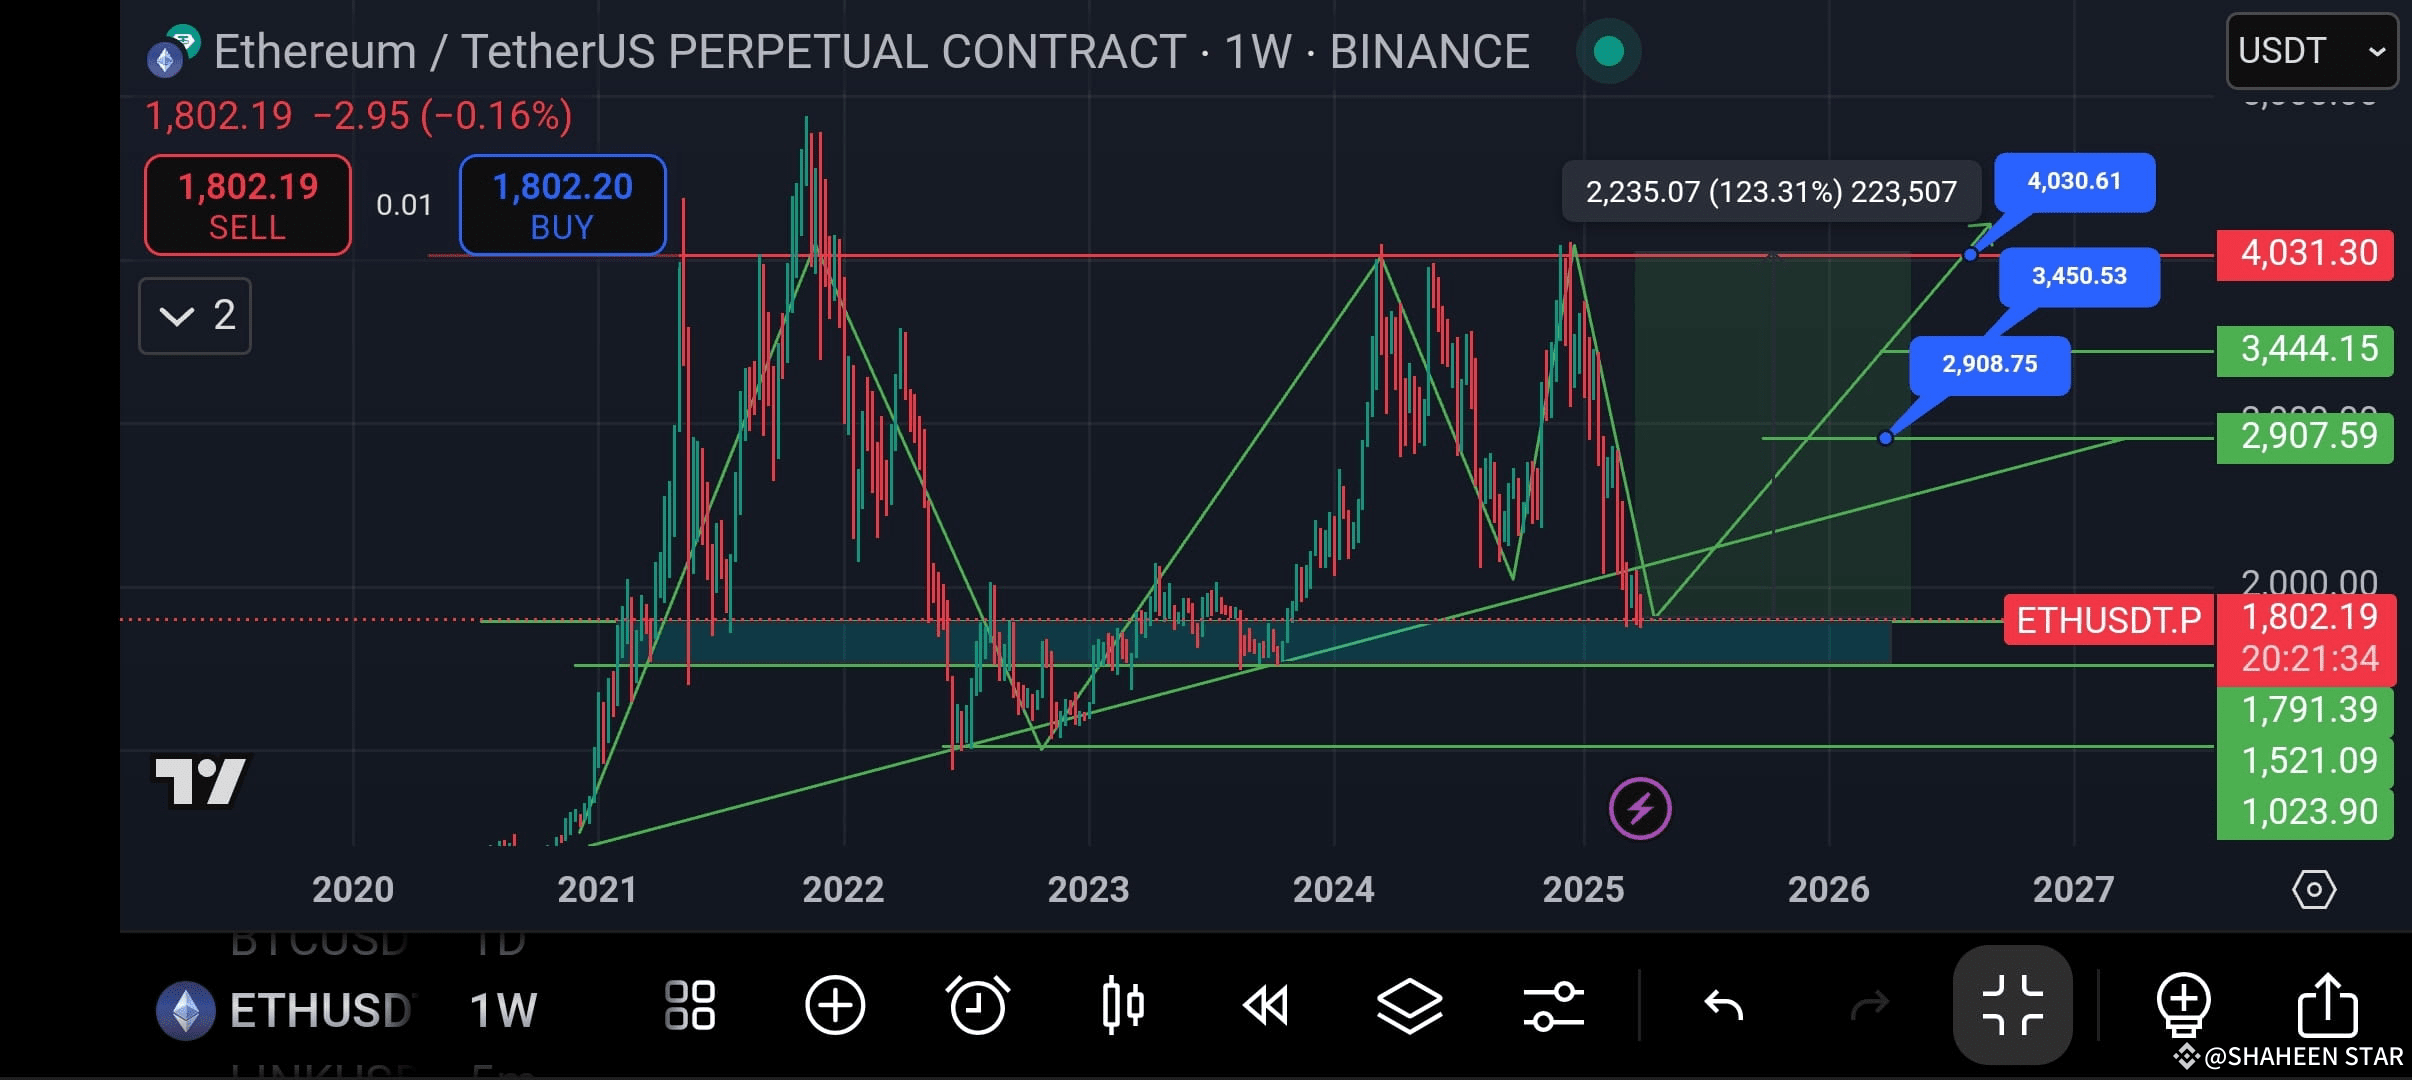
#ETH: 2021-26
1. 2021 Bull Run:
The chart clearly shows that the price had a massive rally in 2021.
All-time high around $4800 was made, this will be remembered by everyone in the market — true.
2. 2022 Crash:
In 2022, the price showed a sharp decline — there are vertical red candles on the chart.
This aligns with the actual events: LUNA crash, FTX collapse, inflation fear.
Correct: ETH saw a drop to the $1,000–$1200 range.
3. 2023 Consolidation:
The chart shows horizontal movement, it went sideways for several months.
True: ETH attempted to recover, but remained range-bound.
A strong base has formed near $1,500–$1,800 — correct observation.
4. 2024 Current Price Action:
The price is currently around $1,800 — both the chart and Binance are matching.
Trendline retest & potential breakout zone are visible — this is a classic bullish setup.
The green box shows "target zone" — correct: resistance levels at $2,900, $3,450, $4030.
5. 2025–2026 Projection:
The chart contains Fibonacci-based extension and trendline projection.
#DiversifyYourAssets #PowellRemarks #NextCryptoETFs? #CryptoTariffDrop #TrumpTariffs $ETH
1. 2021 Bull Run:
The chart clearly shows that the price had a massive rally in 2021.
All-time high around $4800 was made, this will be remembered by everyone in the market — true.
2. 2022 Crash:
In 2022, the price showed a sharp decline — there are vertical red candles on the chart.
This aligns with the actual events: LUNA crash, FTX collapse, inflation fear.
Correct: ETH saw a drop to the $1,000–$1200 range.
3. 2023 Consolidation:
The chart shows horizontal movement, it went sideways for several months.
True: ETH attempted to recover, but remained range-bound.
A strong base has formed near $1,500–$1,800 — correct observation.
4. 2024 Current Price Action:
The price is currently around $1,800 — both the chart and Binance are matching.
Trendline retest & potential breakout zone are visible — this is a classic bullish setup.
The green box shows "target zone" — correct: resistance levels at $2,900, $3,450, $4030.
5. 2025–2026 Projection:
The chart contains Fibonacci-based extension and trendline projection.
#DiversifyYourAssets #PowellRemarks #NextCryptoETFs? #CryptoTariffDrop #TrumpTariffs $ETH