

0hoatay
I’m actually an office worker who enjoys trading, involved in the market since 2020, but to be honest, I’m still getting schooled by the market makers every day

RENDER Holder
Frequent Trader
6 Years
1 Following
18 Followers
65 Liked
Posts
All
Quotes
0hoatay
·
--
BearishShort Bet $SAHARA x7
- Entry: 0.02973 (Enter at Market price for hot)
- DCA: No DCA
Take profit target (TP):
- 0.0271
- 0.0254
- 0.0156
Stop loss: 0.0335
Remember to always leave some room for DCA, you should only risk about 1-3% of your account, because basically everyone's taste is different.
As always, once you hit TP 1, feel free to move SL to entry for peace of mind.
- Entry: 0.02973 (Enter at Market price for hot)
- DCA: No DCA
Take profit target (TP):
- 0.0271
- 0.0254
- 0.0156
Stop loss: 0.0335
Remember to always leave some room for DCA, you should only risk about 1-3% of your account, because basically everyone's taste is different.
As always, once you hit TP 1, feel free to move SL to entry for peace of mind.
0hoatay
·
--
BearishShort Bet $NEAR leverage 8x for your reference:
- Entry: 1.3622 (Enter at the current price)
- DCA: 1.463
Take Profit (TP) targets:
- 1.238
- 1.094
- 0.992
Stop Loss (SL): 1.502
Make sure to reserve capital for DCA, only trade about 1-3% of your account, as I also don't know each person's risk appetite. The basic idea is to move SL to the Entry point for safety once TP 1 is hit.
- Entry: 1.3622 (Enter at the current price)
- DCA: 1.463
Take Profit (TP) targets:
- 1.238
- 1.094
- 0.992
Stop Loss (SL): 1.502
Make sure to reserve capital for DCA, only trade about 1-3% of your account, as I also don't know each person's risk appetite. The basic idea is to move SL to the Entry point for safety once TP 1 is hit.
0hoatay
·
--
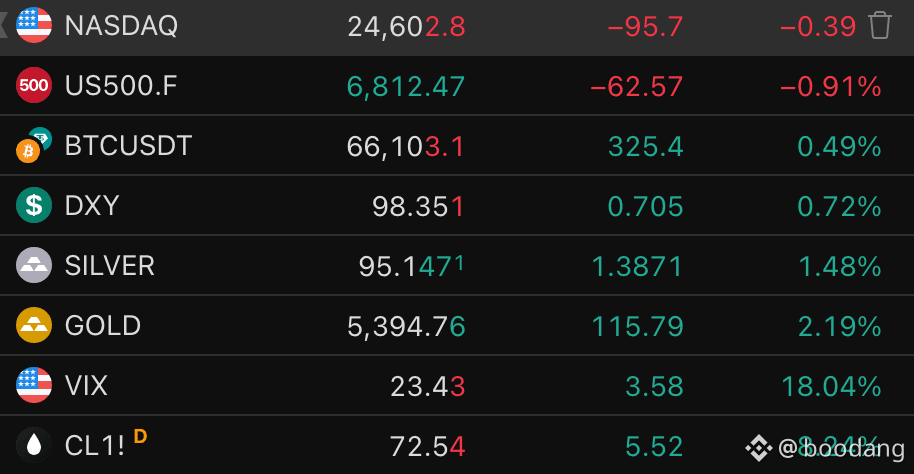
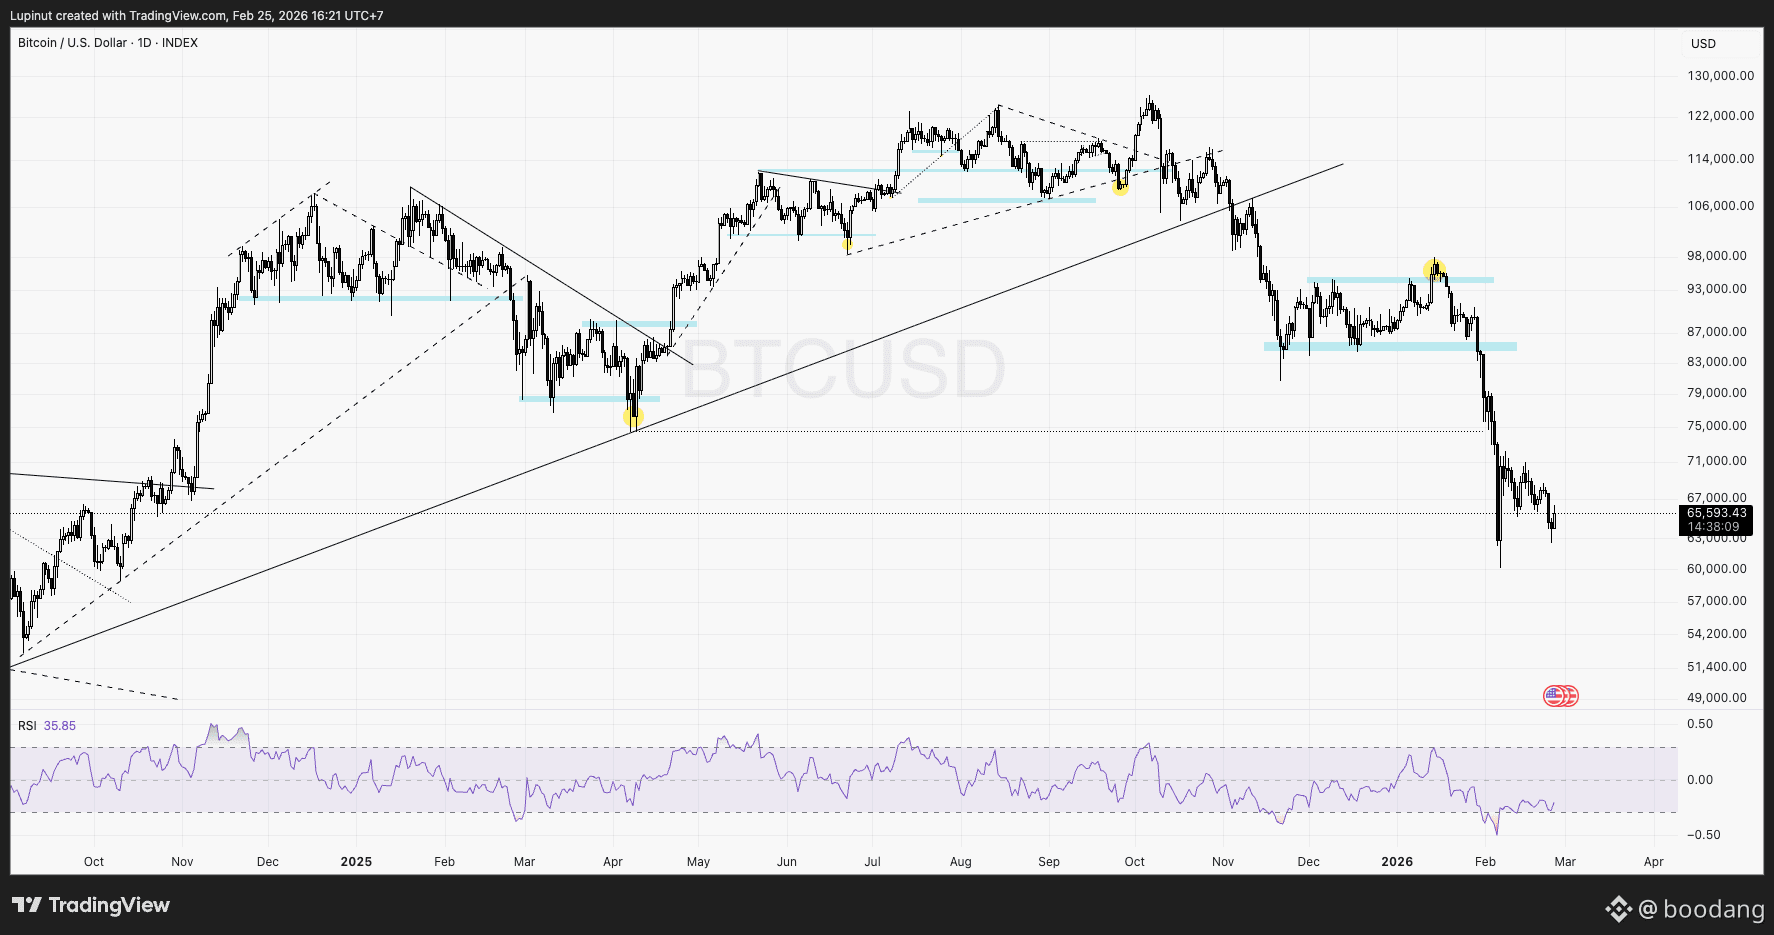
Bearishmy perspective is that in the next 24-72 hours, we need to see how the stock market "absorbs" the pile of news from the past few days. if the stocks hold steady and oil prices remain stable below $80, #bitcoin there is a high chance it will slightly rebound from this area to create a base. the "ceasefire" that erupts will be very significant, because since 2020, every time there is news of a ceasefire, bitcoin has increased by an average of 37% within 60 days.
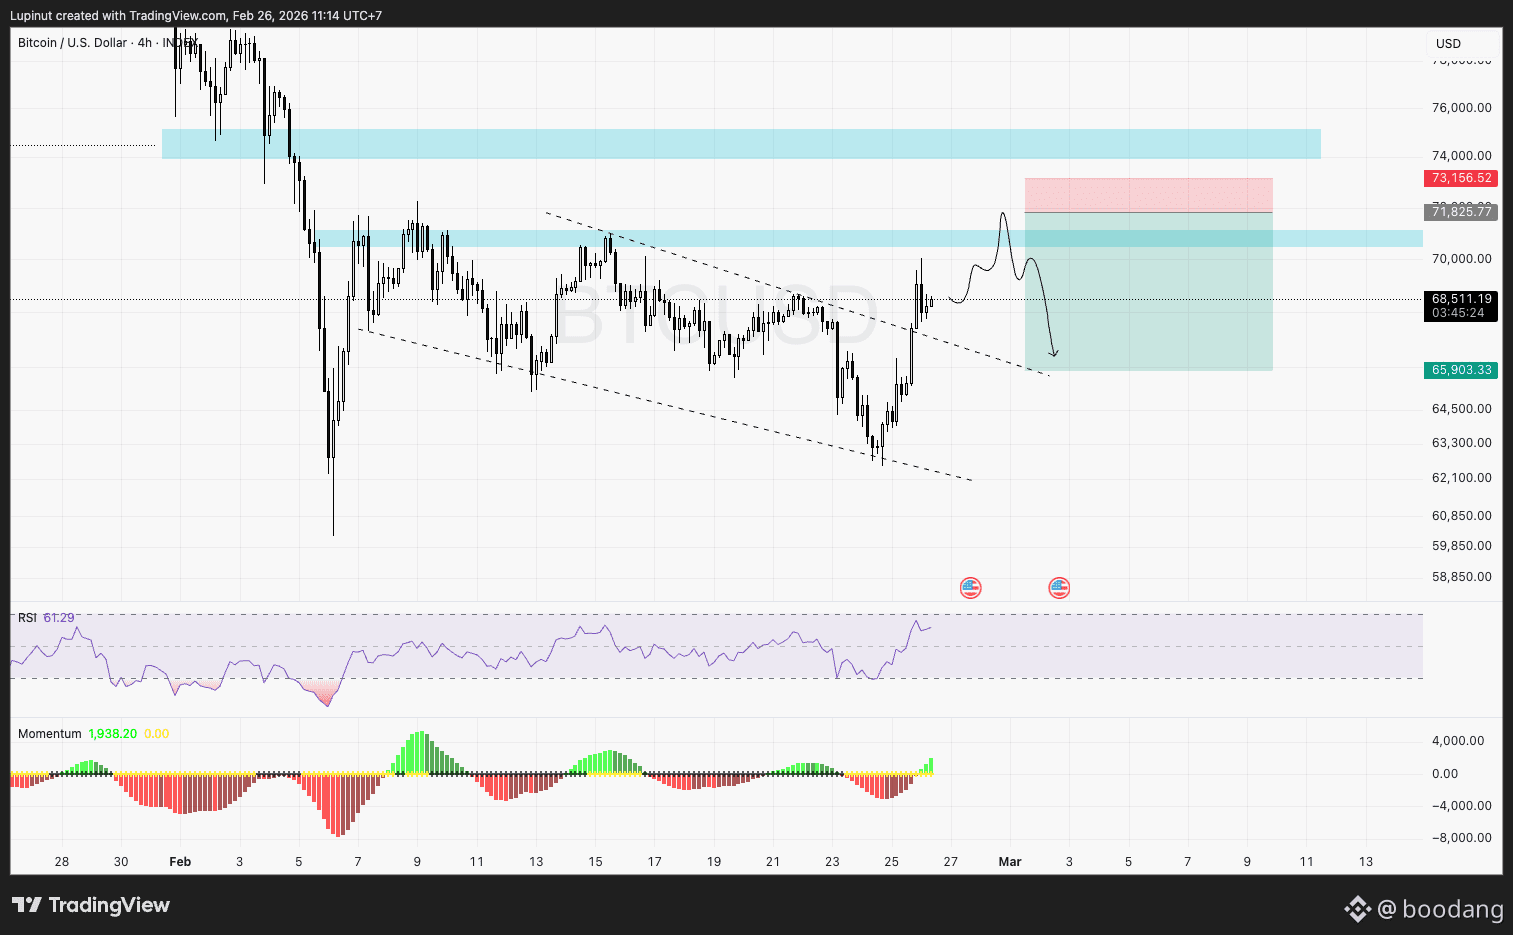
I can't be sure that $BTC will rise back to $100k, but at least it could retest the $73k area, and in my opinion, hitting that will just lead to another sell-off.
I can't be sure that $BTC will rise back to $100k, but at least it could retest the $73k area, and in my opinion, hitting that will just lead to another sell-off.
0hoatay
·
--
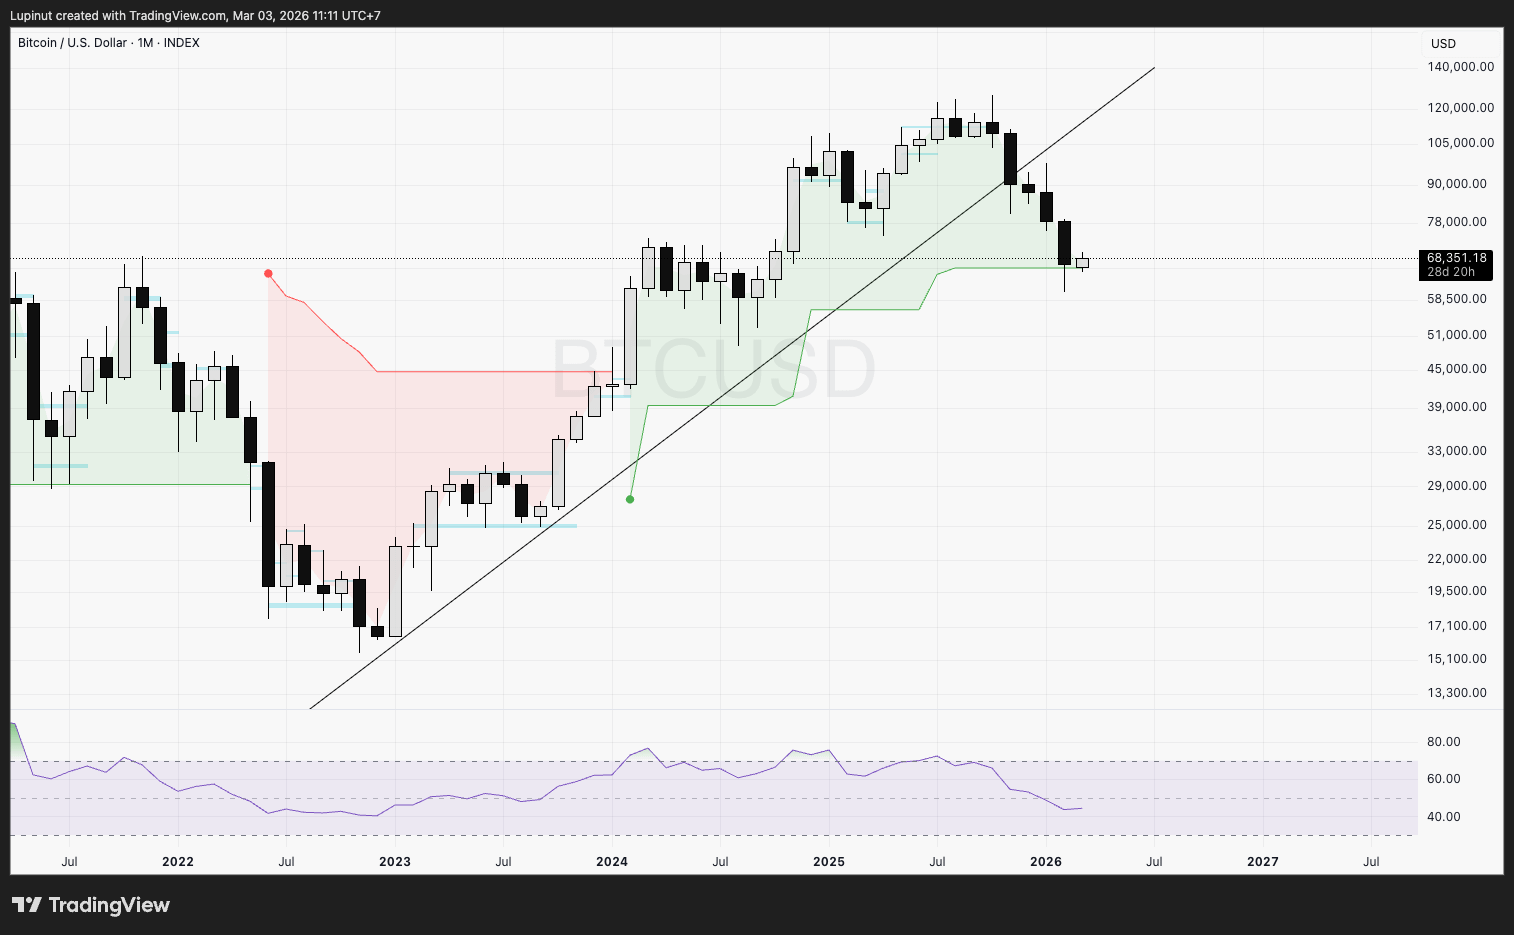
BearishFebruary just passed is considered the closing account, and $BTC has just printed another red monthly candle for the fifth consecutive time. This marks a record losing streak since 2018, and it is only the second time in Bitcoin's history that this has happened. More importantly, this is the first time a monthly candle has closed below the $73k resistance level since October 2024, which confirms that Bitcoin has officially lost this level across all larger timeframes.
My limit short order at $73k is still running and now it is more important than ever, because fundamentally there hasn't been any significant retest at the $73k level on the weekly and monthly charts. What makes me a bit nervous is that for the past four weeks, whenever it attempts to rise to $70k, it gets dumped immediately. However, what's strange is that even though it is being continuously rejected, the price is not falling sharply as if to "liquidate accounts" in a single day. It is gradually eroding, week after week. This doesn't seem to be a capitulation. A capitulation should be quick, strong, and wipe everything out in one fell swoop. What we are seeing seems like large funds are systematically unloading their positions and controlling the process more.
Usually, a strong capitulation is needed to form a bottom. That is the moment when "pain" reaches its peak, everyone who wants to sell has sold out, and there is no one left to offload. I still haven't seen that moment. The current sell-off is painful but still within control, and this way it could last longer than one might think.
My limit short order at $73k is still running and now it is more important than ever, because fundamentally there hasn't been any significant retest at the $73k level on the weekly and monthly charts. What makes me a bit nervous is that for the past four weeks, whenever it attempts to rise to $70k, it gets dumped immediately. However, what's strange is that even though it is being continuously rejected, the price is not falling sharply as if to "liquidate accounts" in a single day. It is gradually eroding, week after week. This doesn't seem to be a capitulation. A capitulation should be quick, strong, and wipe everything out in one fell swoop. What we are seeing seems like large funds are systematically unloading their positions and controlling the process more.
Usually, a strong capitulation is needed to form a bottom. That is the moment when "pain" reaches its peak, everyone who wants to sell has sold out, and there is no one left to offload. I still haven't seen that moment. The current sell-off is painful but still within control, and this way it could last longer than one might think.
0hoatay
·
--
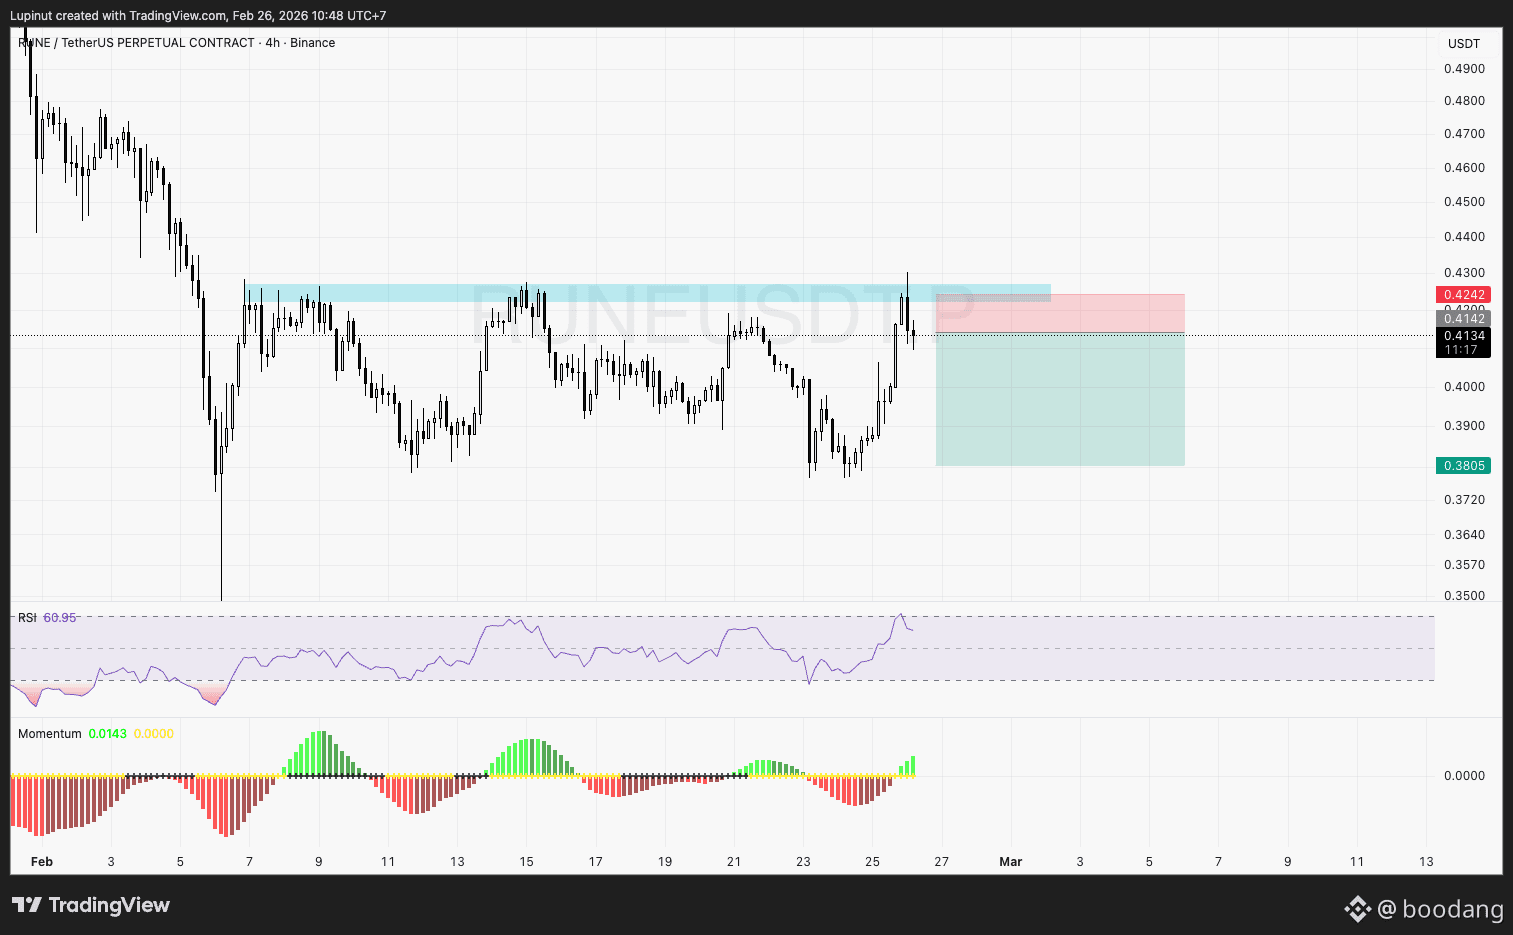
Bearish$RUNE Short 20x
Entry: 0.4132 (Market Entry)
DCA: No DCA
💸 Take-Profit:
1) 0.406
2) 0.395
3) 0.38
❌ Stop Loss: 0.431
Always leave some room for DCA, only risk 1-3% of your port, I don't know your risk tolerance
Set stops to entry as always when TP 1 hits.
Entry: 0.4132 (Market Entry)
DCA: No DCA
💸 Take-Profit:
1) 0.406
2) 0.395
3) 0.38
❌ Stop Loss: 0.431
Always leave some room for DCA, only risk 1-3% of your port, I don't know your risk tolerance
Set stops to entry as always when TP 1 hits.
0hoatay
·
--
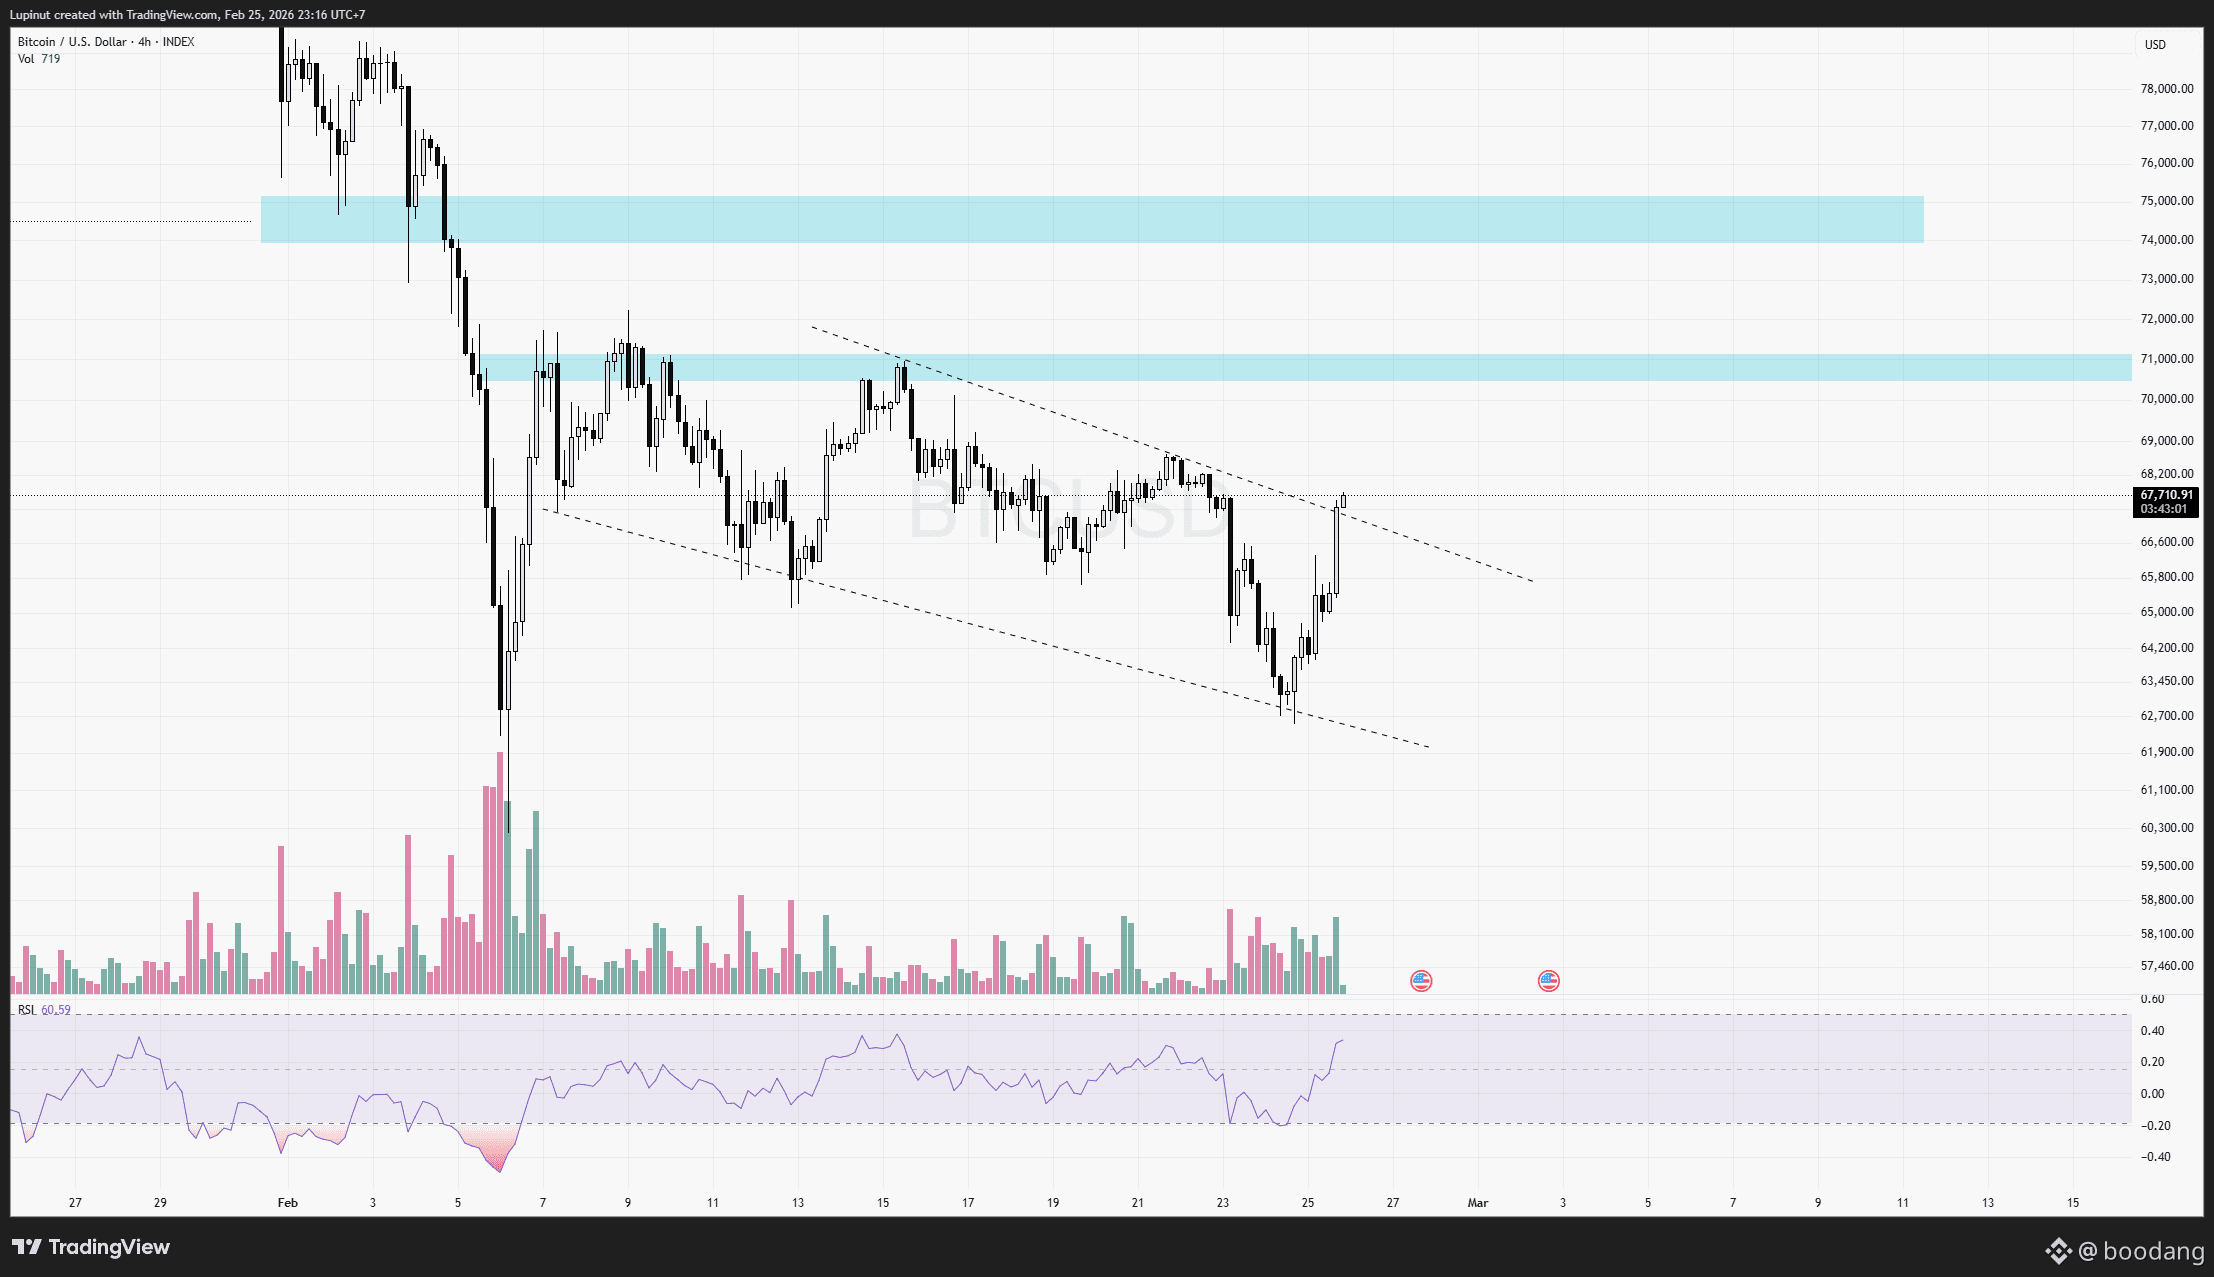
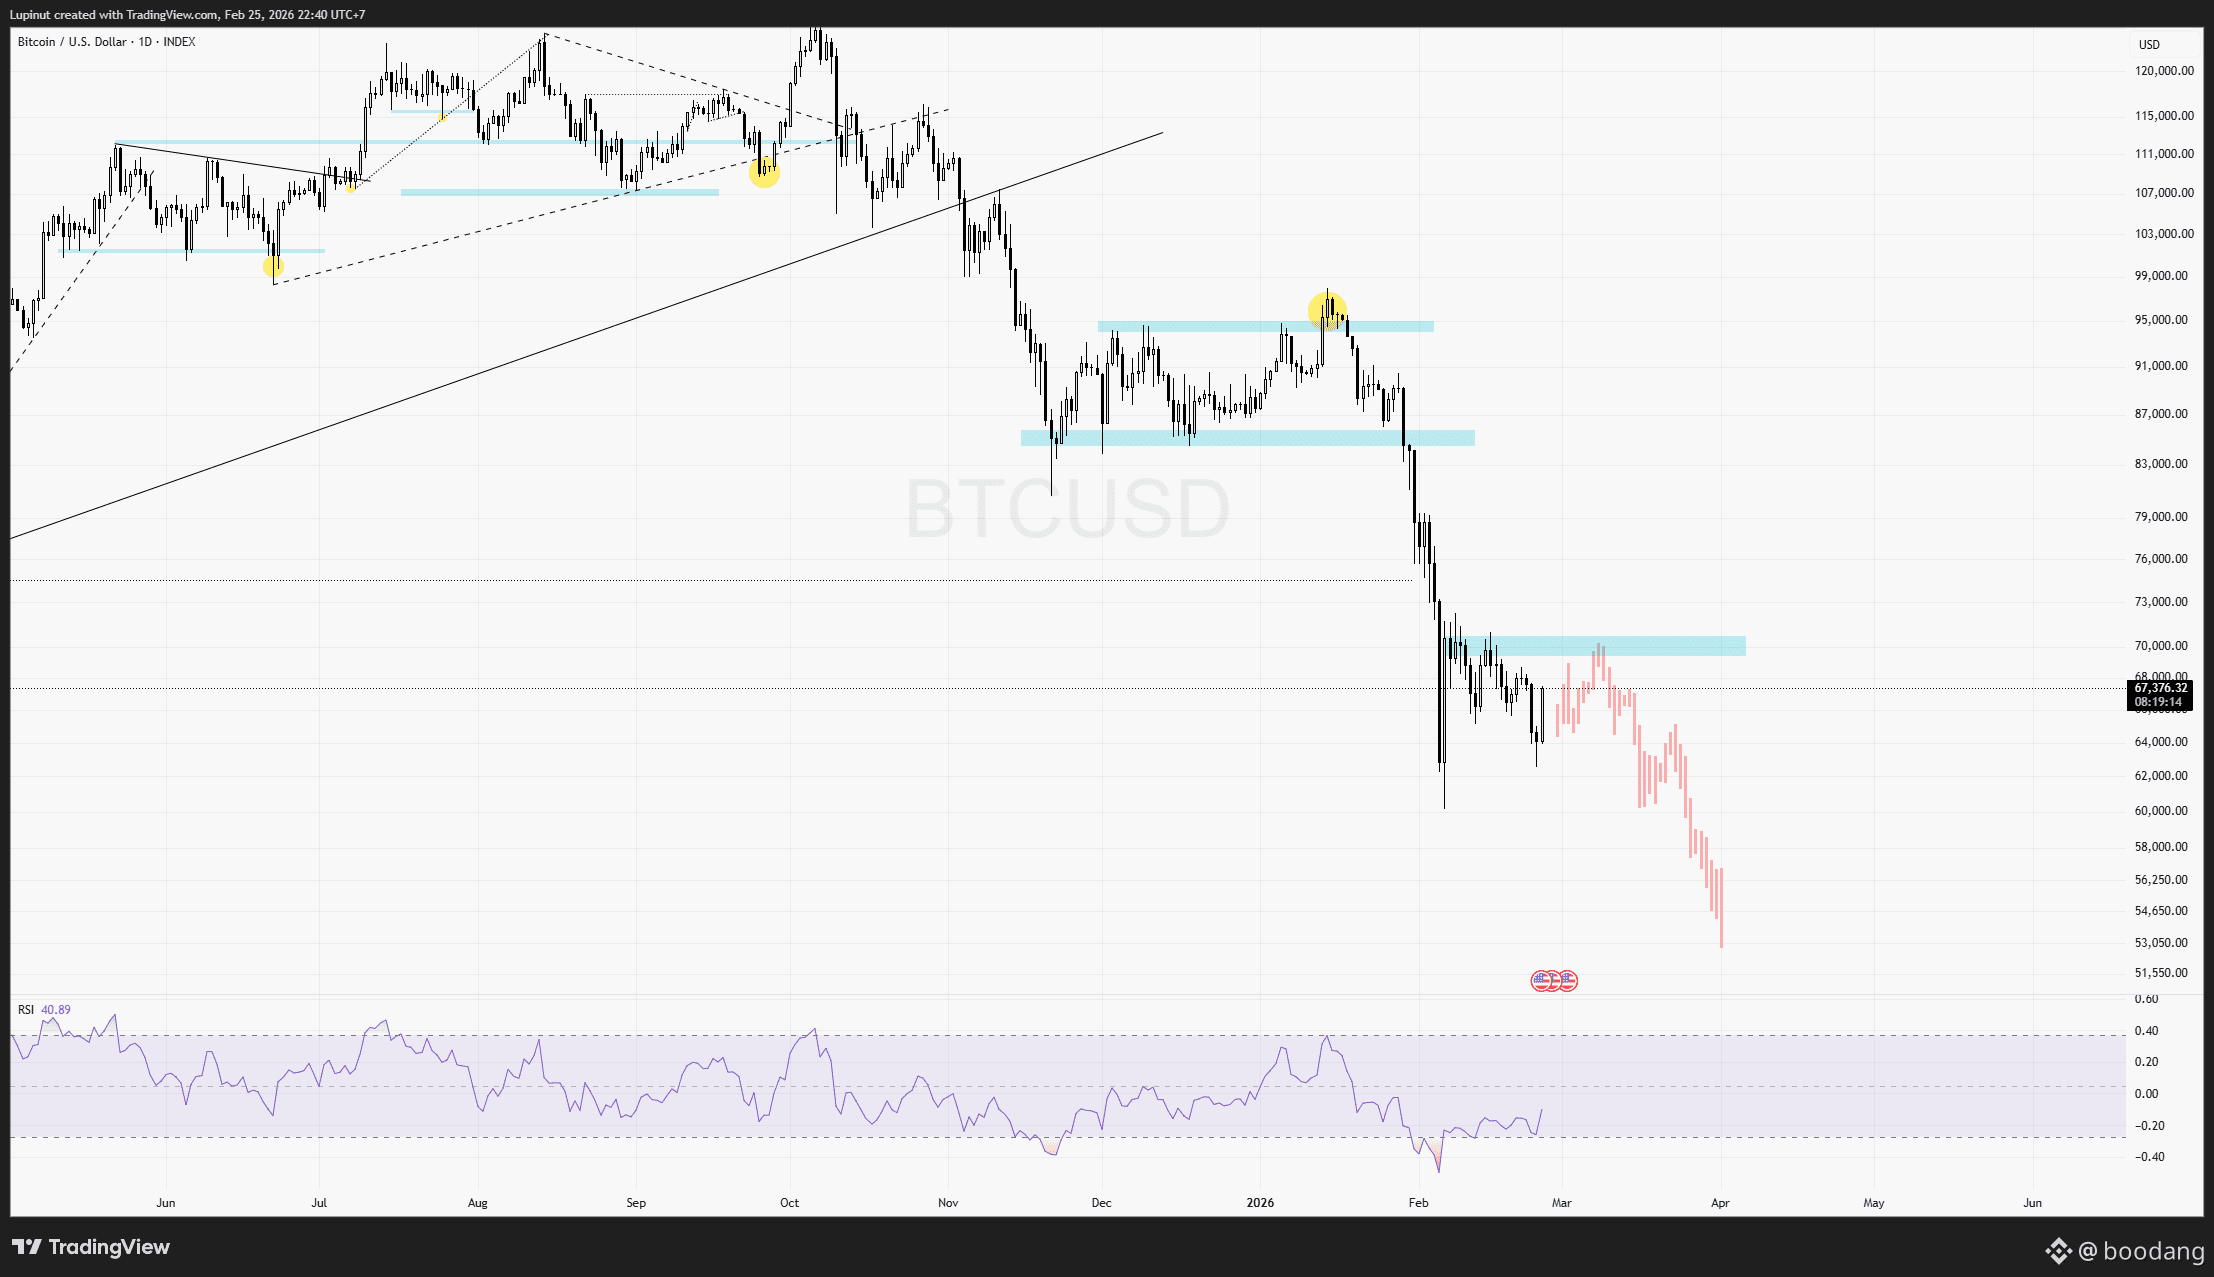
BearishLooking at the historical data, it's fascinating to track how closely this current downtrend is mimicking the 2022 price action (PA). While a perfect 1:1 replication all the way to the cycle lows seems unlikely, the correlation is strong enough to merit close observation over the coming weeks.
As previously noted, we have reached a critical juncture in this bar pattern; the next few days will determine whether the current PA begins to decouple or continues to follow the script.
Cycle Comparison and Support Zones
In the previous cycle at this exact stage, #bitcoin underwent a period of consolidation following an initial 30% drop. This was merely a pause before a second 30% leg down in the subsequent weeks.
According to the current chart analysis:
> Local Bottom: Potential support sits between $60K–$63K.
> Relief Rally: A bounce from that support could lead to a retest of the $70K–$75K range.
Projected Rejection: If the 2022 pattern holds, this upper range would act as a hard ceiling, leading to another rejection.
Technical Indicators and Divergence
It is worth noting that the $70K–$75K zone has consistently served as our primary resistance, even independent of these historical bar patterns. However, a key technical piece is currently missing: BTC has yet to form a 3D divergence.
The Divergence Factor: If $BTC attempts to test the $70K–$75K resistance without first establishing a High Time Frame (HTF) divergence, the likelihood of a sharp rejection increases significantly. Conversely, forming a 3D divergence prior to the test would provide a much more stable foundation for a potential breakout.
As previously noted, we have reached a critical juncture in this bar pattern; the next few days will determine whether the current PA begins to decouple or continues to follow the script.
Cycle Comparison and Support Zones
In the previous cycle at this exact stage, #bitcoin underwent a period of consolidation following an initial 30% drop. This was merely a pause before a second 30% leg down in the subsequent weeks.
According to the current chart analysis:
> Local Bottom: Potential support sits between $60K–$63K.
> Relief Rally: A bounce from that support could lead to a retest of the $70K–$75K range.
Projected Rejection: If the 2022 pattern holds, this upper range would act as a hard ceiling, leading to another rejection.
Technical Indicators and Divergence
It is worth noting that the $70K–$75K zone has consistently served as our primary resistance, even independent of these historical bar patterns. However, a key technical piece is currently missing: BTC has yet to form a 3D divergence.
The Divergence Factor: If $BTC attempts to test the $70K–$75K resistance without first establishing a High Time Frame (HTF) divergence, the likelihood of a sharp rejection increases significantly. Conversely, forming a 3D divergence prior to the test would provide a much more stable foundation for a potential breakout.
0hoatay
·
--
Maximizing Profits in the 2026 Crypto Market: A Comprehensive Guide
The cryptocurrency landscape has evolved significantly. Whether you are a cautious investor or a high-risk taker, here are the primary strategies to generate income in this digital economy:
1. Long-Term Investment
For those with limited time, focusing on foundational assets like BTC and ETH remains the most effective method. By using DCA over a 1-3 year period, investors can mitigate volatility. Historically, waiting for market bottoms - potentially around late 2026 - offers the best entry points.
2. Active Trading & Technical Analysis
Traders can profit from market fluctuations through various techniques:
- Scalping & Swing Trading: Capturing short to medium-term price movements.
- Arbitrage: Exploiting price differences between various exchanges or national markets.
- Futures & Leverage: Using borrowed funds to amplify gains
3. Participation in the Ecosystem
- Airdrops & Retroactives: While the "Golden Age" (2022–2025) has passed, 2026 focuses on high-quality contributions, such as active Discord roles or technical content creation.
- DeFi Opportunities: You can earn passive income (3–15% annually) through Staking, Lending, or providing liquidity on platforms like Aave or Uniswap.
- Nodes & Validators: Running blockchain nodes or "Restaking" assets to secure networks in exchange for rewards
4. Professional Careers in Crypto
You don’t need to trade to earn. The industry highly values:
- Technical Roles: Developers and security auditors.
- Creative Roles: Content creators, Marketing specialists, and Community Moderators.
- Analytical Roles: On-chain data analysts who track "Whale" movements to sell market insights
5. High-Risk, High-Reward Ventures
- Meme Coins: Entering early on new narratives can lead to massive returns, though the risk of total loss is high.
- MEV Bots: Using automated programs to capture value from the transaction mempool.
- NFT Flipping: Trading digital assets based on community hype and "whitelists"
Follow @Binance Vietnam to join the hype campaign #CreatorpadVN #Binance #BNB #CryptoVietnam #Blockchain
Looking for entry $BNB
1. Long-Term Investment
For those with limited time, focusing on foundational assets like BTC and ETH remains the most effective method. By using DCA over a 1-3 year period, investors can mitigate volatility. Historically, waiting for market bottoms - potentially around late 2026 - offers the best entry points.
2. Active Trading & Technical Analysis
Traders can profit from market fluctuations through various techniques:
- Scalping & Swing Trading: Capturing short to medium-term price movements.
- Arbitrage: Exploiting price differences between various exchanges or national markets.
- Futures & Leverage: Using borrowed funds to amplify gains
3. Participation in the Ecosystem
- Airdrops & Retroactives: While the "Golden Age" (2022–2025) has passed, 2026 focuses on high-quality contributions, such as active Discord roles or technical content creation.
- DeFi Opportunities: You can earn passive income (3–15% annually) through Staking, Lending, or providing liquidity on platforms like Aave or Uniswap.
- Nodes & Validators: Running blockchain nodes or "Restaking" assets to secure networks in exchange for rewards
4. Professional Careers in Crypto
You don’t need to trade to earn. The industry highly values:
- Technical Roles: Developers and security auditors.
- Creative Roles: Content creators, Marketing specialists, and Community Moderators.
- Analytical Roles: On-chain data analysts who track "Whale" movements to sell market insights
5. High-Risk, High-Reward Ventures
- Meme Coins: Entering early on new narratives can lead to massive returns, though the risk of total loss is high.
- MEV Bots: Using automated programs to capture value from the transaction mempool.
- NFT Flipping: Trading digital assets based on community hype and "whitelists"
Follow @Binance Vietnam to join the hype campaign #CreatorpadVN #Binance #BNB #CryptoVietnam #Blockchain
Looking for entry $BNB
0hoatay
·
--
Bearish$BTC - The Last Stand at $60k? 📉
I’m keeping it simple. Lower time frames aren't providing reliable price action right now, so I’m sticking strictly to the 1W and 1D.
The Levels that Matter:
1️⃣ Buying the Dip: Looking to DCA between $63k and $60.7k.
2️⃣ Risk Management: If $59.5k fails, the floor is gone.
3️⃣ Major Support: The Weekly SMA at $58,500 is where I plan to heavy-up for a scalp.
4️⃣ The Pivot: A move back above $66k is the only thing that makes me flip bullish for the upside.
Trade the plan, not the FOMO. 🧘♂️
I’m keeping it simple. Lower time frames aren't providing reliable price action right now, so I’m sticking strictly to the 1W and 1D.
The Levels that Matter:
1️⃣ Buying the Dip: Looking to DCA between $63k and $60.7k.
2️⃣ Risk Management: If $59.5k fails, the floor is gone.
3️⃣ Major Support: The Weekly SMA at $58,500 is where I plan to heavy-up for a scalp.
4️⃣ The Pivot: A move back above $66k is the only thing that makes me flip bullish for the upside.
Trade the plan, not the FOMO. 🧘♂️
Log in to explore more content