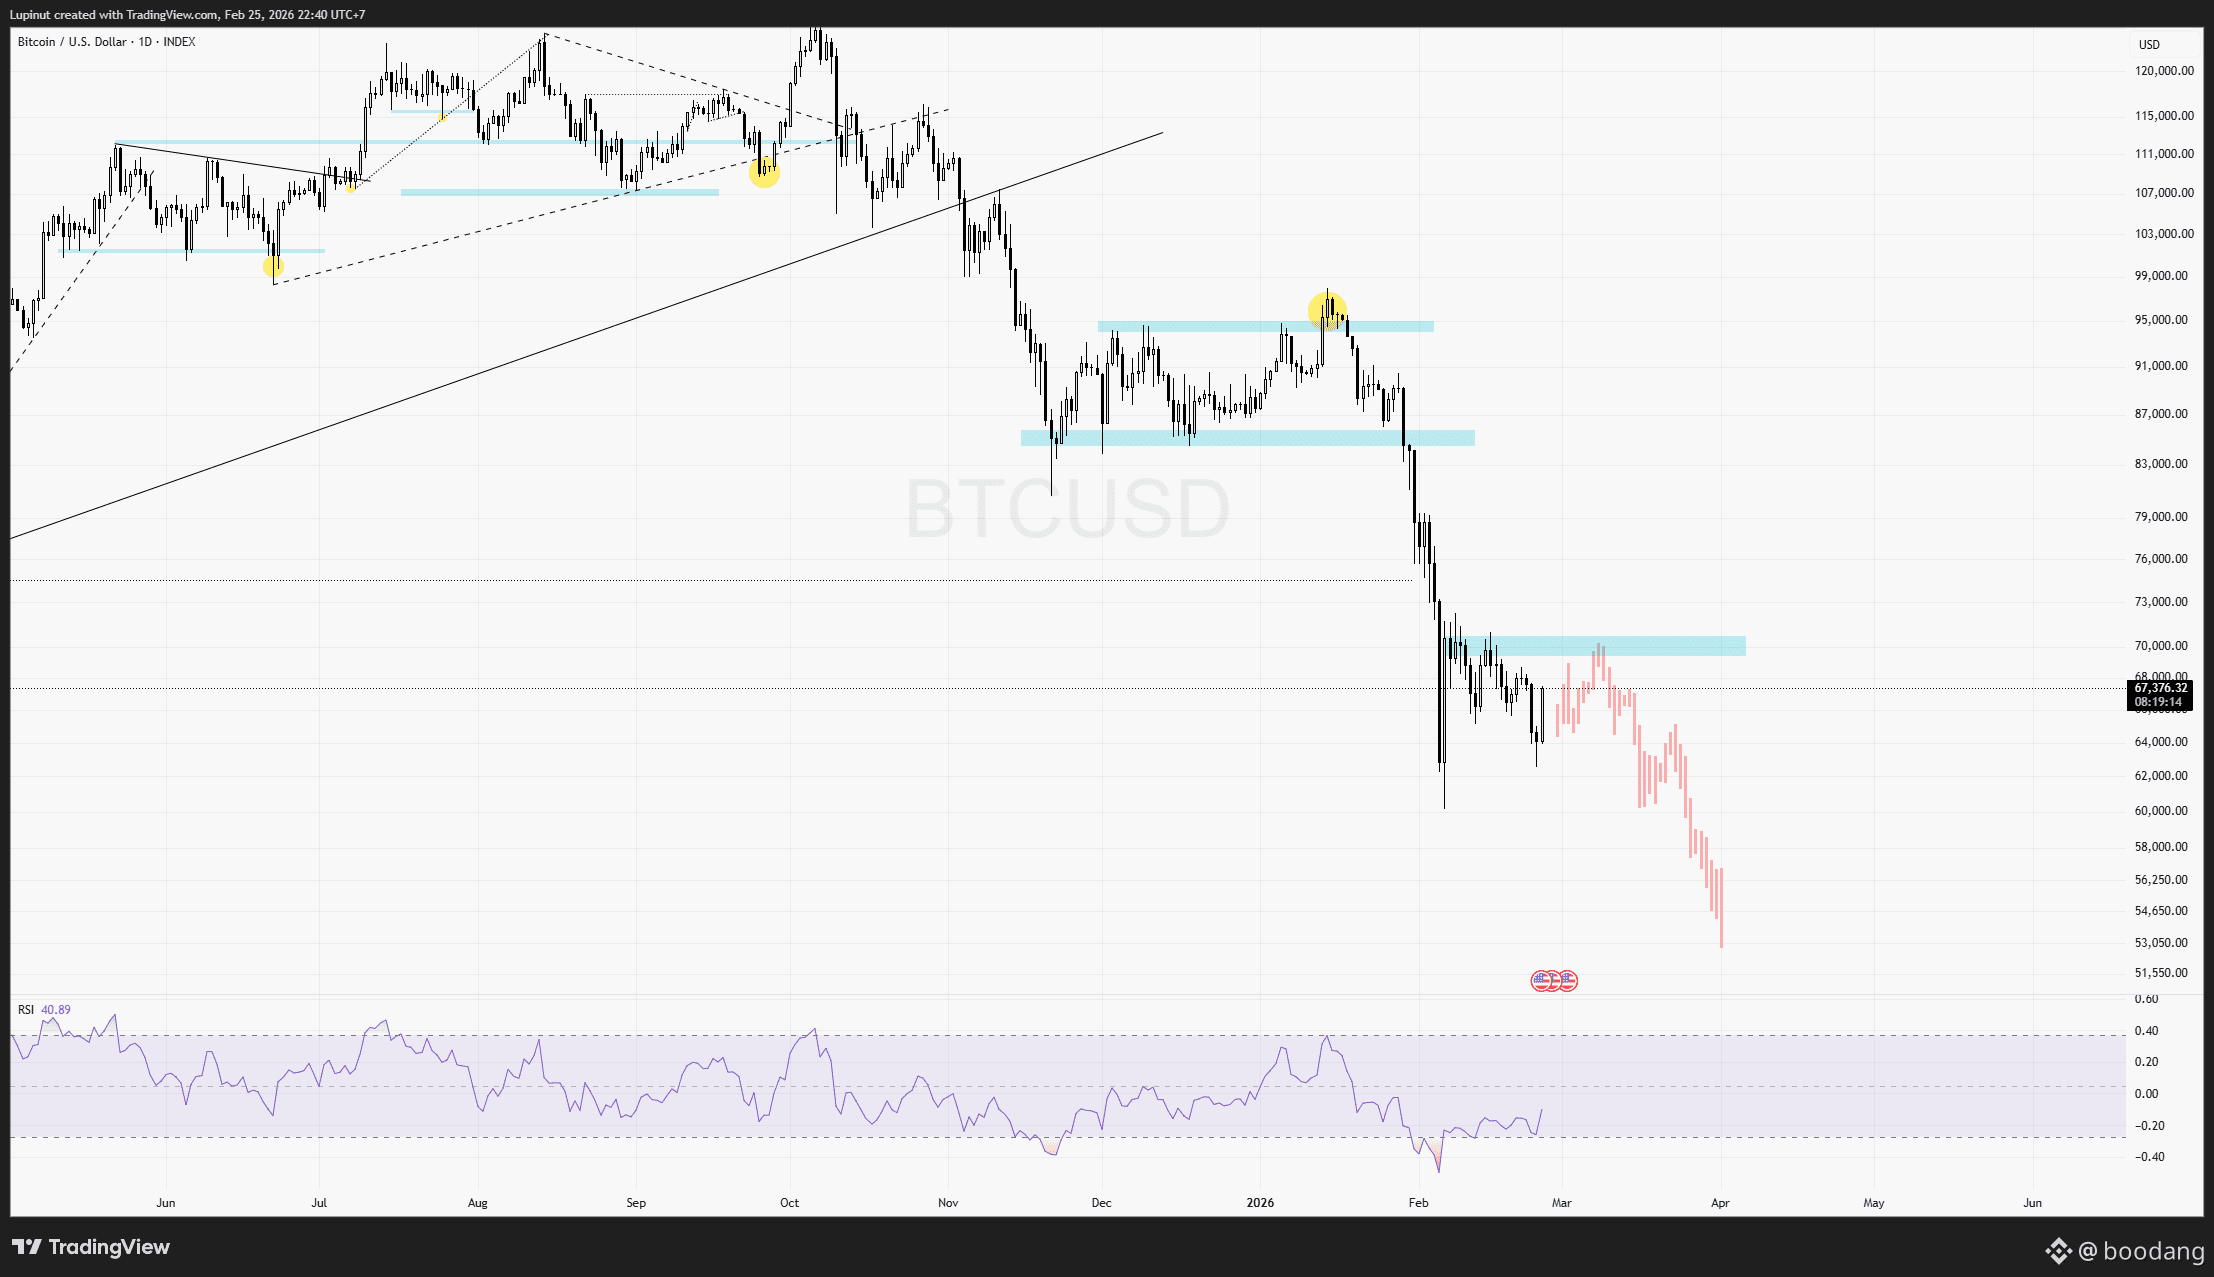
Looking at the historical data, it's fascinating to track how closely this current downtrend is mimicking the 2022 price action (PA). While a perfect 1:1 replication all the way to the cycle lows seems unlikely, the correlation is strong enough to merit close observation over the coming weeks.
As previously noted, we have reached a critical juncture in this bar pattern; the next few days will determine whether the current PA begins to decouple or continues to follow the script.
Cycle Comparison and Support Zones
In the previous cycle at this exact stage, #bitcoin underwent a period of consolidation following an initial 30% drop. This was merely a pause before a second 30% leg down in the subsequent weeks.
According to the current chart analysis:
> Local Bottom: Potential support sits between $60K–$63K.
> Relief Rally: A bounce from that support could lead to a retest of the $70K–$75K range.
Projected Rejection: If the 2022 pattern holds, this upper range would act as a hard ceiling, leading to another rejection.
Technical Indicators and Divergence
It is worth noting that the $70K–$75K zone has consistently served as our primary resistance, even independent of these historical bar patterns. However, a key technical piece is currently missing: BTC has yet to form a 3D divergence.
The Divergence Factor: If $BTC attempts to test the $70K–$75K resistance without first establishing a High Time Frame (HTF) divergence, the likelihood of a sharp rejection increases significantly. Conversely, forming a 3D divergence prior to the test would provide a much more stable foundation for a potential breakout.
As previously noted, we have reached a critical juncture in this bar pattern; the next few days will determine whether the current PA begins to decouple or continues to follow the script.
Cycle Comparison and Support Zones
In the previous cycle at this exact stage, #bitcoin underwent a period of consolidation following an initial 30% drop. This was merely a pause before a second 30% leg down in the subsequent weeks.
According to the current chart analysis:
> Local Bottom: Potential support sits between $60K–$63K.
> Relief Rally: A bounce from that support could lead to a retest of the $70K–$75K range.
Projected Rejection: If the 2022 pattern holds, this upper range would act as a hard ceiling, leading to another rejection.
Technical Indicators and Divergence
It is worth noting that the $70K–$75K zone has consistently served as our primary resistance, even independent of these historical bar patterns. However, a key technical piece is currently missing: BTC has yet to form a 3D divergence.
The Divergence Factor: If $BTC attempts to test the $70K–$75K resistance without first establishing a High Time Frame (HTF) divergence, the likelihood of a sharp rejection increases significantly. Conversely, forming a 3D divergence prior to the test would provide a much more stable foundation for a potential breakout.