

PKB 美股BTC黄金
70 Posts
PKB 美股BTC黄金
Report
Block User
3 Following
397 Followers
91 Liked
Posts
·
--
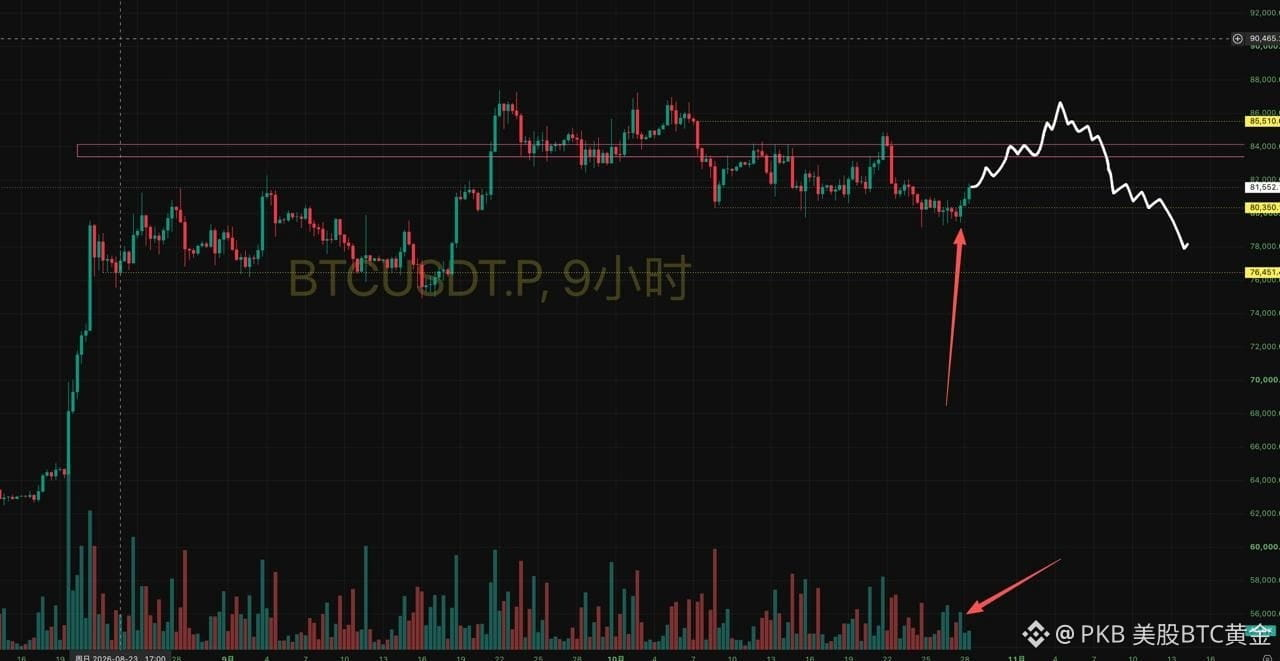
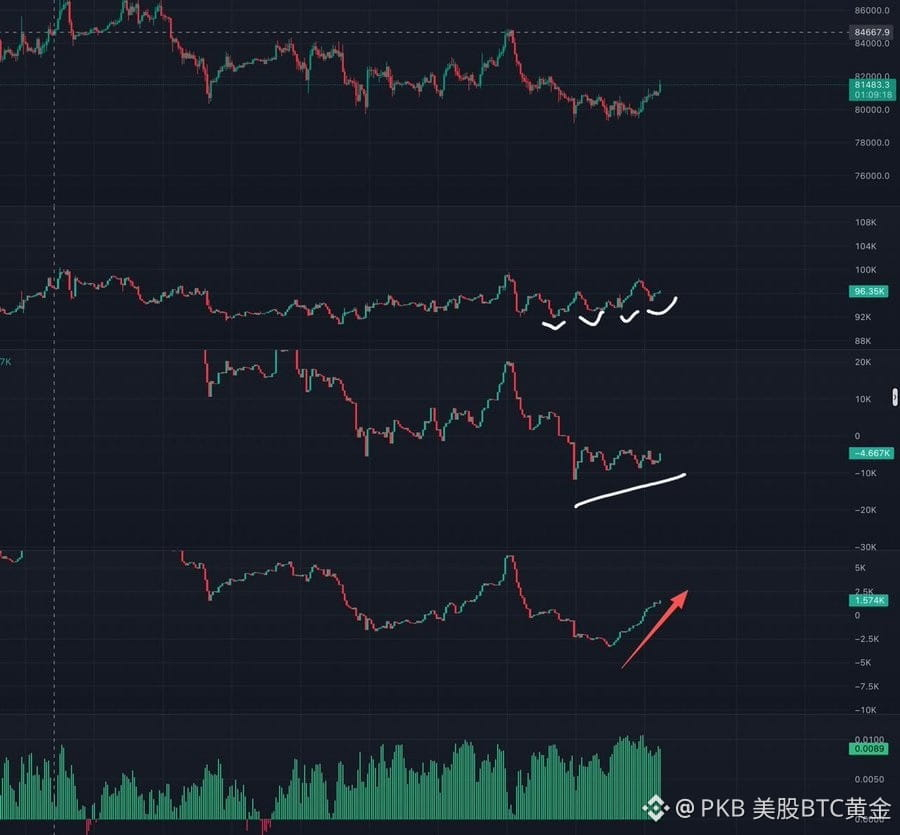
I’m still bearish on Bitcoin on the higher timeframes. For now, I’m watching for a rebound; the key is whether this 9-hour candle can close above 81,000.
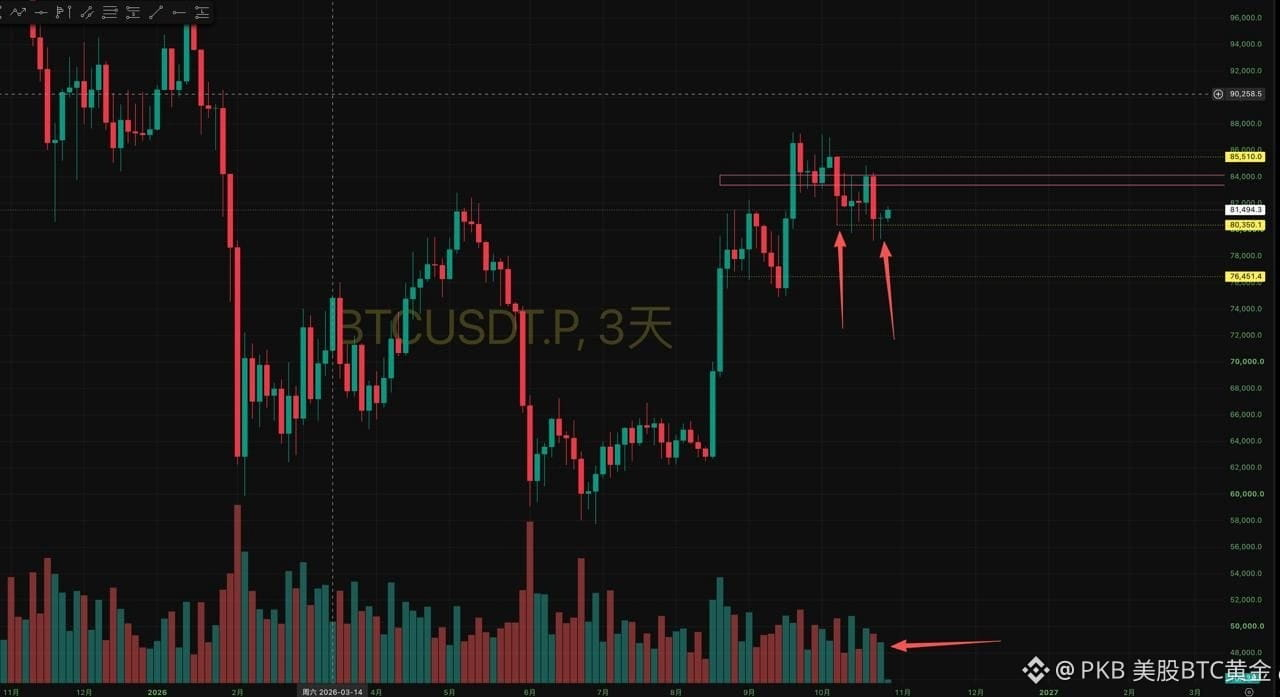
The 3-day chart is still holding above 80,000 within the consolidation range. The previous candle closed as a bullish pin bar. Although volume contracted slightly, this is still a range-bound market.
Last night, the 9-hour chart formed a bullish pin bar around 79,500, then started to rebound. If this candle can close above 81,000, that would confirm the anticipated move higher toward 83,300–84,300 after holding above that level. It could even fill the gap at 85,500. We’ll then watch how price reacts at those levels.
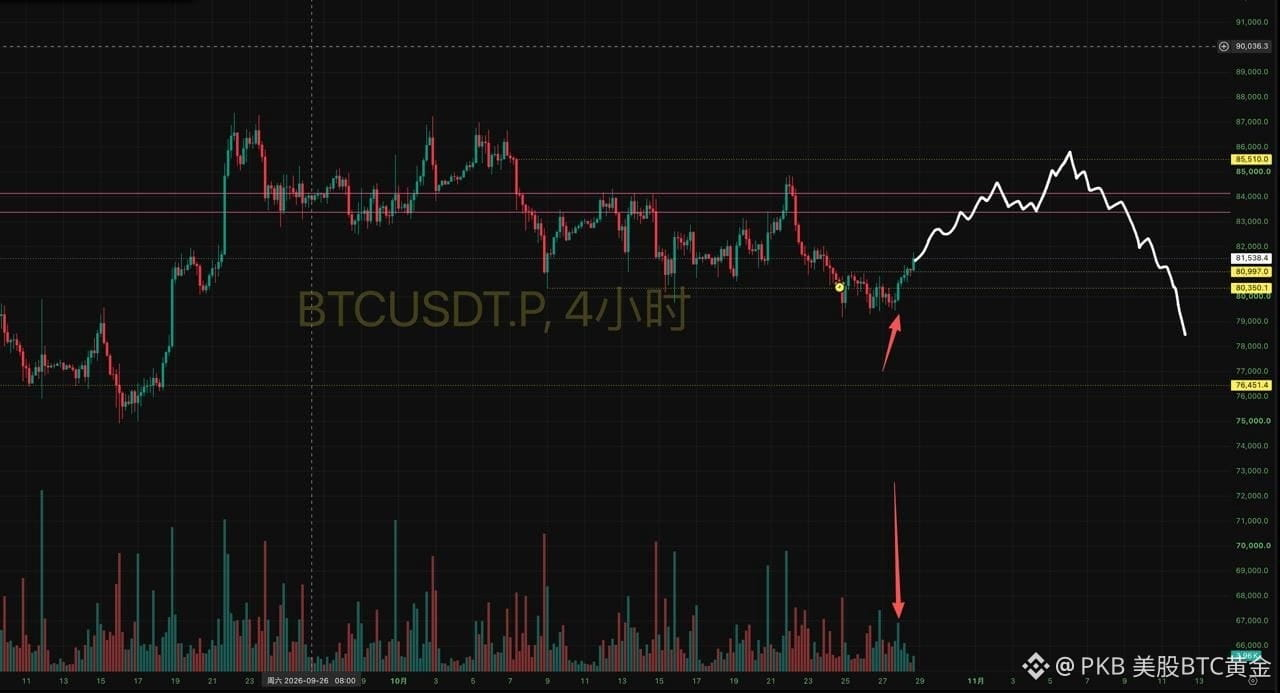
On the 4-hour chart, price also began moving higher on increased volume after forming a pin bar around 79,500 last night, and the rebound is continuing. If the 4-hour chart holds above 81,000, that would count as a strong breakout from the current small consolidation range, with 83,300–84,300 as the initial rebound target.
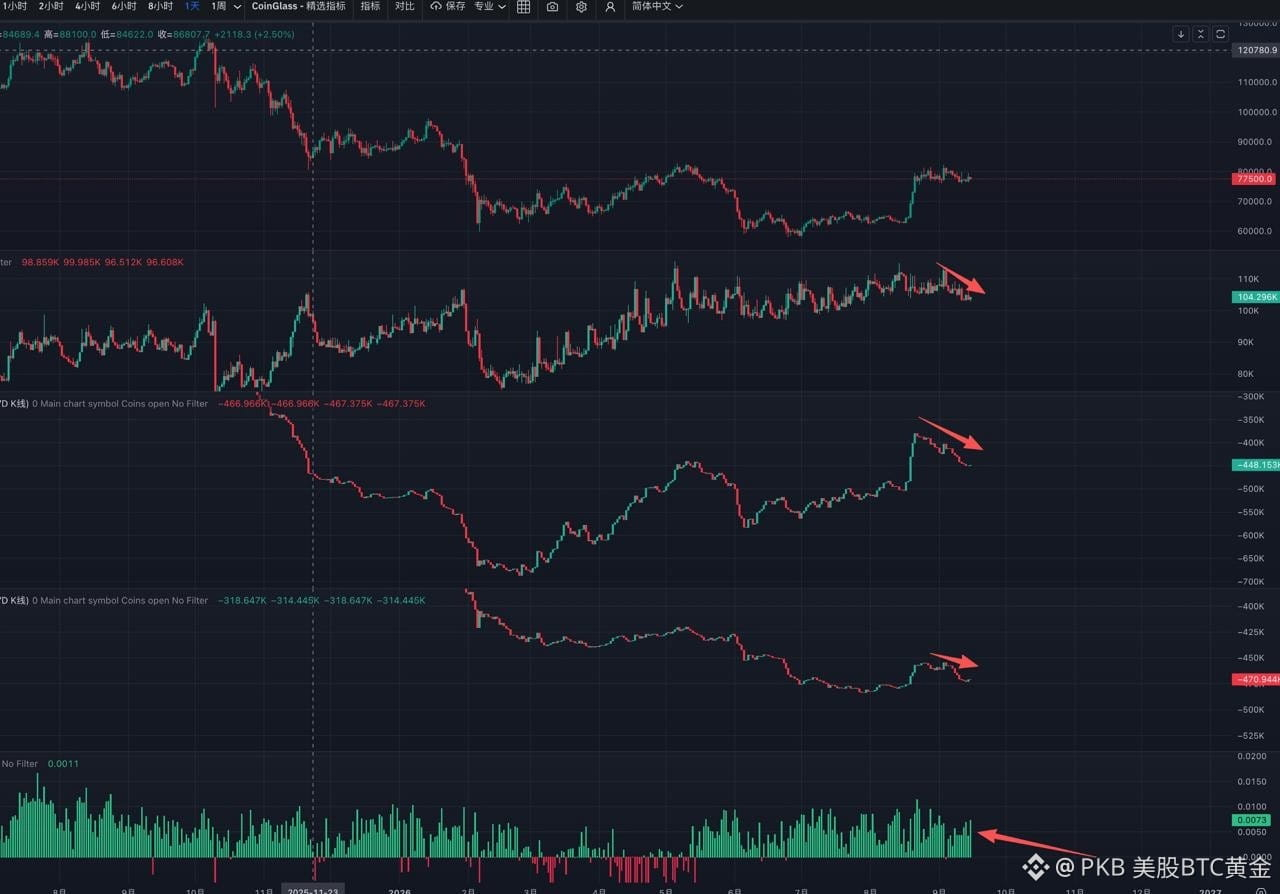
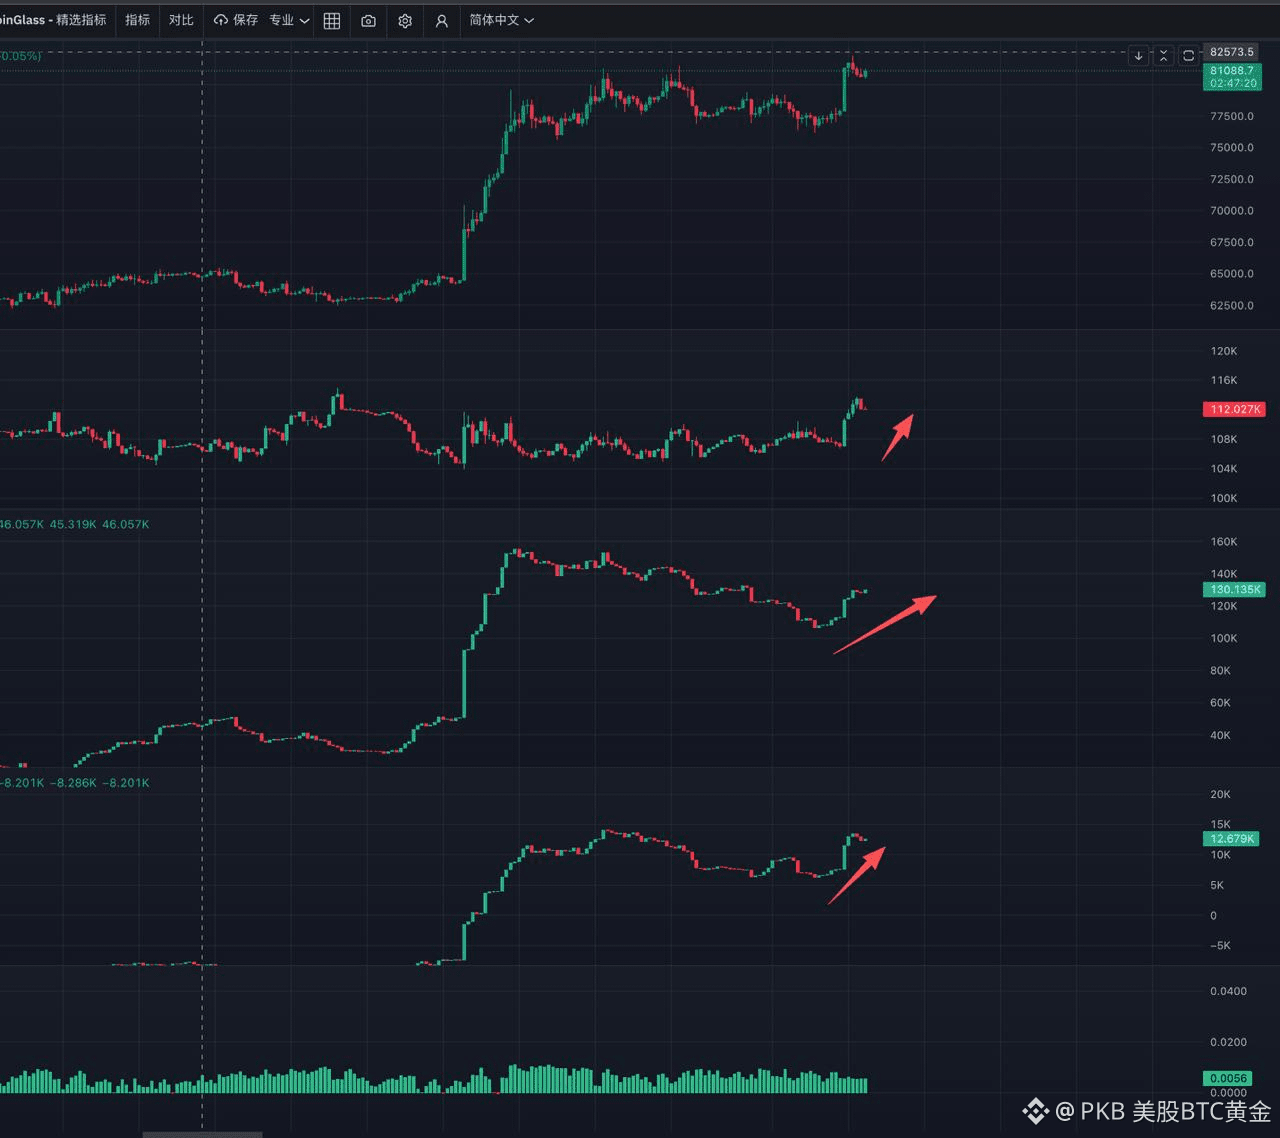
Looking at order flow, spot CVD has been rising steadily, and futures open interest has been building from the bottom, but futures CVD has yet to rise significantly. I think this rebound may still be driven mainly by spot buying.
When price rebounds to 83,300–84,300, we need to watch whether open interest rises sharply and whether futures CVD continues to climb at the same price levels. If futures CVD at those levels is lower than it was during the previous move, the outlook here would still lean bearish, and the broader trend would remain bearish.
#BTC
X: print_kbar
380
·
--
BTC is moving exactly as we expected here. It will most likely bounce first, then drop!
Guess whether I went long! 🤣
X: print_kbar
BTC is moving exactly as we expected here. It will most likely bounce first, then drop!
Guess whether I went long! 🤣
X: print_kbar
Guess whether I went long! 🤣
X: print_kbar

411
·
--
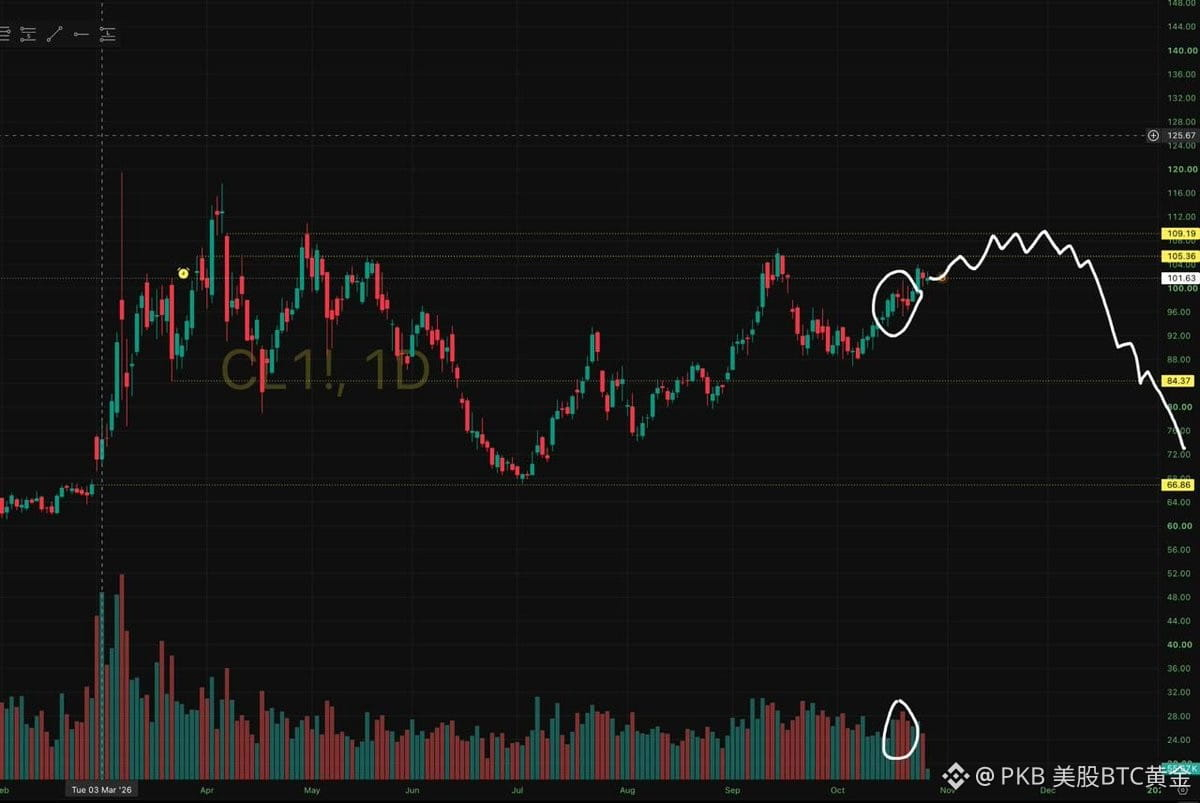
I think crude oil is likely to test 105~110, which would be a fairly significant resistance level.
If it tests this range again and there are signs of significant selling pressure, I’ll consider going short.
If crude oil meets resistance at 105~110, U.S. equities and risk assets overall may see a small rebound. I’ll decide what to do based on how prices react.
#CrudeOil
X:print_kbar
If it tests this range again and there are signs of significant selling pressure, I’ll consider going short.
If crude oil meets resistance at 105~110, U.S. equities and risk assets overall may see a small rebound. I’ll decide what to do based on how prices react.
#CrudeOil
X:print_kbar
1.7k
·
--
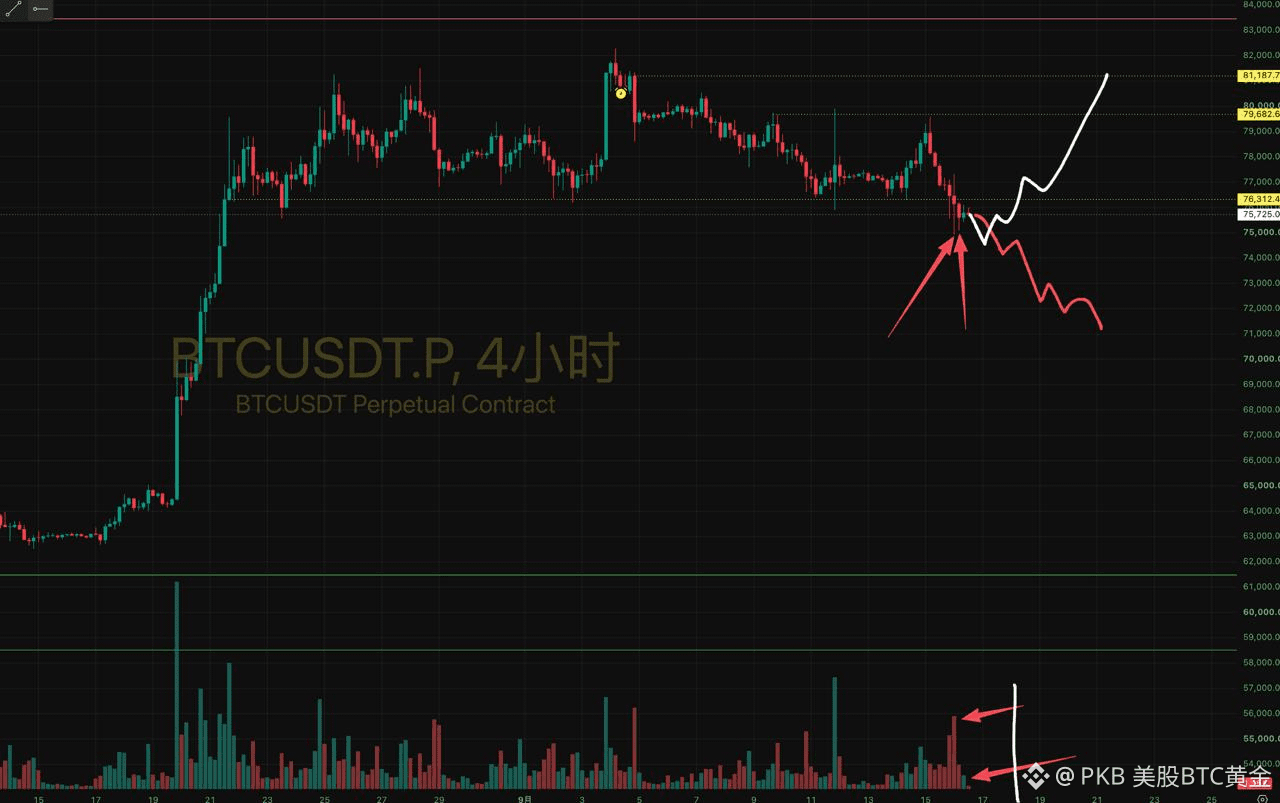
《📌 BTC Key Battle Line Showdown: If 76200 Can’t Hold, How to Trade?》
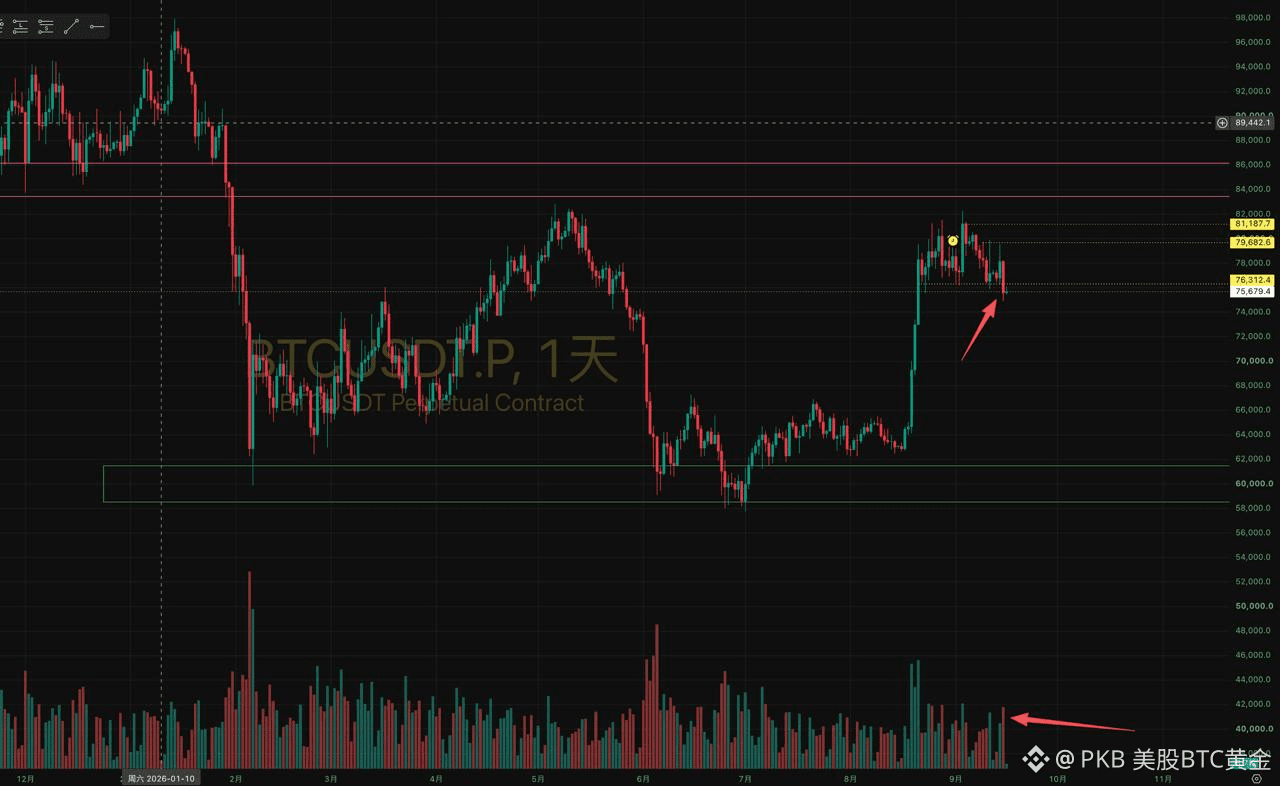
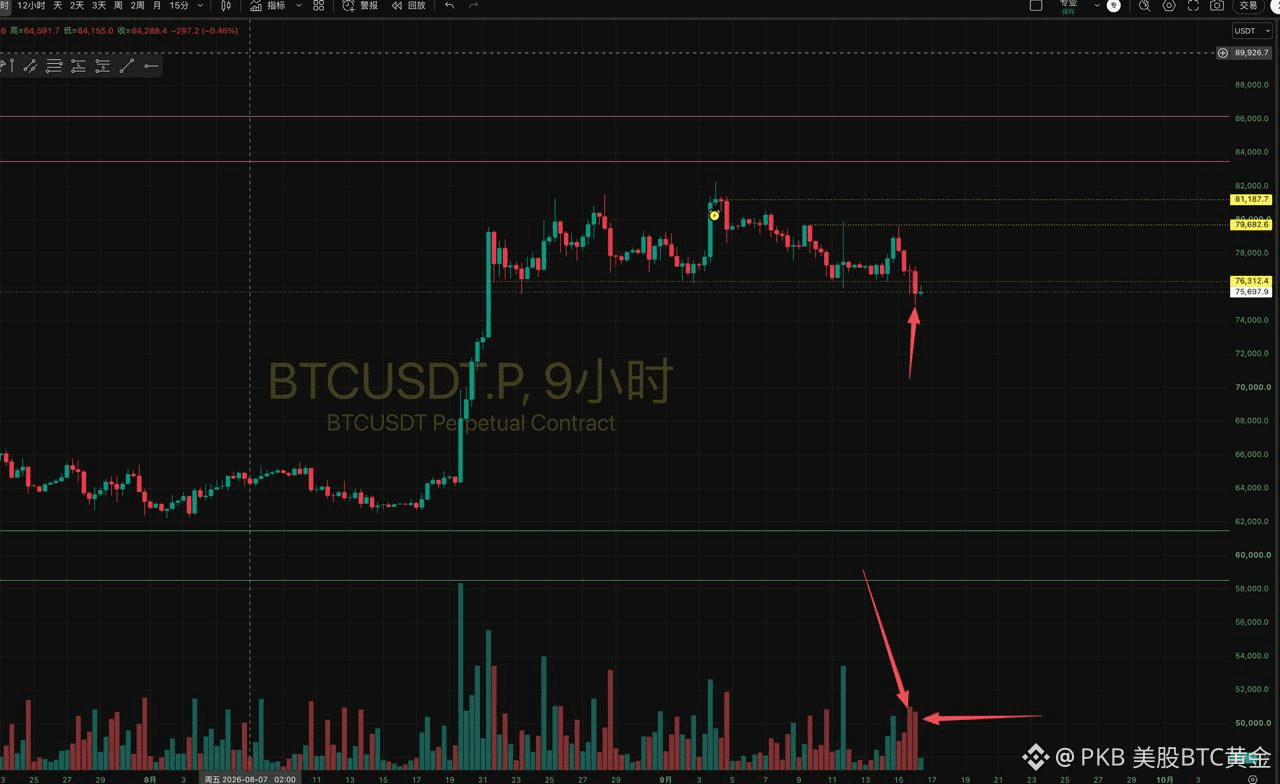
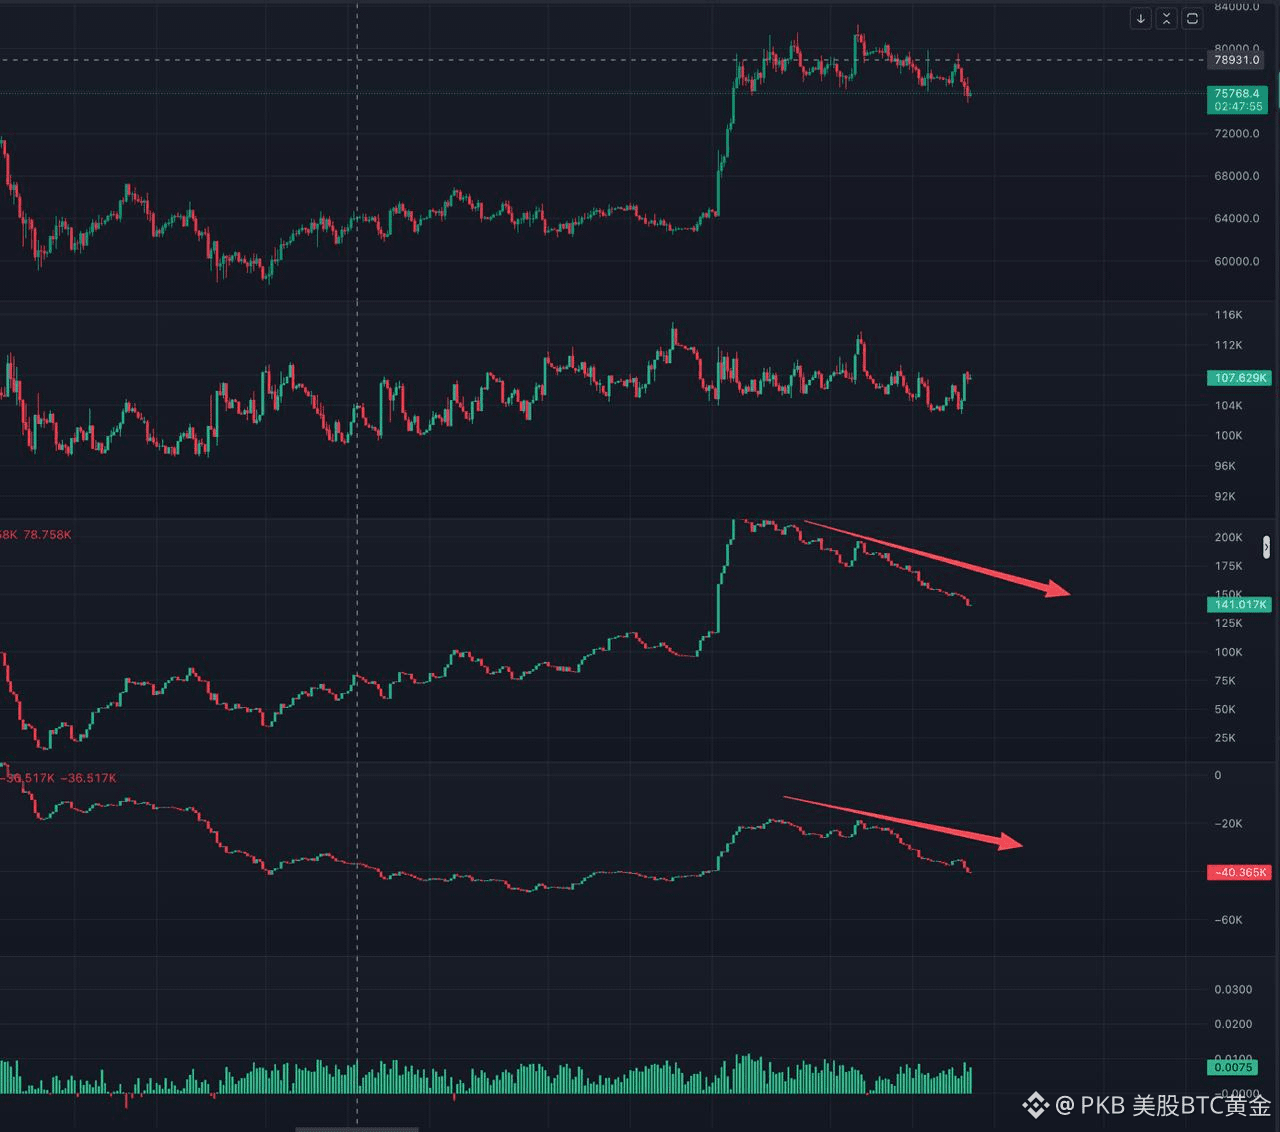
With a multi-period increase in volume and a downward move, combined with anomalies in the order book CVD, the outcome will be decided tonight. The trading scenarios are as follows:
🔸 Market Signals Breakdown:
Breakdown of Structure: The 3-day line and daily volume have broken below the 76200 key support, and the bullish momentum has severely weakened (see Figure 1 and Figure 3).
Lack of Demand: On the 4h timeframe there are lower wicks, but the bullish candle volume is weak. There is no proactive buying to step in, implying a need for a second retest of last night’s pin-lows (see Figure 4).
Main-Player Intent: During the consolidation phase, the contract and spot CVD continue to fall. Along with a decline in open interest, this indicates bulls are withdrawing and passive outflows are taking place (see Figure 5).
🔸 Trading Plan (Setup):
Bullish Reversal Scenario: On the 4h/daily, strong volume surges and a decisive reclaim above 76200 occurs, and the CVD turns upward ➔ then fill the long position all at once.
Bearish Breakout Scenario (Real Break Below): A second test of last night’s low fails to attract buyers and is not reclaimed ➔ wait for a weak rebound that is rejected in the 76000–76200 resistance zone to enter a short.
Right now, the overall crypto market is in a flat/empty posture. We’ll wait for tonight’s 4h close confirmation. Please like and save to cross-check with the chart.
Do you think tonight’s 76200 will turn into a real breakdown, or a false breakout followed by a reclaim?
2
633
·
--
Bullish
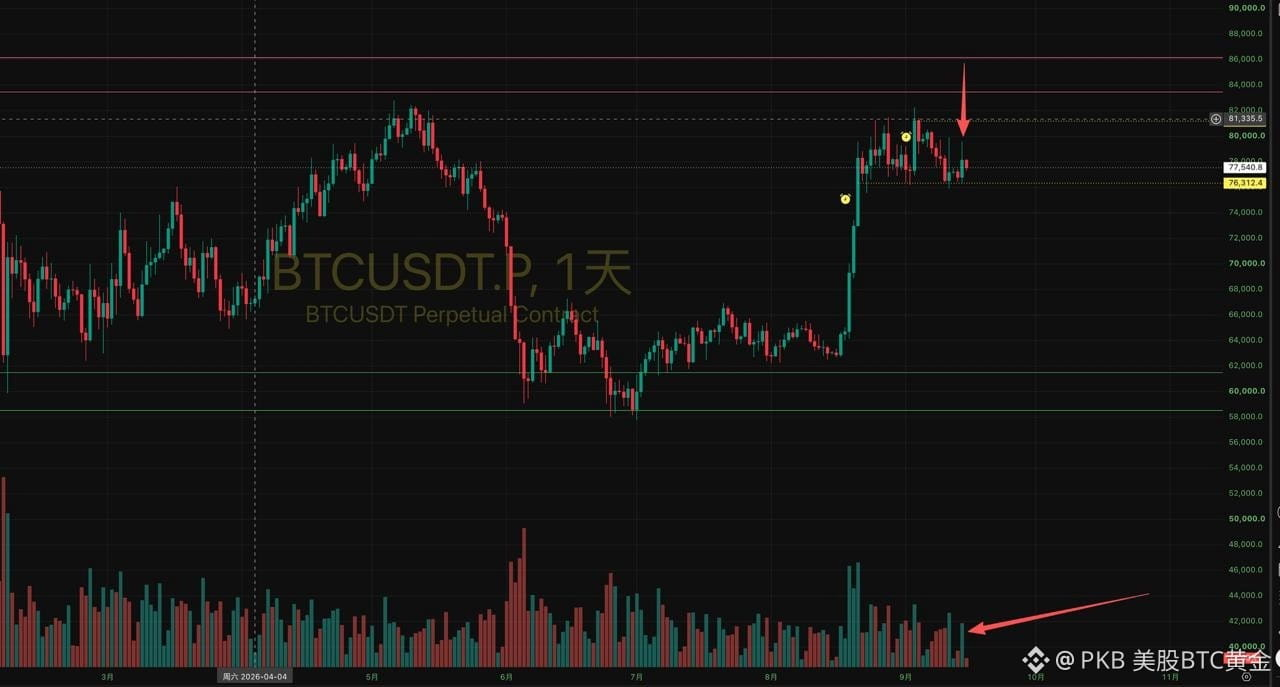
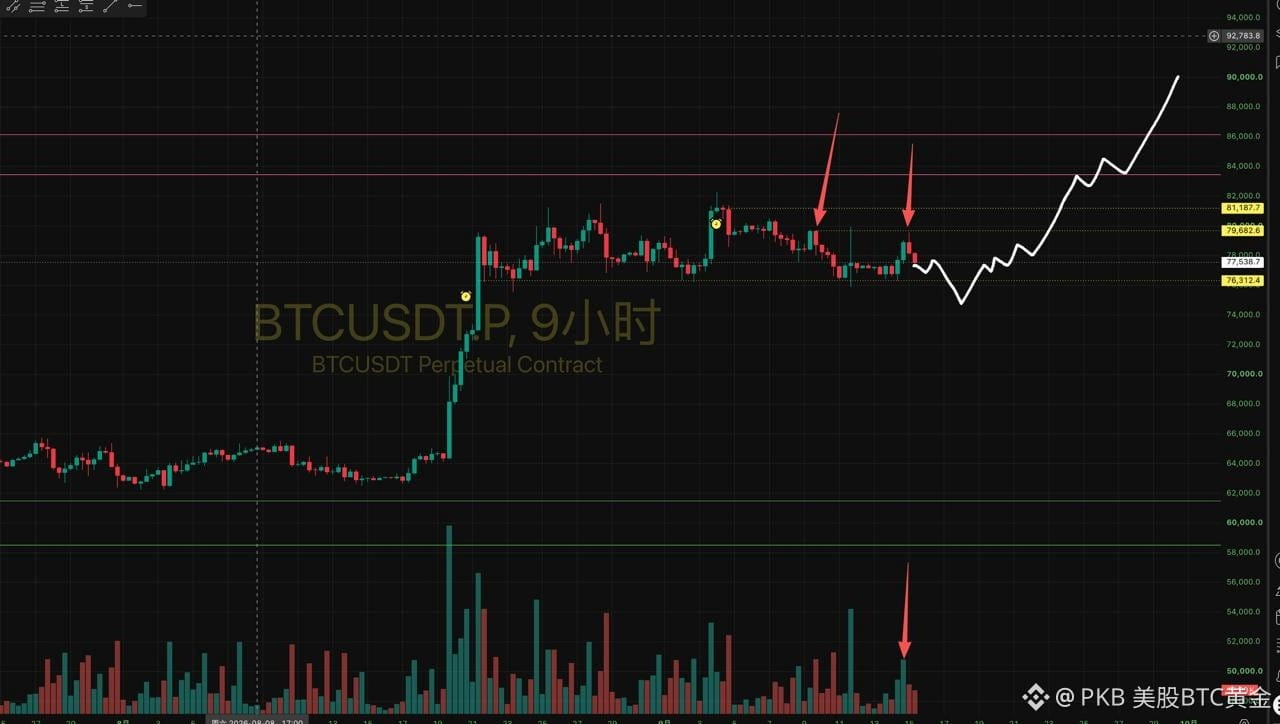
《📌 BTC Enters a Choppy Consolidation: Key Turning Point at 76.2k—Fake Breakdown and a Complete Execution System (Save This)》
Currently, the daily and 9H charts show continuous large-volume upward probing that gets rejected (Chart 1 and Chart 3). The overall price action remains above the critical support zone at 76,200, with broad-range consolidation.
👉 Order Book Micro-Divergence (Chart 2):
🔸 Open Interest (OI) is falling; spot and futures CVD continue to trend lower. This reflects large longs closing positions within the range, along with continuous spot outflows.
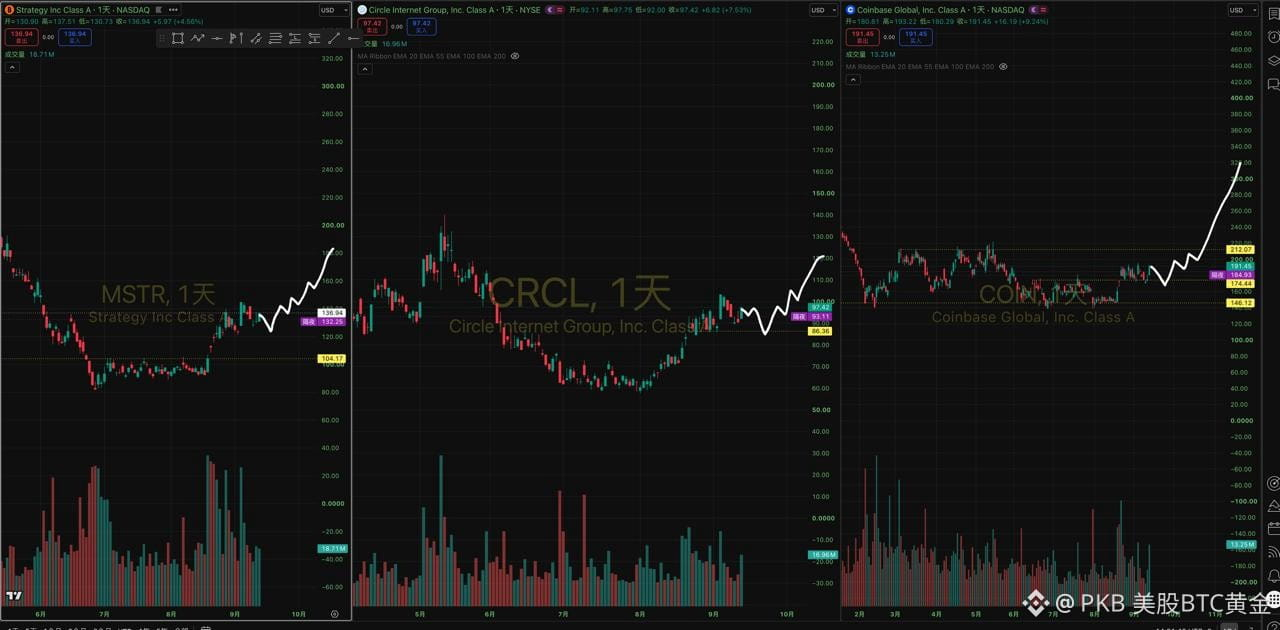
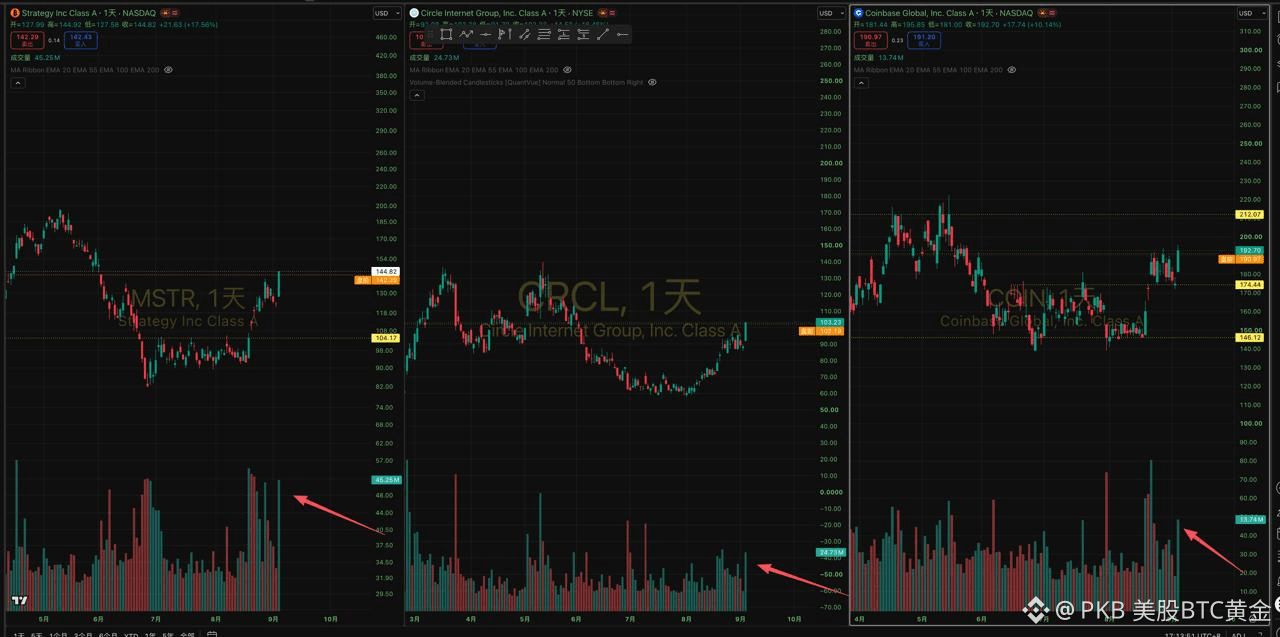
🔸 Funding rates remain positive, but the price hasn’t broken down. Combined with the high-level, sideways consolidation pattern where US stocks like MSTR and CRCL have been steadily stabilizing from their bottoms (Chart 4), this area is more consistent with an upward continuation rather than a top reversal.
👉 Trade Execution Strategy (Trade Plan):
🔸 Position handling: The earlier long positions near 71,200 have been protected with break-even risk control. Hold with zero-tolerance-to-mistakes cost.
🔸 Adding to longs (conditions): If price dips below 76,200 to trigger a false breakdown, then quickly reclaims it on expanding volume (a Spring fake-out), enter on the right side to add longs. Targets: 86,000–90,000.
🔸 Defense (stop-loss): If heavy volume drives price through 76,200 and the subsequent retest fails to reclaim it, close at break-even and exit to observe.
The deciding factor for longs vs shorts is at 76,200. Are you planning to wait for a breakdown and then a reclaim to catch the long with a bearish close, or follow the breakdown and chase the short directly?
916
·
--
Bullish
#ETH
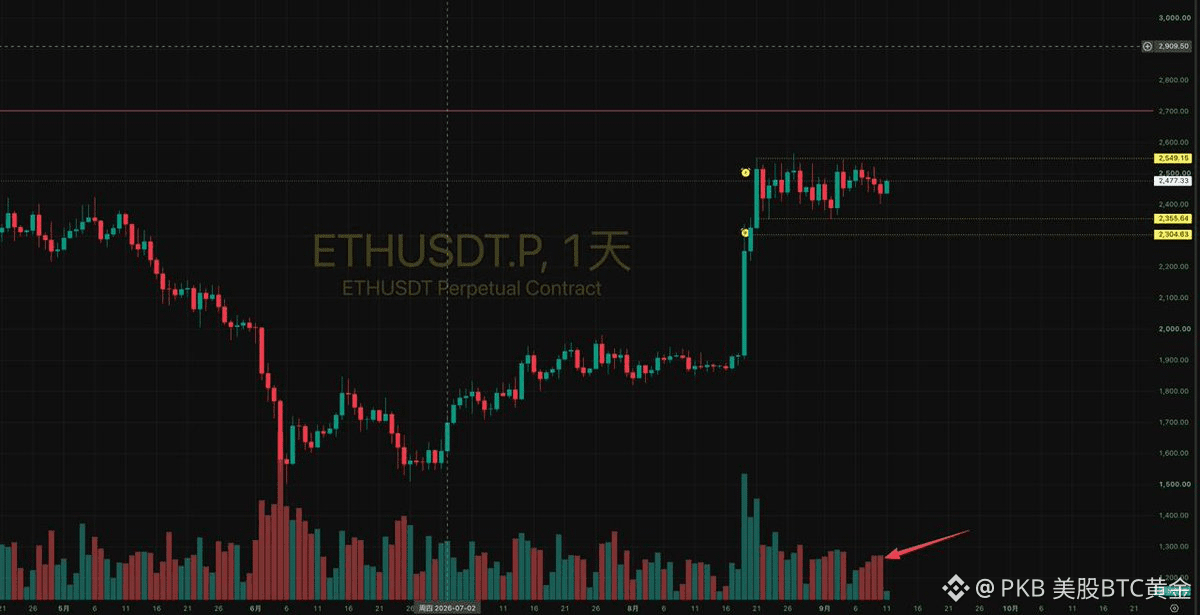
Ethereum is currently also trading sideways. The daily chart shows increased volume on a selloff. This expectation remains unchanged. On the daily chart, watch for a wick into the 2350–2300 area. If price can break down and then reclaim, it should continue rising; if it breaks down and cannot be reclaimed, then it’s done!
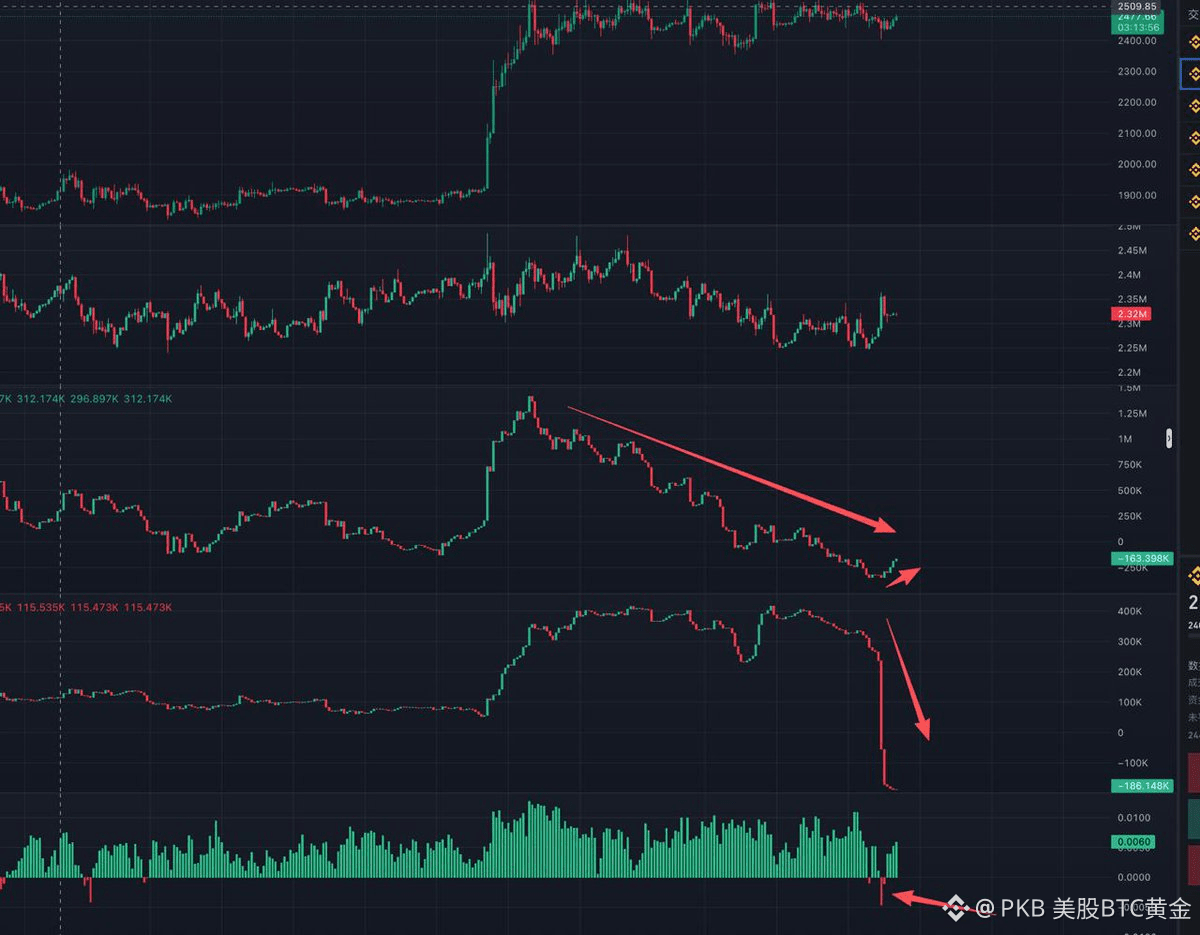
In the Ethereum order book, you can see that the contract CVD has hit a new low. At the same time, during yesterday’s drop, the spot CVD fell sharply and the funding rate turned negative. This suggests that a number of spot/contract long positions have been liquidated and that there is also spot selling, yet the price is still oscillating within this range. This indicates that price support is still fairly strong. Going forward, it depends on how the bulls and bears fight it out. If it’s strong, follow the wick pattern on BTC/“big coin,” and then it starts to rise. If it’s weak and breaks below 2350 without reclaiming, then there’s nothing left!
1
2
2.6k
·
--
Bullish
#BTC
The daily chart of BTC shows a big-bullish rise followed by increased volume and a selloff. Here it has reached a key support at 762. At the moment, there are two daily-chart scenarios: one is that it breaks below 762 directly, fails to rebound, and then continues to fall; the other is that it breaks down below 762 and then reclaims it, and then starts the next wave of upward movement!
Looking at the 4-hour chart, it can be seen that near 762 the rebound bullish candles lack sufficient demand. Most likely, this is going to be a “prick” (a quick wick into the level). Just based on the 4-hour chart: if in the future it does a volume “prick” into 762, then breaks down, and the breakdown is followed by a volume reclaim, then it would be bullish. If, after breaking below 762 with volume, it later attempts a rebound but does not rise back above 762 due to low volume, then it would continue to fall. Overall, the uptrend is probably gone!
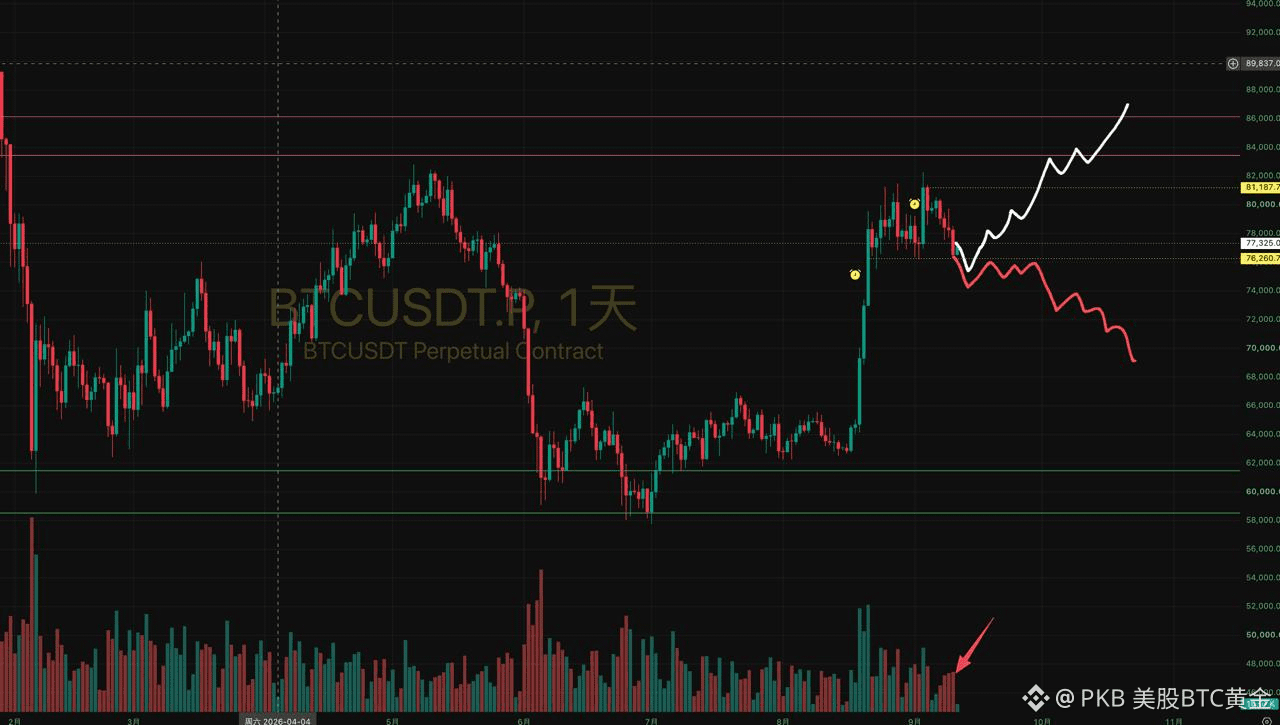
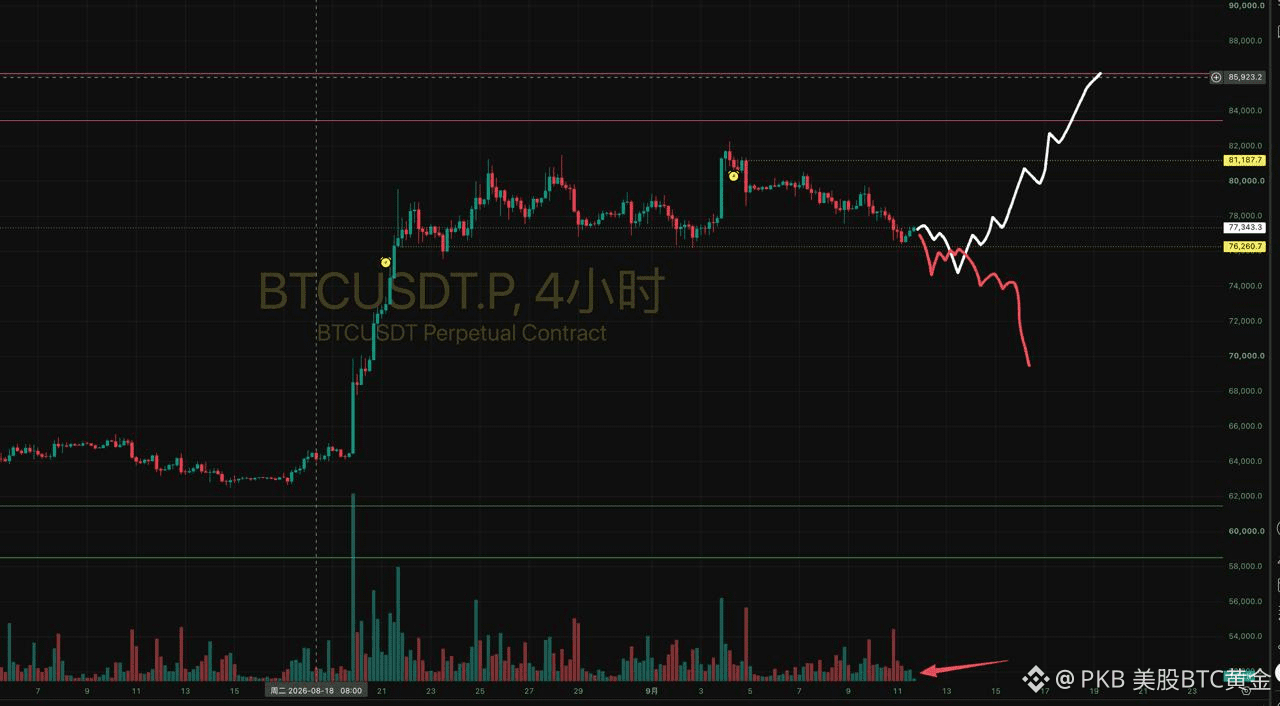
1
2
2.9k
·
--
Bullish
#BTC
From the 4H perspective, it tested around the previous low of 786 before Friday’s drop, but there wasn’t strong demand. So, most likely it will continue to drop toward around 762. If, around 762, we see a move that breaks down on increased volume and then quickly recovers, then I think the next wave of rebound will most likely begin!
From the order book, after more than half a month of consolidation, the profitable long positions have all run out. At the same time, short positions have started to appear. The amplitude is still only relatively small fluctuations. In my view, this is still a continuation of the uptrend!
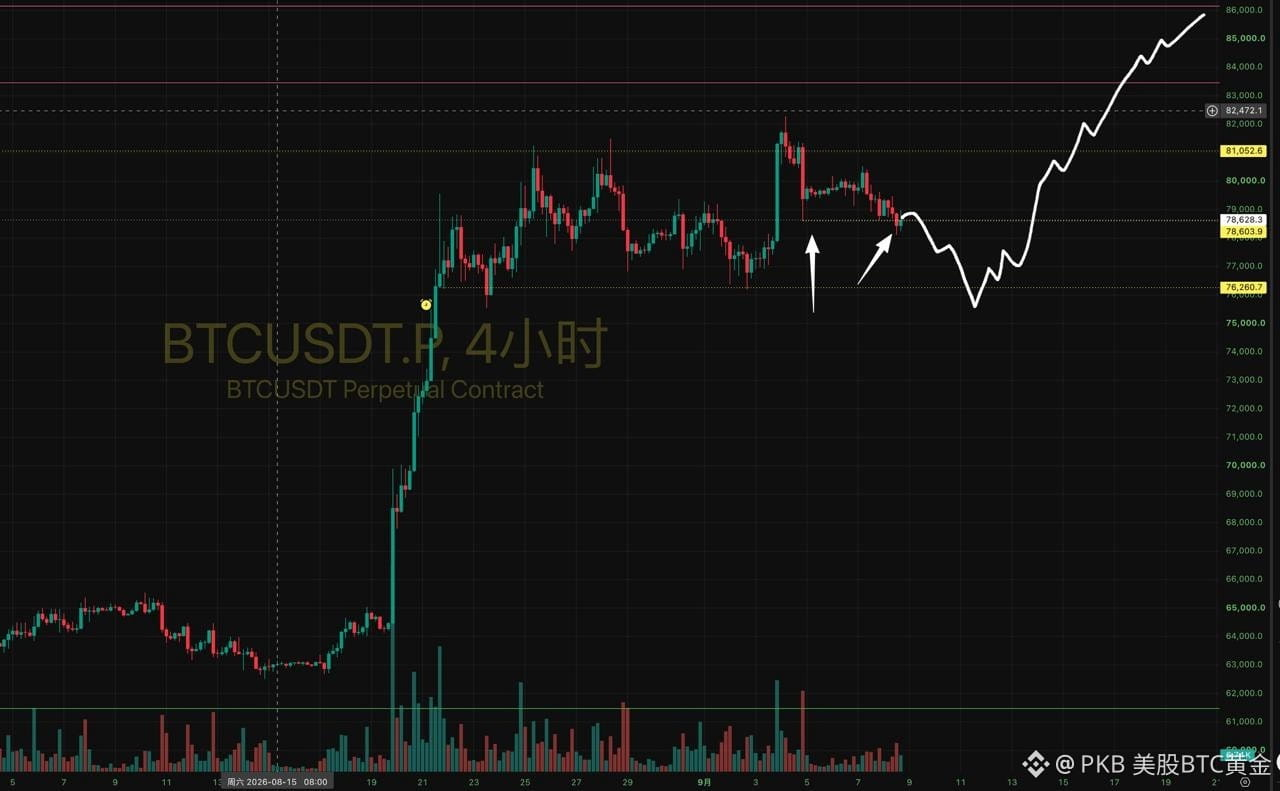
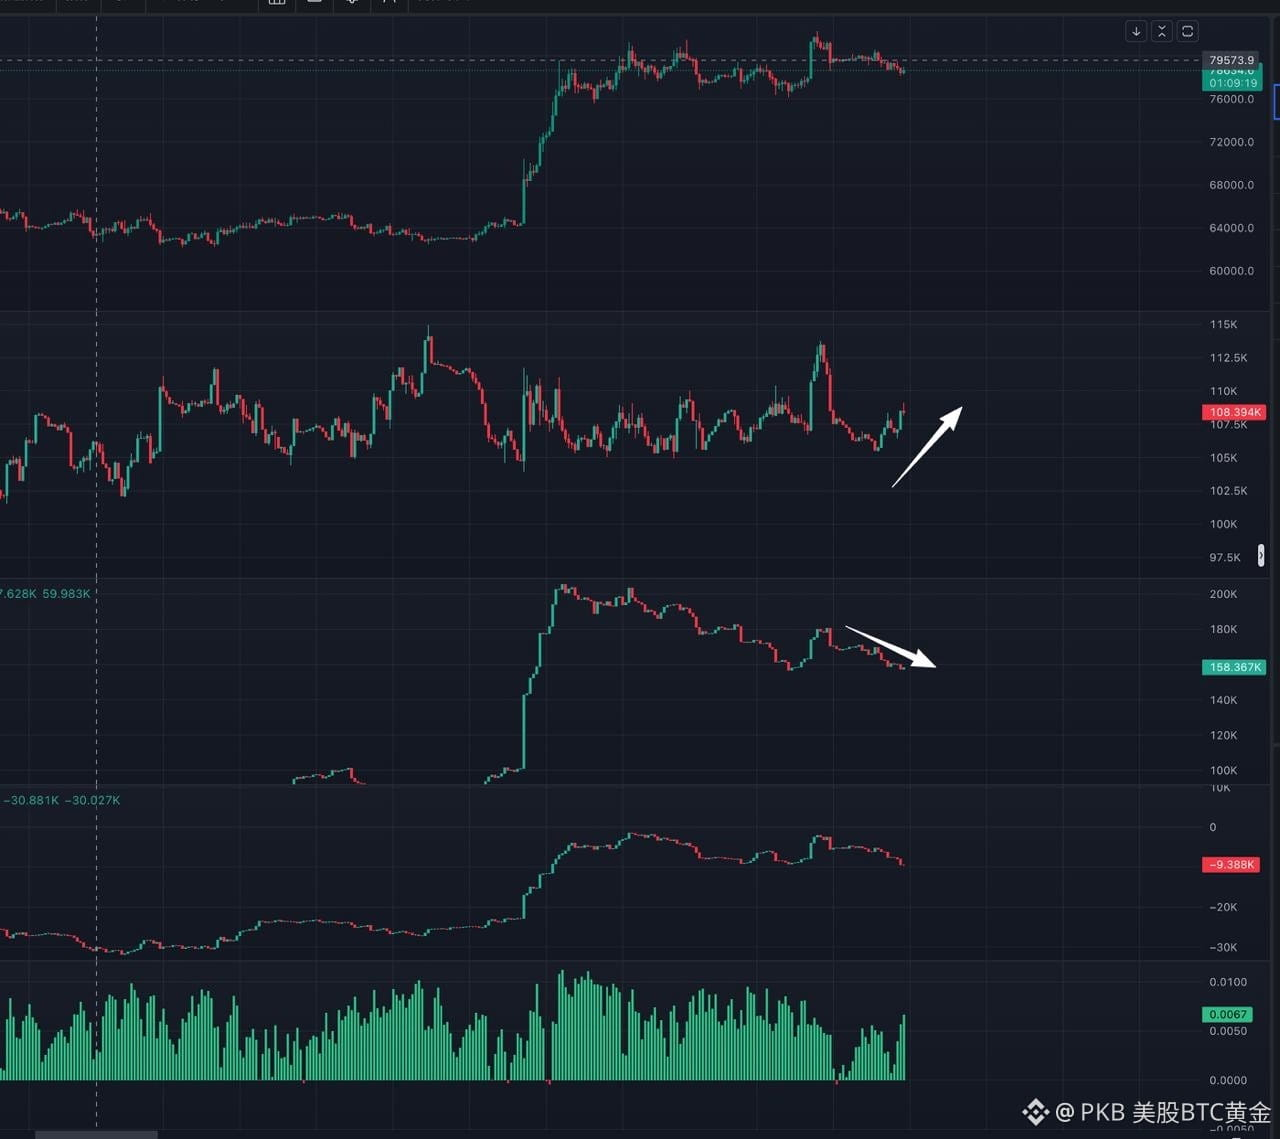
2.7k
·
--
Bullish
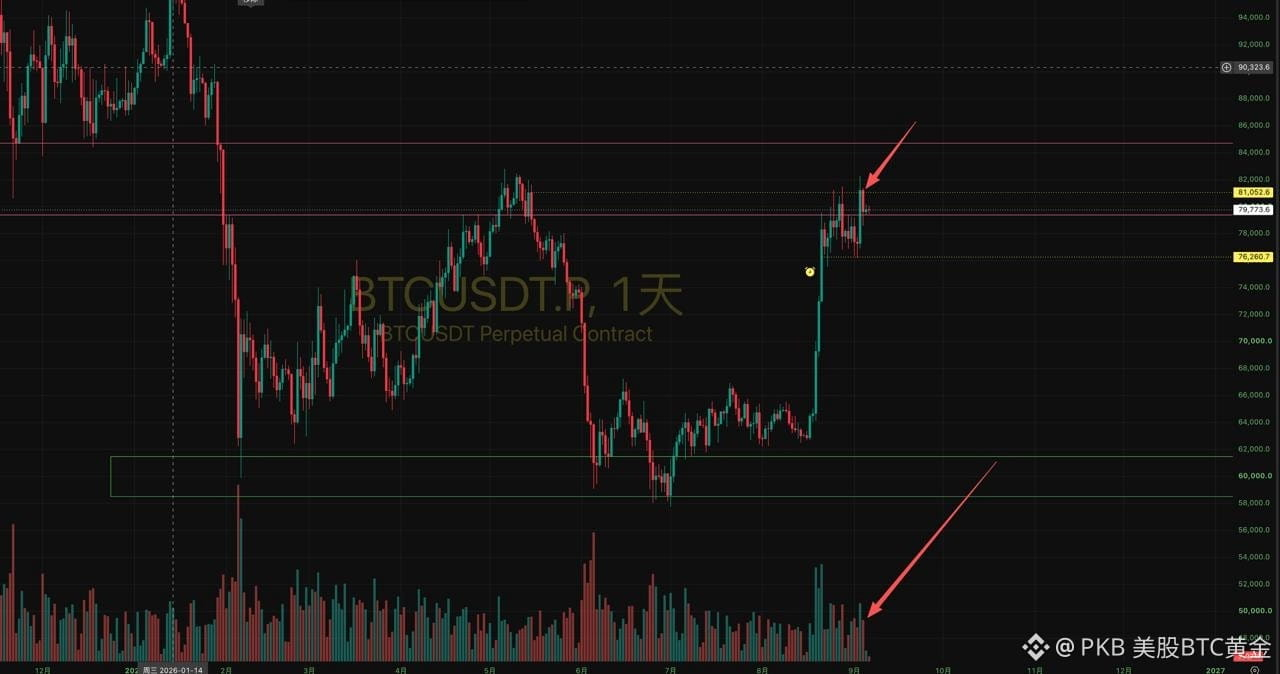
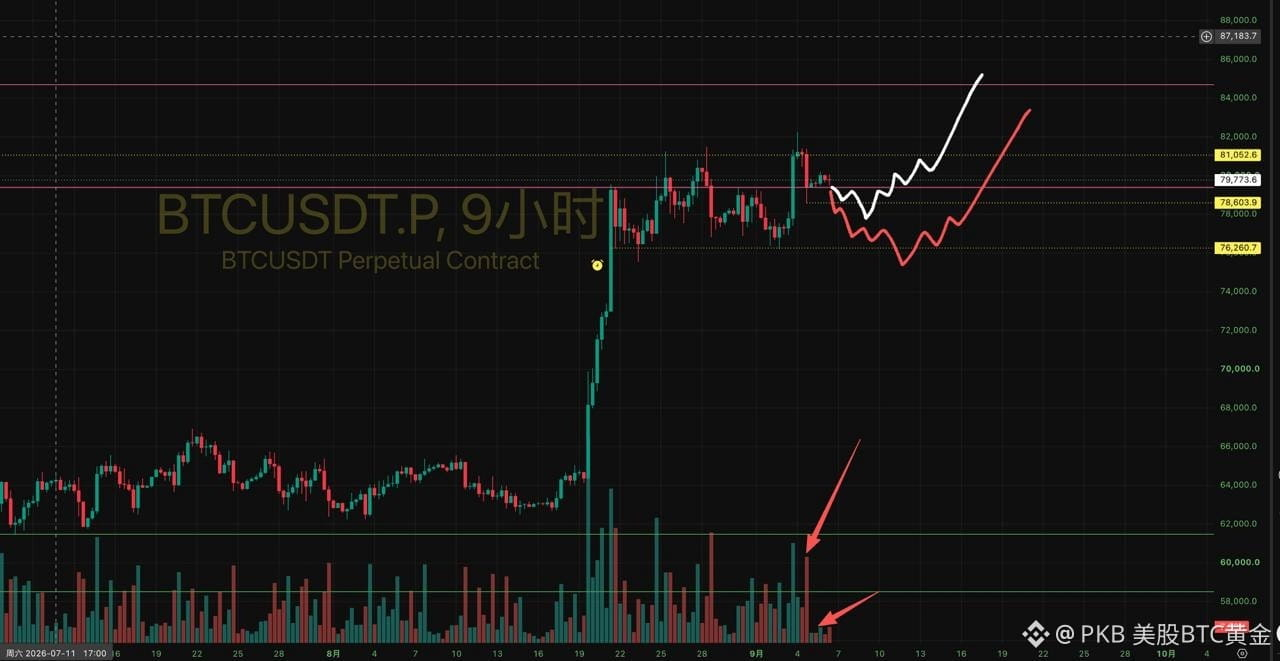
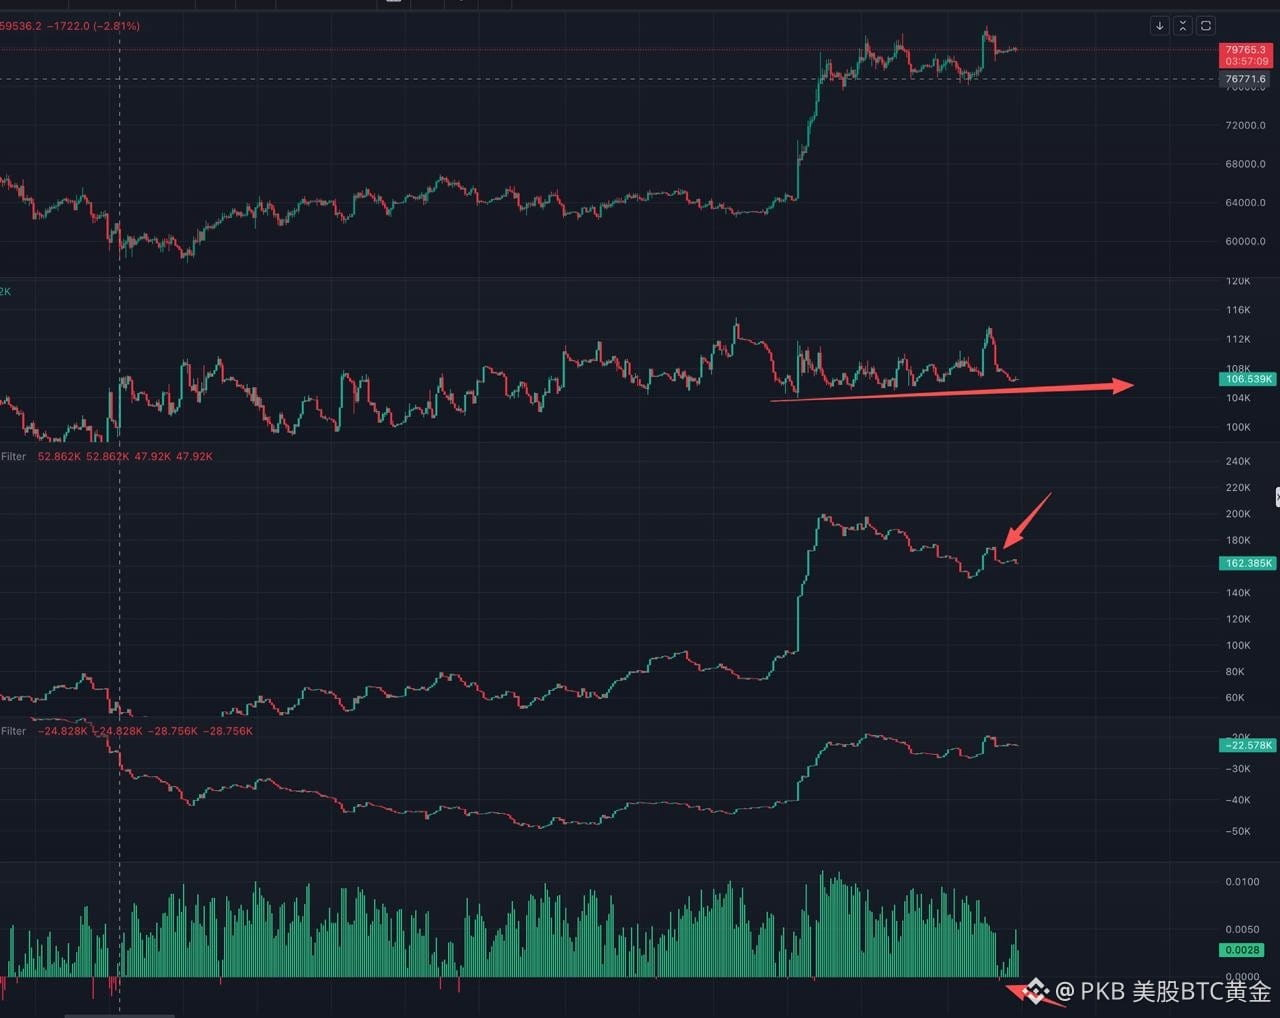
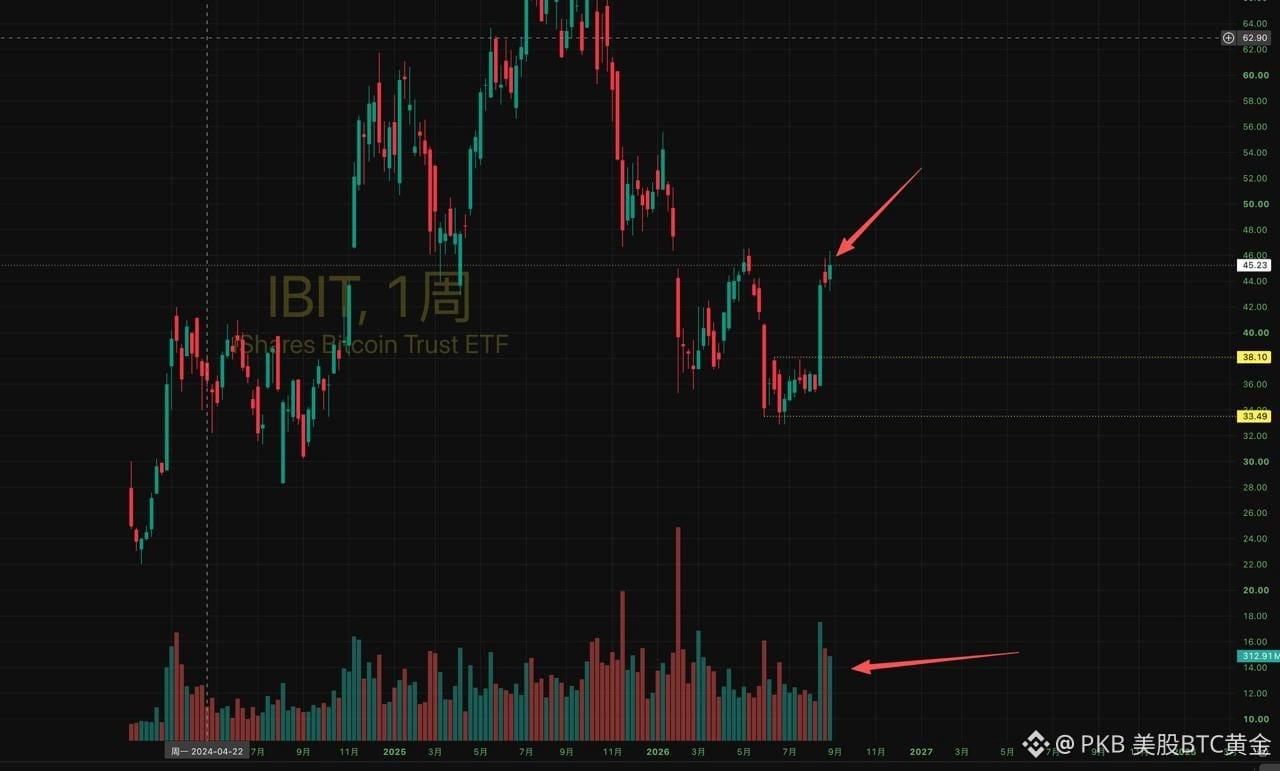
《📌 BTC is still firmly locked in the 76,000 - 81,000 range: two scenario paths and live trading strategies》
[Core logic of the market structure and capital flow]
🔸 Daily and 9h structure (Charts 1 and 2):
After Friday's high-volume drop, the rebound candles did not show strong demand. Current momentum does not support an immediate one-way breakout, so the market is likely to remain in a wide short-term range.
🔸 Futures and order book data (Chart 3):
After last Friday's sharp decline, open interest (OI) in futures has already fallen back to a low on the 4h timeframe, CVD continues to trend lower, and a large number of leveraged longs have been cleared out. Funding rates have now turned negative, indicating that retail short sentiment is building up. The position structure has become lighter, and overall this is accumulating squeeze momentum for the next move higher.
🔸 Institutional ETF trend (Chart 4):
IBIT saw increased weekly volume, but price gains were limited, indicating significant selling pressure overhead. On the weekly timeframe, more time is still needed to trade sideways and digest the move.
[Follow-up trade scenarios and execution levels] (recommended to save)
👉 Path 1:
If price retests the Friday low around 78,600, and strong demand appears in an absorption candle (Absorption), you can enter on the right side and follow the rebound.
👉 Path 2:
If price makes a second drop to test the strong support at 76,200, and then breaks down on increased volume before quickly recovering (Spring fake breakdown signal), take the rebound trade decisively.
[Live position management]:
The low-position long and the long around 77,500 have already had protective stops moved up and are being held. If the 77,500 protection is swept, do not catch the falling knife in the middle of the move. Wait patiently for the result of the 76,300 test.
Trade only by plan: if the intraday retest of 77,500 gets stopped out, will you place a limit order at 76,200 to catch the spike, or wait for a volume-backed reclaim and trade on the right side?
BTC-0.17%
IBITETF-0.41%
1.2k
·
--
Bullish
#ETH
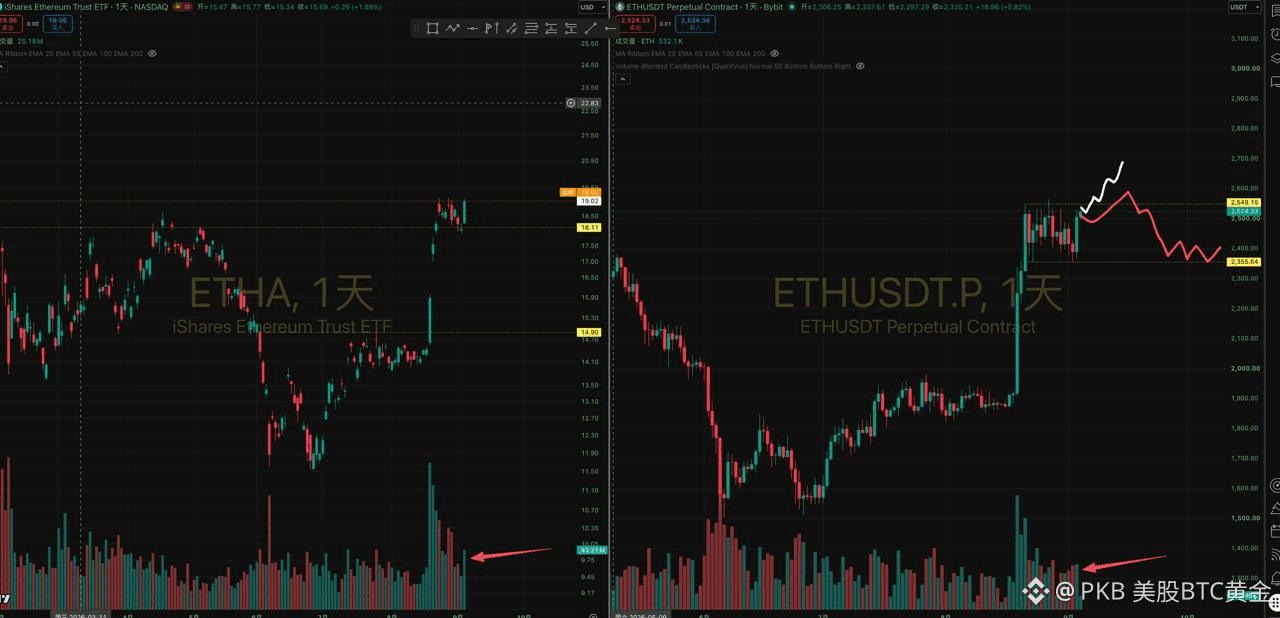
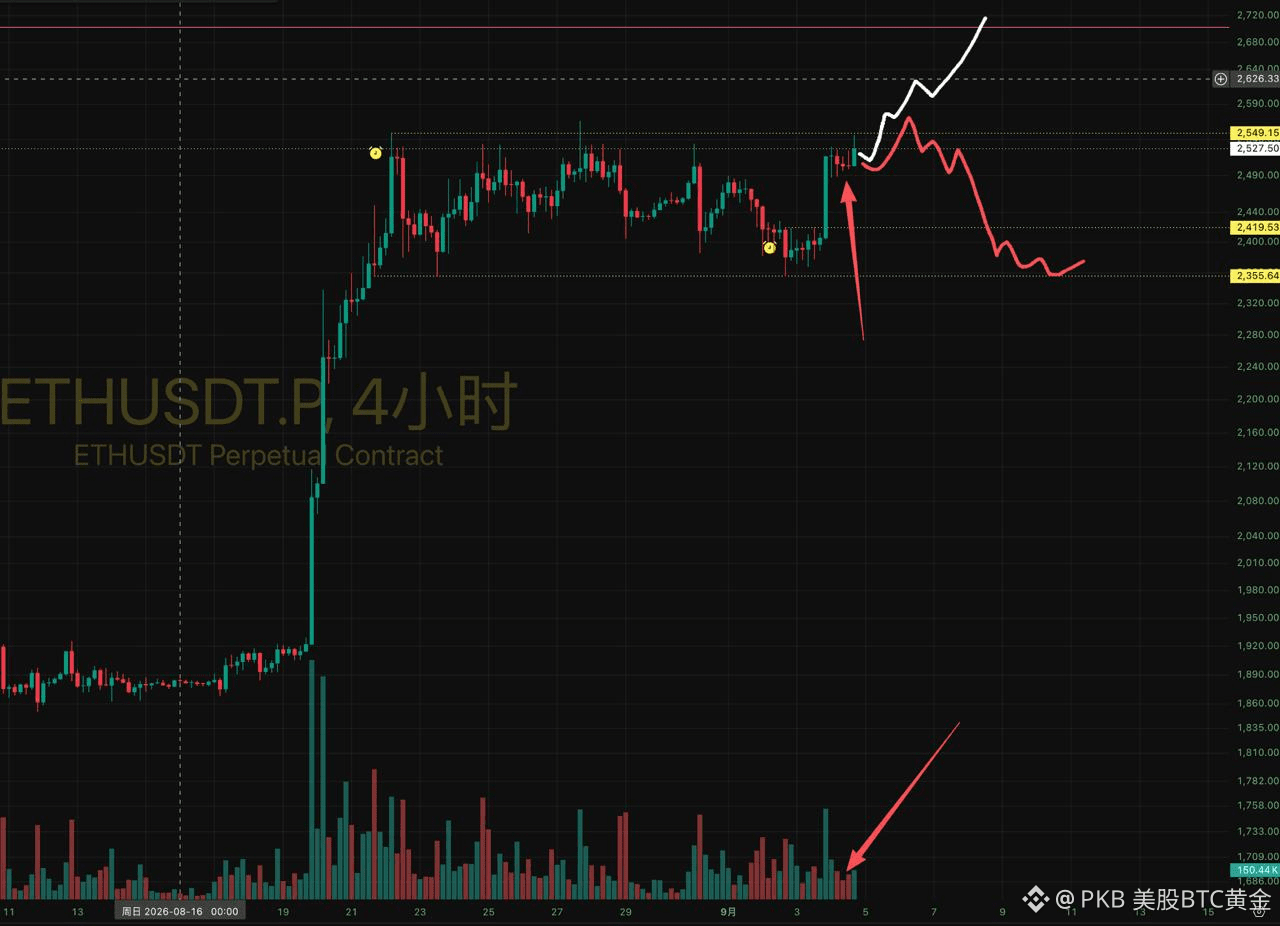
Ethereum yesterday’s daily chart, and ETHA as well, saw a high-volume rally. It reached the top of the daily trading range. The question for the daily chart is whether it can break above the current consolidation range in one go. If it forms a false breakout at the top of the range, then most likely it will still need to test around 2350 below.
From the current 4h chart, after a strong high-volume push to the top of the range, the 4h pullback faces very little sell pressure. So here it is likely to continue rallying upward and retest the top of the range again. Going forward, we’ll see whether it breaks out directly with strong volume, or whether after a false breakout at the top of the range it then retraces with high volume and falls back. If it does make a false breakout and retraces with volume, then to the downside it will continue ranging, and most likely it will test 2350 again.
Personally, I think the probability of a strong rebound continuing upward is higher.
ETH-0.76%
ETHAETF-0.66%
4.1k
·
--
Bullish
《📌 BTC Turning Point: The Critical Moment for the Main Rally Has Arrived! Full Breakdown of the Logic Behind Main-Party Order Book Data and Its Link to US Stocks》
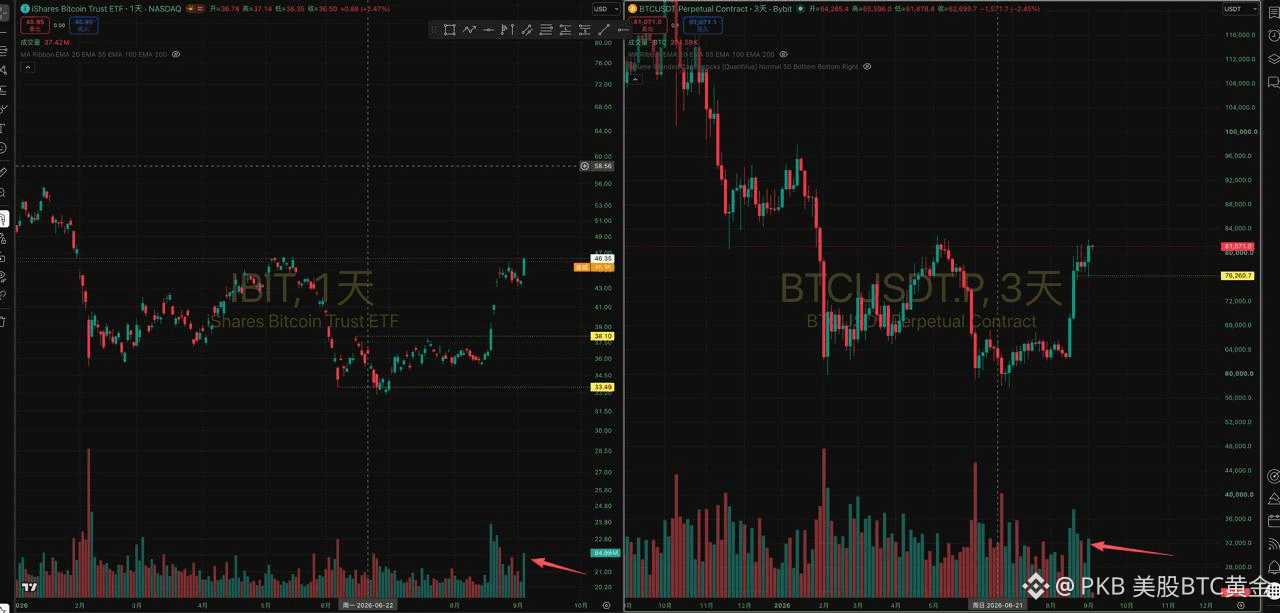
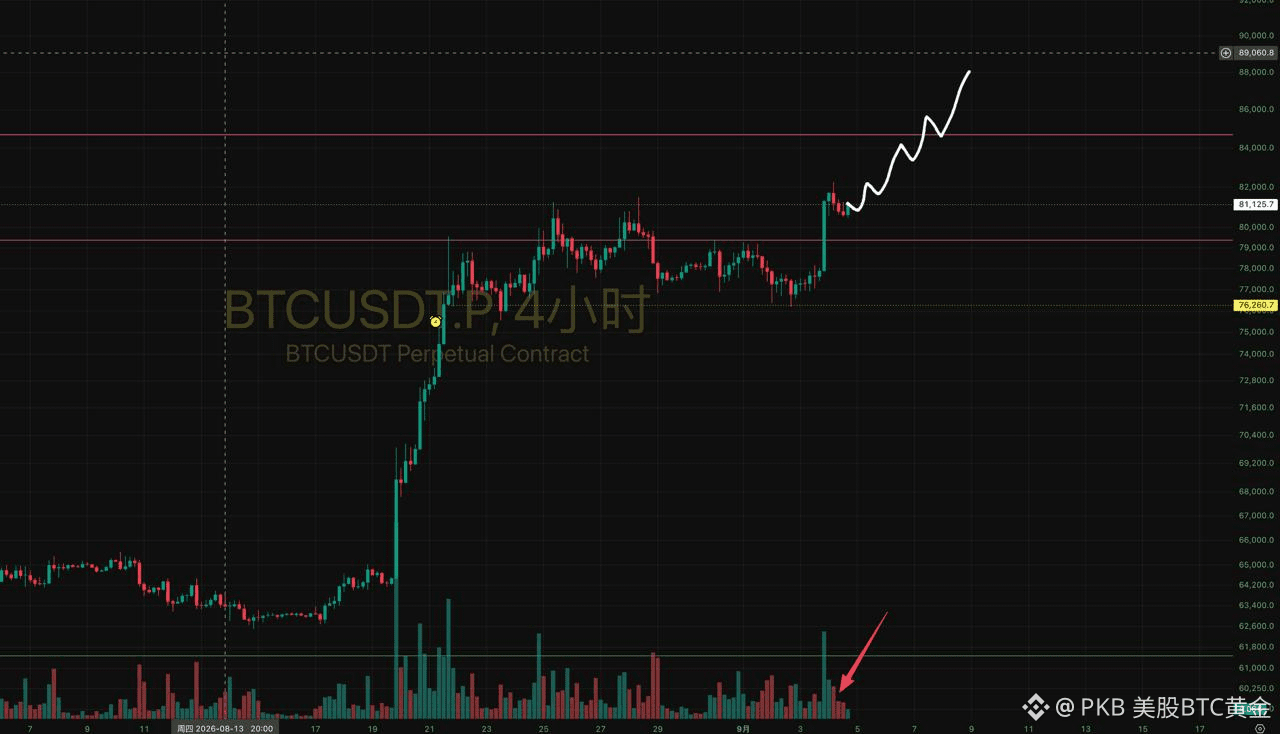
Revisiting the current structure from the perspective of volume-price analysis (VPA) and order flow, all the high-probability breakout patterns have been fully confirmed:
👉 Confirmation of large-cycle volume (Fig. 1)
IBIT’s daily chart closes on increased volume with a bullish candle. BTC’s 3-day chart shows rising volume, pressing toward the top of the long-term consolidation box. The “volume increases while price rises” on a higher level sets the tone for the main rally.
👉 Micro structure and supply testing (Fig. 2)
On the 4h timeframe, price tests the upper edge of the range and meets selling pressure, but the pullback volume becomes extremely compressed. This is a standard “Lack of Supply” scenario. After high-level consolidation, continuing upward is a high-probability outcome.
👉 Micro order-flow resonance (Fig. 3)
The order book shows very strong buyer control: open interest (OI) expands, futures CVD trends upward. More importantly, spot CVD rises in sync as well—confirming that spot large funds are actively pushing price, not just fake leverage.
👉 Synchronized confirmation from related assets (Fig. 4)
In the US stock crypto matrix—$MSTR, $COIN, $CRCL —after several days of volume contraction and consolidation, yesterday they collectively broke out from the range-bound box on increased volume, showing that macro buying momentum is forming a unified force.
【Current Live Execution Plan】
BTC long positions: hold the earlier entries at 71,300 and 77,500; move the stop-loss up to the entry price to break even, betting on a breakout into the main rally.
CRCL long positions: the long position with 89 average cost has had its stop-loss set at breakeven. Fully follow the BTC momentum to close in sync—capture the trend with no risk.
With this breakout-capture system combining “spot CVD + the US stocks’ shadow-mirror logic,” what’s your win rate like on it in your usual trading?
A. Use it often—very high accuracy / B. Usually focus only on bare candlestick charts
439
·
--
Big pancakes and Ethereum are about to kick off the next wave of upswing 📈—are you ready?
Big pancakes and Ethereum are about to kick off the next wave of upswing 📈—are you ready?
179
·
--
Bullish
#ETH
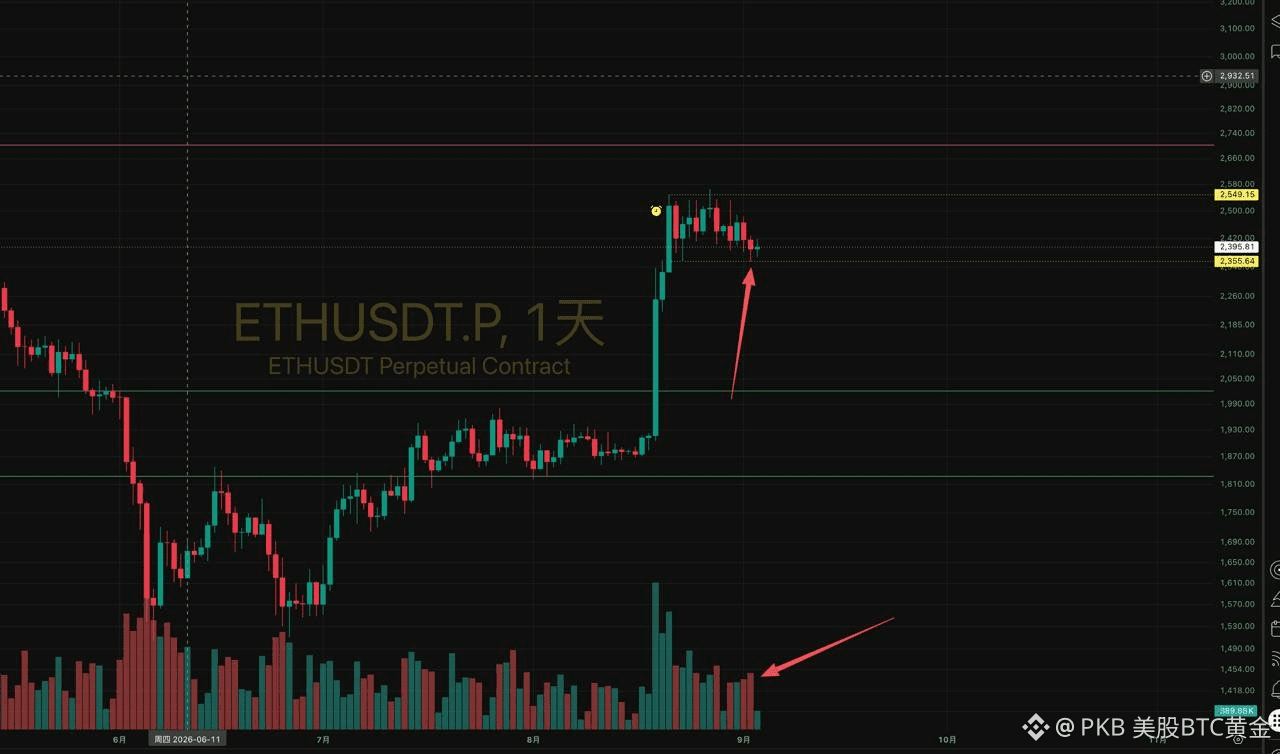
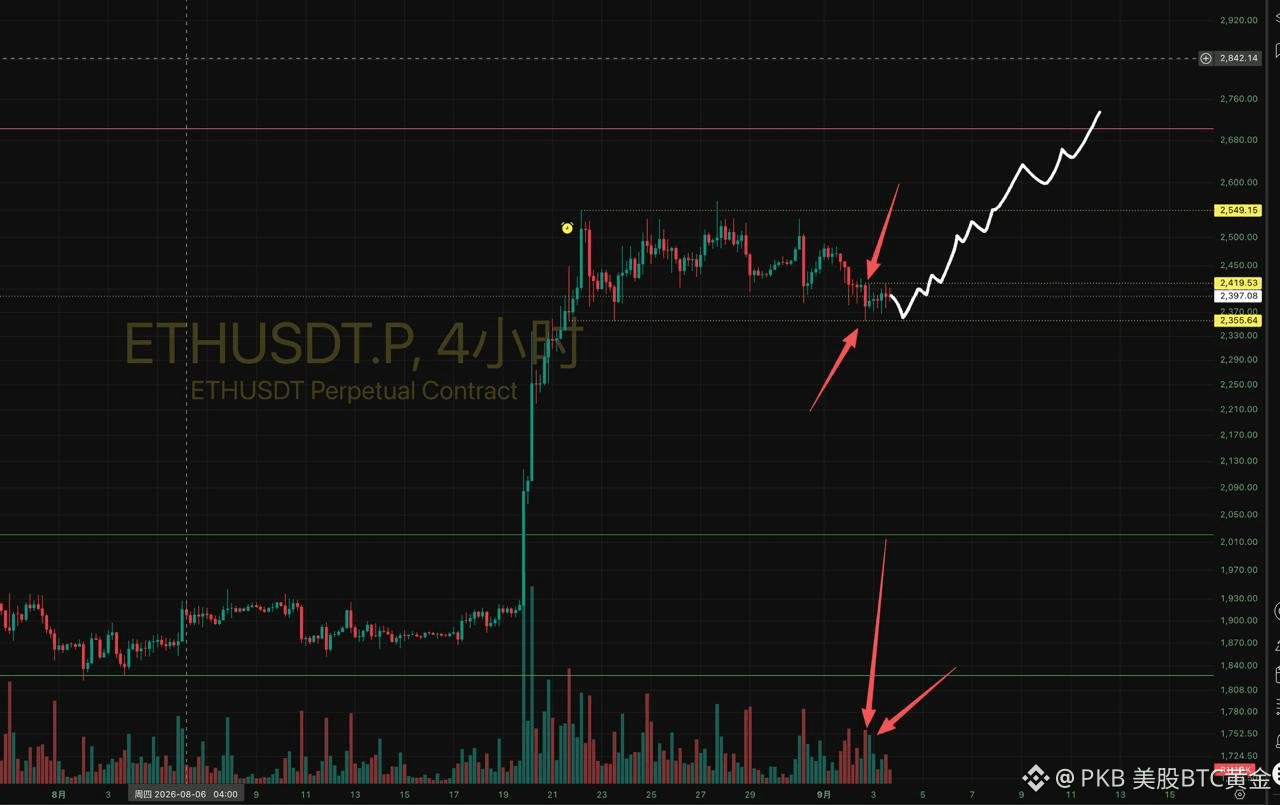
After the ETH daily candlestick inserted at 2350 yesterday, the overall daily chart showed increased volume, indicating there is some demand to enter here, but the demand is not strong.
From the smaller timeframe of 4H, after the 2350 wick, the overall 4H period had increased volume and acted like a leading move. Subsequently, the 4H rebound showed a certain level of demand, but overall the demand was not strong. After that, there was no successful move to close above the start of the bearish candle with high volume on the 4H chart. Since it can’t go up, most likely it will insert downward again at 2350!
1
4.2k
·
--
Bullish
#BTC
Yesterday, BTC saw a sharp drop in the 3-day line with a significant volume contraction, indicating that the overall sell pressure at this high-level consolidation has already been greatly reduced. The current volume-and-price behavior is very likely an “uptrend continuation.” At the same time, based on yesterday’s BTC daily chart: there was a quick spike to 762 followed by a candle with a lower in-chart wick (a “sub-wick”/downward probe). Overall, the成交量 (trading volume) is not small, which suggests there is demand to enter.
From the 9H chart: yesterday’s 9H session showed increased volume, followed by a spike to 762, then a drop that broke below the level, and then it recovered with a bullish candle on expanding volume. This indicates that there is demand to enter. It fully matches our earlier expectations for BTC’s consolidation range.
Here, I believe it’s highly likely that the next rebound wave is about to begin!
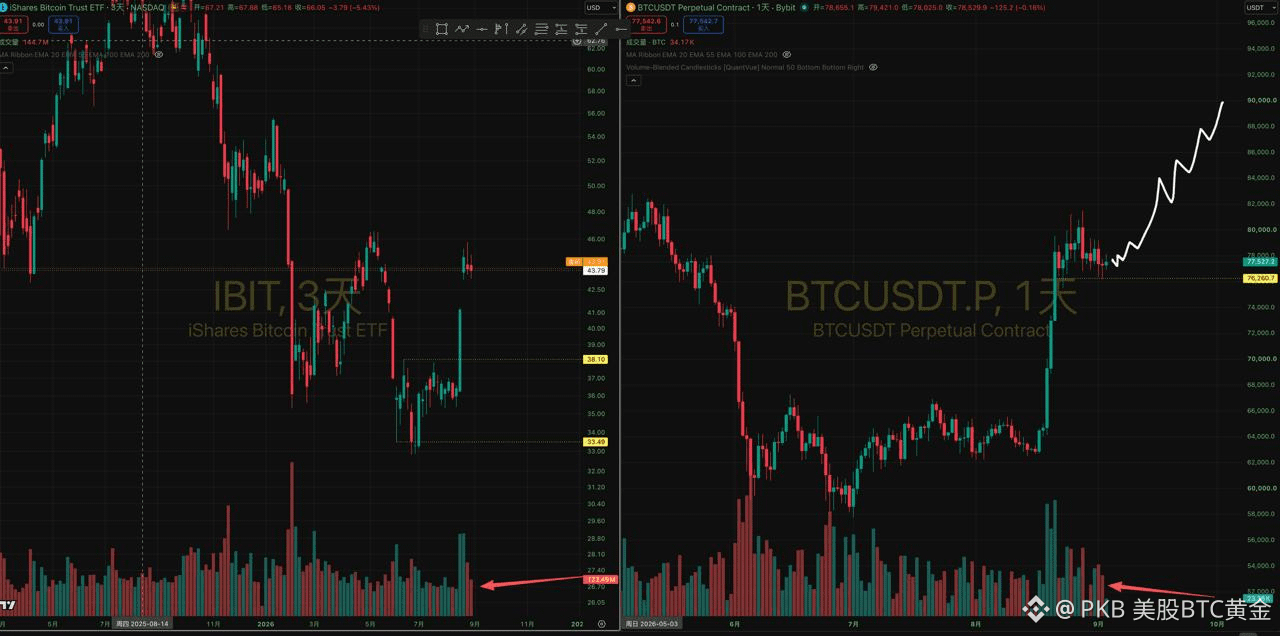
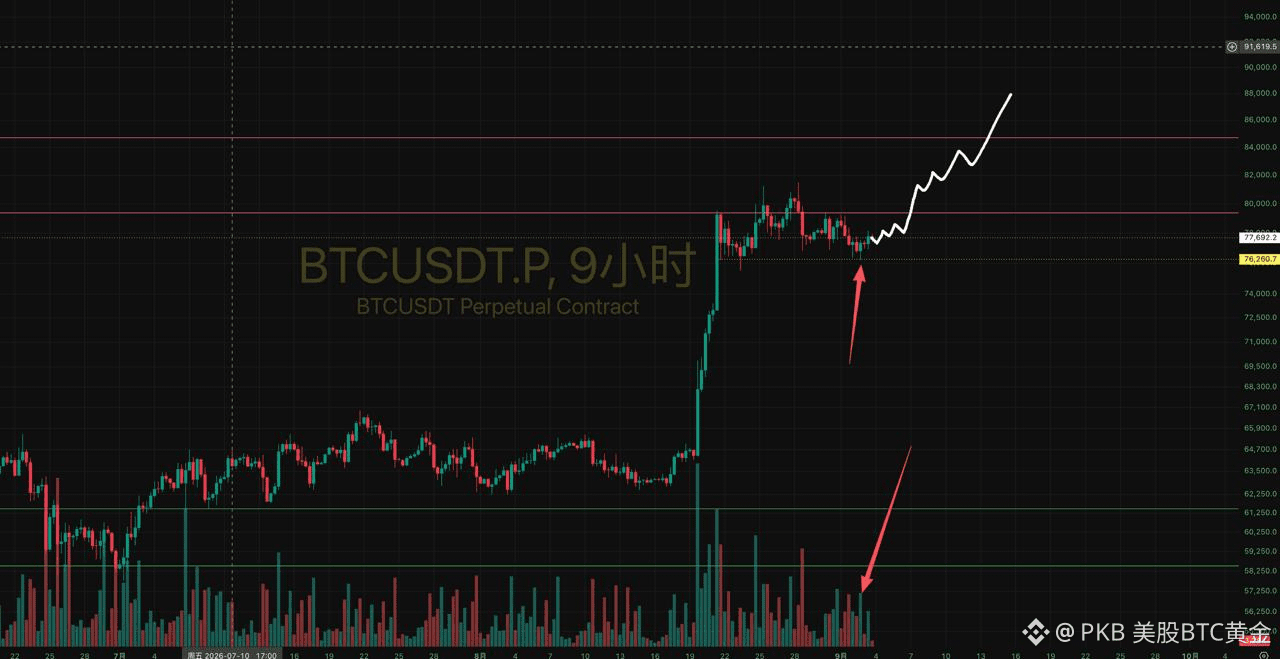
BTC-0.17%
IBITETF-0.41%
1.9k
·
--
Bullish
$ETH
Here, the 3-day candlestick trend of Ethereum is moving within a consolidation range, and the trading volume is gradually shrinking. This indicates that within this consolidation range, the volume is not large and selling pressure is also not heavy. Here, just like Bitcoin, this consolidation range is also expected to be an upward continuation.
After Friday’s 4H saw an expanded-volume spike and a needle insertion, there hasn’t been a clearly strong follow-through demand. Going forward, we’ll look to see whether another spike/needle insertion happens around 2405 or whether around 2350 there appears stronger demand, and then the next wave of upward行情 can begin!
Trading summary: Currently, continue holding the long positions around 2410 for Ethereum. The stop loss is placed at 2335. If in the future we can see another needle insertion around 2405 or around 2350, and after the insertion there is a reversal with increased volume, consider adding to the long position!
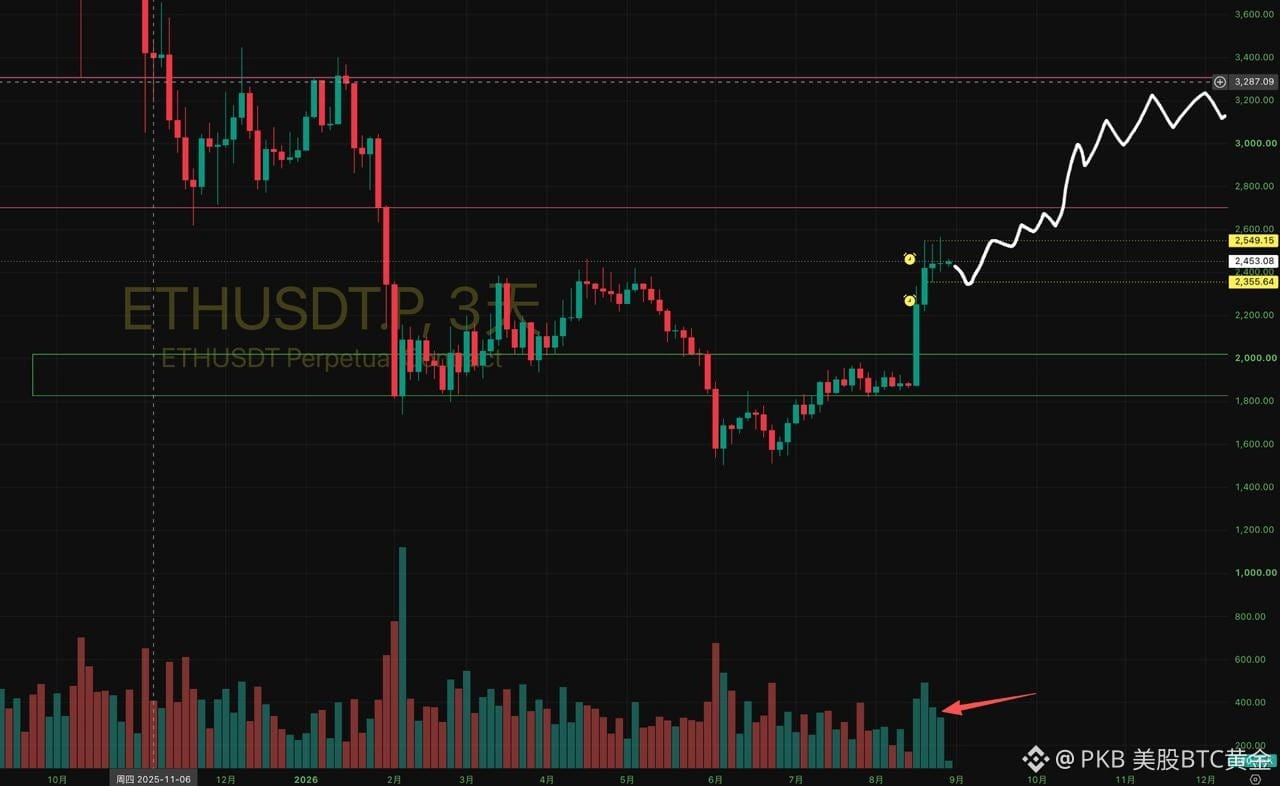
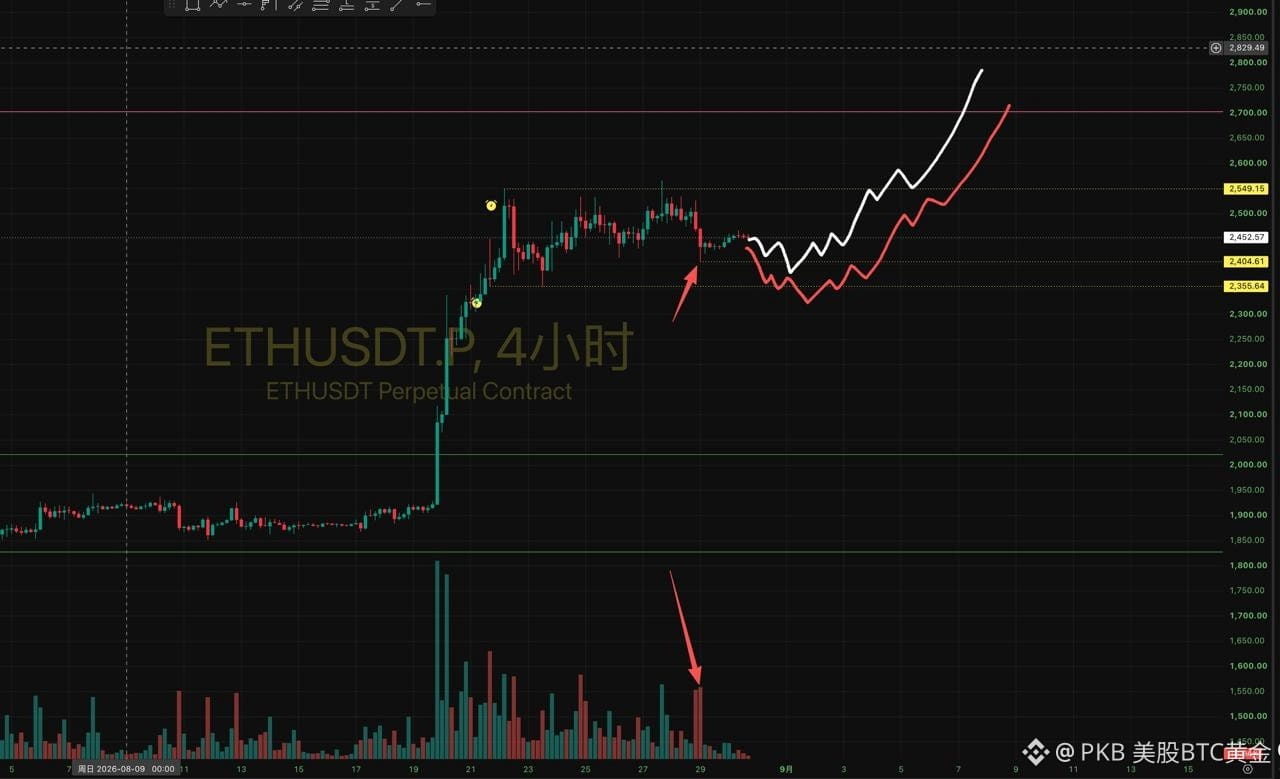
2.7k
·
--
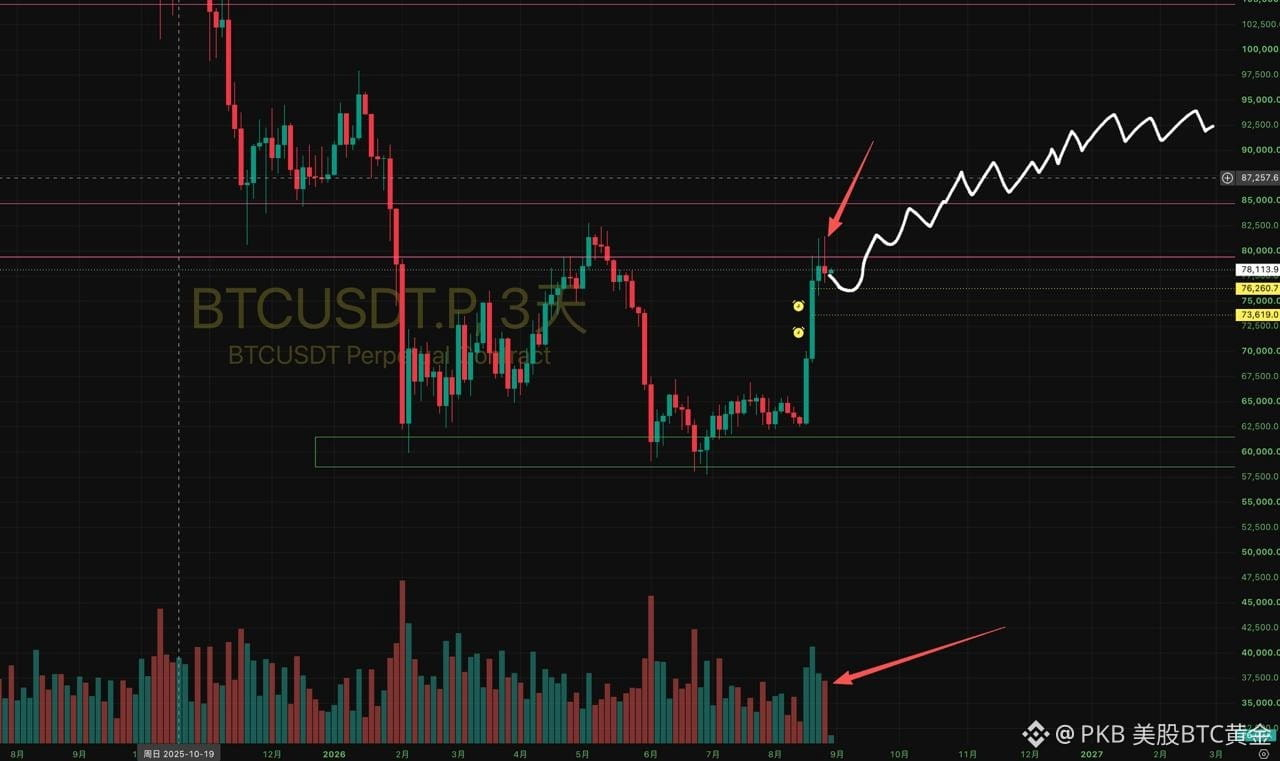
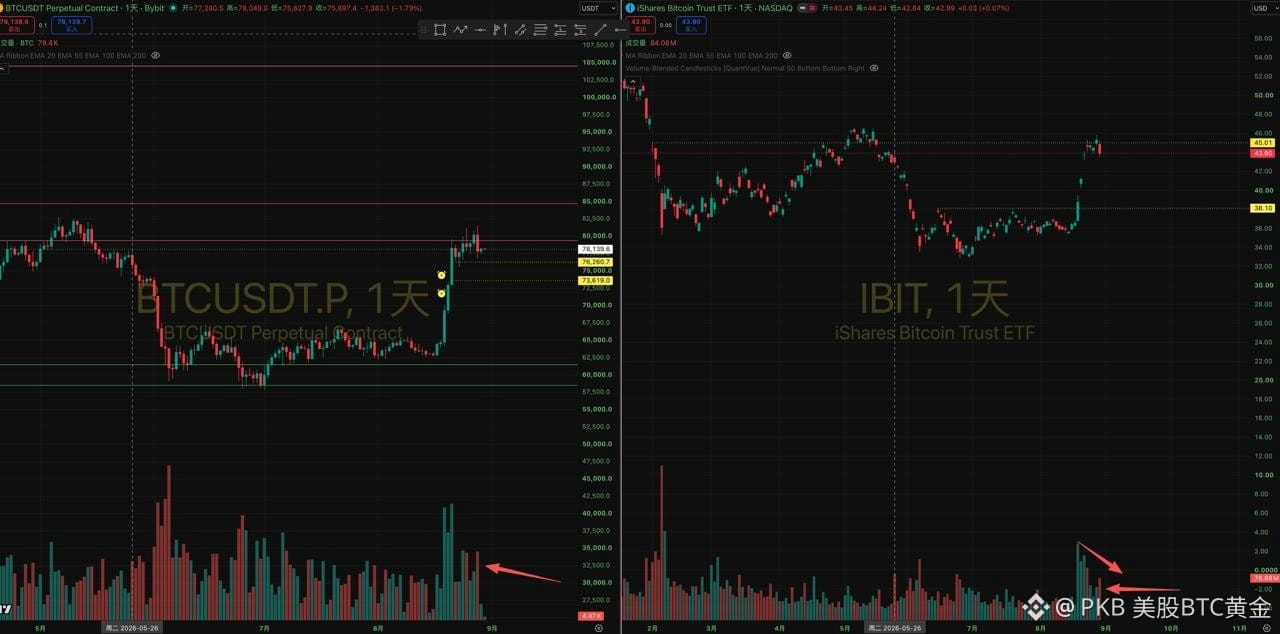
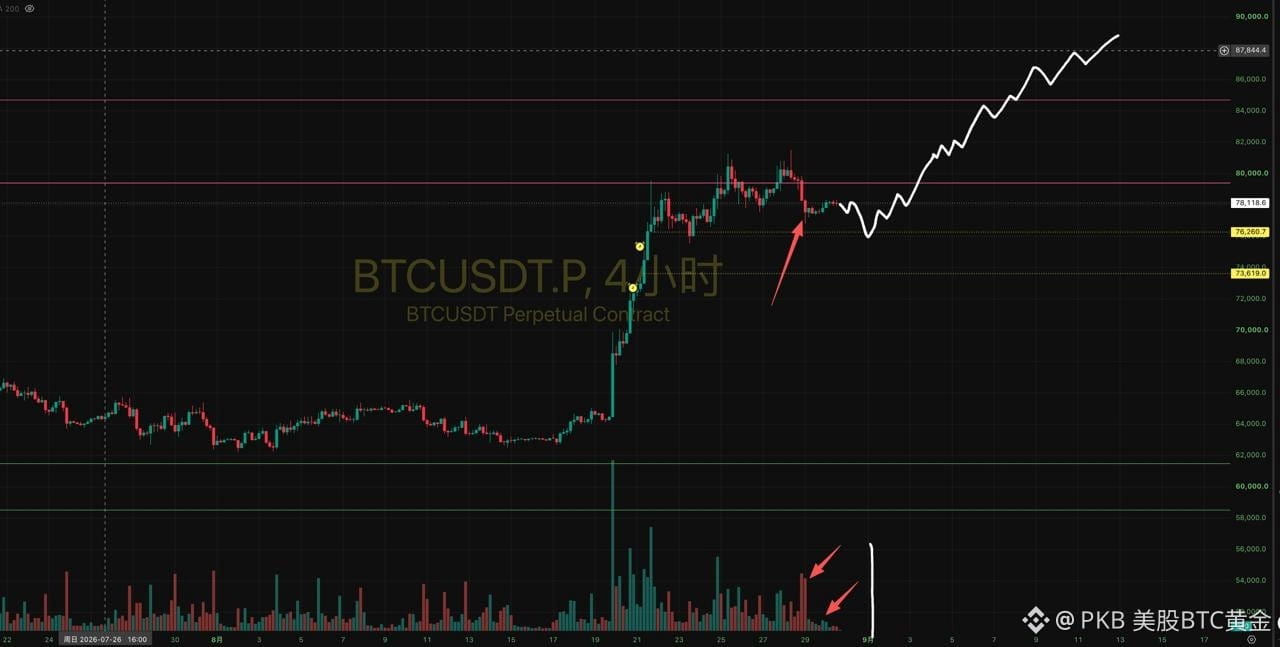
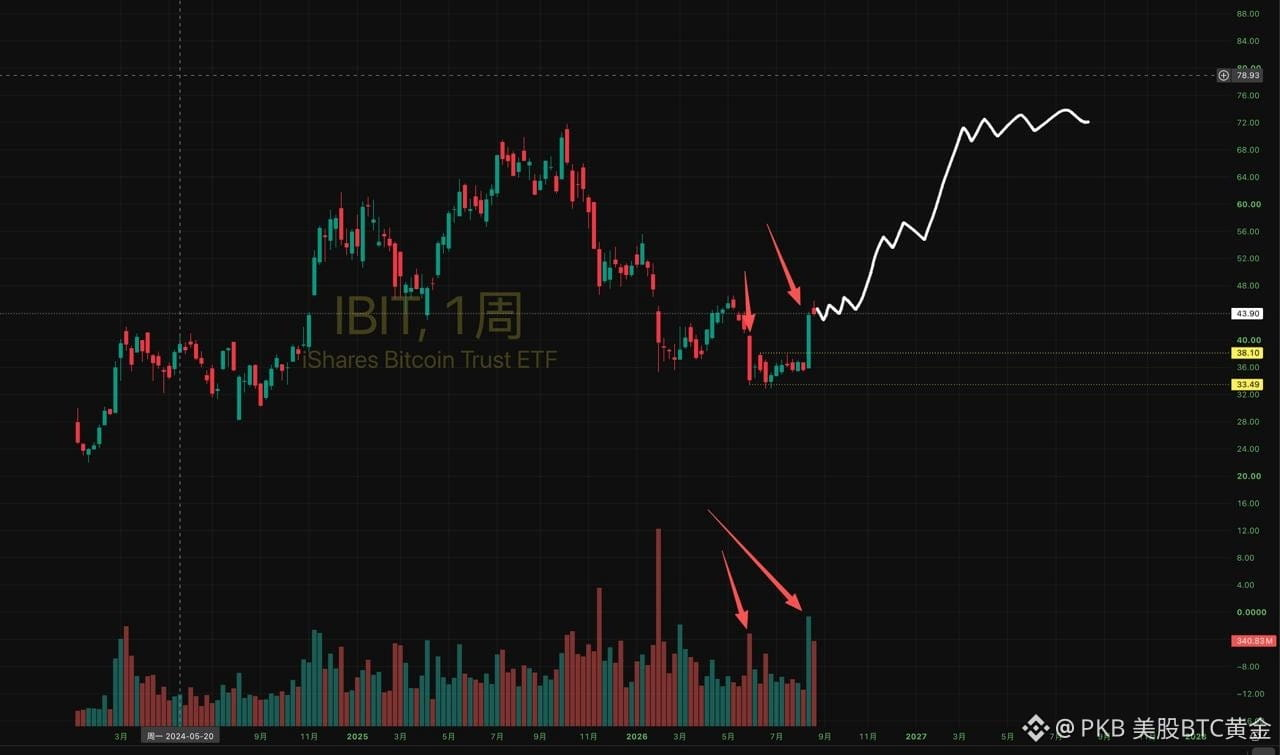
📌 BTC Weekly-level reversal confirmed! A 76,000-box long trading plan and volume-price breakdown (recommended to save):
The market is currently in a large-scale reversal confirmation stage and a small-scale volume-shrinking shakeout phase. The core logic and key level planning are as follows:
🔸 Macro trend (Chart 3):
IBIT’s weekly chart recorded the largest bullish成交量 since last October, successfully holding above the 6.1 breakout point where the up move began. This indicates the start of a large-scale rebound/reversal scenario—it's not just a single-wave rebound.
🔸 Structural features (Chart 1 / Chart 4):
The 3-day candles close bearish, but trading volume has clearly contracted, suggesting selling pressure is exhausted. The daily chart and IBIT show a low-volume consolidation. Currently, the market is in a typical upward continuation range consolidation of 76,300 - 79,500.
🔸 Micro signals (Chart 2):
On the 4H chart, there are signs of increased volume with a wick insertion indicating buy-demand. However, the buying pressure hasn’t persisted. It’s expected that price will dip again to the 76,800 - 76,300 area to seek support.
🎯 Detailed trading plan:
👉 Position management: The 71,200 long positions have set break-even stop-loss; the core position (bottom lot) will continue to be held.
👉 Entry zone (Entry): Wait for a further downward wick insertion on the 4H chart into 76,800 - 76,300.
👉 Trigger confirmation (Trigger): After the drop below that zone, quickly reclaim it with volume (confirming strong demand absorbing/Spring signal).
👉 Target levels (Target): First target at 79,500; after a breakout, look for 85,000+.
👉 Defensive stop-loss (Stop): If 76,300 is broken on a valid basis and there’s no reclaim action, give up.
What is your current position status?
A. Core/bottom lot already held around 7.1W
B. No position, waiting for the 7.6W wick-insertion signal to enter on the right side
BTC-0.17%
IBITETF-0.41%
2
604
·
--
Verified
#XAUUSD
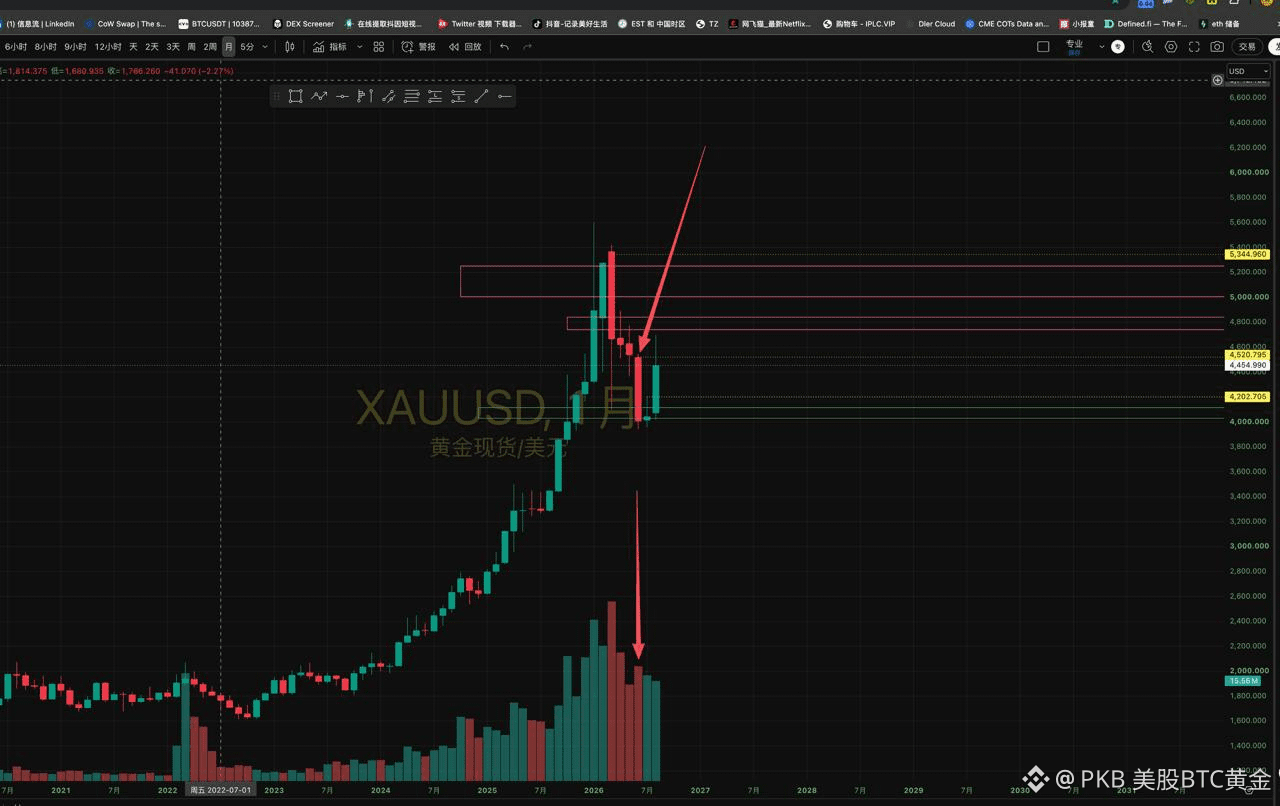
Brothers holding gold, pay attention—after the big drop in gold on Friday, the overall outlook has changed!
Right now, all the gold long positions have been fully closed when they were only slightly in profit on Friday.
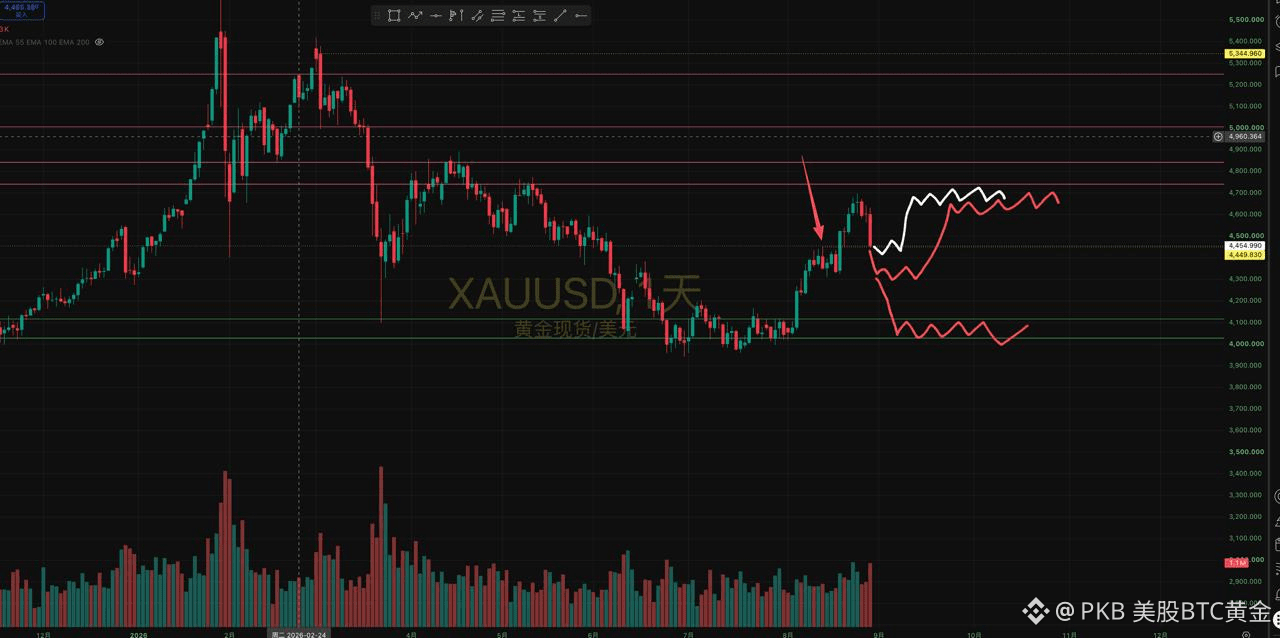
Tomorrow gold will close the monthly candle. In my opinion, this is still quite critical. The 4520 level was the starting point of the previous month-line accelerated selloff. This area acts as a resistance zone. If on Monday it fails to close back above it, then I think the monthly-candle bounce from there will still be rather weak.
Currently, the daily chart around 4450 is support. If on Monday there’s a direct breakdown below 4450 with strong volume, then we’ll need to look toward the 4300 area. Once price reaches 4300, I believe there’s no need to do any more long setups for the future rebound scenario. Even if it bounces upward, it likely won’t go much beyond around 4700. The upside room is relatively limited. If it can hold around 4450, then most likely it will rebound again to probe the 4700 area. At that time, look for a 4H opportunity to take another long.
This gold rebound has been especially uncomfortable to trade. I think the main reason is that this rally is only a range rebound. As early as the drop in March, I believed gold was very likely to have formed a historic top. This rebound is only a rebound into making a secondary top. I originally thought it could reach the weekly resistance around 4850, but it didn’t. That means this rebound was still too weak. Going forward, I don’t think going long on gold is a very high-quality trading opportunity!
3k
·
--
Bullish
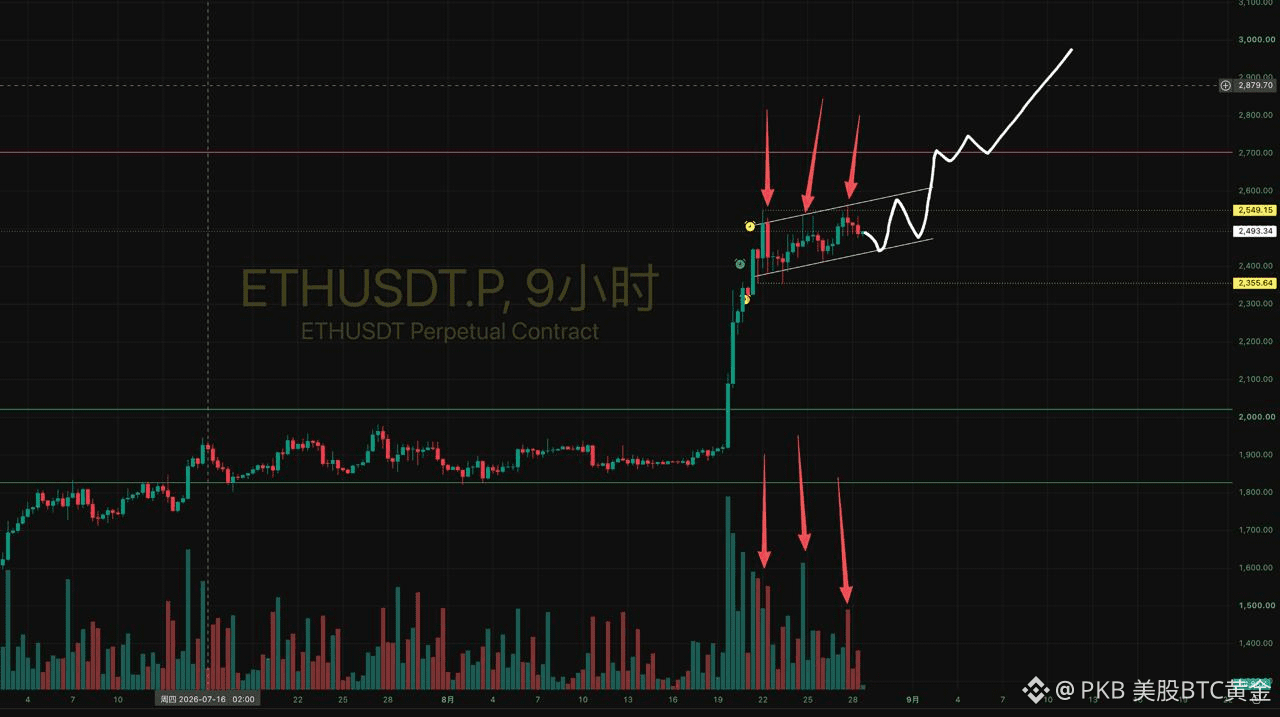
#ETH
Ethereum here is the same. At present, it appears to be moving along an uptrend channel where the lows are lower than the previous lows but still making higher highs on the 9h timeframe. The volume also met resistance around 2510, then gradually started to shrink, which suggests that selling pressure here is weakening. The lower edge of this channel is around 2440–2450. If price breaks below the channel, it would likely need to test around 2350, and only after a breakdown-rejection test like that can we continue to look for an upward move!
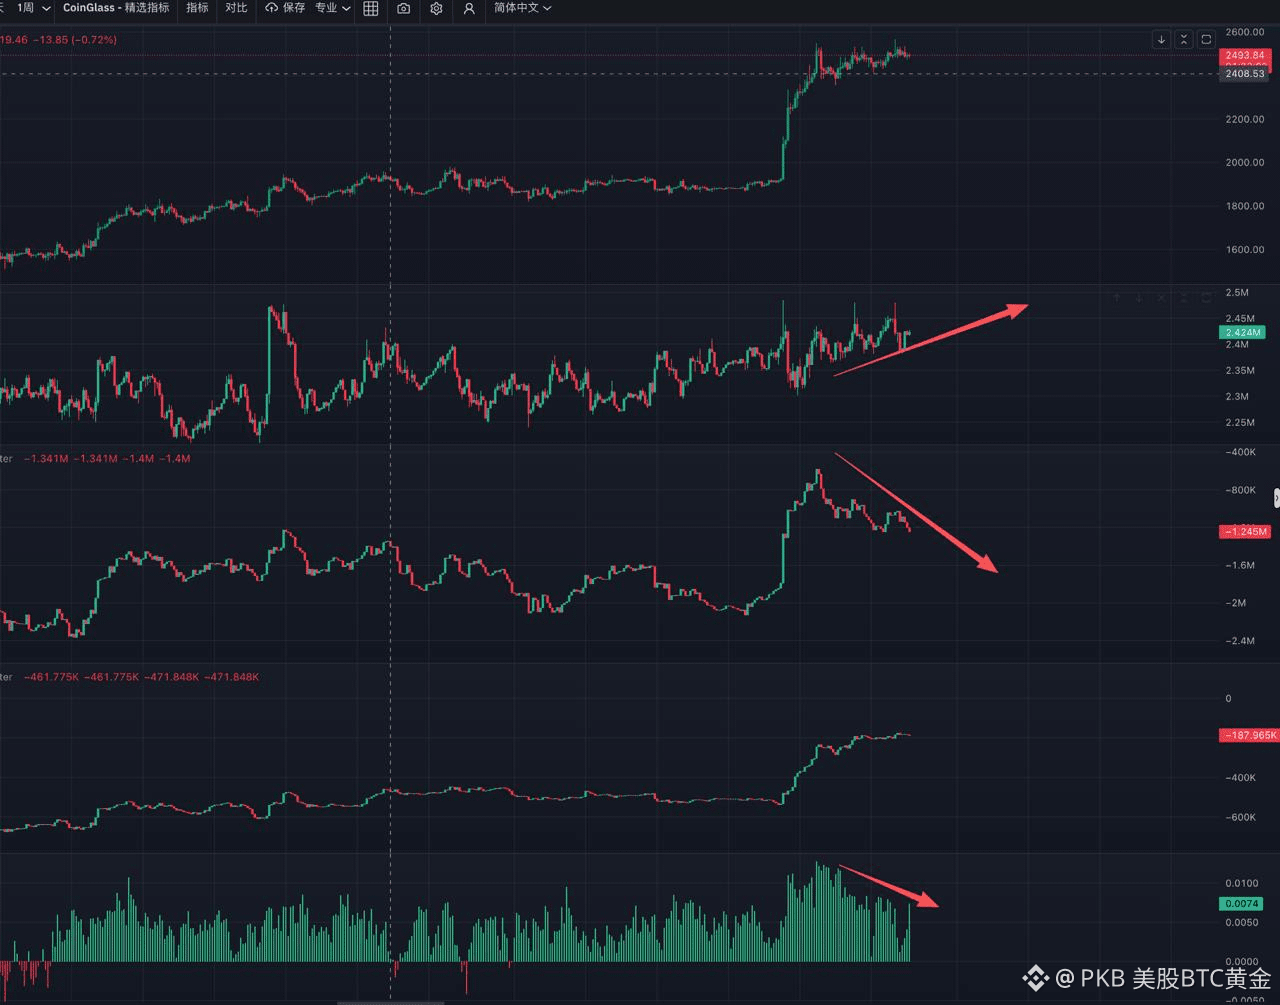
From the order book/market depth, you can see that there are more Ethereum shorts here. Open interest is continuously rising, and meanwhile the futures CVD (and the funding rate on the downside) is falling, indicating that quite a few shorts are taking positions to sell here!
3.9k
·
--
Bullish
#BTC
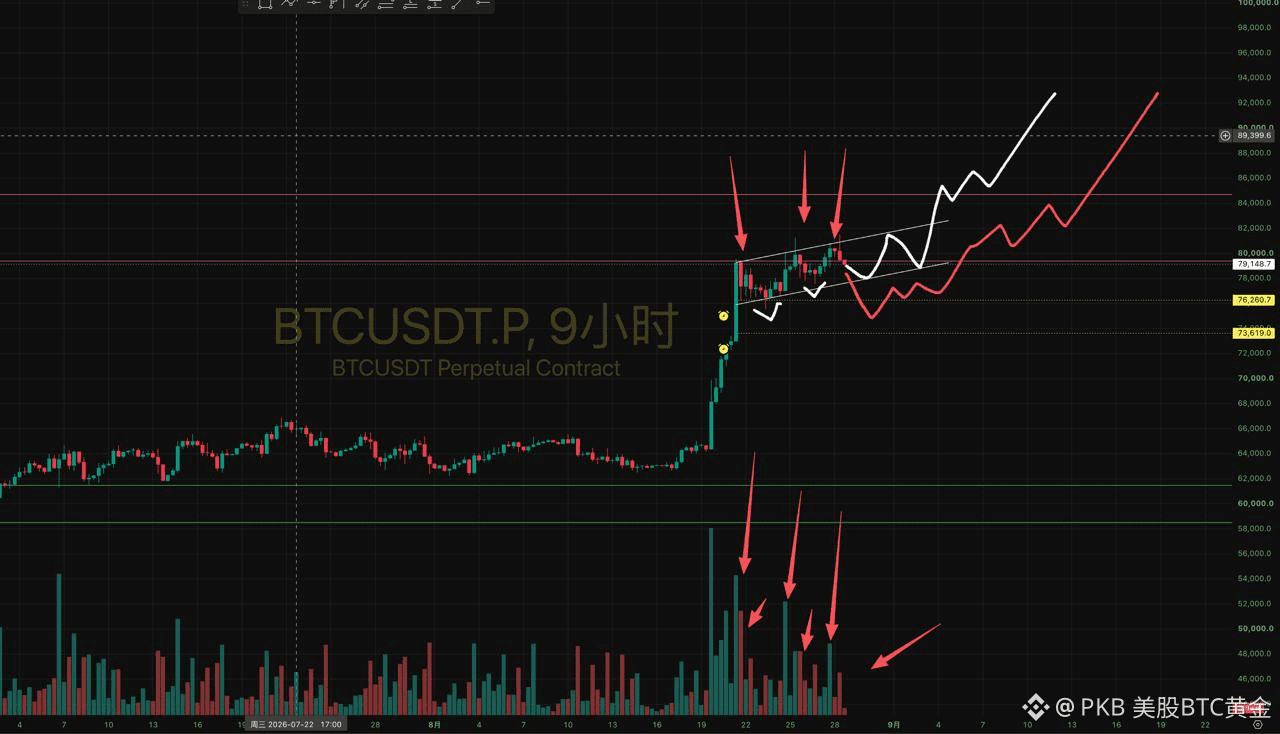
From the past 9 hours of Bitcoin, there are still two expectations here: One is that it has already moved out of a low-to-lower-high and is moving upward in a channel. Here, at the arrow point, the volume during the spike up to 795 and the selling pressure are both decreasing. This is the standard volume-price behavior for a breakout of a low-to-lower-high upward channel. If we follow the channel, then around 78 is likely the lower edge of the channel.
If it breaks below the channel, then the red scenario would play out: it would go to around 763 to perform a breakdown-and-reclaim test! Then it starts moving up.
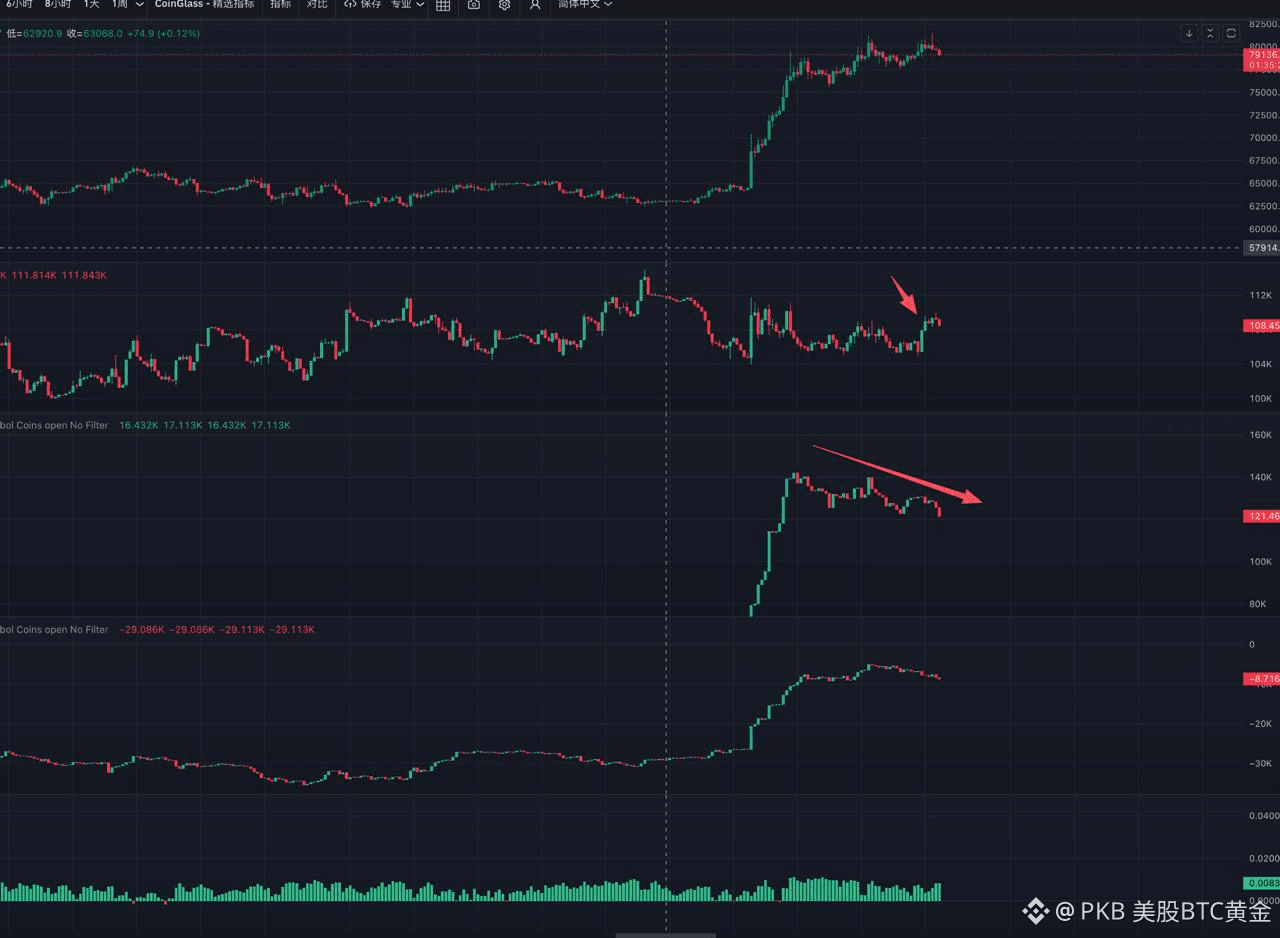
From the order book, during the sideways consolidation, open interest is increasing while the contract CVD is declining. This suggests that during the consolidation, a fair amount of shorts are opening and shorting.
1.4k
·
--
Bullish
$BTC
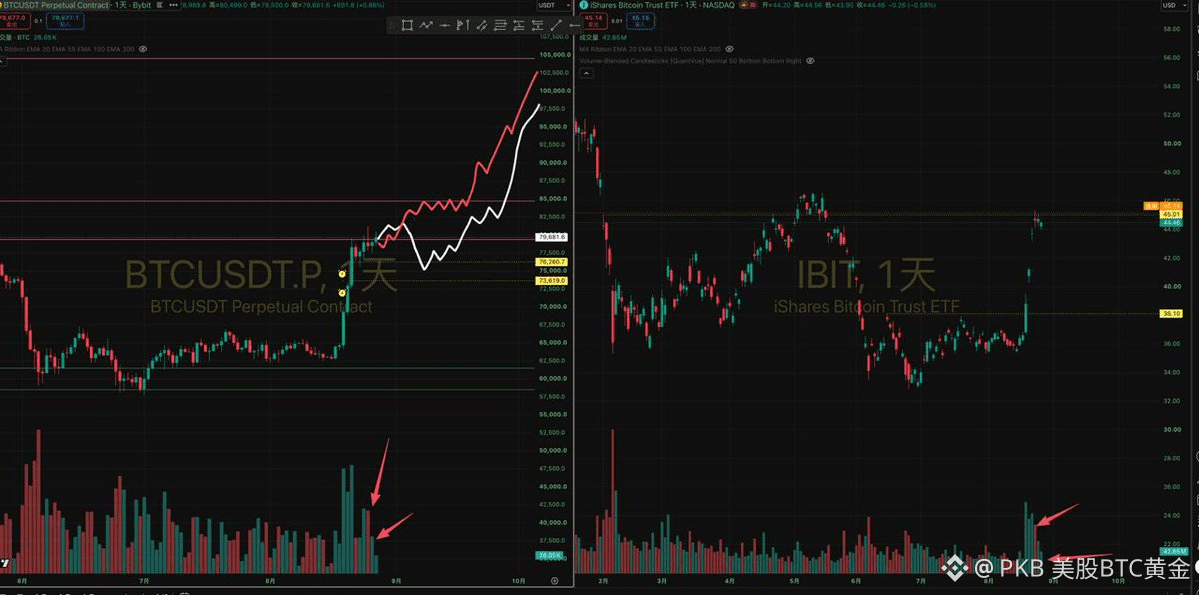
The big pancake (BTC) yesterday on the daily chart did not continue the previous day's volume-expansion bearish candle. Instead, it moved into a bullish candle. From the daily chart, I think the overall demand is still relatively strong. Also, from the daily chart, it looks like the overall bottom is gradually rising. From IBIT’s daily chart, we can see that IBIT yesterday opened lower but then moved higher, closing as a bearish candle. The overall trading volume is still relatively low, which suggests there isn’t much selling pressure here—it's just that demand is not yet sufficient to push the price upward.
There are two scenarios on the daily timeframe: one is that it meets resistance around 795, pulls back, and then tests around 763. The other scenario is that the bottom is higher than the prior bottom and it breaks upward directly, reaching the range of 80–85. Personally, I believe that if the market consolidates like this for a while, then on the next time it sees a volume expansion, the breakout and rally will most likely push through 8.5 and go to a higher level!
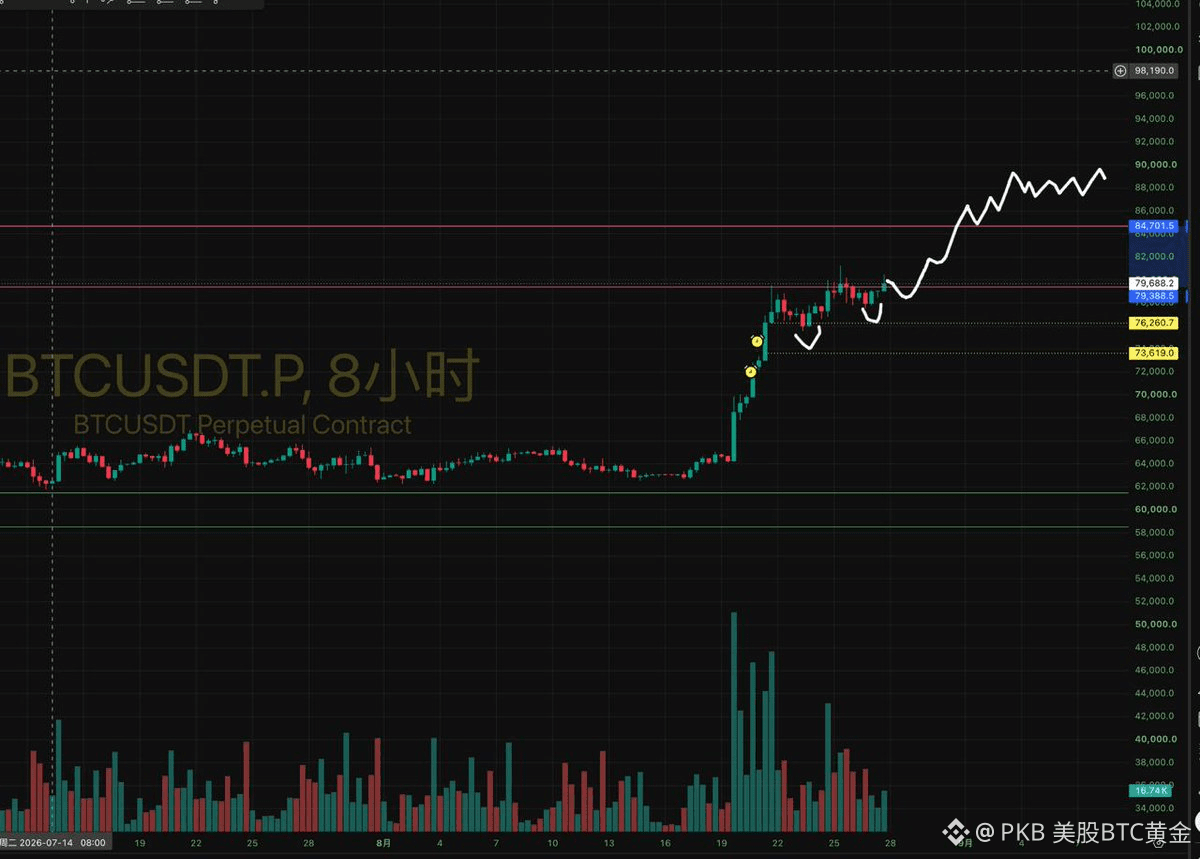
On the 8-hour timeframe, it’s very clear that the price is forming a higher low. If it can’t break through directly, then it will most likely pull back and form an even higher low, and then begin the next wave of a real breakout rally!
BTC-0.17%
IBITETF-0.41%
1.5k
Log in to explore more content
Join global crypto users on Binance Square
⚡️ Get latest and useful information about crypto.
💬 Trusted by the world’s largest crypto exchange.
👍 Discover real insights from verified creators.
Email / Phone number