$BTC
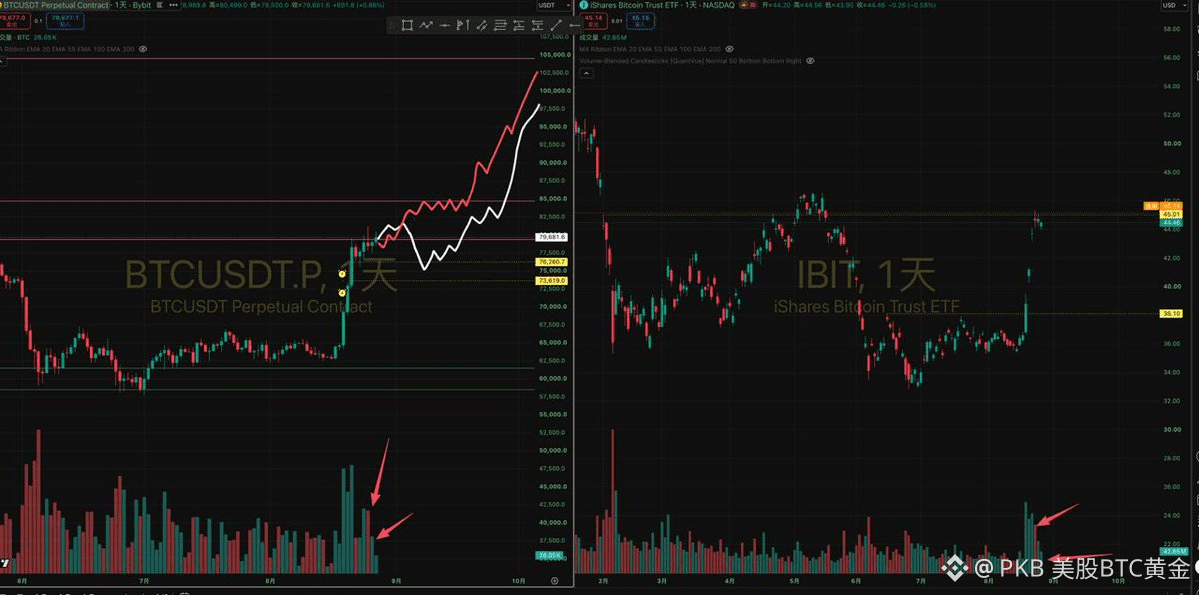
The big pancake (BTC) yesterday on the daily chart did not continue the previous day's volume-expansion bearish candle. Instead, it moved into a bullish candle. From the daily chart, I think the overall demand is still relatively strong. Also, from the daily chart, it looks like the overall bottom is gradually rising. From IBIT’s daily chart, we can see that IBIT yesterday opened lower but then moved higher, closing as a bearish candle. The overall trading volume is still relatively low, which suggests there isn’t much selling pressure here—it's just that demand is not yet sufficient to push the price upward.
There are two scenarios on the daily timeframe: one is that it meets resistance around 795, pulls back, and then tests around 763. The other scenario is that the bottom is higher than the prior bottom and it breaks upward directly, reaching the range of 80–85. Personally, I believe that if the market consolidates like this for a while, then on the next time it sees a volume expansion, the breakout and rally will most likely push through 8.5 and go to a higher level!
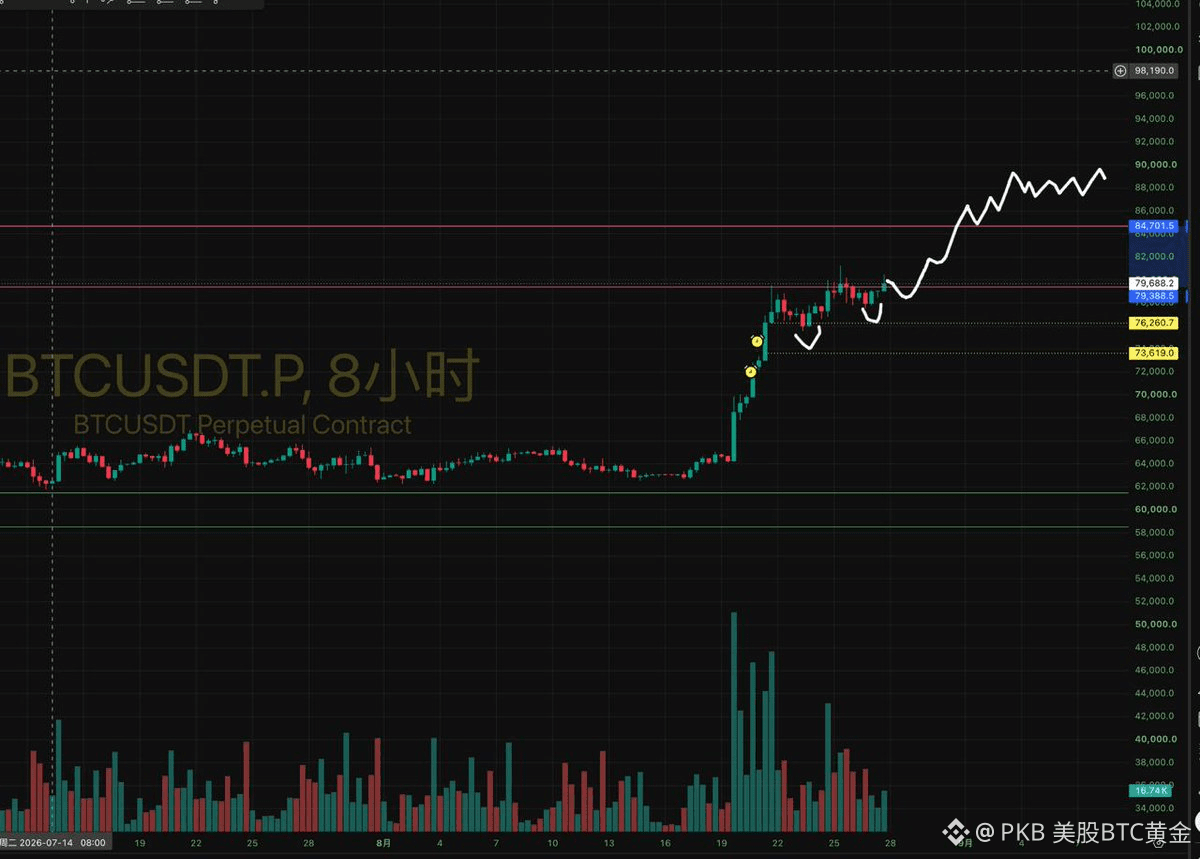
On the 8-hour timeframe, it’s very clear that the price is forming a higher low. If it can’t break through directly, then it will most likely pull back and form an even higher low, and then begin the next wave of a real breakout rally!