
欧鹏
4.5k Posts

欧鹏
Report
Block User
美股&黄金&BTC|长线趋势交易者|公众号:欧鹏说|邀请码77VIP 每笔交易自动返 20% 手续费
Frequent Trader
2.5 Years
8 Following
2.5K+ Followers
4.5K+ Liked
Posts
All
Quotes
Videos
Live
·
--
Bullish
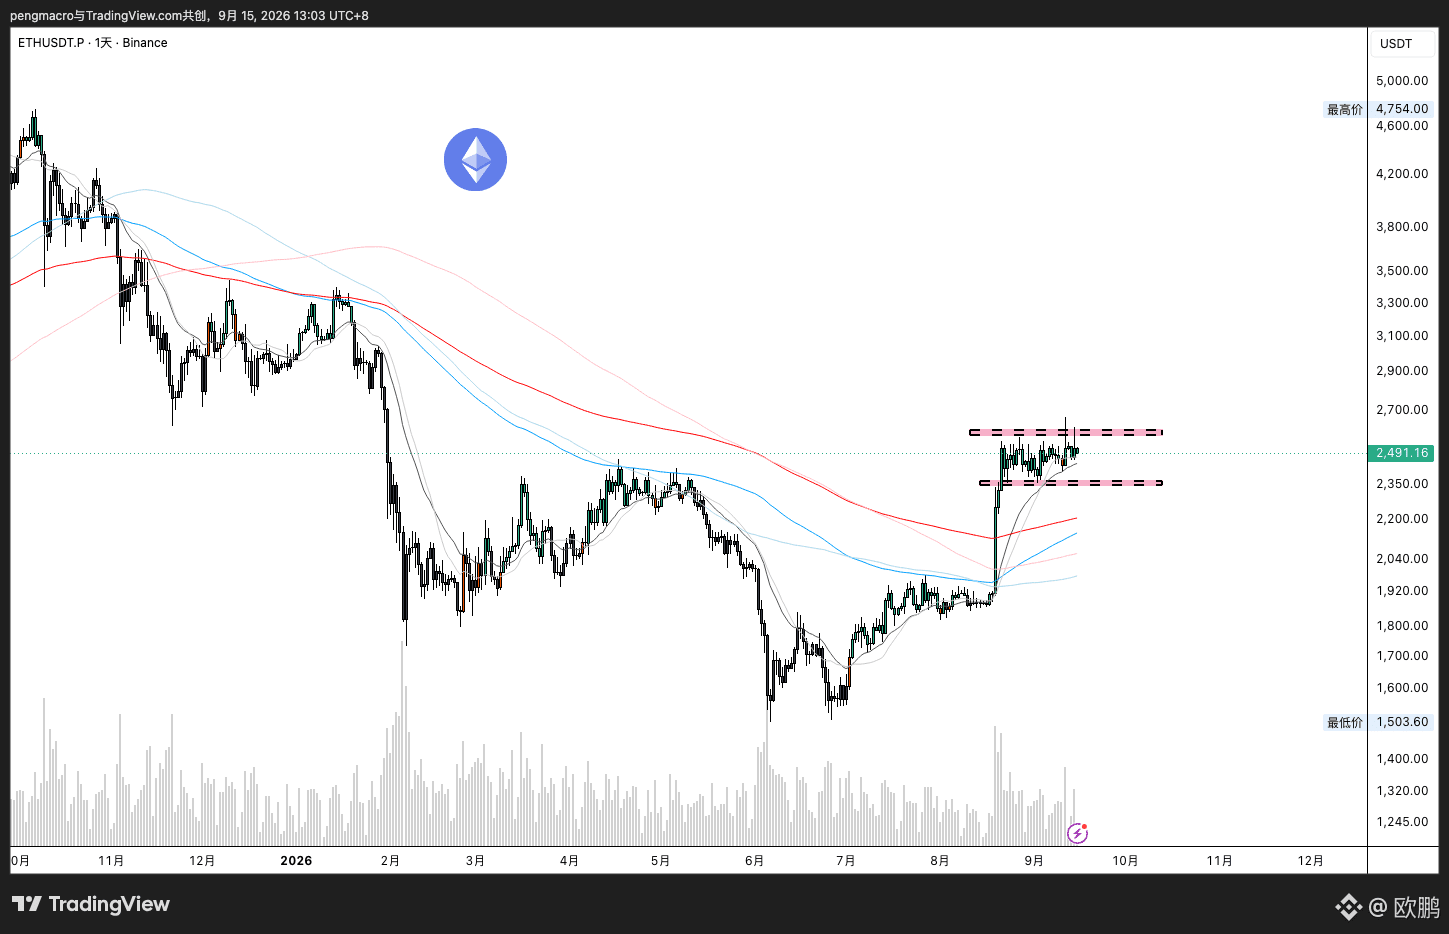
It’s been another month of choppy trading already; the market is waiting for a signal📶
For the short term, I still recommend waiting until the signal is out before taking action
For the long term, I suggest starting to build your position now in batches
After all, I’m bullish for the long term
$BTC
{future}(BTCUSDT)
$ETH
{future}(ETHUSDT)
It’s been another month of choppy trading already; the market is waiting for a signal📶
For the short term, I still recommend waiting until the signal is out before taking action
For the long term, I suggest starting to build your position now in batches
After all, I’m bullish for the long term
$BTC
$ETH
For the short term, I still recommend waiting until the signal is out before taking action
For the long term, I suggest starting to build your position now in batches
After all, I’m bullish for the long term
$BTC
$ETH
1
282
·
--
Verified
Trump has been urging rate cuts overtly and covertly, believing that only low interest rates can boost the economy and reduce financing costs. White House economic adviser Hassett has even been blunt about it: “There is no reason to raise rates.”
That puts Waller in an especially awkward position. He was nominated and appointed by Trump himself, and people naturally wonder whether he will align with the White House’s intentions.
Now, the economic data points toward rate hikes, while the political direction points toward rate cuts—effectively placing him directly on the hot seat.
What’s even harder is that no matter which route he takes, he will have to pay a significant price.
If he pushes through with a rate hike: Yes, it can prove to the market the Fed’s determination to bring down inflation. But raising rates is never a magic wand. Former Fed official and chief economist at New Century Advisors, Claudia Sam, has said that rate hikes are more like “an expensive course of medicine”—they can suppress demand but do not solve the inflation driven by rising oil prices. Instead, they would raise borrowing costs across society, dragging down investment and consumption. Not to mention, it would directly slap the White House in the face and would likely anger Trump.
If he chooses to hold steady: The market’s expectations for a rate hike are already fully priced in. Suddenly saying he won’t raise rates would be a surprising twist for the market and could trigger major volatility. Even more critically, external observers would immediately question the Fed’s independence—whether it is conceding under political pressure. The Fed has spent years building policy credibility, and that credibility would be immediately discounted.
Brookings senior fellow David Wessel puts it very directly: This is the first real test Waller has faced since taking office. In plain terms, the core of this meeting has never really been about those 25 basis points.
The real test is how Waller chooses and how he explains it—whether he can make the market believe that the decision follows economic data, not political pressure. If he chooses to raise rates, standing up to political pressure could actually help cement his “independent Fed chair” image. If he chooses not to raise rates, as long as he can lay out the logic behind the inflation outlook clearly enough and convince the market, it would not amount to a loss.
What people fear is that if both sides are trying to take care of their own interests, in the end neither side will accept it.
Trump has been urging rate cuts overtly and covertly, believing that only low interest rates can boost the economy and reduce financing costs. White House economic adviser Hassett has even been blunt about it: “There is no reason to raise rates.”
That puts Waller in an especially awkward position. He was nominated and appointed by Trump himself, and people naturally wonder whether he will align with the White House’s intentions.
Now, the economic data points toward rate hikes, while the political direction points toward rate cuts—effectively placing him directly on the hot seat.
What’s even harder is that no matter which route he takes, he will have to pay a significant price.
If he pushes through with a rate hike: Yes, it can prove to the market the Fed’s determination to bring down inflation. But raising rates is never a magic wand. Former Fed official and chief economist at New Century Advisors, Claudia Sam, has said that rate hikes are more like “an expensive course of medicine”—they can suppress demand but do not solve the inflation driven by rising oil prices. Instead, they would raise borrowing costs across society, dragging down investment and consumption. Not to mention, it would directly slap the White House in the face and would likely anger Trump.
If he chooses to hold steady: The market’s expectations for a rate hike are already fully priced in. Suddenly saying he won’t raise rates would be a surprising twist for the market and could trigger major volatility. Even more critically, external observers would immediately question the Fed’s independence—whether it is conceding under political pressure. The Fed has spent years building policy credibility, and that credibility would be immediately discounted.
Brookings senior fellow David Wessel puts it very directly: This is the first real test Waller has faced since taking office. In plain terms, the core of this meeting has never really been about those 25 basis points.
The real test is how Waller chooses and how he explains it—whether he can make the market believe that the decision follows economic data, not political pressure. If he chooses to raise rates, standing up to political pressure could actually help cement his “independent Fed chair” image. If he chooses not to raise rates, as long as he can lay out the logic behind the inflation outlook clearly enough and convince the market, it would not amount to a loss.
What people fear is that if both sides are trying to take care of their own interests, in the end neither side will accept it.
That puts Waller in an especially awkward position. He was nominated and appointed by Trump himself, and people naturally wonder whether he will align with the White House’s intentions.
Now, the economic data points toward rate hikes, while the political direction points toward rate cuts—effectively placing him directly on the hot seat.
What’s even harder is that no matter which route he takes, he will have to pay a significant price.
If he pushes through with a rate hike: Yes, it can prove to the market the Fed’s determination to bring down inflation. But raising rates is never a magic wand. Former Fed official and chief economist at New Century Advisors, Claudia Sam, has said that rate hikes are more like “an expensive course of medicine”—they can suppress demand but do not solve the inflation driven by rising oil prices. Instead, they would raise borrowing costs across society, dragging down investment and consumption. Not to mention, it would directly slap the White House in the face and would likely anger Trump.
If he chooses to hold steady: The market’s expectations for a rate hike are already fully priced in. Suddenly saying he won’t raise rates would be a surprising twist for the market and could trigger major volatility. Even more critically, external observers would immediately question the Fed’s independence—whether it is conceding under political pressure. The Fed has spent years building policy credibility, and that credibility would be immediately discounted.
Brookings senior fellow David Wessel puts it very directly: This is the first real test Waller has faced since taking office. In plain terms, the core of this meeting has never really been about those 25 basis points.
The real test is how Waller chooses and how he explains it—whether he can make the market believe that the decision follows economic data, not political pressure. If he chooses to raise rates, standing up to political pressure could actually help cement his “independent Fed chair” image. If he chooses not to raise rates, as long as he can lay out the logic behind the inflation outlook clearly enough and convince the market, it would not amount to a loss.
What people fear is that if both sides are trying to take care of their own interests, in the end neither side will accept it.

1
2.2k
·
--
Bullish
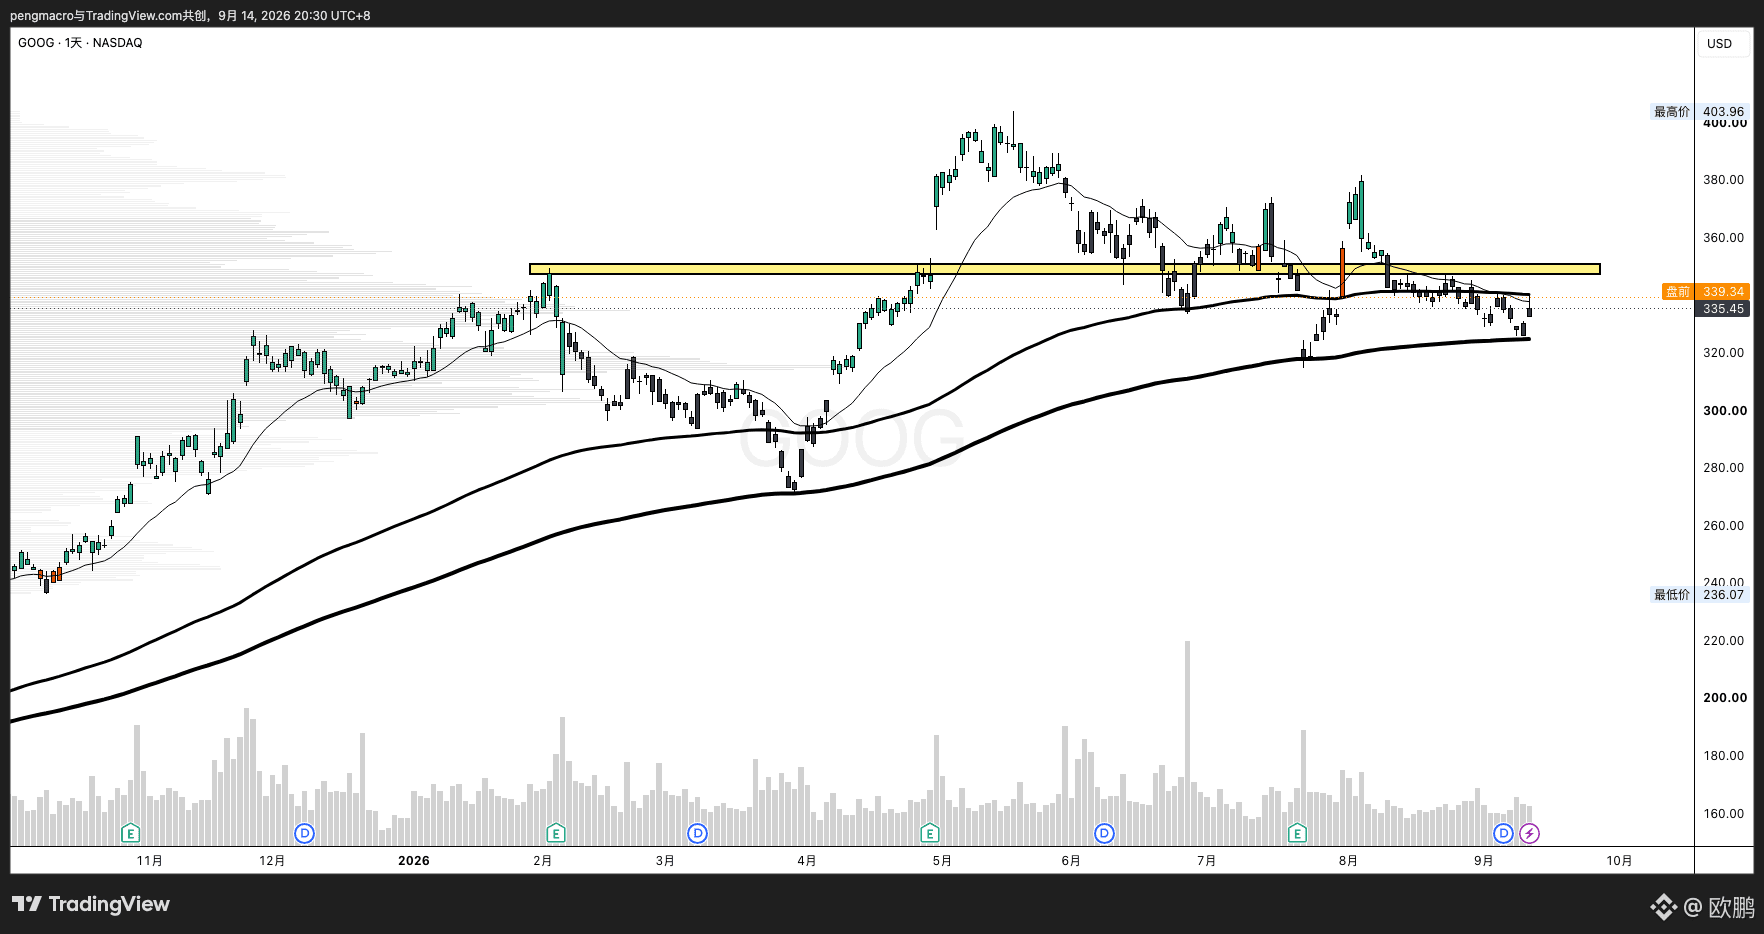
U.S. stock technology shares are all down in pre-market trading, but the old-school $GOOGL is up pre-market 🚀
If the price can break above $350, the upside will open up.
{future}(GOOGLUSDT)
U.S. stock technology shares are all down in pre-market trading, but the old-school $GOOGL is up pre-market 🚀
If the price can break above $350, the upside will open up.
If the price can break above $350, the upside will open up.
欧鹏
·
--
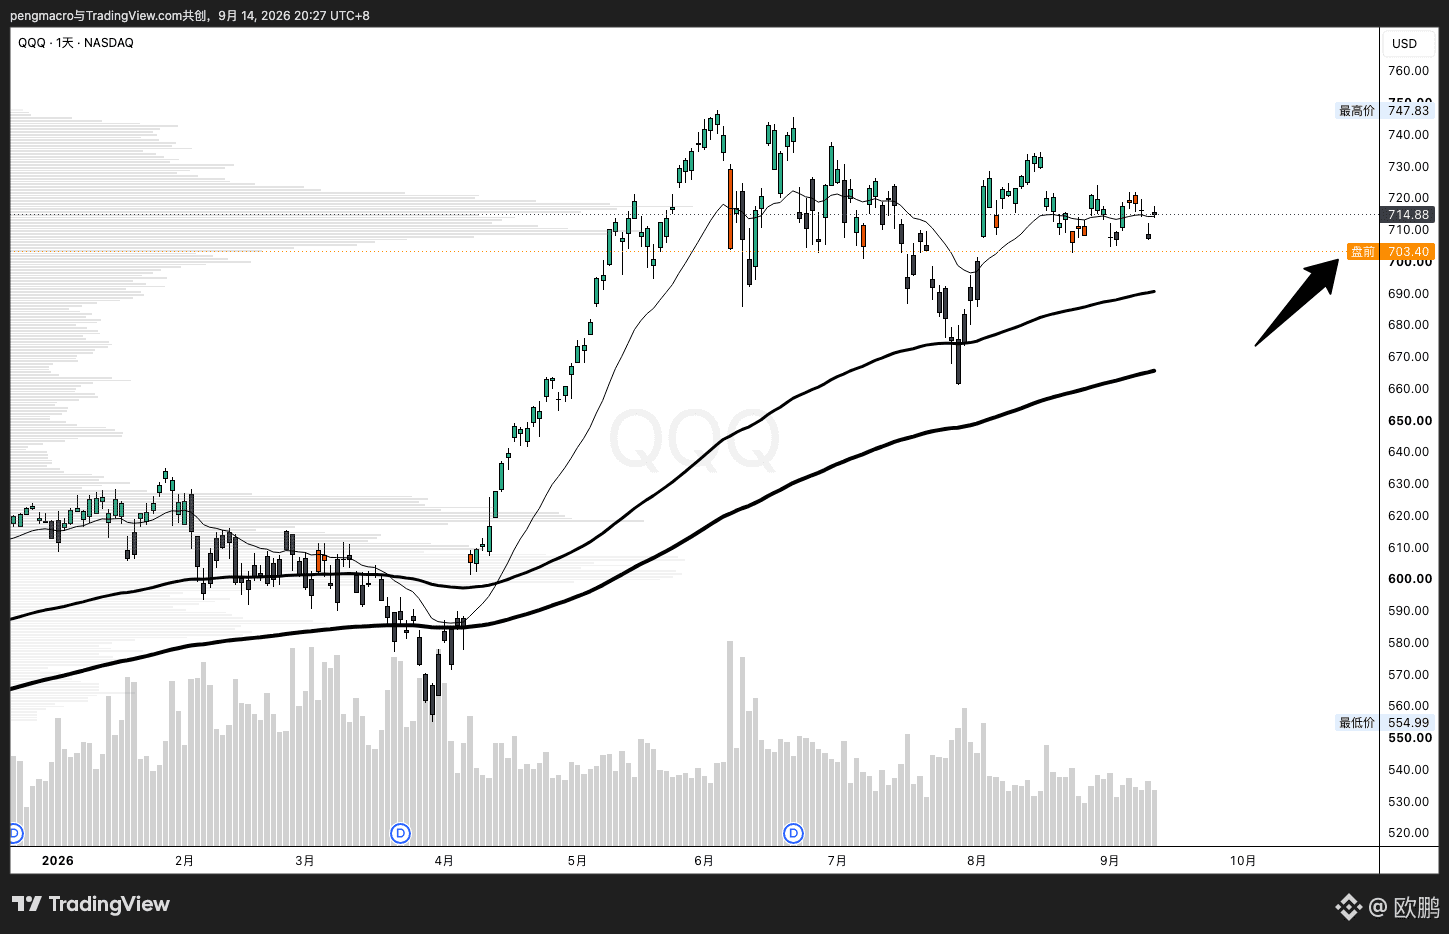
BearishUS tech stocks tonight look bad. Pre-market is down quite a bit ($QQQ )‼️
$SNDK $MU
$SNDK $MU
258
·
--
Bearish
Verified
US tech stocks tonight look bad. Pre-market is down quite a bit ($QQQ )‼️
$SNDK $MU
{future}(MUUSDT)
{future}(SNDKUSDT)
{future}(QQQUSDT)
US tech stocks tonight look bad. Pre-market is down quite a bit ($QQQ )‼️
$SNDK $MU
$SNDK $MU
1
583
·
--
Bullish
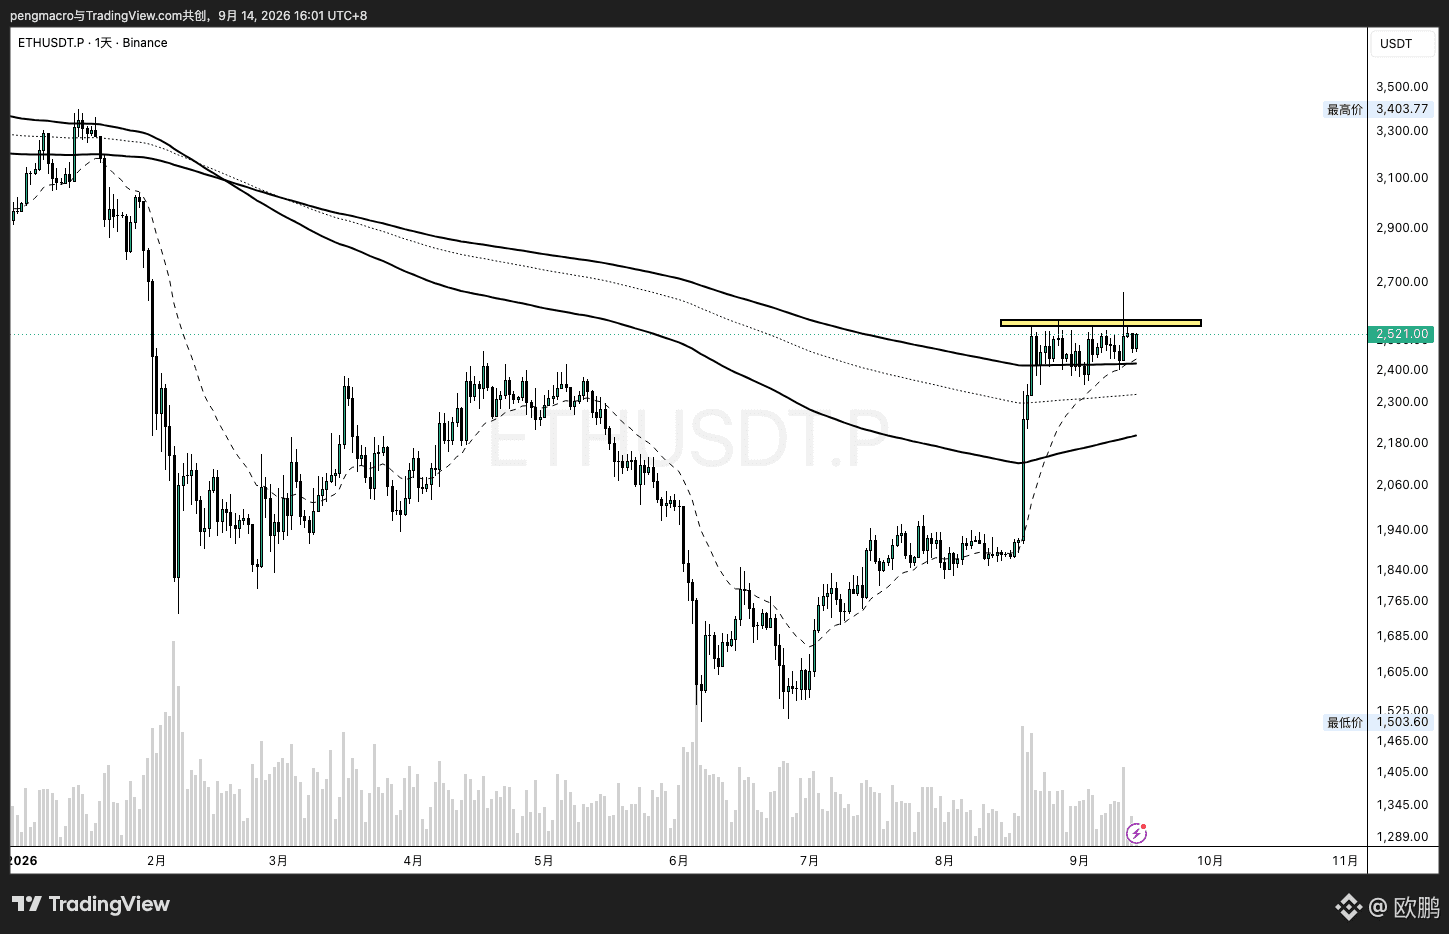
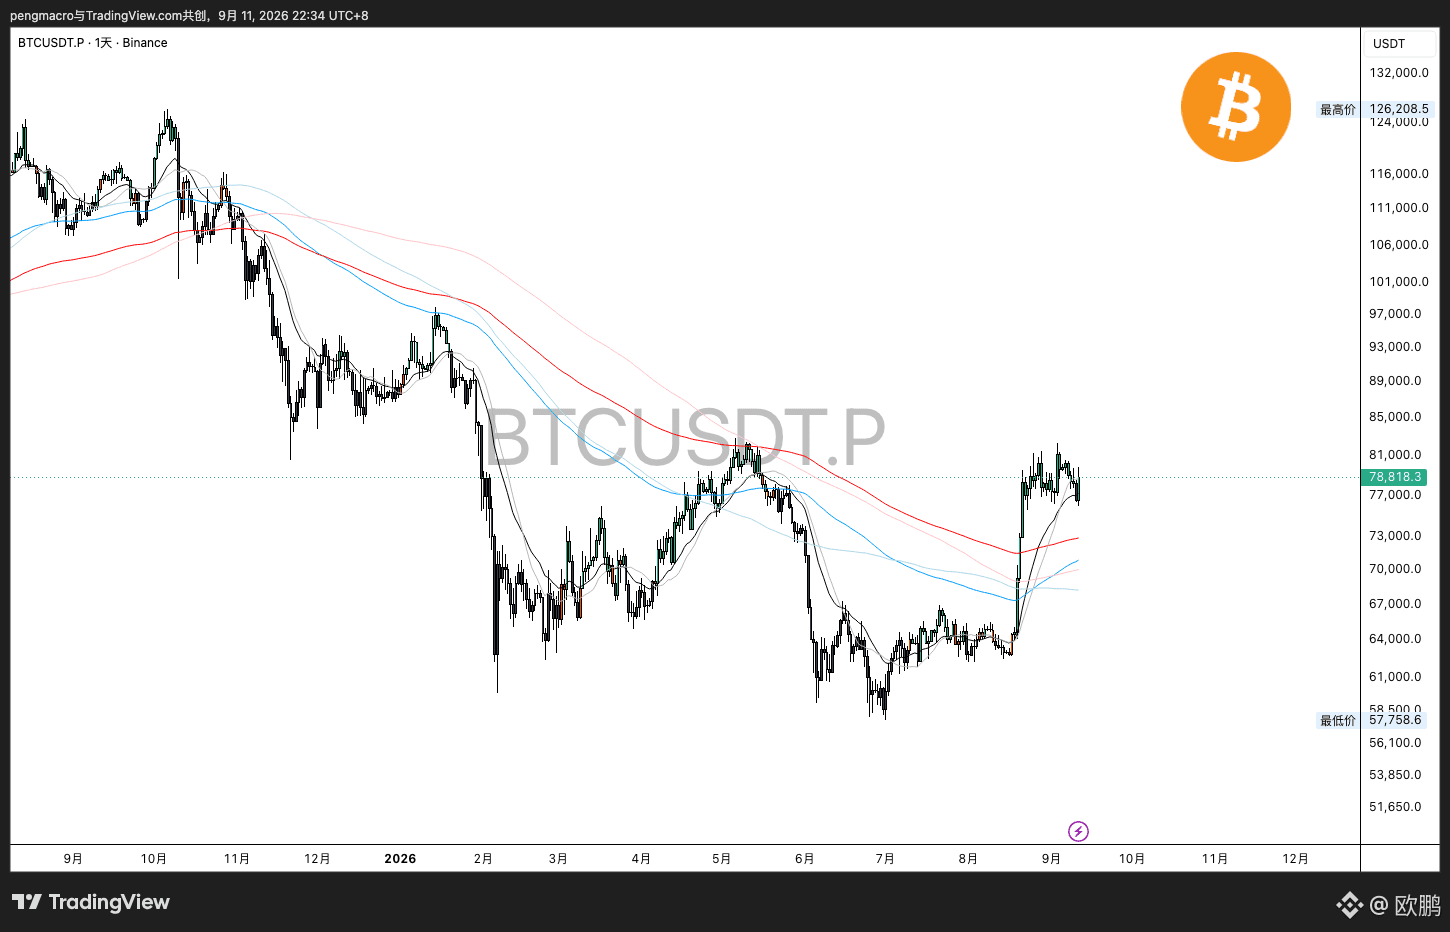
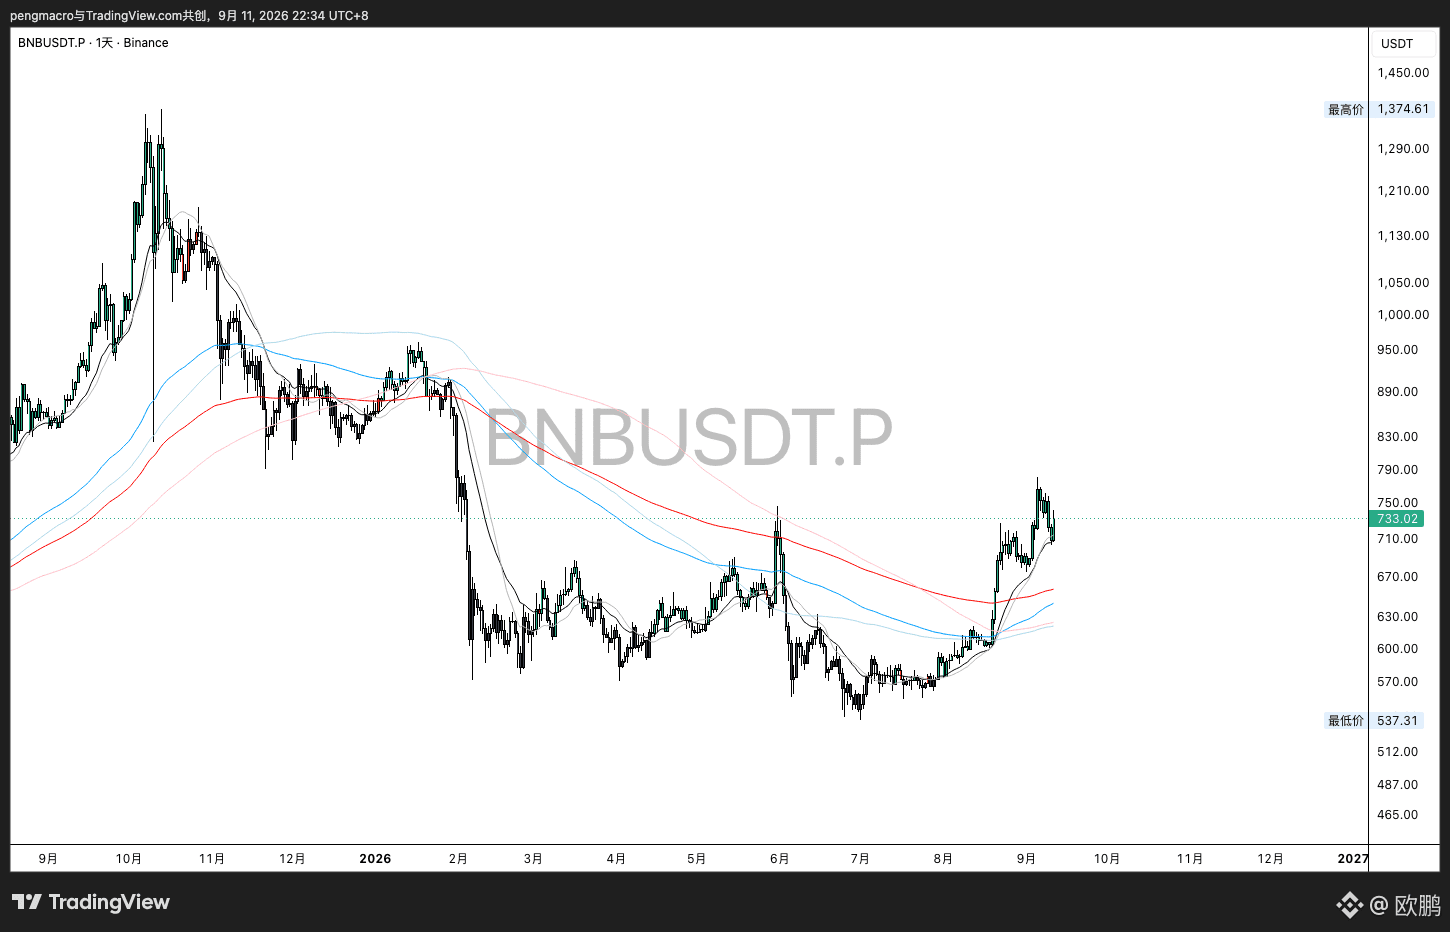
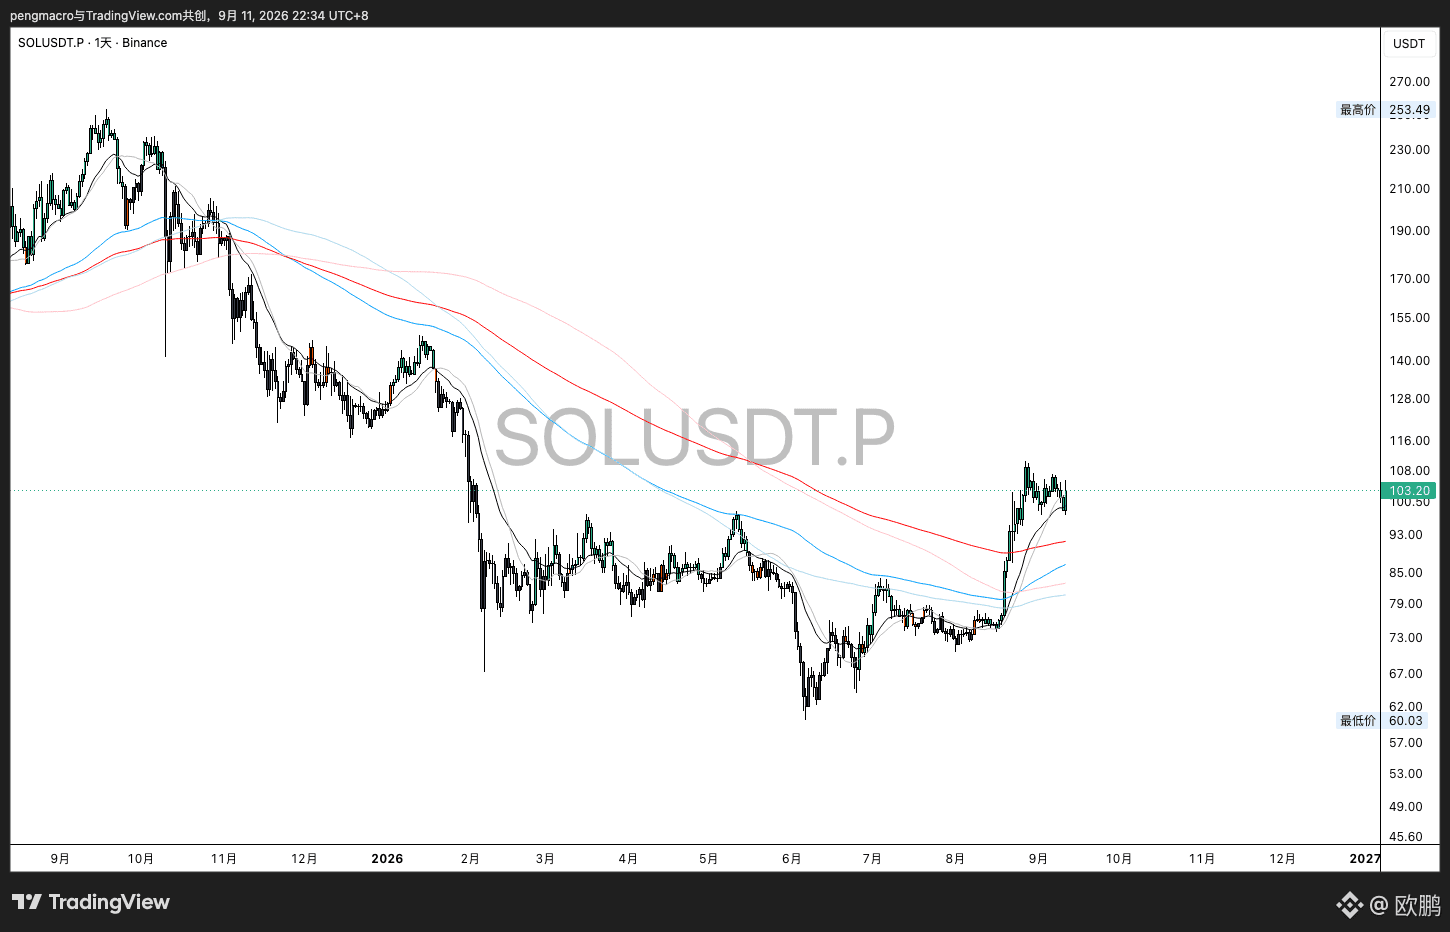
It’s the same with mainstream coins—if the market is going up, which one should you choose to go long? $ETH > $BNB
Among BTC, ETH, BNB, SOL, and XRP, only ETH and BNB have their prices above all moving averages on the daily timeframe.
If the market rises, they are the two with the least resistance and the best stop-loss to manage.
{future}(ETHUSDT)
{future}(BNBUSDT)
It’s the same with mainstream coins—if the market is going up, which one should you choose to go long? $ETH > $BNB
Among BTC, ETH, BNB, SOL, and XRP, only ETH and BNB have their prices above all moving averages on the daily timeframe.
If the market rises, they are the two with the least resistance and the best stop-loss to manage.
Among BTC, ETH, BNB, SOL, and XRP, only ETH and BNB have their prices above all moving averages on the daily timeframe.
If the market rises, they are the two with the least resistance and the best stop-loss to manage.
242
·
--
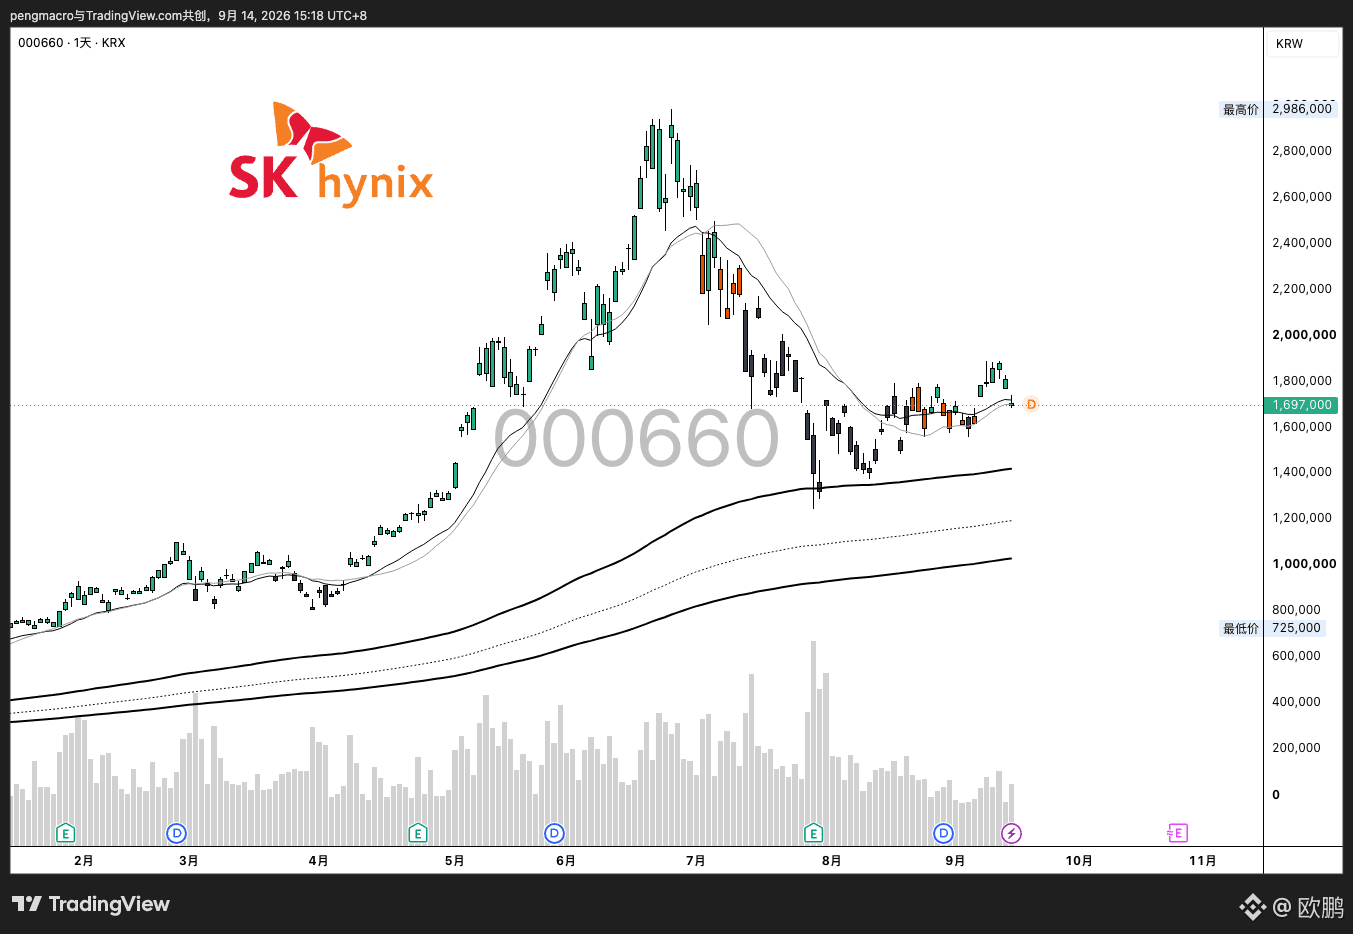
Korea KOSPI Index closed down today‼️
SK Hynix fell $SKHYNIX , Samsung also dropped $SAMSUNG , and both fell quite a bit. This evening, US stocks are likely to trade lower.
{future}(SAMSUNGUSDT)
{future}(SKHYNIXUSDT)
Korea KOSPI Index closed down today‼️
SK Hynix fell $SKHYNIX , Samsung also dropped $SAMSUNG , and both fell quite a bit. This evening, US stocks are likely to trade lower.
SK Hynix fell $SKHYNIX , Samsung also dropped $SAMSUNG , and both fell quite a bit. This evening, US stocks are likely to trade lower.
392
·
--
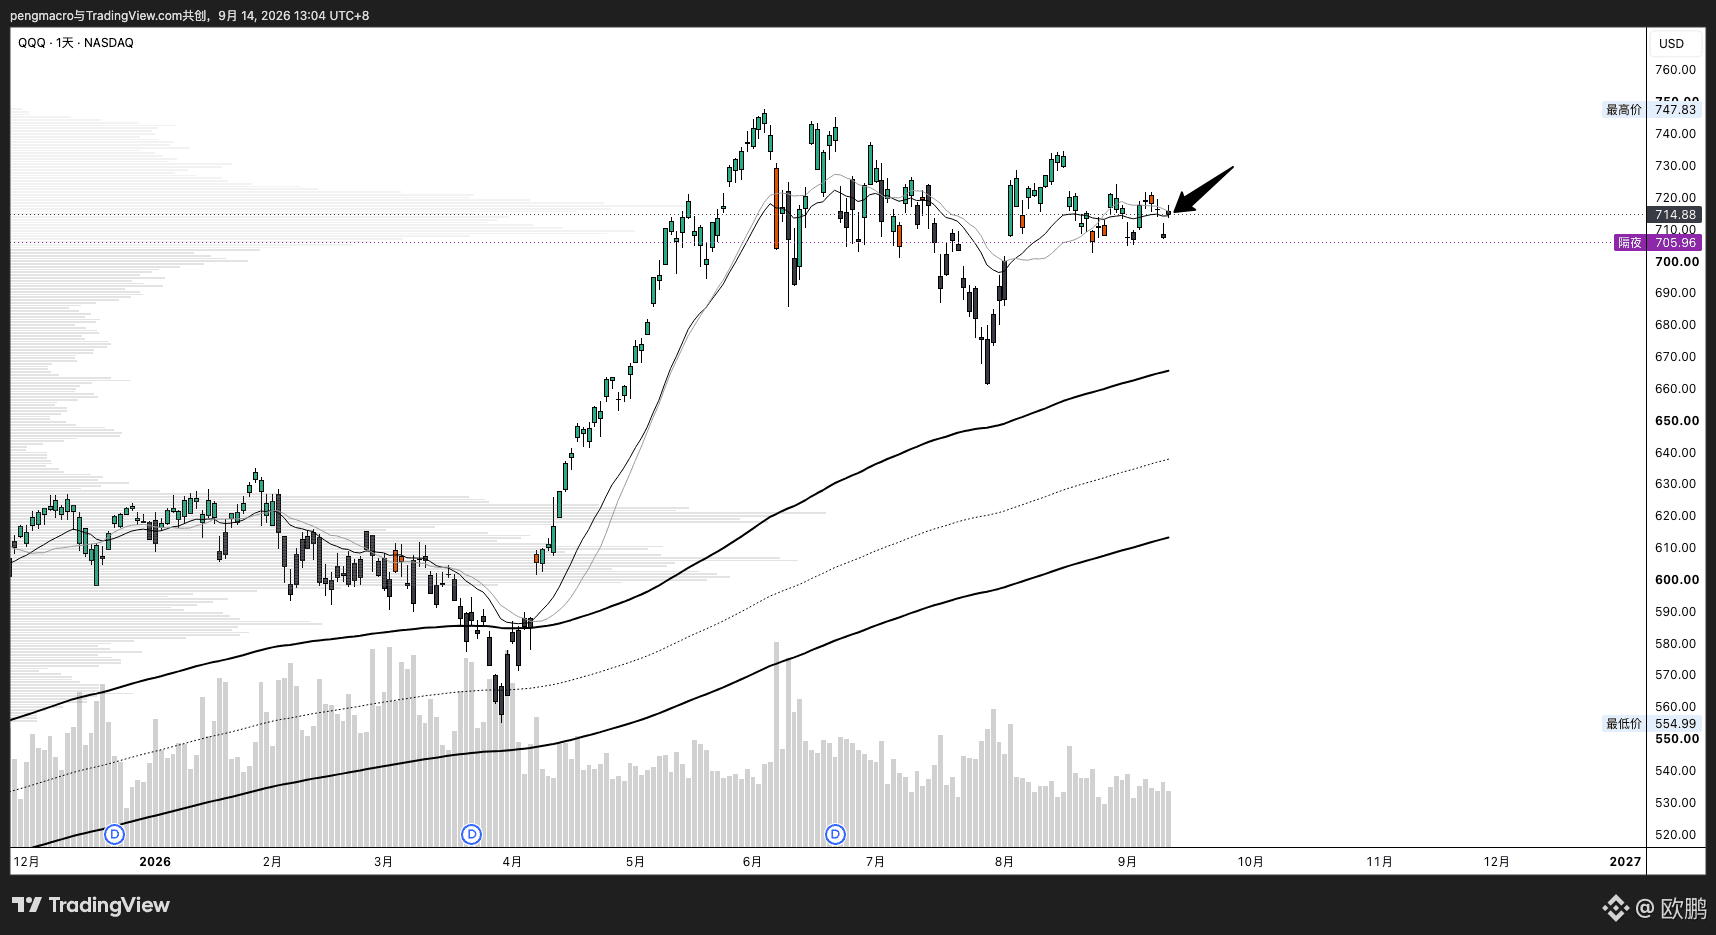
$QQQ has broken below the short-term support 20-day moving average. Where will it stop this time?
{future}(QQQUSDT)
$QQQ has broken below the short-term support 20-day moving average. Where will it stop this time?
302
·
--
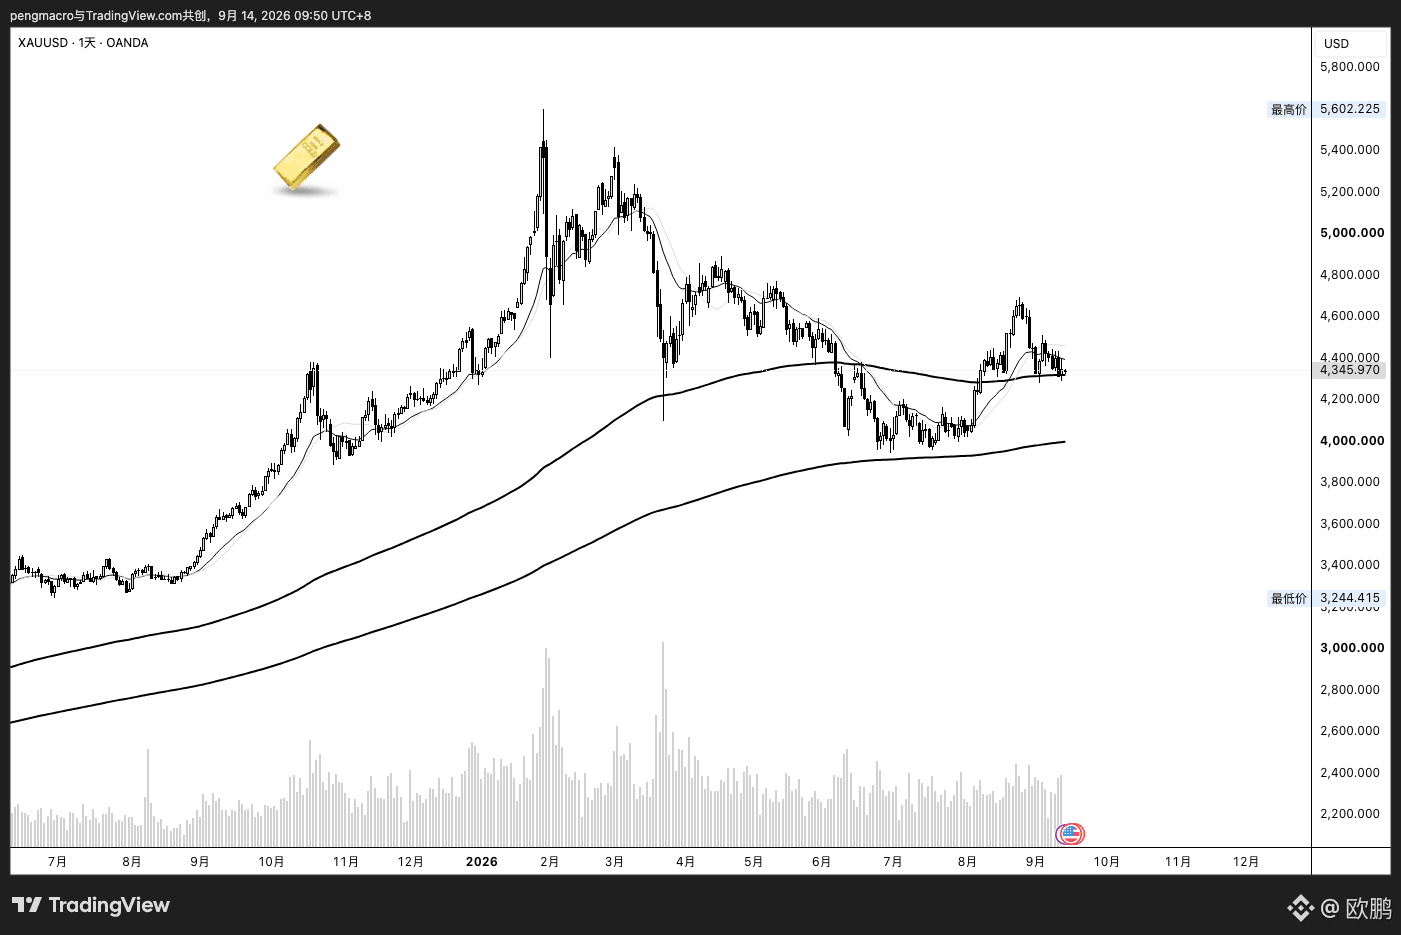
If the Federal Reserve stands pat at its meeting on the 17th, the gap between its stance and what the market has priced in will be transmitted to the U.S. Treasury market, forcing yields higher through Treasury auctions. At that time, the government may intervene in a manner similar to controlling the yield curve—for example, by continuing to conduct Treasury repurchases—which would be a powerful positive catalyst for international spot gold. It would drive international spot gold to surge significantly before the end of the year and gradually move toward the $5,000 target level.
Conversely, if the Federal Reserve ultimately conforms to expectations and raises rates by 25 basis points, given the constraint of an upper limit on rate hikes, the pullback in international spot gold and international spot silver would be very limited.
$XAU
{future}(XAUUSDT)
If the Federal Reserve stands pat at its meeting on the 17th, the gap between its stance and what the market has priced in will be transmitted to the U.S. Treasury market, forcing yields higher through Treasury auctions. At that time, the government may intervene in a manner similar to controlling the yield curve—for example, by continuing to conduct Treasury repurchases—which would be a powerful positive catalyst for international spot gold. It would drive international spot gold to surge significantly before the end of the year and gradually move toward the $5,000 target level.
Conversely, if the Federal Reserve ultimately conforms to expectations and raises rates by 25 basis points, given the constraint of an upper limit on rate hikes, the pullback in international spot gold and international spot silver would be very limited.
$XAU
Conversely, if the Federal Reserve ultimately conforms to expectations and raises rates by 25 basis points, given the constraint of an upper limit on rate hikes, the pullback in international spot gold and international spot silver would be very limited.
$XAU
298
·
--
This week: The "Clear Bill" passes + the Federal Reserve won’t raise rates = crypto takes off
Instead...
$BTC $ETH
{future}(ETHUSDT)
{future}(BTCUSDT)
This week: The "Clear Bill" passes + the Federal Reserve won’t raise rates = crypto takes off
Instead...
$BTC $ETH
Instead...
$BTC $ETH
245
·
--
OpenAI CEO Sam Altman said the company will not go public in 2026 and that the risk of human extinction caused by artificial intelligence—even if only 10%—is unacceptable. Previously, Anthropic CEO Dario Amodei called for a more cautious approach to development, and Altman’s comments suggest the industry may be moving toward consensus on slowing the pace of AI development.
These remarks add fresh uncertainty to the outlook for AI-related tech stocks early this week. Given their impact on the broader AI investment narrative, Nasdaq futures may face some pressure. In addition, discussions about safety and industry views that development could be slowed run counter to the logic of “pursuing growth at all costs,” which has supported valuation for the AI sector this year. However, this news stands in sharp contrast to Anthropic’s ongoing IPO plans, so traders likely won’t interpret it simply as a sign of an industry-wide slowdown, but more as OpenAI’s individual decision. Even so, talk of cross-industry agreements to control the pace at which AI capabilities are developed—along with the political pressure triggered earlier by AI agents running beyond expected boundaries—gives investors reason to remain cautious when opening the market on risk assets tied to AI themes, including chipmakers and hyperscale cloud providers.
OpenAI CEO Sam Altman said the company will not go public in 2026 and that the risk of human extinction caused by artificial intelligence—even if only 10%—is unacceptable. Previously, Anthropic CEO Dario Amodei called for a more cautious approach to development, and Altman’s comments suggest the industry may be moving toward consensus on slowing the pace of AI development.
These remarks add fresh uncertainty to the outlook for AI-related tech stocks early this week. Given their impact on the broader AI investment narrative, Nasdaq futures may face some pressure. In addition, discussions about safety and industry views that development could be slowed run counter to the logic of “pursuing growth at all costs,” which has supported valuation for the AI sector this year. However, this news stands in sharp contrast to Anthropic’s ongoing IPO plans, so traders likely won’t interpret it simply as a sign of an industry-wide slowdown, but more as OpenAI’s individual decision. Even so, talk of cross-industry agreements to control the pace at which AI capabilities are developed—along with the political pressure triggered earlier by AI agents running beyond expected boundaries—gives investors reason to remain cautious when opening the market on risk assets tied to AI themes, including chipmakers and hyperscale cloud providers.
These remarks add fresh uncertainty to the outlook for AI-related tech stocks early this week. Given their impact on the broader AI investment narrative, Nasdaq futures may face some pressure. In addition, discussions about safety and industry views that development could be slowed run counter to the logic of “pursuing growth at all costs,” which has supported valuation for the AI sector this year. However, this news stands in sharp contrast to Anthropic’s ongoing IPO plans, so traders likely won’t interpret it simply as a sign of an industry-wide slowdown, but more as OpenAI’s individual decision. Even so, talk of cross-industry agreements to control the pace at which AI capabilities are developed—along with the political pressure triggered earlier by AI agents running beyond expected boundaries—gives investors reason to remain cautious when opening the market on risk assets tied to AI themes, including chipmakers and hyperscale cloud providers.
129
·
--
Verified
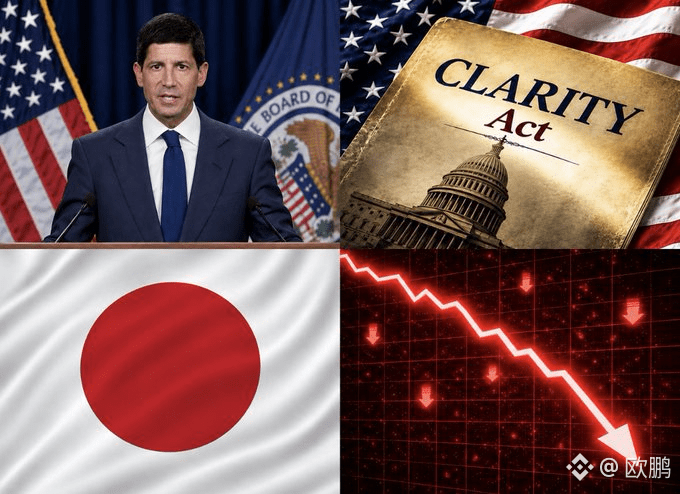
Next week could be an absolute bloodbath for global markets.
September 14: The US market reopens after some of the biggest AI giants spent the weekend issuing warnings that AI growth may need to slow.
This is important because the entire stock market has been riding the bandwagon of AI trading.
September 15: A vote on the “Clear Act” takes place.
Some Republicans, banks, and institutions have already warned it may not pass, which could kill one of the market’s biggest bullish catalysts.
September 16: The Federal Reserve makes its decision on interest rates, with the odds of a rate hike approaching 90%.
Since 2007–08, when expectations have been this strong, the Fed has typically taken the same action.
September 17: US housing data is released, while mortgage rates are already climbing.
If housing starts data begins to collapse, recession fears could become even more severe.
September 18: Japan releases CPI, and the Bank of Japan decides on rates.
If inflation data runs hot, Japan may issue more signals of further rate hikes.
And if the market starts to slide, CTA could sell US stocks worth $140–150 billion.
All of this is concentrated in September, and September has historically already been one of the worst months for the market.
A single bad catalyst is enough to trigger a brutal selloff week across stocks, crypto, and precious metals.
Next week could be an absolute bloodbath for global markets.
September 14: The US market reopens after some of the biggest AI giants spent the weekend issuing warnings that AI growth may need to slow.
This is important because the entire stock market has been riding the bandwagon of AI trading.
September 15: A vote on the “Clear Act” takes place.
Some Republicans, banks, and institutions have already warned it may not pass, which could kill one of the market’s biggest bullish catalysts.
September 16: The Federal Reserve makes its decision on interest rates, with the odds of a rate hike approaching 90%.
Since 2007–08, when expectations have been this strong, the Fed has typically taken the same action.
September 17: US housing data is released, while mortgage rates are already climbing.
If housing starts data begins to collapse, recession fears could become even more severe.
September 18: Japan releases CPI, and the Bank of Japan decides on rates.
If inflation data runs hot, Japan may issue more signals of further rate hikes.
And if the market starts to slide, CTA could sell US stocks worth $140–150 billion.
All of this is concentrated in September, and September has historically already been one of the worst months for the market.
A single bad catalyst is enough to trigger a brutal selloff week across stocks, crypto, and precious metals.
September 14: The US market reopens after some of the biggest AI giants spent the weekend issuing warnings that AI growth may need to slow.
This is important because the entire stock market has been riding the bandwagon of AI trading.
September 15: A vote on the “Clear Act” takes place.
Some Republicans, banks, and institutions have already warned it may not pass, which could kill one of the market’s biggest bullish catalysts.
September 16: The Federal Reserve makes its decision on interest rates, with the odds of a rate hike approaching 90%.
Since 2007–08, when expectations have been this strong, the Fed has typically taken the same action.
September 17: US housing data is released, while mortgage rates are already climbing.
If housing starts data begins to collapse, recession fears could become even more severe.
September 18: Japan releases CPI, and the Bank of Japan decides on rates.
If inflation data runs hot, Japan may issue more signals of further rate hikes.
And if the market starts to slide, CTA could sell US stocks worth $140–150 billion.
All of this is concentrated in September, and September has historically already been one of the worst months for the market.
A single bad catalyst is enough to trigger a brutal selloff week across stocks, crypto, and precious metals.
2
1.6k
·
--
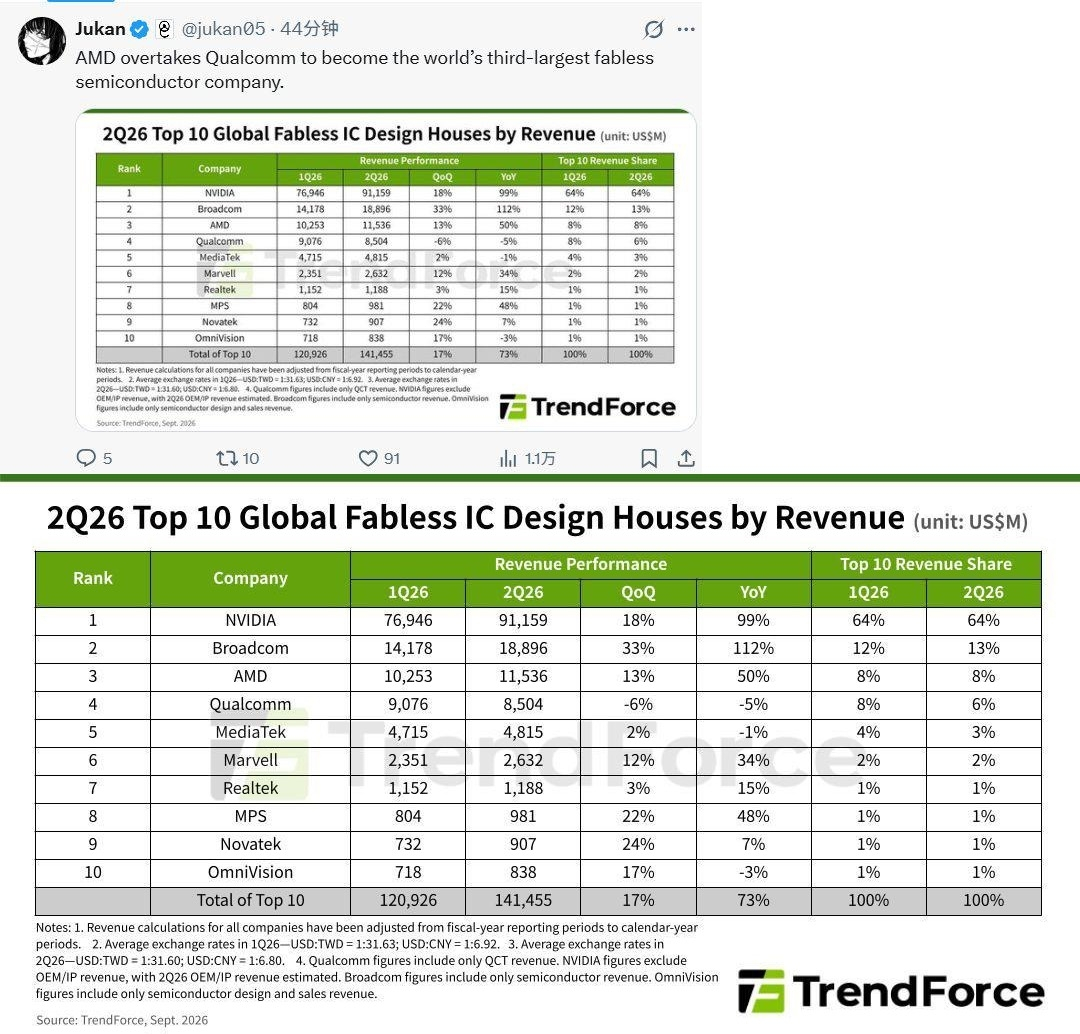
AMD surpasses Qualcomm to become the world’s third-largest fabless semiconductor company.
$AMDB $AMD
{future}(AMDUSDT)
{spot}(AMDBUSDT)
AMD surpasses Qualcomm to become the world’s third-largest fabless semiconductor company.
$AMDB $AMD
$AMDB $AMD
216
·
--
2026-09-14 to 2026-09-20 Financial Data and Events
🔴 US: Federal Reserve interest rate decision as of September 16 (upper limit)
2026-09-14 to 2026-09-20 Financial Data and Events
🔴 US: Federal Reserve interest rate decision as of September 16 (upper limit)
🔴 US: Federal Reserve interest rate decision as of September 16 (upper limit)

254
·
--
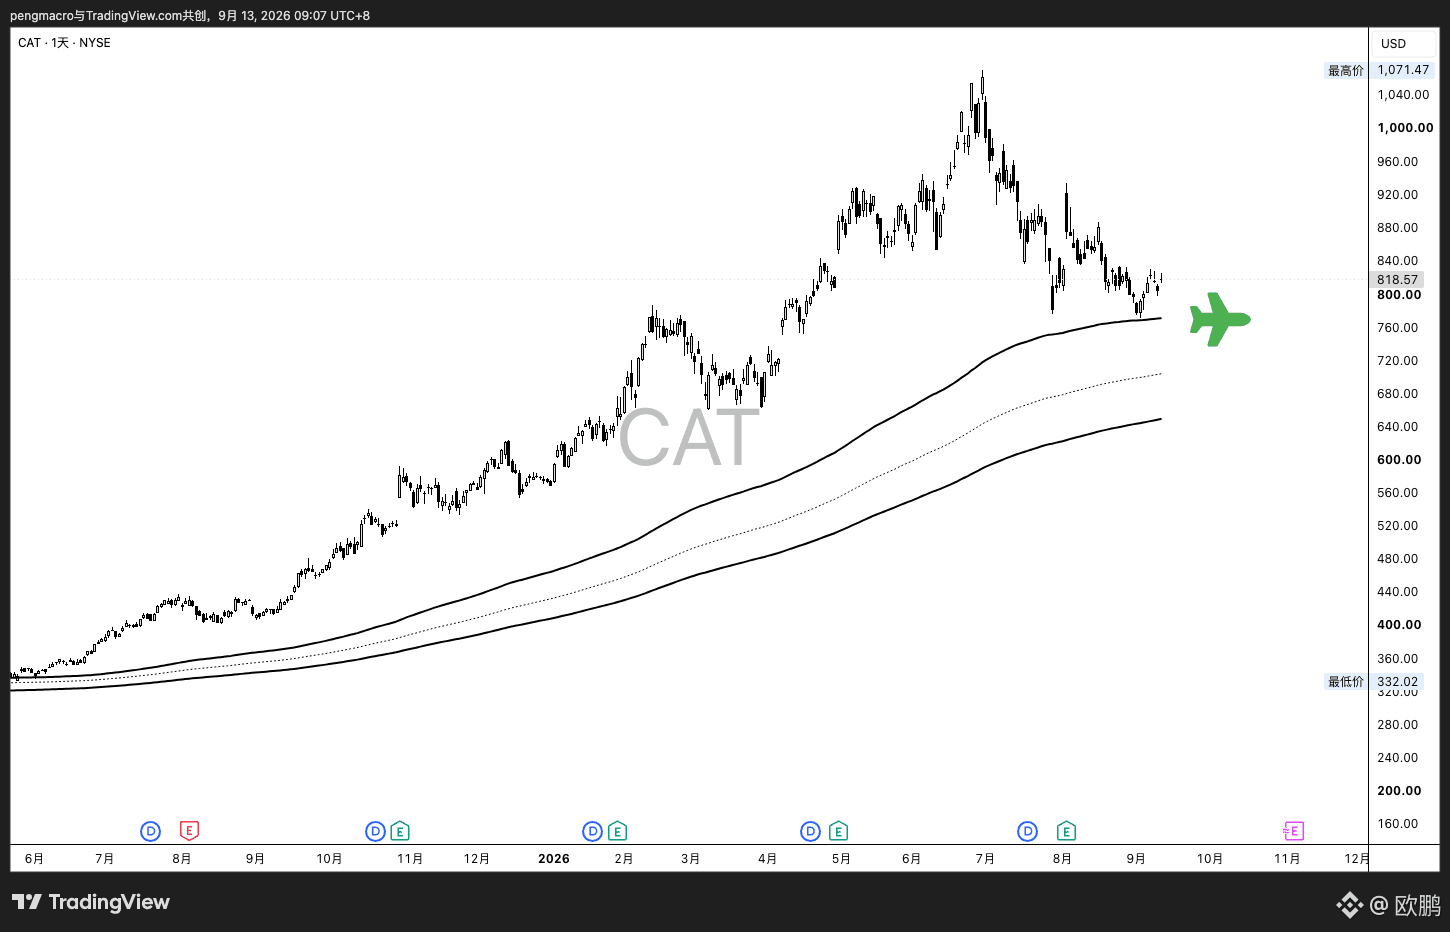
$CAT After a year, once again back to EMA200 moving average.
{future}(CATUSDT)
$CAT After a year, once again back to EMA200 moving average.
270
·
--
Bullish
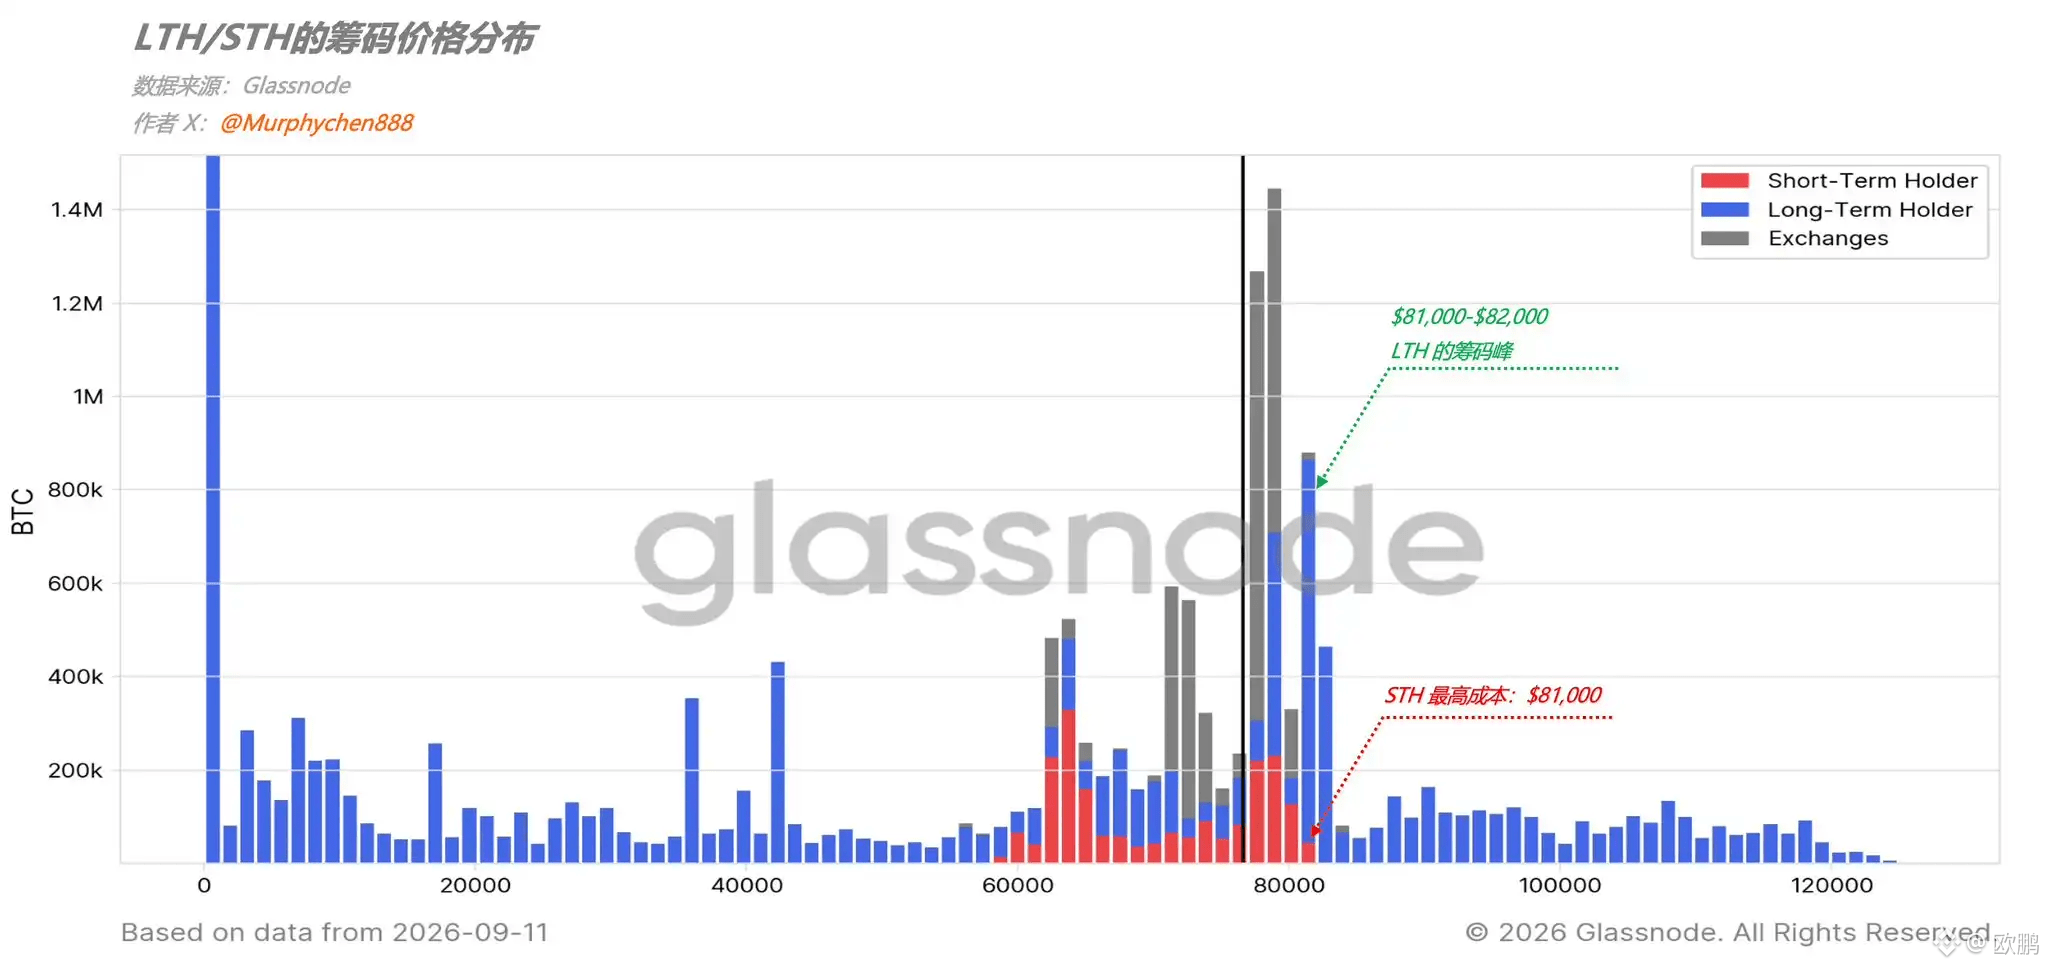
Why is it difficult for Bitcoin to break through $82,000? A battle between short-term holders, long-term holders, and super whales‼️
1. The distribution of short-term holder (STH) cost basis is between $59,000 and $81,000 (red in Figure 1). If it breaks above $82,000, that would mean all STHs are in profit. Some short-term speculative funds may choose to take profits—this is the first layer of selling pressure.
2. The cost basis of long-term holders (LTH) is spread across the entire price axis, but the most concentrated peak sits right between $81,000 and $82,000 (blue in Figure 1). This portion of LTHs may not necessarily be true believers; some are just trapped from buying earlier and then became long-term holders passively. As the price approaches breakeven, they choose to exit. This is the second layer of selling pressure.
3. This is also a hotspot for super whales. Whale groups holding more than 100,000 BTC have 2 clusters around $40,000; the rest are all concentrated between $78,000 and $82,000.
Breaking through $82,000 does face resistance in the short term. The market is digesting differences, and it takes time to absorb supply. Once the market regroups and successfully breaks through again, the road ahead will be wide open.
$BTC $ETH $SOL
{future}(SOLUSDT)
{future}(ETHUSDT)
{future}(BTCUSDT)
Why is it difficult for Bitcoin to break through $82,000? A battle between short-term holders, long-term holders, and super whales‼️
1. The distribution of short-term holder (STH) cost basis is between $59,000 and $81,000 (red in Figure 1). If it breaks above $82,000, that would mean all STHs are in profit. Some short-term speculative funds may choose to take profits—this is the first layer of selling pressure.
2. The cost basis of long-term holders (LTH) is spread across the entire price axis, but the most concentrated peak sits right between $81,000 and $82,000 (blue in Figure 1). This portion of LTHs may not necessarily be true believers; some are just trapped from buying earlier and then became long-term holders passively. As the price approaches breakeven, they choose to exit. This is the second layer of selling pressure.
3. This is also a hotspot for super whales. Whale groups holding more than 100,000 BTC have 2 clusters around $40,000; the rest are all concentrated between $78,000 and $82,000.
Breaking through $82,000 does face resistance in the short term. The market is digesting differences, and it takes time to absorb supply. Once the market regroups and successfully breaks through again, the road ahead will be wide open.
$BTC $ETH $SOL
1. The distribution of short-term holder (STH) cost basis is between $59,000 and $81,000 (red in Figure 1). If it breaks above $82,000, that would mean all STHs are in profit. Some short-term speculative funds may choose to take profits—this is the first layer of selling pressure.
2. The cost basis of long-term holders (LTH) is spread across the entire price axis, but the most concentrated peak sits right between $81,000 and $82,000 (blue in Figure 1). This portion of LTHs may not necessarily be true believers; some are just trapped from buying earlier and then became long-term holders passively. As the price approaches breakeven, they choose to exit. This is the second layer of selling pressure.
3. This is also a hotspot for super whales. Whale groups holding more than 100,000 BTC have 2 clusters around $40,000; the rest are all concentrated between $78,000 and $82,000.
Breaking through $82,000 does face resistance in the short term. The market is digesting differences, and it takes time to absorb supply. Once the market regroups and successfully breaks through again, the road ahead will be wide open.
$BTC $ETH $SOL
欧鹏
·
--
BullishIf Bitcoin $BTC breaks through $80,000, the liquidation intensity of short positions on major CEXs will reach 313 million‼️ If Bitcoin can break above the 82333 level, all the upside space above will be fully opened 🚀🚀🚀
173
·
--
Verified
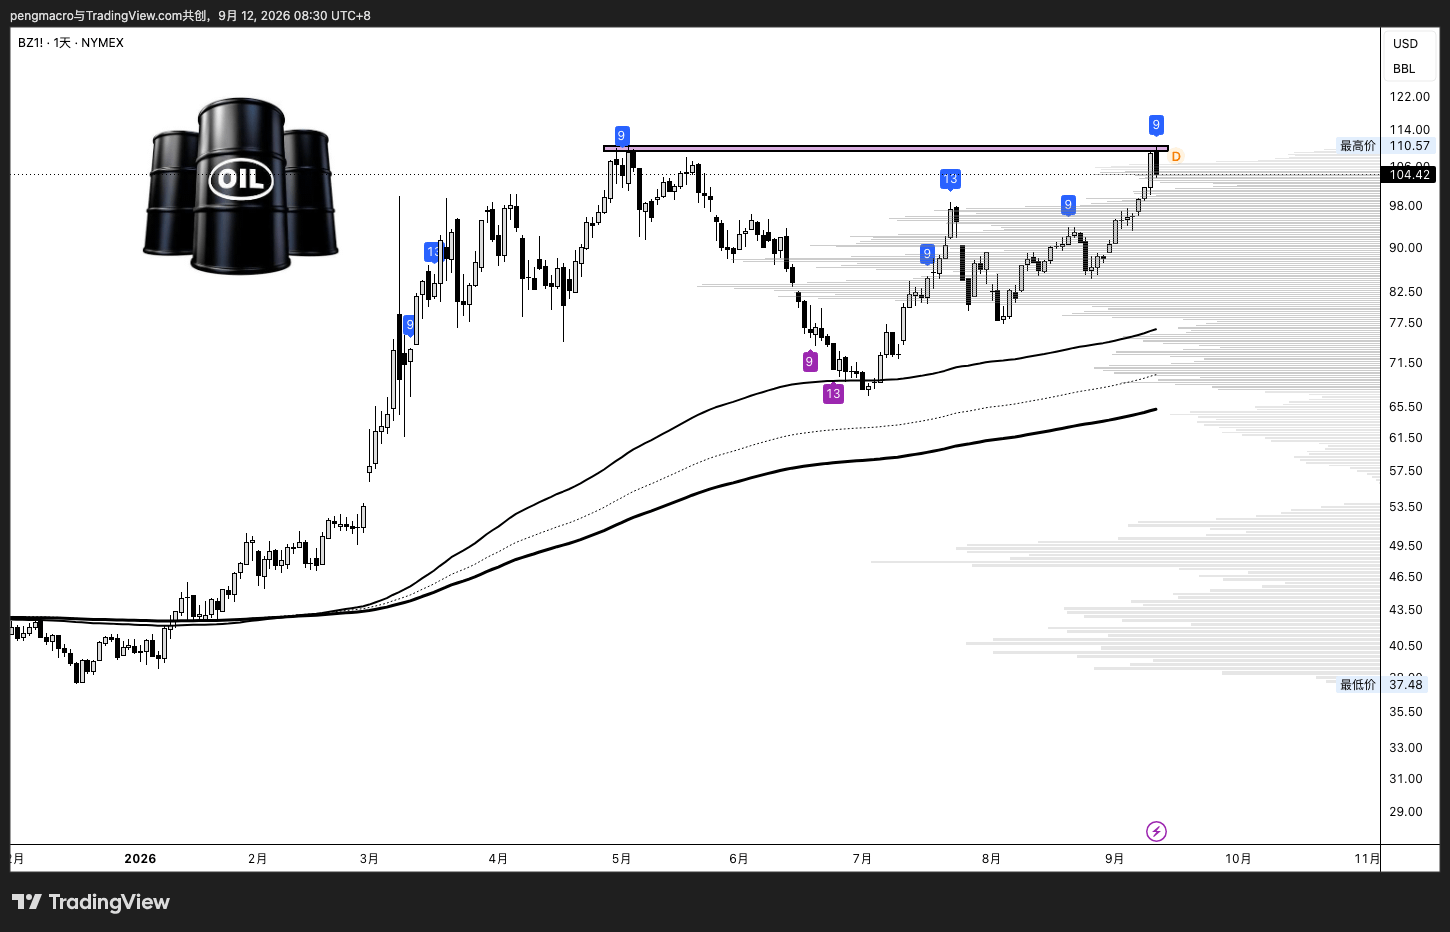
Why was the attack on the Saudi Arabian oil pipeline such a major incident? On September 10, the Houthi armed group’s attack on Saudi Arabia’s east-west oil pipeline severely disrupted operations. The pipeline’s maximum oil transport capacity is up to 7 million barrels per day; actual effective throughput is 5 million to 6 million barrels per day. It serves as an important alternate route to export oil while bypassing the Strait of Hormuz, and it is now shut down. A statement from Saudi Arabia’s Ministry of Energy confirmed that pipelines in the Riyadh and Medina regions were attacked multiple times that morning. As a precaution, the pipeline was closed. The attacks injured several people, who have already received medical treatment. Emergency and technical teams responded immediately, and further developments will be announced in due course. The statement’s wording that the attacks were “multiple” is consistent with some reports claiming up to five attacks within a 100-kilometer radius. If only one pumping station is destroyed, the pipeline can resume operations within a few days at reduced capacity. If multiple pumping stations are destroyed, oil delivery could be interrupted for weeks or even months.
In any case, in a market that is already facing tight supply, all of these oil shipments are currently missing—this explains why oil prices rose sharply yesterday. But for today’s market performance, I wonder whether the market is still underestimating its impact. As a reference point, roughly 20 million barrels of oil are typically transported through the Strait of Hormuz every day. With this pipeline and the U.S. escort forces, there may still be about 11 million to 16 million barrels that can be shipped out, but that amount will be cut in half once the pipeline is closed.
$BZ $CL
{future}(CLUSDT)
{future}(BZUSDT)
Why was the attack on the Saudi Arabian oil pipeline such a major incident? On September 10, the Houthi armed group’s attack on Saudi Arabia’s east-west oil pipeline severely disrupted operations. The pipeline’s maximum oil transport capacity is up to 7 million barrels per day; actual effective throughput is 5 million to 6 million barrels per day. It serves as an important alternate route to export oil while bypassing the Strait of Hormuz, and it is now shut down. A statement from Saudi Arabia’s Ministry of Energy confirmed that pipelines in the Riyadh and Medina regions were attacked multiple times that morning. As a precaution, the pipeline was closed. The attacks injured several people, who have already received medical treatment. Emergency and technical teams responded immediately, and further developments will be announced in due course. The statement’s wording that the attacks were “multiple” is consistent with some reports claiming up to five attacks within a 100-kilometer radius. If only one pumping station is destroyed, the pipeline can resume operations within a few days at reduced capacity. If multiple pumping stations are destroyed, oil delivery could be interrupted for weeks or even months.
In any case, in a market that is already facing tight supply, all of these oil shipments are currently missing—this explains why oil prices rose sharply yesterday. But for today’s market performance, I wonder whether the market is still underestimating its impact. As a reference point, roughly 20 million barrels of oil are typically transported through the Strait of Hormuz every day. With this pipeline and the U.S. escort forces, there may still be about 11 million to 16 million barrels that can be shipped out, but that amount will be cut in half once the pipeline is closed.
$BZ $CL
In any case, in a market that is already facing tight supply, all of these oil shipments are currently missing—this explains why oil prices rose sharply yesterday. But for today’s market performance, I wonder whether the market is still underestimating its impact. As a reference point, roughly 20 million barrels of oil are typically transported through the Strait of Hormuz every day. With this pipeline and the U.S. escort forces, there may still be about 11 million to 16 million barrels that can be shipped out, but that amount will be cut in half once the pipeline is closed.
$BZ $CL
1
1.4k
·
--
Bullish
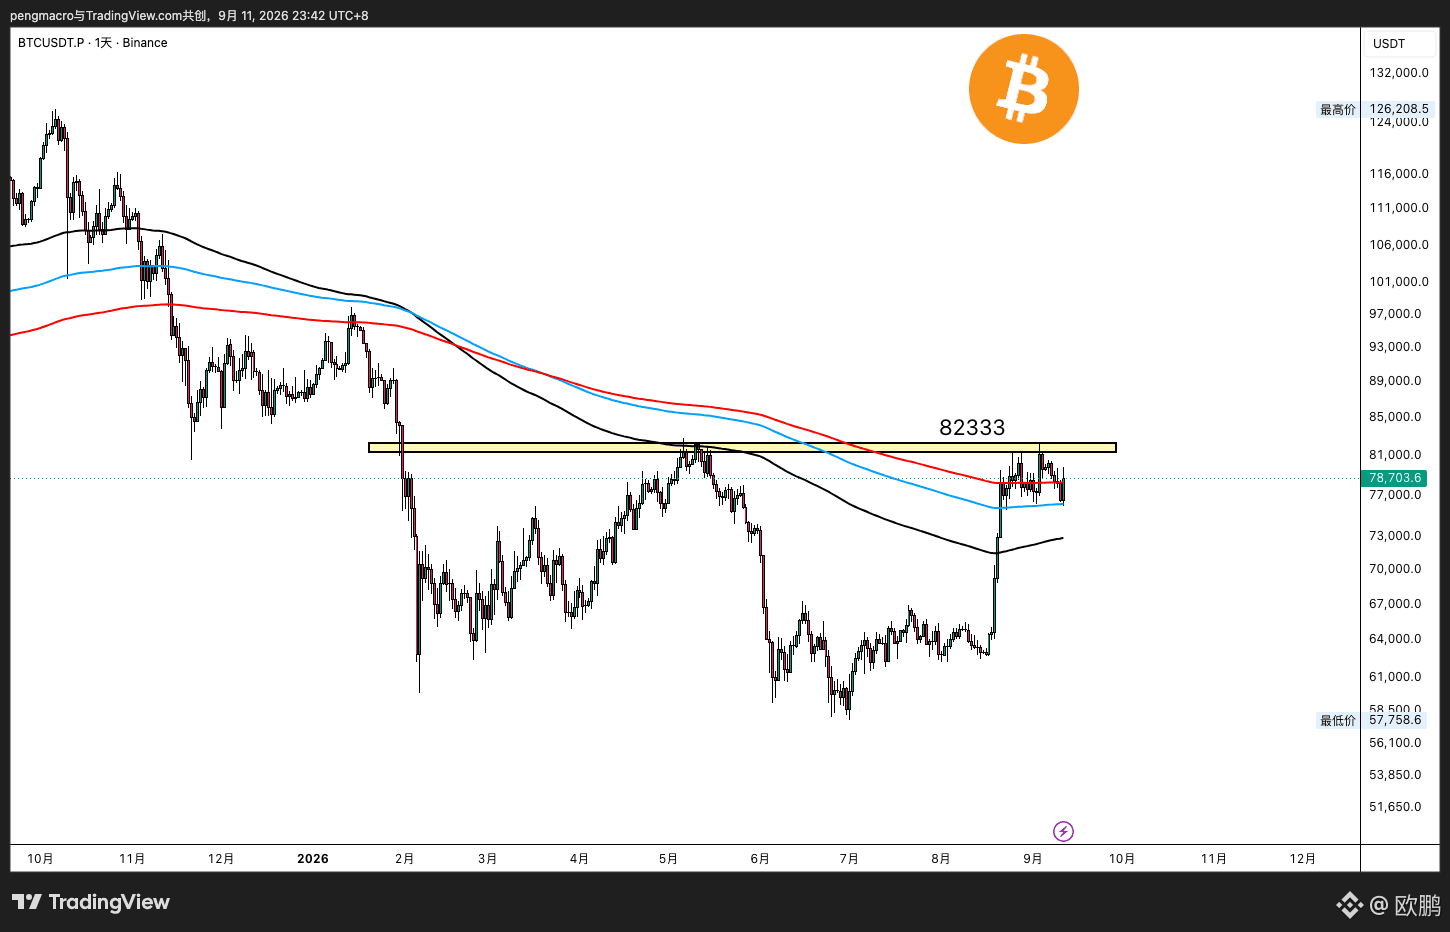
If Bitcoin $BTC breaks through $80,000, the liquidation intensity of short positions on major CEXs will reach 313 million‼️ If Bitcoin can break above the 82333 level, all the upside space above will be fully opened 🚀🚀🚀
{future}(BTCUSDT)
If Bitcoin $BTC breaks through $80,000, the liquidation intensity of short positions on major CEXs will reach 313 million‼️ If Bitcoin can break above the 82333 level, all the upside space above will be fully opened 🚀🚀🚀
1
1
178
·
--
Bullish
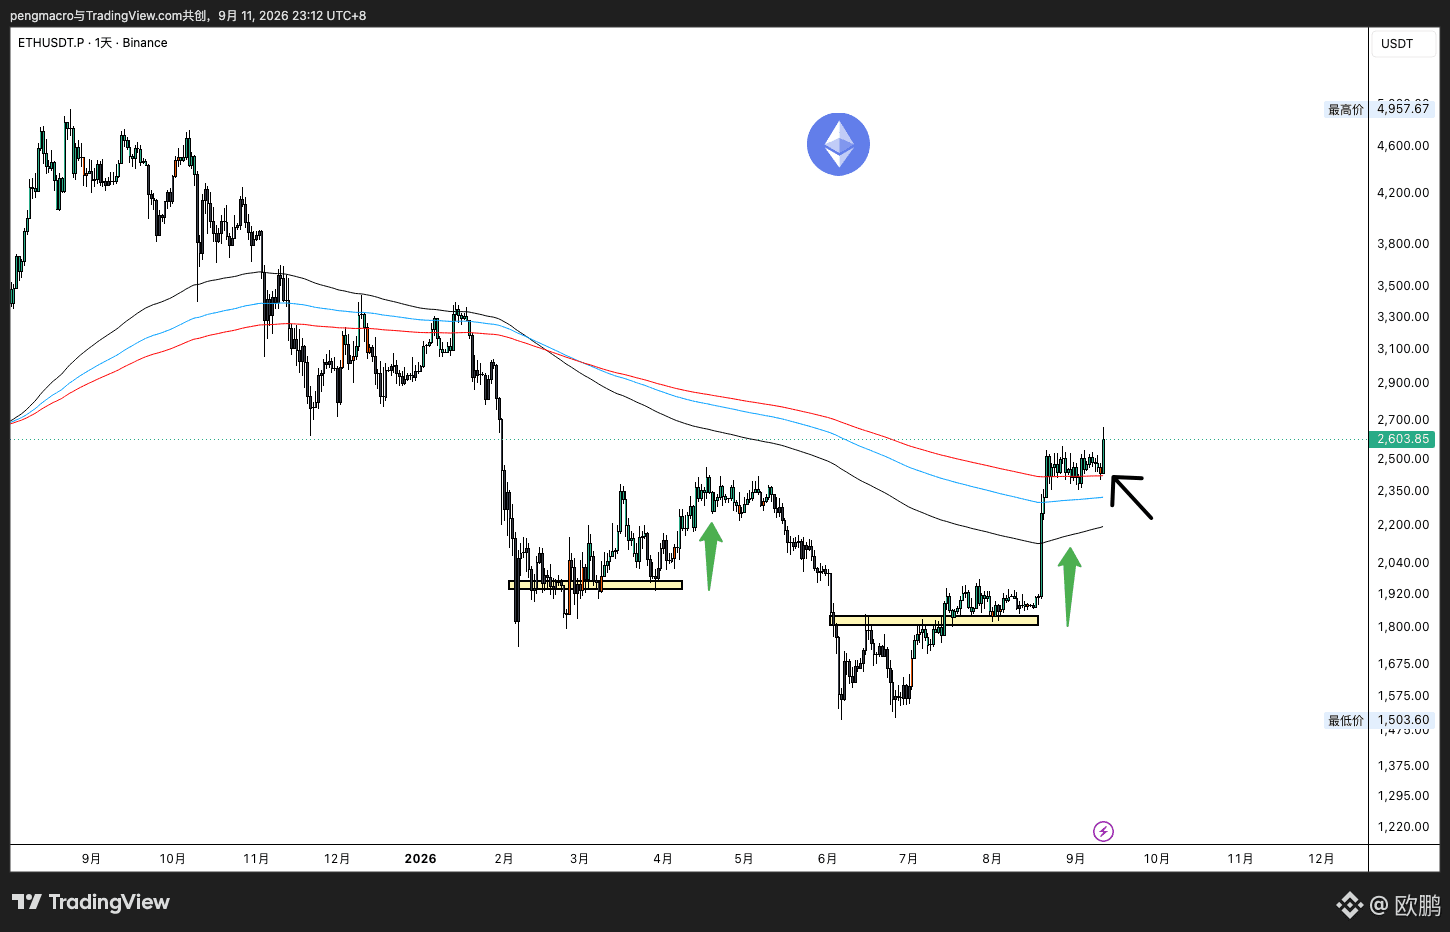
Why has Ethereum $ETH performed best among mainstream coins during tonight’s market rise?
You can check my previous post👇 Ether has been staying around the moving average without dropping below it, while other mainstream coins’ pullbacks have been deeper than Ether’s. On the surface, it looks relatively strong. If we’re going long, then of course we should go with strength.
Before a wave of upward or downward movement at the daily (1D) level, it’s usually been consolidation—consolidation—then consolidation, and this time is the same. After the daily breakout above resistance and moving above the moving average, it pulled back for about 20 days before continuing the breakout tonight.
Now we’ve just come out of the bear market, and the main upswing hasn’t started yet—there’s always an opportunity to enter the position.
{future}(ETHUSDT)
Why has Ethereum $ETH performed best among mainstream coins during tonight’s market rise?
You can check my previous post👇 Ether has been staying around the moving average without dropping below it, while other mainstream coins’ pullbacks have been deeper than Ether’s. On the surface, it looks relatively strong. If we’re going long, then of course we should go with strength.
Before a wave of upward or downward movement at the daily (1D) level, it’s usually been consolidation—consolidation—then consolidation, and this time is the same. After the daily breakout above resistance and moving above the moving average, it pulled back for about 20 days before continuing the breakout tonight.
Now we’ve just come out of the bear market, and the main upswing hasn’t started yet—there’s always an opportunity to enter the position.
You can check my previous post👇 Ether has been staying around the moving average without dropping below it, while other mainstream coins’ pullbacks have been deeper than Ether’s. On the surface, it looks relatively strong. If we’re going long, then of course we should go with strength.
Before a wave of upward or downward movement at the daily (1D) level, it’s usually been consolidation—consolidation—then consolidation, and this time is the same. After the daily breakout above resistance and moving above the moving average, it pulled back for about 20 days before continuing the breakout tonight.
Now we’ve just come out of the bear market, and the main upswing hasn’t started yet—there’s always an opportunity to enter the position.
欧鹏
·
--
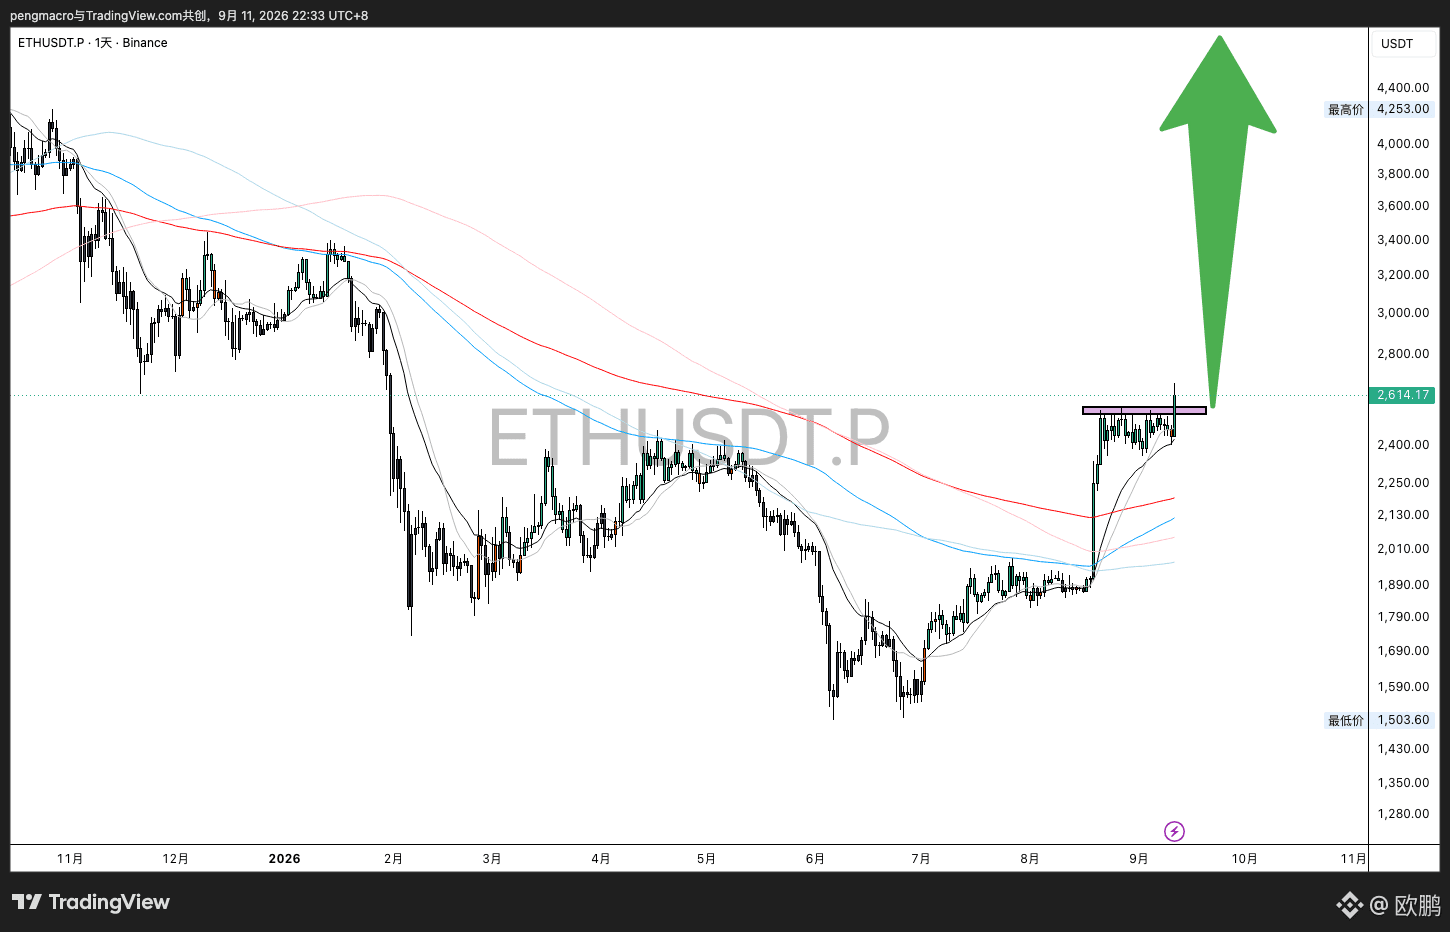
Bullish$ETH is constantly fluctuating above 2400; if it does not break down and fall below, the next target is the heavily clustered supply area near $3000.
275
·
--
Bullish
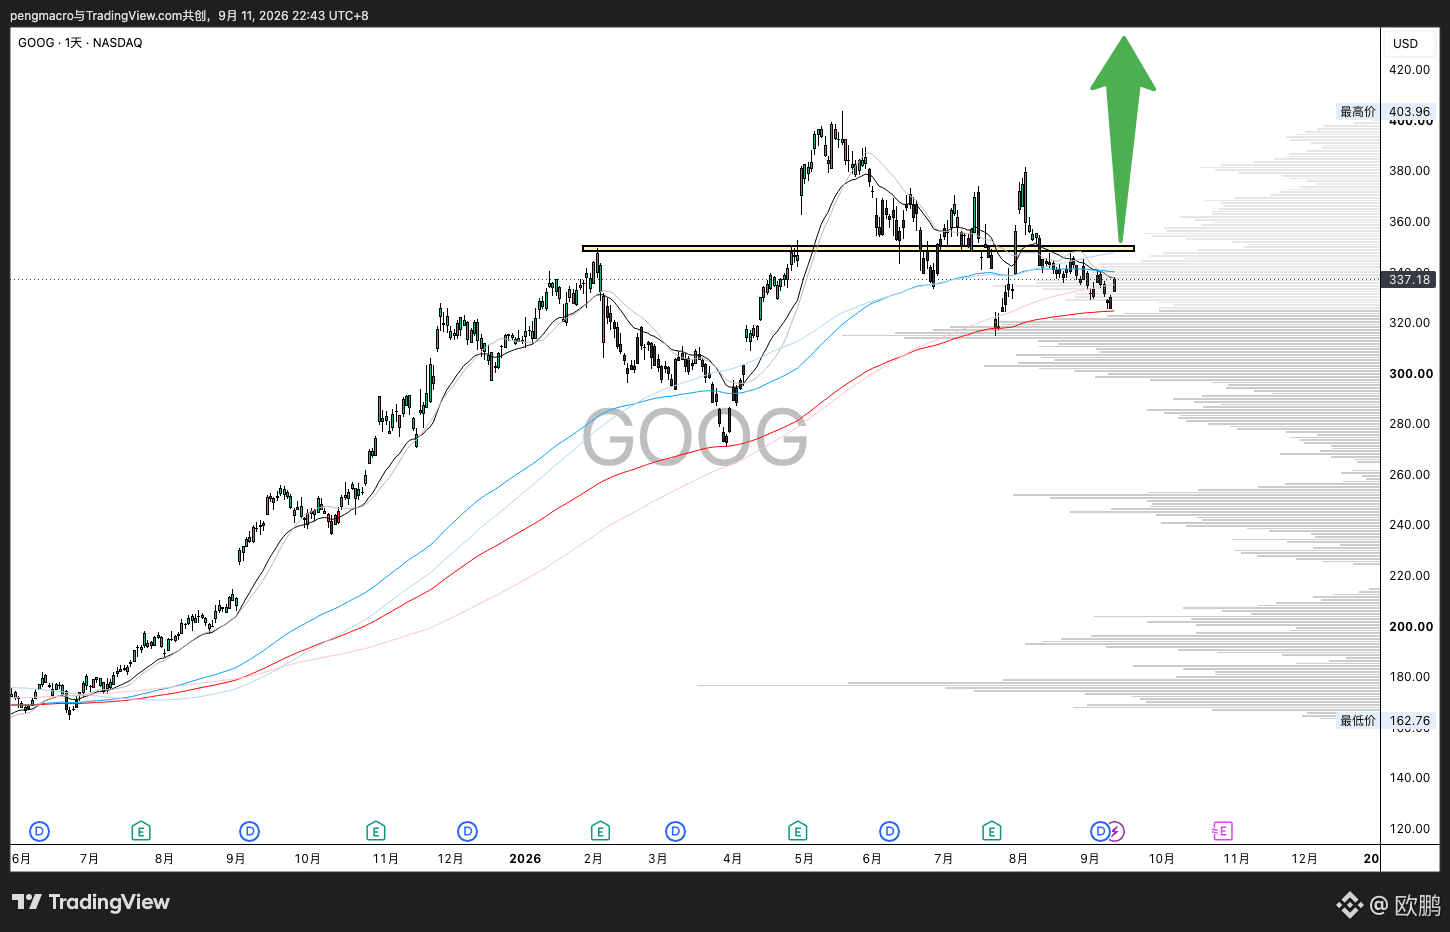
Just one breakout away, and the space above $GOOGL will open up 🚀
{future}(GOOGLUSDT)
Just one breakout away, and the space above $GOOGL will open up 🚀
欧鹏
·
--
BullishLast time & Today
$GOOGL EMA200 In the same place
The current price is 328—will we see a massive rebound in 40 days like last time?
Let’s check again in a while 👀
$GOOGL EMA200 In the same place
The current price is 328—will we see a massive rebound in 40 days like last time?
Let’s check again in a while 👀
353
·
--
Bullish
The market is indeed consistent with what we judged at the beginning of the month. For this pullback, did you already build a long position? Or do you still have two viewpoints? And at the end, update the real-time price:
1. When the market rises again, many people slap their thighs in regret—don’t FOMO. It’s still not too late. The upside space above where the bear market ended has just started, and it hasn’t begun yet.
2. The market is simply long or short. If you judge the bigger direction, your win rate is already 50%. Build positions in batches and hold. When the move comes, you’re the first one sitting on floating profit, while others are still deciding whether to chase—so you can also avoid chasing the rally and killing yourself on pullbacks.
📺 $BTC 79700,$ETH 2666,$BNB 740, SOL 105
{future}(BNBUSDT)
{future}(ETHUSDT)
{future}(BTCUSDT)
The market is indeed consistent with what we judged at the beginning of the month. For this pullback, did you already build a long position? Or do you still have two viewpoints? And at the end, update the real-time price:
1. When the market rises again, many people slap their thighs in regret—don’t FOMO. It’s still not too late. The upside space above where the bear market ended has just started, and it hasn’t begun yet.
2. The market is simply long or short. If you judge the bigger direction, your win rate is already 50%. Build positions in batches and hold. When the move comes, you’re the first one sitting on floating profit, while others are still deciding whether to chase—so you can also avoid chasing the rally and killing yourself on pullbacks.
📺 $BTC 79700,$ETH 2666,$BNB 740, SOL 105
1. When the market rises again, many people slap their thighs in regret—don’t FOMO. It’s still not too late. The upside space above where the bear market ended has just started, and it hasn’t begun yet.
2. The market is simply long or short. If you judge the bigger direction, your win rate is already 50%. Build positions in batches and hold. When the move comes, you’re the first one sitting on floating profit, while others are still deciding whether to chase—so you can also avoid chasing the rally and killing yourself on pullbacks.
📺 $BTC 79700,$ETH 2666,$BNB 740, SOL 105
欧鹏
·
--
BullishBitcoin $BTC 77200, Ethereum $ETH 2400, $BNB 688, SOL 99 all meet the two conditions for bullish entry:
1. Price is above the short-, medium-, and long-term lines
2. Price has pulled back to near the short-term MEA20 position
1. Price is above the short-, medium-, and long-term lines
2. Price has pulled back to near the short-term MEA20 position
393
Log in to explore more content
Join global crypto users on Binance Square
⚡️ Get latest and useful information about crypto.
💬 Trusted by the world’s largest crypto exchange.
👍 Discover real insights from verified creators.
Email / Phone number
Trending Topics
BitcoinReboundsTo$79K
23,450 views
226 Discussing
🚨 $BTC is pushing higher.
Bitcoin is trading around $78,804, up roughly 1.9%, after reclaiming the $78K area. The next level to watch is the intraday high near $78,905.
A clean break above that level could open the way toward $79K–$80K. If BTC gets rejected, support sits around $78,300, then $77,975.
Bulls have momentum, but BTC needs to hold above $78K.
#Bitcoin #BTC #CryptoTrading #CryptoMarket #CryptoAnalysis
PulseON
·19 Likes
·18.7k views
USDCOnChainVolumeTops$100Trillion
0 views
0 Discussing
BitcoinSpotETFsNetInflow$160M
797 views
51 Discussing