
Nova Ledger
846 Posts

Nova Ledger
Report
Block User
Crypto Master, Expert Trader and Content Creator • X: @NovaLedgeer
63 Following
8.6K+ Followers
175 Liked
Posts
All
Live
·
--
Bullish
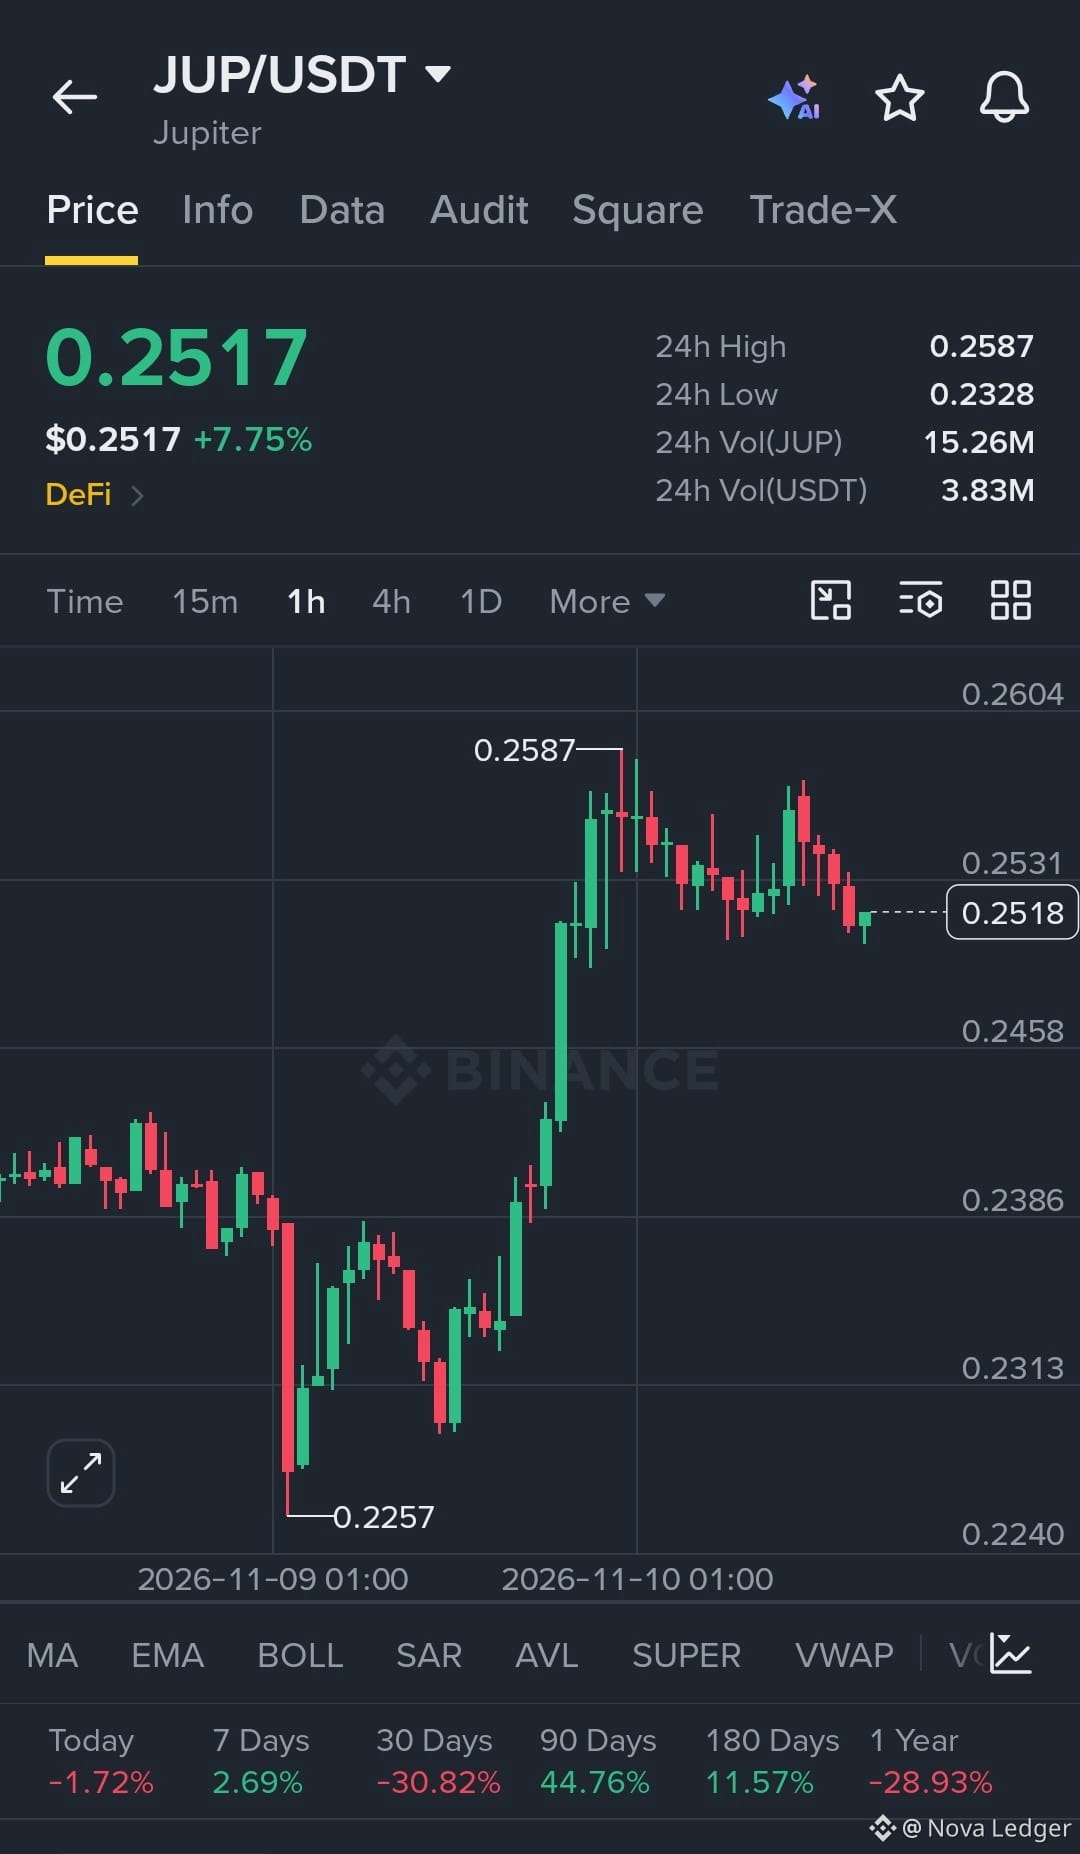
[$JUP ] NO TRADE YET — WAITING FOR A CONFIRMED BREAKOUT
JUP has made a strong bullish move from the $0.2279 low to the $0.2585 high, but momentum is cooling as price enters consolidation. Sellers are creating short-term pressure below $0.2525, while buyers are attempting to defend the $0.2500 area.
**Trading Setup**
- Entry Point: Wait for a confirmed breakout above $0.2525 or breakdown below $0.2500.
- Target Point: $0.2585 on a bullish breakout.
- Stop Loss: No entry until breakout direction and retest are confirmed.
A bullish continuation requires support above $0.2500 and a reclaim of $0.2525; losing $0.2500 would weaken the structure and favor further downside.
Risk Warning: Avoid entering during consolidation without confirmation.
Trade on [$JUP]
[$JUP ] NO TRADE YET — WAITING FOR A CONFIRMED BREAKOUT
JUP has made a strong bullish move from the $0.2279 low to the $0.2585 high, but momentum is cooling as price enters consolidation. Sellers are creating short-term pressure below $0.2525, while buyers are attempting to defend the $0.2500 area.
**Trading Setup**
- Entry Point: Wait for a confirmed breakout above $0.2525 or breakdown below $0.2500.
- Target Point: $0.2585 on a bullish breakout.
- Stop Loss: No entry until breakout direction and retest are confirmed.
A bullish continuation requires support above $0.2500 and a reclaim of $0.2525; losing $0.2500 would weaken the structure and favor further downside.
Risk Warning: Avoid entering during consolidation without confirmation.
Trade on [$JUP ]
JUP has made a strong bullish move from the $0.2279 low to the $0.2585 high, but momentum is cooling as price enters consolidation. Sellers are creating short-term pressure below $0.2525, while buyers are attempting to defend the $0.2500 area.
**Trading Setup**
- Entry Point: Wait for a confirmed breakout above $0.2525 or breakdown below $0.2500.
- Target Point: $0.2585 on a bullish breakout.
- Stop Loss: No entry until breakout direction and retest are confirmed.
A bullish continuation requires support above $0.2500 and a reclaim of $0.2525; losing $0.2500 would weaken the structure and favor further downside.
Risk Warning: Avoid entering during consolidation without confirmation.
Trade on [$JUP ]
112
·
--
Bullish
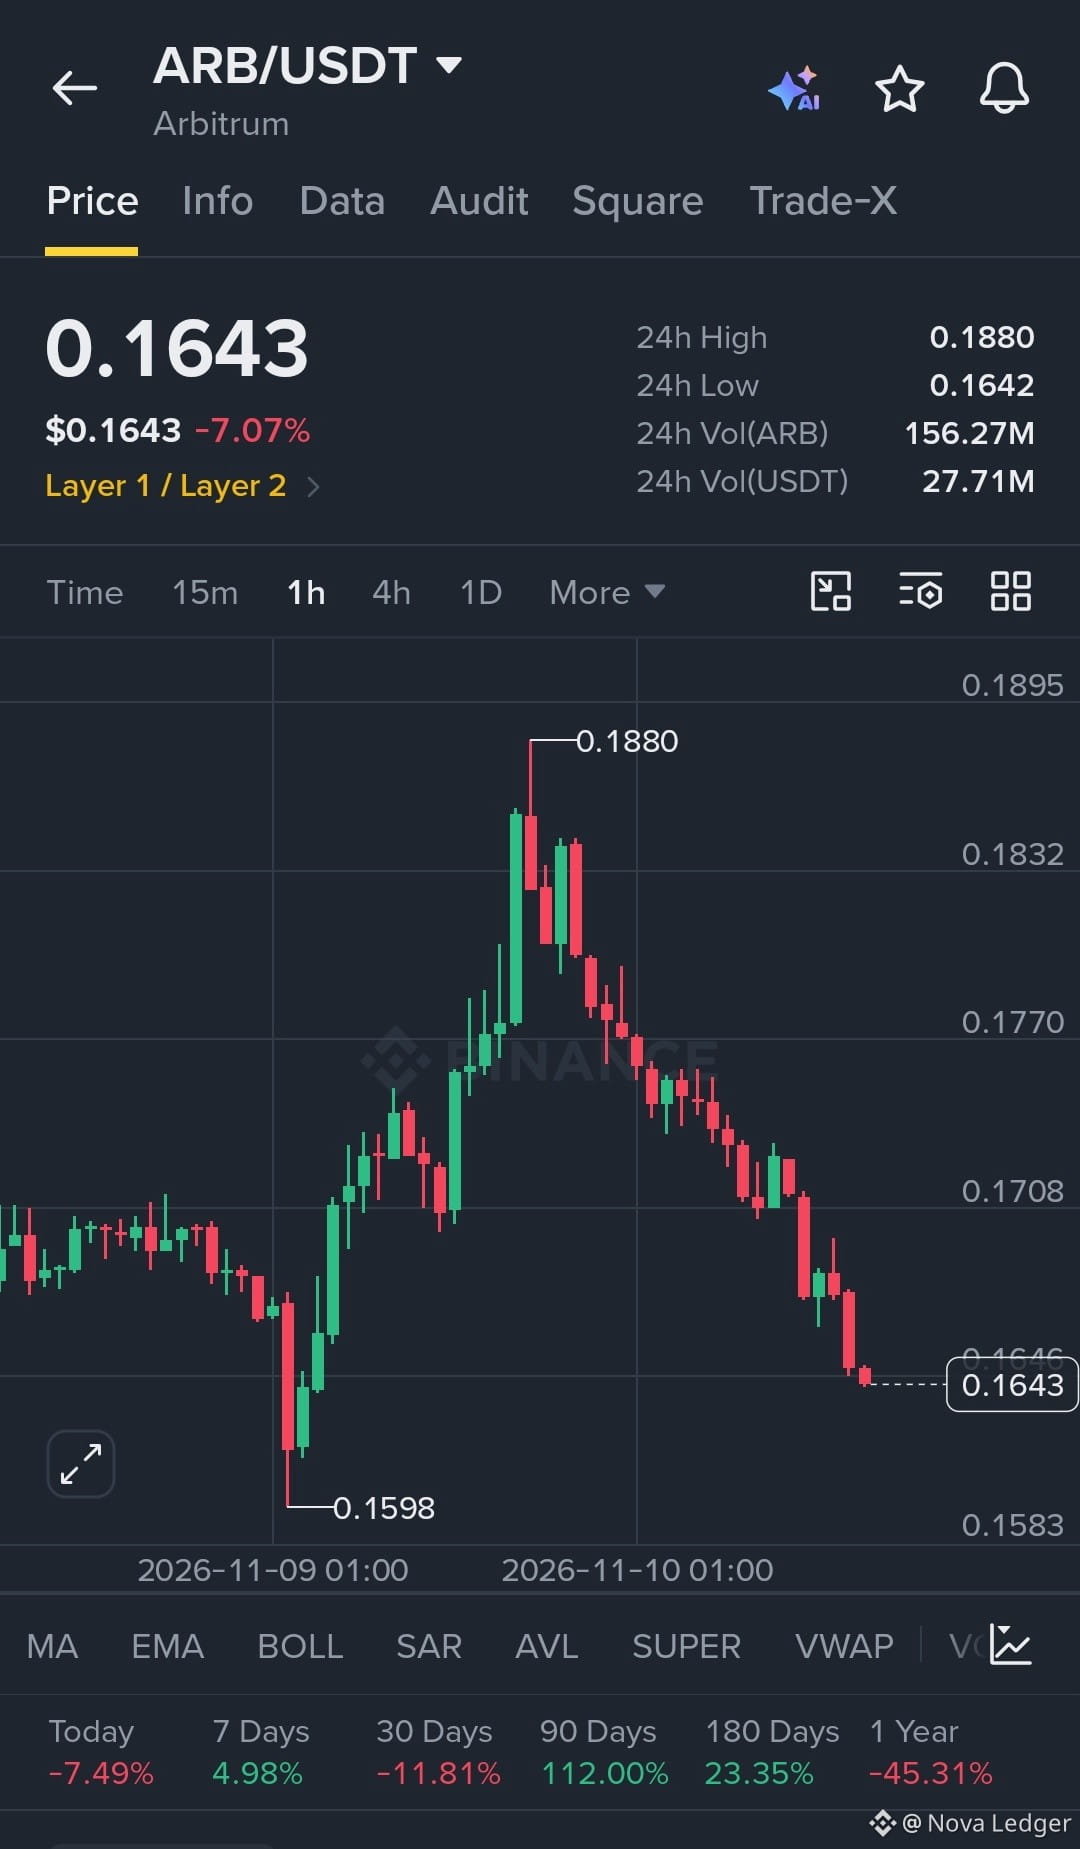
[$ARB ] SHORT SETUP — BEARISH MOMENTUM CONTINUES
ARB is showing a clear bearish structure on the 1H timeframe, with consistent lower highs and lower lows following rejection from $0.1881. Sellers remain firmly in control, and the latest candles show continued downside pressure as price approaches the $0.1641 support zone.
**Trading Setup**
- Entry Point: $0.1699 (short on confirmed rejection)
- Target Point: $0.1641
- Stop Loss: $0.1766
The bearish setup remains valid while price stays below $0.1699; a sustained breakout above $0.1766 would invalidate the setup.
Risk Warning: Wait for a confirmed retest and rejection before entering. Avoid chasing price at support.
Trade on [$ARB]
[$ARB ] SHORT SETUP — BEARISH MOMENTUM CONTINUES
ARB is showing a clear bearish structure on the 1H timeframe, with consistent lower highs and lower lows following rejection from $0.1881. Sellers remain firmly in control, and the latest candles show continued downside pressure as price approaches the $0.1641 support zone.
**Trading Setup**
- Entry Point: $0.1699 (short on confirmed rejection)
- Target Point: $0.1641
- Stop Loss: $0.1766
The bearish setup remains valid while price stays below $0.1699; a sustained breakout above $0.1766 would invalidate the setup.
Risk Warning: Wait for a confirmed retest and rejection before entering. Avoid chasing price at support.
Trade on [$ARB ]
ARB is showing a clear bearish structure on the 1H timeframe, with consistent lower highs and lower lows following rejection from $0.1881. Sellers remain firmly in control, and the latest candles show continued downside pressure as price approaches the $0.1641 support zone.
**Trading Setup**
- Entry Point: $0.1699 (short on confirmed rejection)
- Target Point: $0.1641
- Stop Loss: $0.1766
The bearish setup remains valid while price stays below $0.1699; a sustained breakout above $0.1766 would invalidate the setup.
Risk Warning: Wait for a confirmed retest and rejection before entering. Avoid chasing price at support.
Trade on [$ARB ]
281
·
--
Bullish
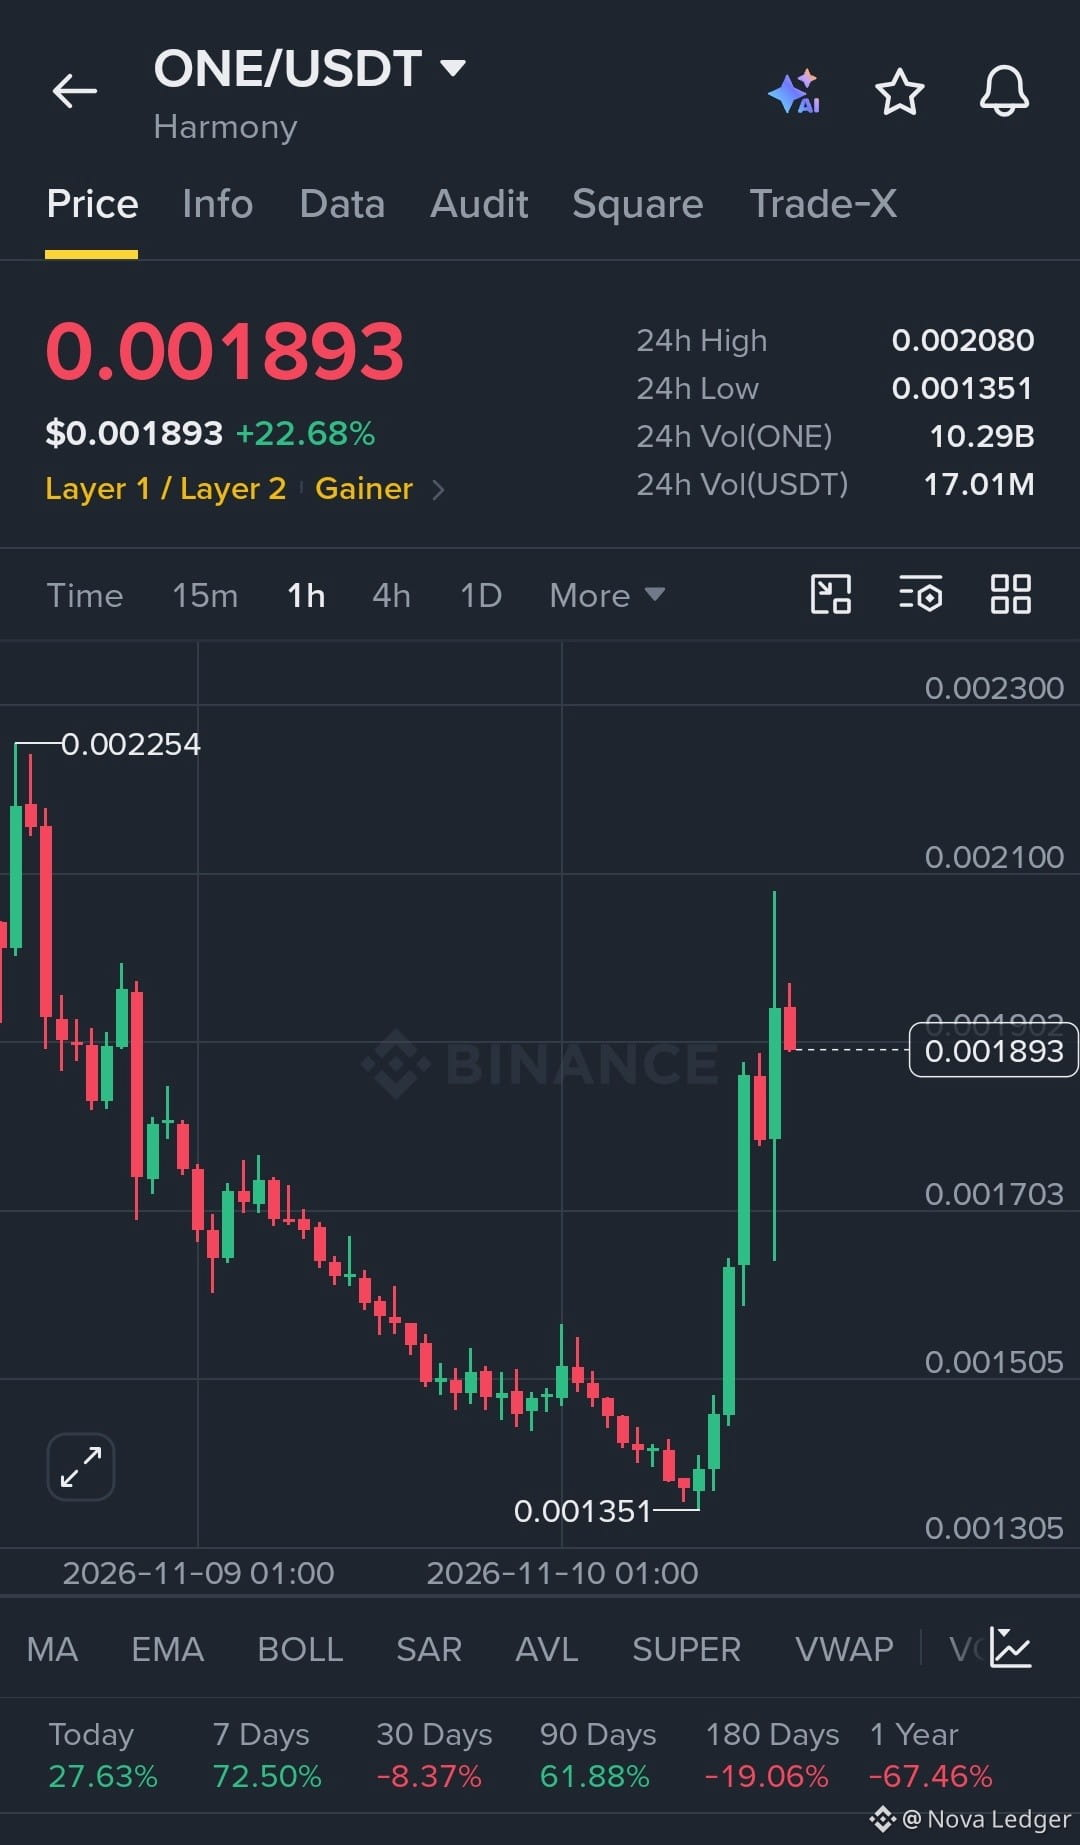
I'M WATCHING A BIG LONG ON $ONE .
EP: 0.001795–0.001850
TP: 0.002033 / 0.002199
SL: 0.001556
ONE has delivered a strong bullish reversal after bouncing from the 0.001352 low, with aggressive buying pressure driving price above previous resistance. The sharp breakout and strong bullish candles show buyers are in control, although a short-term pullback or consolidation is possible after the 25% rally.
The key level to hold is 0.001795. If buyers defend this zone, another push toward 0.002033 and the recent high of 0.002199 remains possible. A sustained move below 0.001556 would invalidate the bullish structure.
Momentum is strong, but wait for confirmation and avoid chasing the breakout.
I'M WATCHING A BIG LONG ON $ONE .
EP: 0.001795–0.001850
TP: 0.002033 / 0.002199
SL: 0.001556
ONE has delivered a strong bullish reversal after bouncing from the 0.001352 low, with aggressive buying pressure driving price above previous resistance. The sharp breakout and strong bullish candles show buyers are in control, although a short-term pullback or consolidation is possible after the 25% rally.
The key level to hold is 0.001795. If buyers defend this zone, another push toward 0.002033 and the recent high of 0.002199 remains possible. A sustained move below 0.001556 would invalidate the bullish structure.
Momentum is strong, but wait for confirmation and avoid chasing the breakout.
EP: 0.001795–0.001850
TP: 0.002033 / 0.002199
SL: 0.001556
ONE has delivered a strong bullish reversal after bouncing from the 0.001352 low, with aggressive buying pressure driving price above previous resistance. The sharp breakout and strong bullish candles show buyers are in control, although a short-term pullback or consolidation is possible after the 25% rally.
The key level to hold is 0.001795. If buyers defend this zone, another push toward 0.002033 and the recent high of 0.002199 remains possible. A sustained move below 0.001556 would invalidate the bullish structure.
Momentum is strong, but wait for confirmation and avoid chasing the breakout.
203
·
--
Bullish
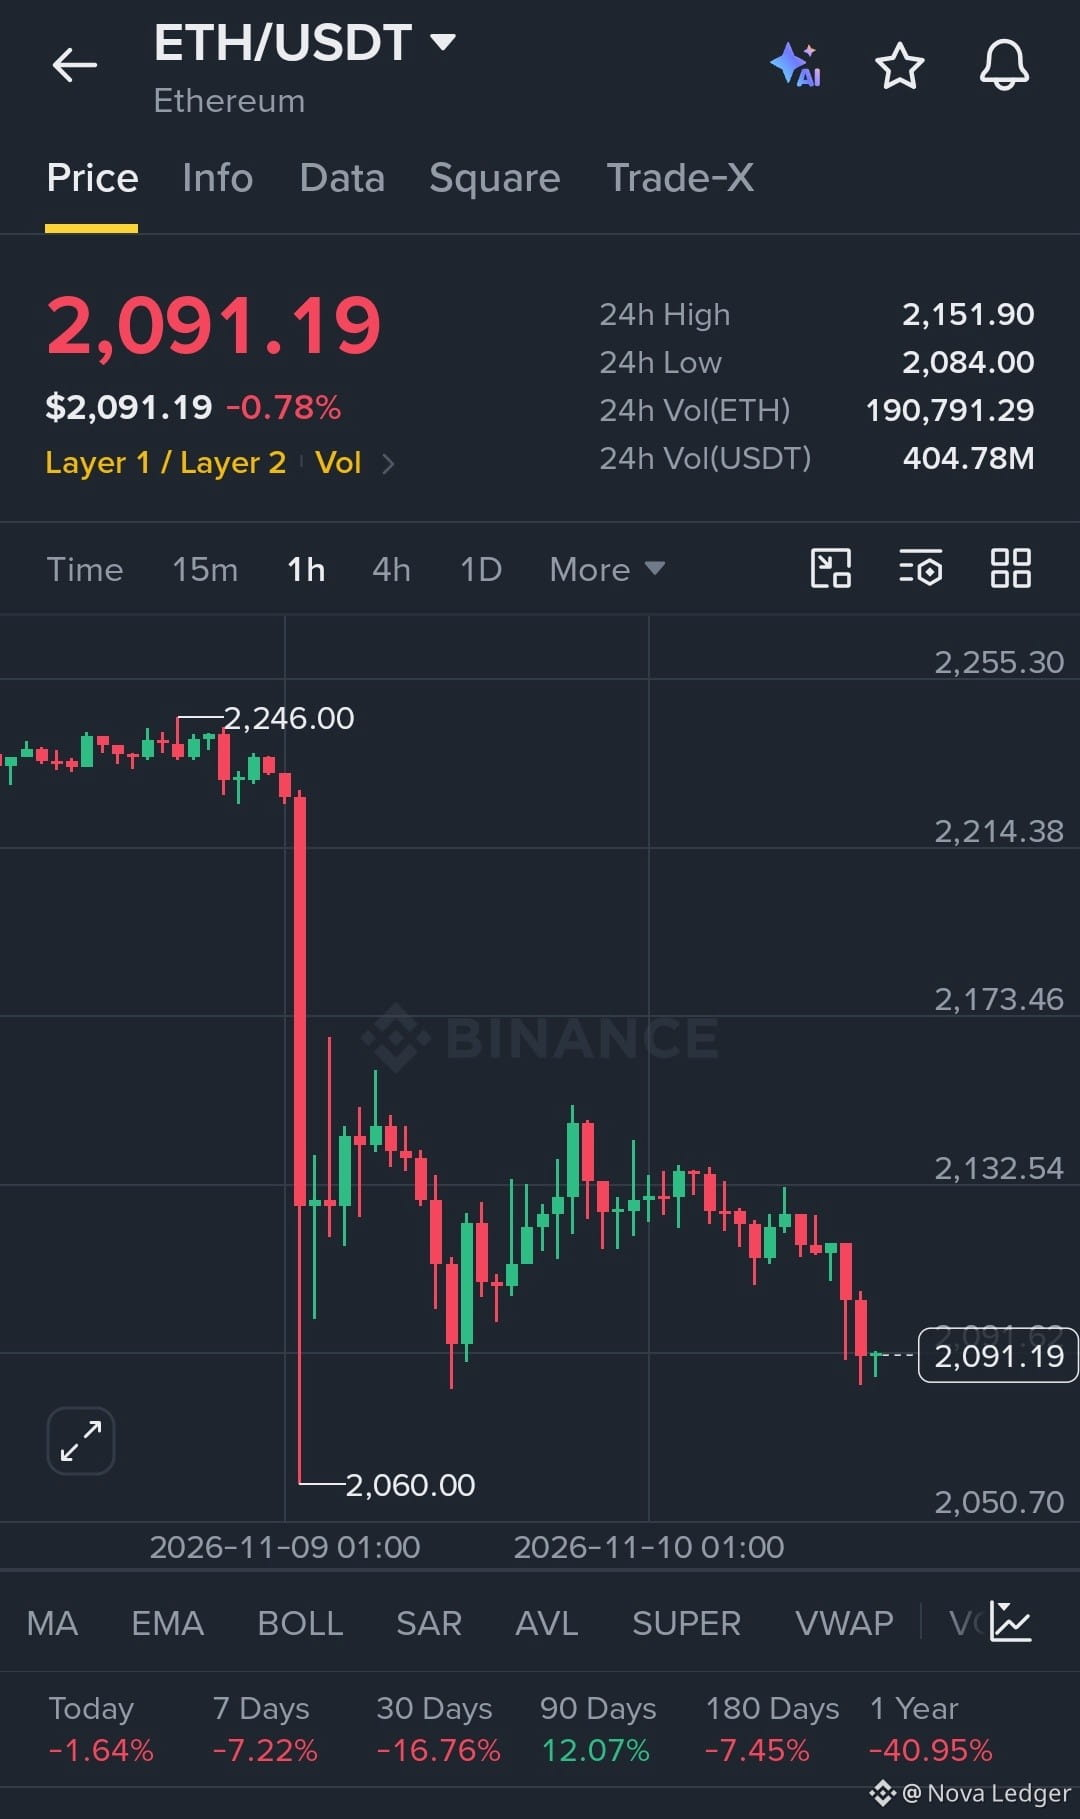
[$ETH ] SHORT SETUP — BEARISH BREAKDOWN SIGNAL
ETH is showing strong bearish momentum on the 1H timeframe, with consecutive lower highs and a breakdown below the key $2,103.74 support. Sellers remain in control, and a failed retest of this broken level could trigger further downside toward the previous swing low.
**Trading Setup**
- Entry Point: $2,103.74 (short on rejection)
- Target Point: $2,084.28
- Stop Loss: $2,127.62
The bearish setup remains valid while ETH stays below $2,127.62; a sustained breakout above this level invalidates the trade.
Trade on [$ETH]
Risk Warning: Wait for confirmation before entering and manage your position size carefully.
[$ETH ] SHORT SETUP — BEARISH BREAKDOWN SIGNAL
ETH is showing strong bearish momentum on the 1H timeframe, with consecutive lower highs and a breakdown below the key $2,103.74 support. Sellers remain in control, and a failed retest of this broken level could trigger further downside toward the previous swing low.
**Trading Setup**
- Entry Point: $2,103.74 (short on rejection)
- Target Point: $2,084.28
- Stop Loss: $2,127.62
The bearish setup remains valid while ETH stays below $2,127.62; a sustained breakout above this level invalidates the trade.
Trade on [$ETH ]
Risk Warning: Wait for confirmation before entering and manage your position size carefully.
ETH is showing strong bearish momentum on the 1H timeframe, with consecutive lower highs and a breakdown below the key $2,103.74 support. Sellers remain in control, and a failed retest of this broken level could trigger further downside toward the previous swing low.
**Trading Setup**
- Entry Point: $2,103.74 (short on rejection)
- Target Point: $2,084.28
- Stop Loss: $2,127.62
The bearish setup remains valid while ETH stays below $2,127.62; a sustained breakout above this level invalidates the trade.
Trade on [$ETH ]
Risk Warning: Wait for confirmation before entering and manage your position size carefully.
124
·
--
Bullish
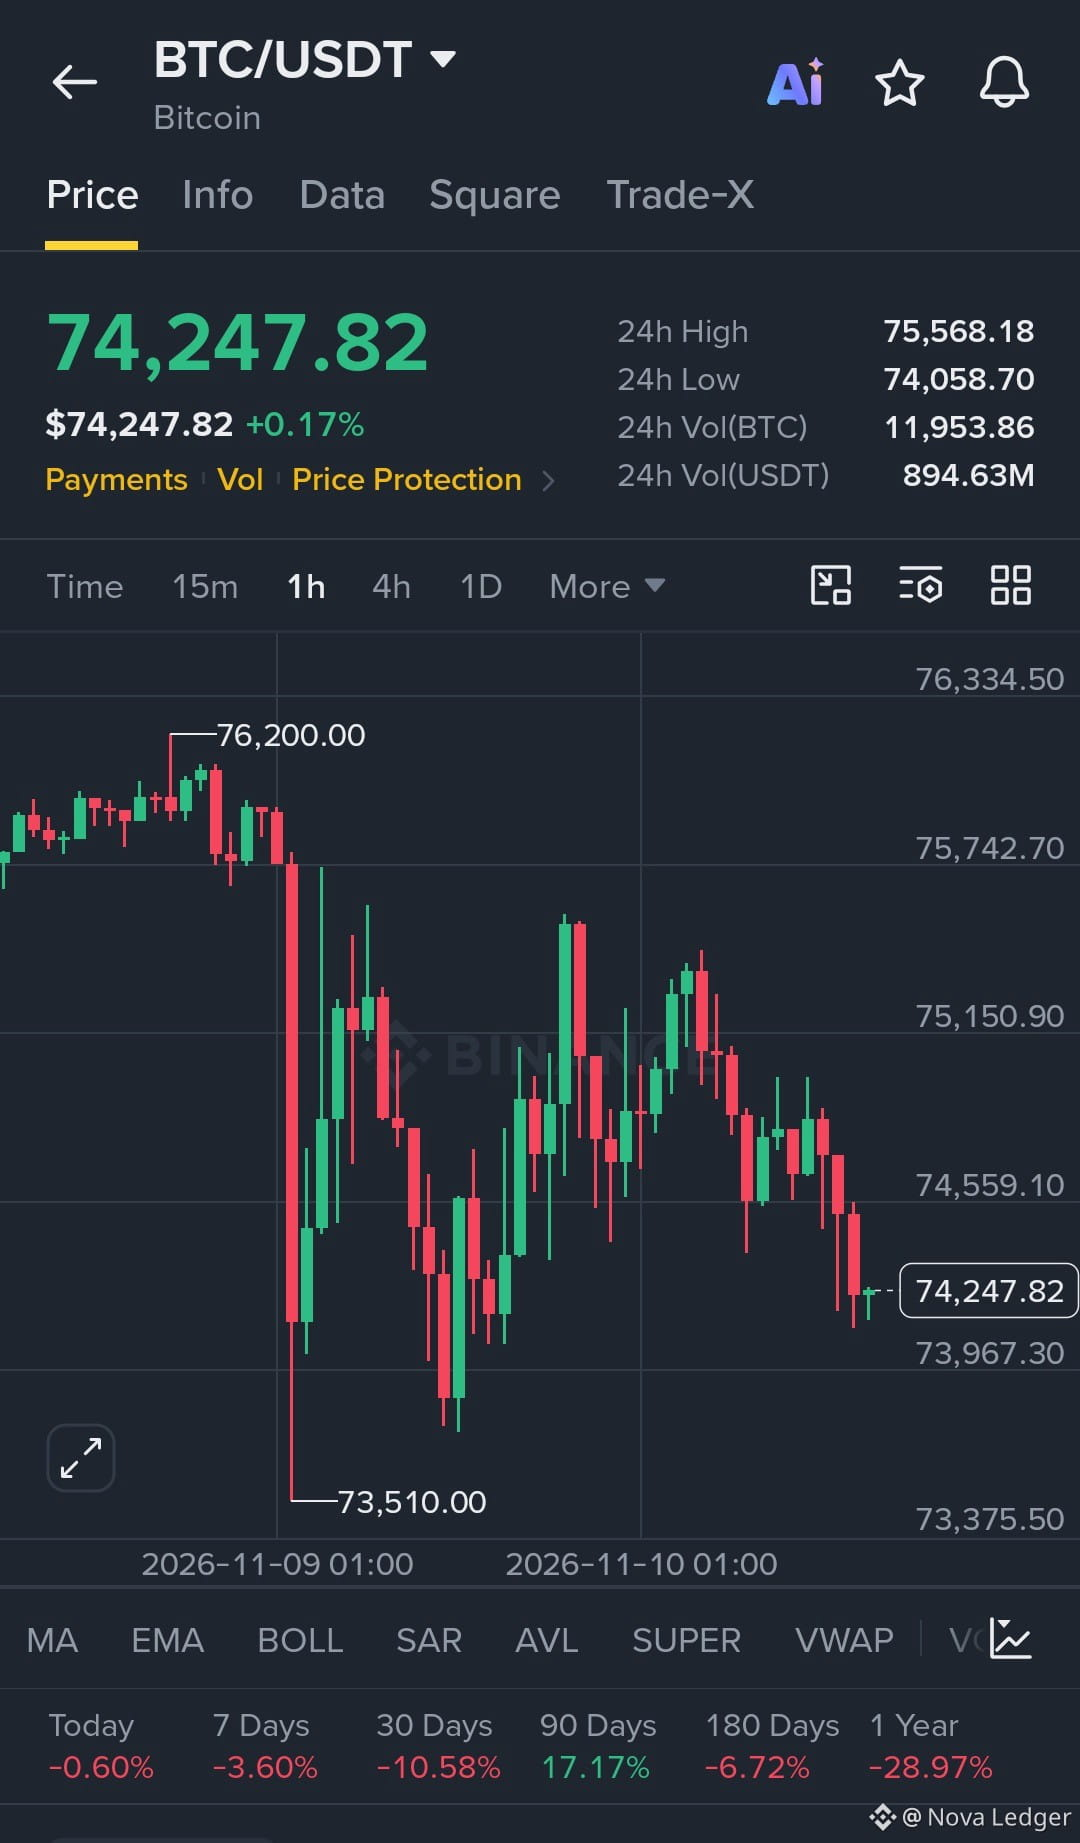
$BTC is showing a short-term bearish trend on the 1H timeframe, with lower highs and weakening bullish momentum indicating continued selling pressure. Price is currently trading near $74,233, testing key support around $74,055–$74,066, while resistance remains at $74,700–$75,000; a breakdown below support could accelerate bearish continuation.
**Entry Zone:** $74,450–$74,700 (Short)
**Target 1:** $74,050
**Target 2:** $73,750
**Target 3:** $73,500
**Stop Loss:** $75,050
The bearish scenario remains valid while price stays below $75,000, while a confirmed 1H breakout and close above $75,050 would invalidate the short setup.
$BTC is showing a short-term bearish trend on the 1H timeframe, with lower highs and weakening bullish momentum indicating continued selling pressure. Price is currently trading near $74,233, testing key support around $74,055–$74,066, while resistance remains at $74,700–$75,000; a breakdown below support could accelerate bearish continuation.
**Entry Zone:** $74,450–$74,700 (Short)
**Target 1:** $74,050
**Target 2:** $73,750
**Target 3:** $73,500
**Stop Loss:** $75,050
The bearish scenario remains valid while price stays below $75,000, while a confirmed 1H breakout and close above $75,050 would invalidate the short setup.
**Entry Zone:** $74,450–$74,700 (Short)
**Target 1:** $74,050
**Target 2:** $73,750
**Target 3:** $73,500
**Stop Loss:** $75,050
The bearish scenario remains valid while price stays below $75,000, while a confirmed 1H breakout and close above $75,050 would invalidate the short setup.
163

·
--
🎙️ Welcome to Tangbao’s livestream—come chat with us about Web3’s secrets to wealth.

End
04 h 11 m 15 s
6.6k
64
76
·
--
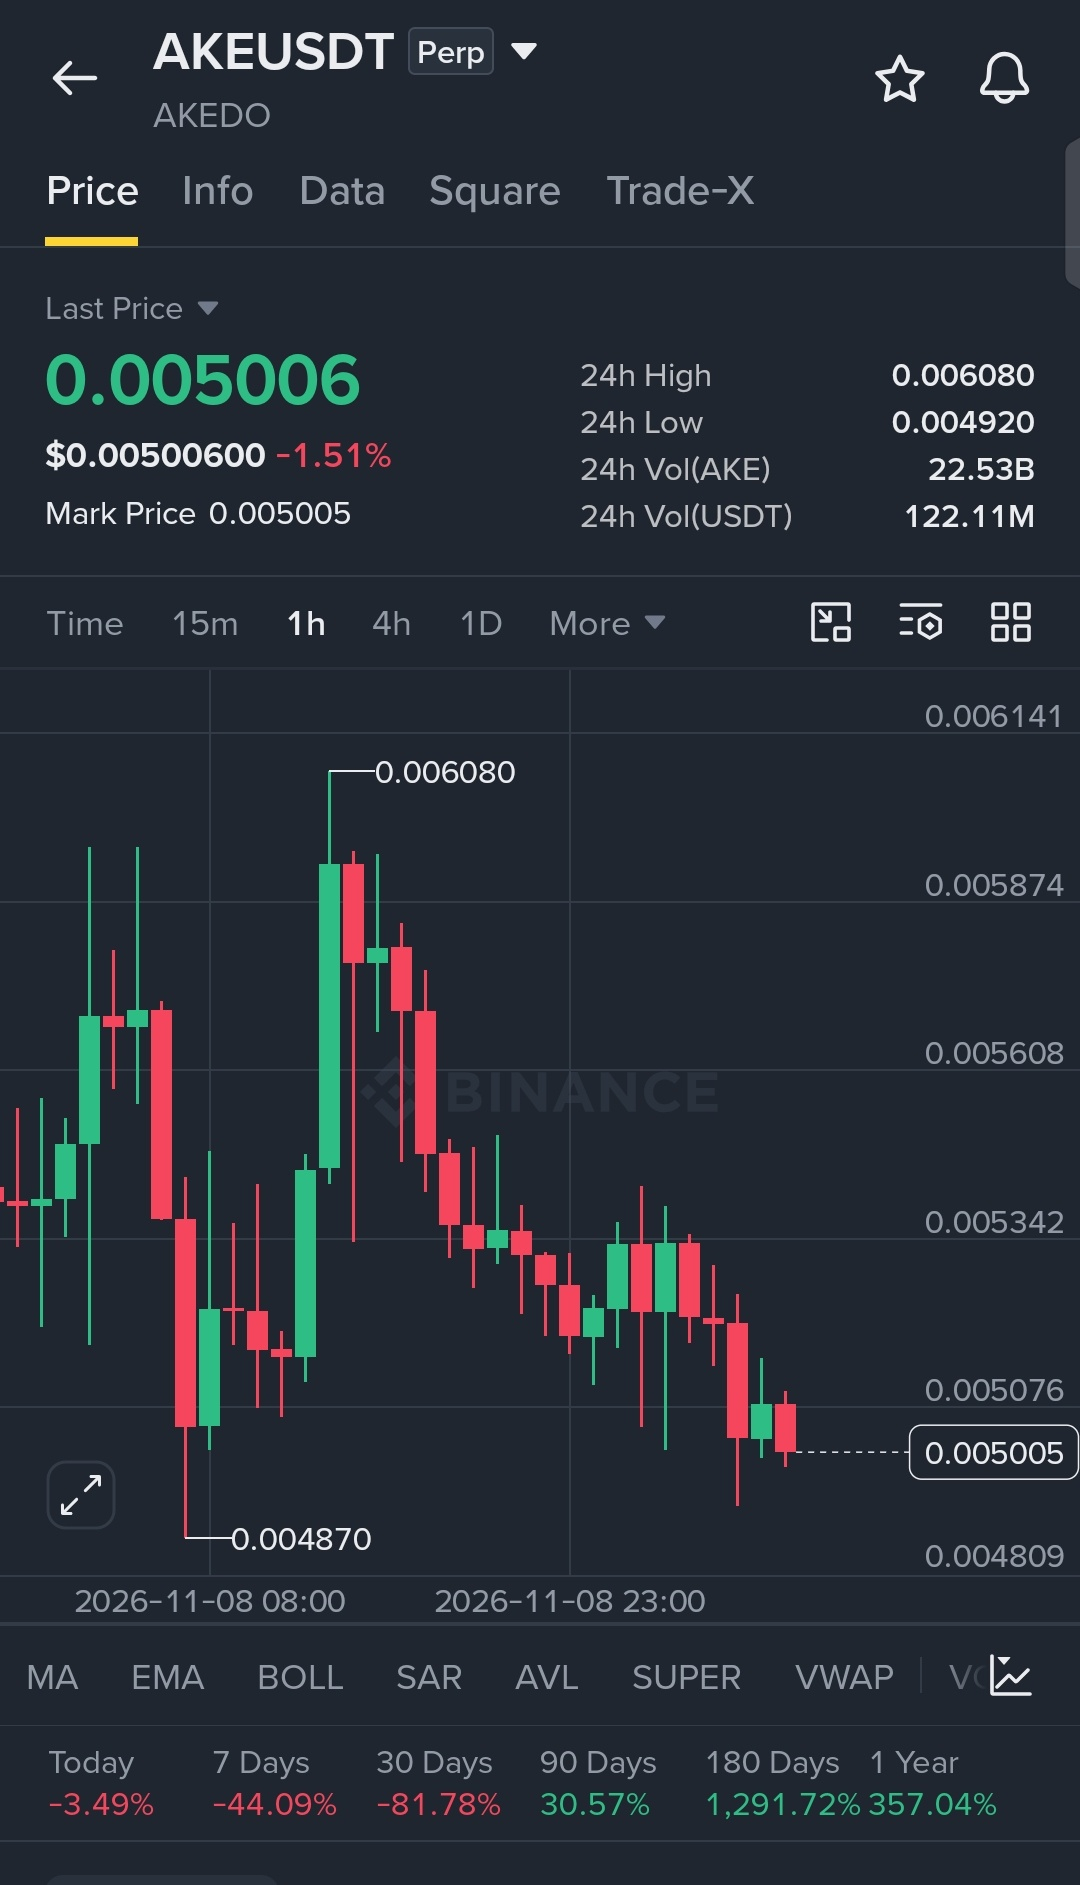
**$AKE SHORT SETUP: Lower Highs Keep Pressing Price Into Support**
AKE has been stepping down from 0.0060132 with a clear run of lower highs. The latest 1h candle is a heavy red body rejecting the 0.0052368 area, and price now sits at 0.0050275, just above the 0.0049035 session low. Sellers still control the structure, so the path of least resistance is a retest of that low.
**Trading Setup**
- **Entry Point:** 0.0050275 – 0.0051000
- **Target Point:** TP1 0.0049035 / TP2 0.0048486
- **Stop Loss:** 0.0052368 (1h close above)
The trade stays valid while AKE holds below 0.0052368 and keeps making lower highs.
*Risk warning: Price is close to support, so reward is limited until 0.0049035 breaks. Expect a bounce there, wait for a clean 1h close below it before adding, size small, and never risk more than you can afford to lose. Not financial advice.*
**Trade on $AKE**
**$AKE SHORT SETUP: Lower Highs Keep Pressing Price Into Support**
AKE has been stepping down from 0.0060132 with a clear run of lower highs. The latest 1h candle is a heavy red body rejecting the 0.0052368 area, and price now sits at 0.0050275, just above the 0.0049035 session low. Sellers still control the structure, so the path of least resistance is a retest of that low.
**Trading Setup**
- **Entry Point:** 0.0050275 – 0.0051000
- **Target Point:** TP1 0.0049035 / TP2 0.0048486
- **Stop Loss:** 0.0052368 (1h close above)
The trade stays valid while AKE holds below 0.0052368 and keeps making lower highs.
*Risk warning: Price is close to support, so reward is limited until 0.0049035 breaks. Expect a bounce there, wait for a clean 1h close below it before adding, size small, and never risk more than you can afford to lose. Not financial advice.*
**Trade on $AKE **
AKE has been stepping down from 0.0060132 with a clear run of lower highs. The latest 1h candle is a heavy red body rejecting the 0.0052368 area, and price now sits at 0.0050275, just above the 0.0049035 session low. Sellers still control the structure, so the path of least resistance is a retest of that low.
**Trading Setup**
- **Entry Point:** 0.0050275 – 0.0051000
- **Target Point:** TP1 0.0049035 / TP2 0.0048486
- **Stop Loss:** 0.0052368 (1h close above)
The trade stays valid while AKE holds below 0.0052368 and keeps making lower highs.
*Risk warning: Price is close to support, so reward is limited until 0.0049035 breaks. Expect a bounce there, wait for a clean 1h close below it before adding, size small, and never risk more than you can afford to lose. Not financial advice.*
**Trade on $AKE **
712
·
--
Bullish
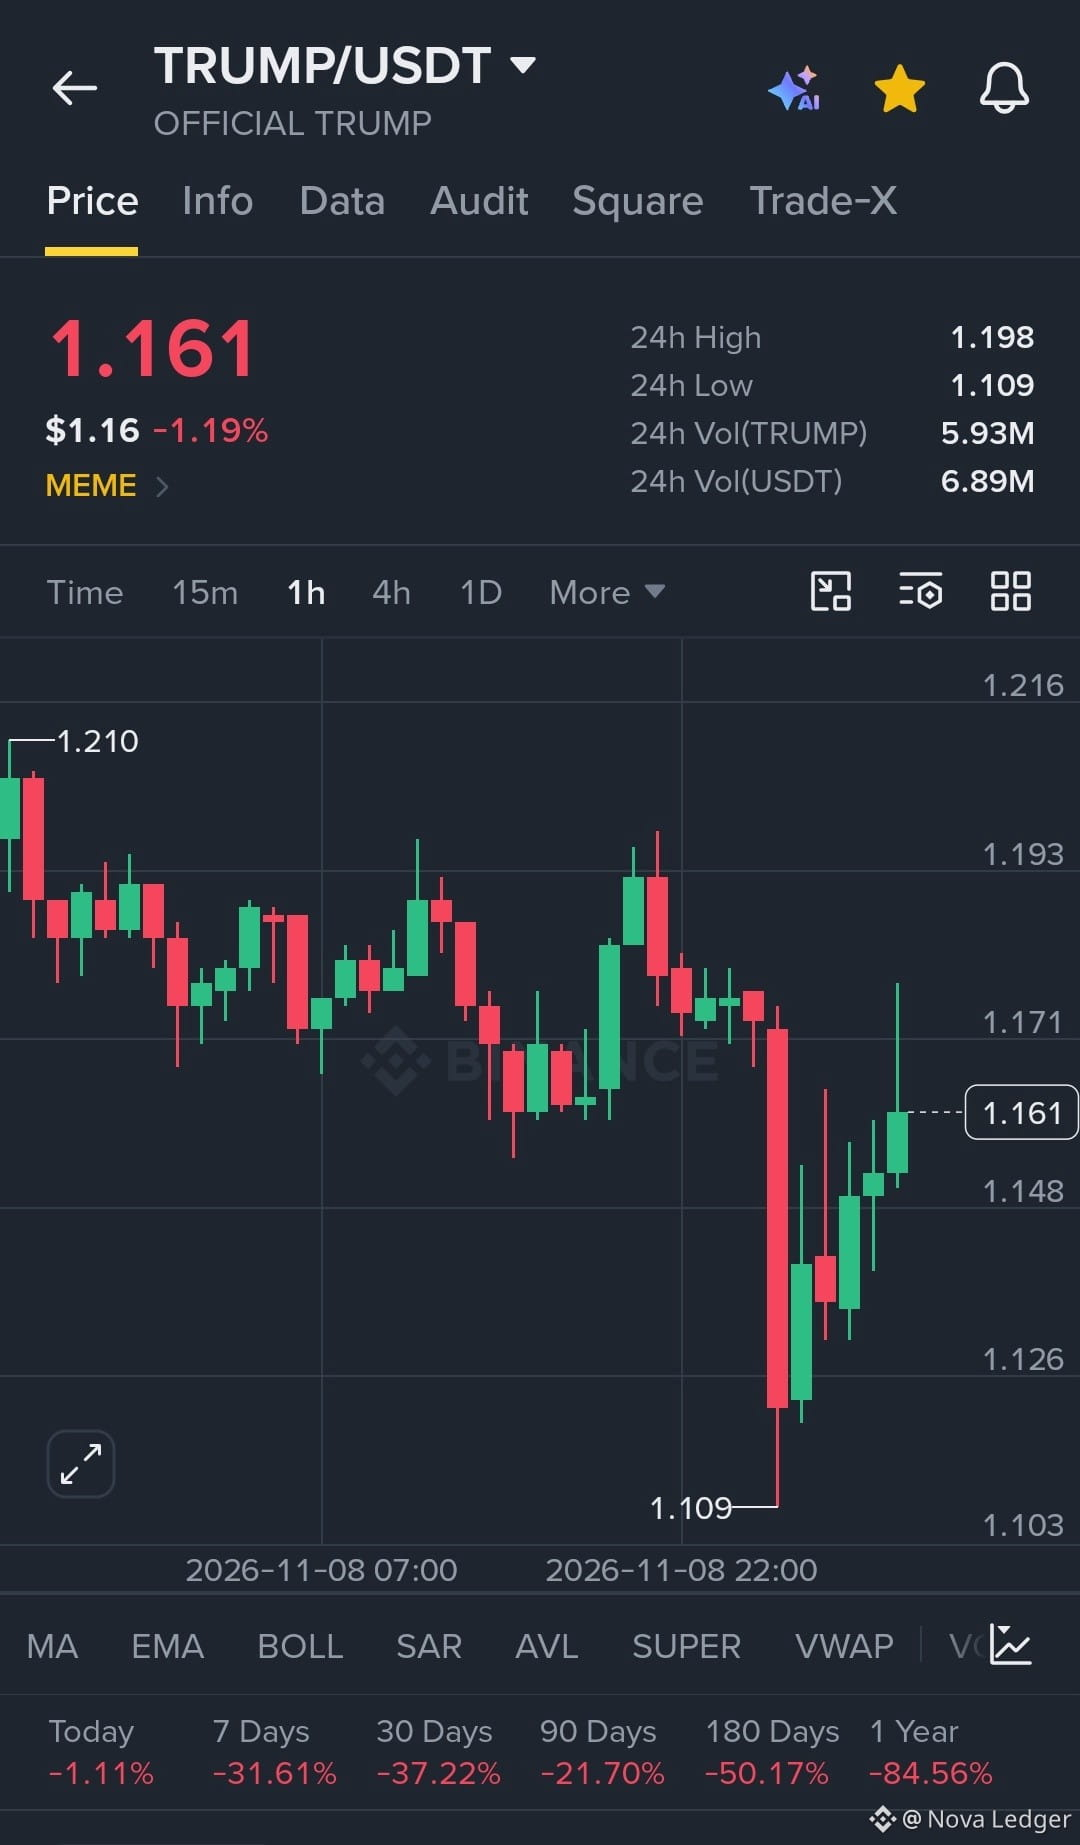
**I'M WATCHING A BIG LONG ON $TRUMP .**
**EP:** 1.150 – 1.157
**TP:** 1.161 (TP1) / 1.190 (TP2)
**SL:** 1.109 (1h close below)
**Price action:**
$TRUMP dropped from the 1.190 area with one heavy red 1h candle and flushed to 1.109. Buyers stepped in right at the low and have pushed price back to 1.157 with three green candles and a long lower wick on the flush.
**Buyers vs. sellers:**
Sellers had control into the dump, but the follow-through stopped at 1.109. The recovery candles are solid-bodied, and only one small red candle interrupted the bounce. That tells me demand showed up fast at the low.
**Key levels:**
- Support: 1.133, then 1.109 (24h low)
- Resistance: 1.161, then 1.190, then 1.210
**Next move:**
Price is pressing into 1.161. A clean 1h close above it opens 1.190, where the breakdown began. A rejection there sends price back to test 1.133.
**What keeps it valid:**
Price holds above 1.133 and keeps printing higher lows.
**What invalidates it:**
A 1h close below 1.109. That would erase the whole bounce, and I'm out.
The broader structure is still choppy, so this is a bounce trade, not a trend call. Reward to TP1 is small, so patience on entry matters. I wait for the level to hold and let price prove it.
*Not financial advice. Size small and never risk more than you can afford to lose.*
**I'M WATCHING A BIG LONG ON $TRUMP .**
**EP:** 1.150 – 1.157
**TP:** 1.161 (TP1) / 1.190 (TP2)
**SL:** 1.109 (1h close below)
**Price action:**
$TRUMP dropped from the 1.190 area with one heavy red 1h candle and flushed to 1.109. Buyers stepped in right at the low and have pushed price back to 1.157 with three green candles and a long lower wick on the flush.
**Buyers vs. sellers:**
Sellers had control into the dump, but the follow-through stopped at 1.109. The recovery candles are solid-bodied, and only one small red candle interrupted the bounce. That tells me demand showed up fast at the low.
**Key levels:**
- Support: 1.133, then 1.109 (24h low)
- Resistance: 1.161, then 1.190, then 1.210
**Next move:**
Price is pressing into 1.161. A clean 1h close above it opens 1.190, where the breakdown began. A rejection there sends price back to test 1.133.
**What keeps it valid:**
Price holds above 1.133 and keeps printing higher lows.
**What invalidates it:**
A 1h close below 1.109. That would erase the whole bounce, and I'm out.
The broader structure is still choppy, so this is a bounce trade, not a trend call. Reward to TP1 is small, so patience on entry matters. I wait for the level to hold and let price prove it.
*Not financial advice. Size small and never risk more than you can afford to lose.*
**EP:** 1.150 – 1.157
**TP:** 1.161 (TP1) / 1.190 (TP2)
**SL:** 1.109 (1h close below)
**Price action:**
$TRUMP dropped from the 1.190 area with one heavy red 1h candle and flushed to 1.109. Buyers stepped in right at the low and have pushed price back to 1.157 with three green candles and a long lower wick on the flush.
**Buyers vs. sellers:**
Sellers had control into the dump, but the follow-through stopped at 1.109. The recovery candles are solid-bodied, and only one small red candle interrupted the bounce. That tells me demand showed up fast at the low.
**Key levels:**
- Support: 1.133, then 1.109 (24h low)
- Resistance: 1.161, then 1.190, then 1.210
**Next move:**
Price is pressing into 1.161. A clean 1h close above it opens 1.190, where the breakdown began. A rejection there sends price back to test 1.133.
**What keeps it valid:**
Price holds above 1.133 and keeps printing higher lows.
**What invalidates it:**
A 1h close below 1.109. That would erase the whole bounce, and I'm out.
The broader structure is still choppy, so this is a bounce trade, not a trend call. Reward to TP1 is small, so patience on entry matters. I wait for the level to hold and let price prove it.
*Not financial advice. Size small and never risk more than you can afford to lose.*
343
·
--
Bullish
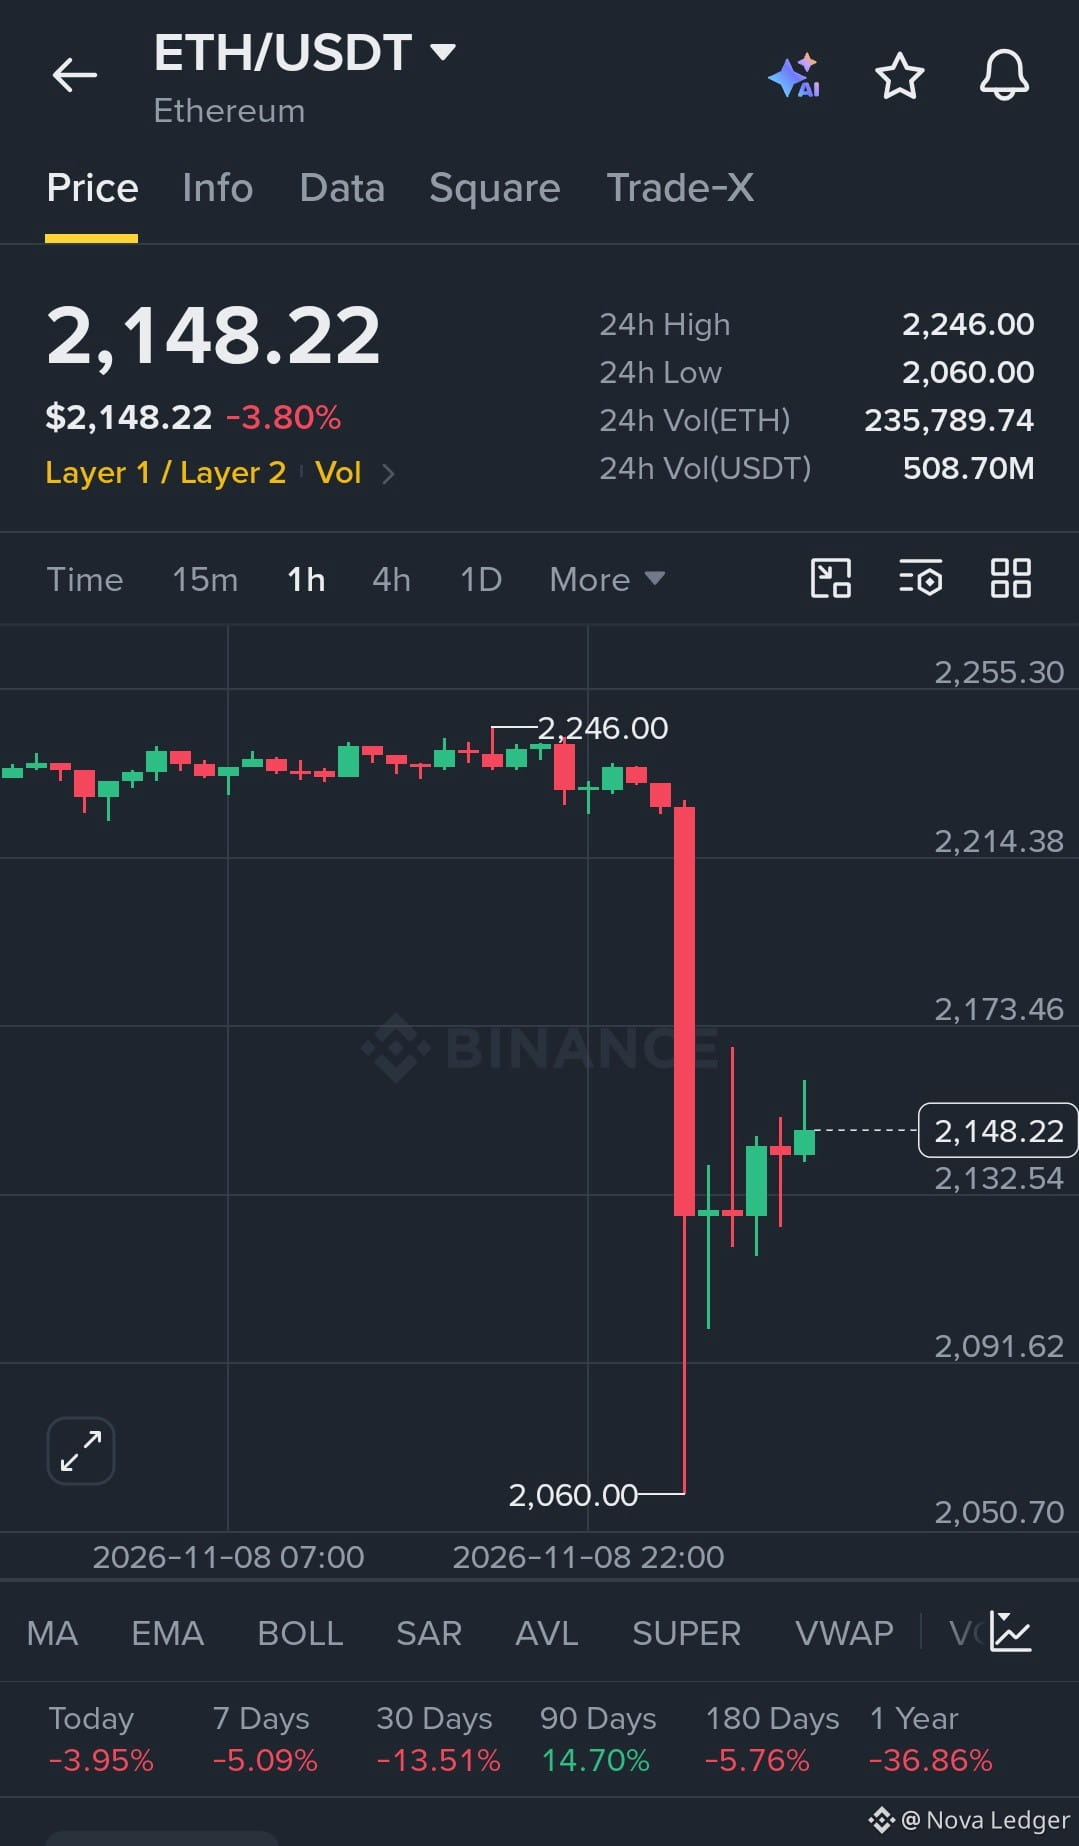
**$ETH SHORT SETUP: Sellers Still Control the Breakdown**
ETH lost its 2,210 to 2,248 range with one heavy 1h candle and wicked down to 2,054.55. The bounce to 2,155 has retraced only part of that candle, so price is still trading inside a supply zone. If the bounce stalls here, the next leg down is likely.
**Trading Setup**
- **Entry Point:** 2,155 – 2,168 (current price up to the bounce wick high)
- **Target Point:** TP1 2,101.31 / TP2 2,054.55
- **Stop Loss:** 2,210.20 (1h close above)
The setup stays valid while ETH holds below 2,210.20 and the bounce keeps failing under the breakdown candle. A 1h close above that level means buyers have recovered the range, and the short is off.
*Risk warning: The chart shows a sharp V-shaped bounce, so this is a counter-bounce trade, not a sure thing. TP1 is roughly 1:1, so wait for rejection confirmation, size small, and never risk more than you can afford to lose. Not financial advice.*
**Trade on $ETH**
**$ETH SHORT SETUP: Sellers Still Control the Breakdown**
ETH lost its 2,210 to 2,248 range with one heavy 1h candle and wicked down to 2,054.55. The bounce to 2,155 has retraced only part of that candle, so price is still trading inside a supply zone. If the bounce stalls here, the next leg down is likely.
**Trading Setup**
- **Entry Point:** 2,155 – 2,168 (current price up to the bounce wick high)
- **Target Point:** TP1 2,101.31 / TP2 2,054.55
- **Stop Loss:** 2,210.20 (1h close above)
The setup stays valid while ETH holds below 2,210.20 and the bounce keeps failing under the breakdown candle. A 1h close above that level means buyers have recovered the range, and the short is off.
*Risk warning: The chart shows a sharp V-shaped bounce, so this is a counter-bounce trade, not a sure thing. TP1 is roughly 1:1, so wait for rejection confirmation, size small, and never risk more than you can afford to lose. Not financial advice.*
**Trade on $ETH **
ETH lost its 2,210 to 2,248 range with one heavy 1h candle and wicked down to 2,054.55. The bounce to 2,155 has retraced only part of that candle, so price is still trading inside a supply zone. If the bounce stalls here, the next leg down is likely.
**Trading Setup**
- **Entry Point:** 2,155 – 2,168 (current price up to the bounce wick high)
- **Target Point:** TP1 2,101.31 / TP2 2,054.55
- **Stop Loss:** 2,210.20 (1h close above)
The setup stays valid while ETH holds below 2,210.20 and the bounce keeps failing under the breakdown candle. A 1h close above that level means buyers have recovered the range, and the short is off.
*Risk warning: The chart shows a sharp V-shaped bounce, so this is a counter-bounce trade, not a sure thing. TP1 is roughly 1:1, so wait for rejection confirmation, size small, and never risk more than you can afford to lose. Not financial advice.*
**Trade on $ETH **
970
·
--
Bullish
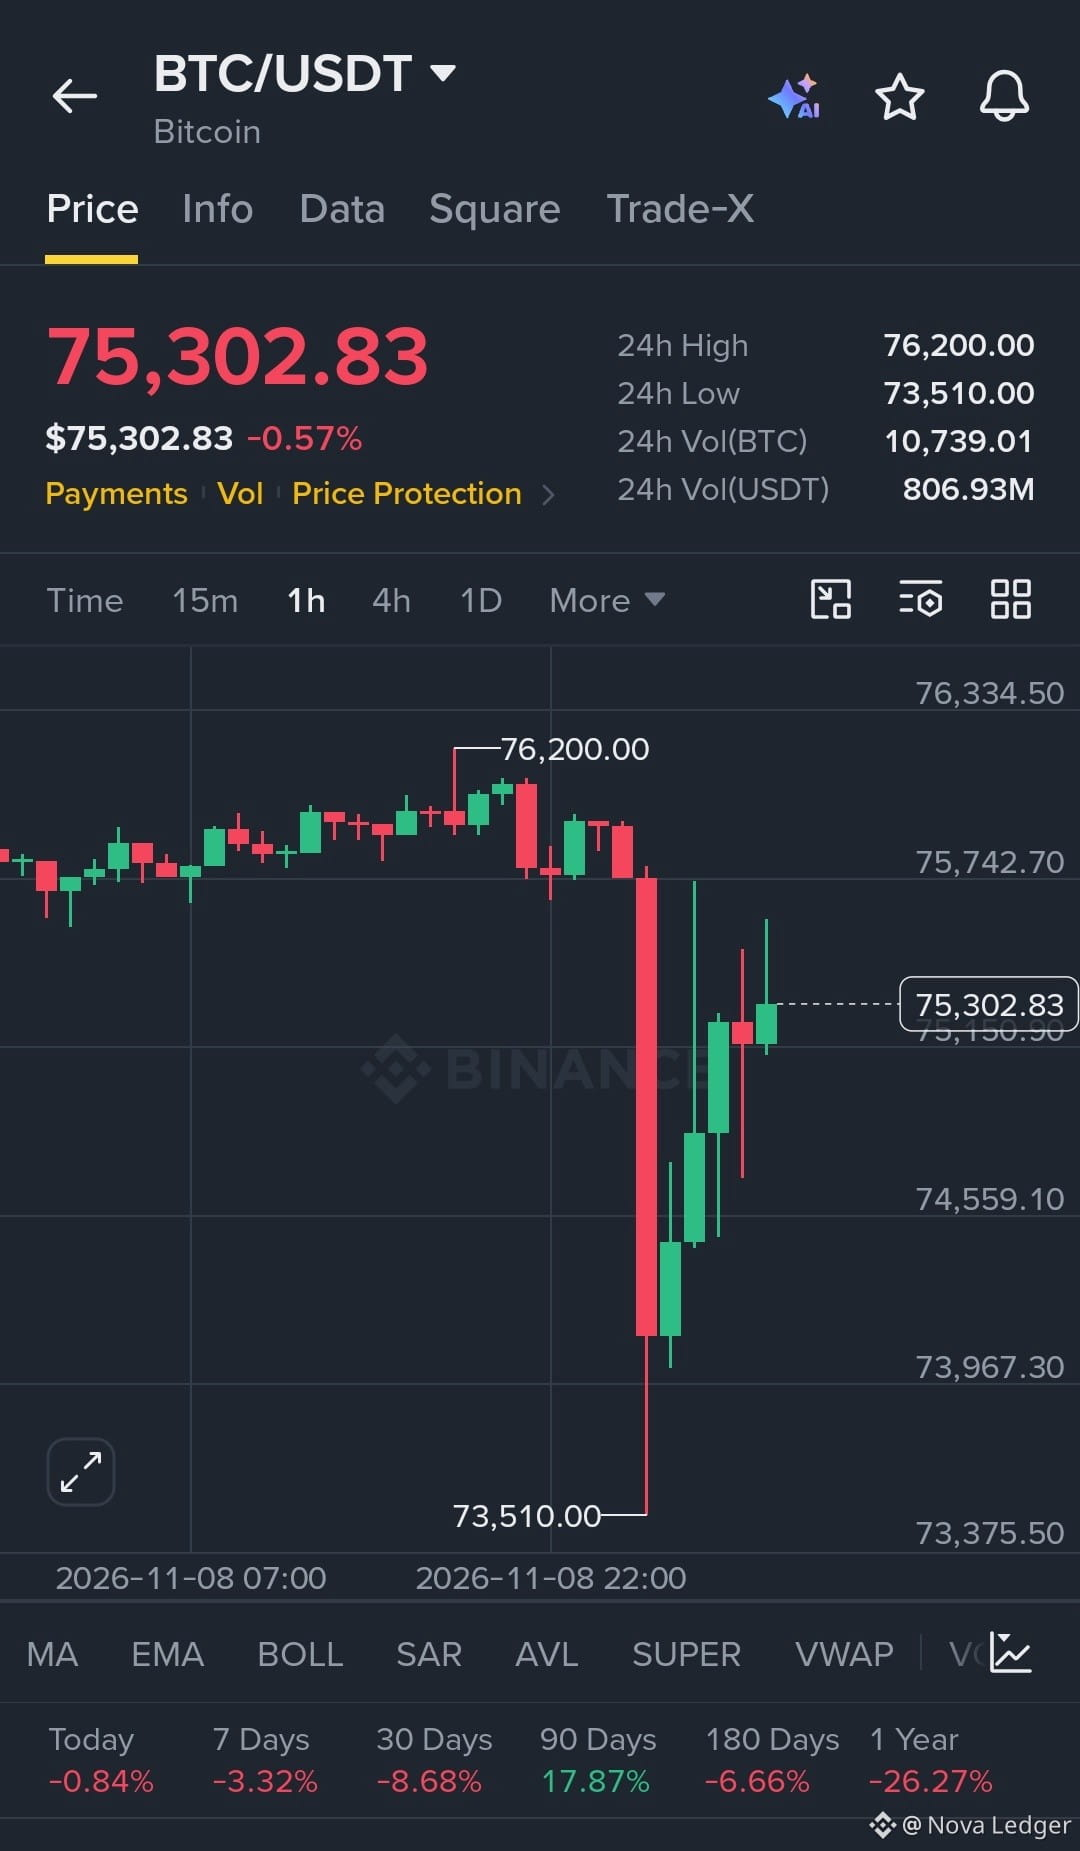
**$BTC LONG SETUP: Buyers Defend the Flush Low**
BTC dumped from the 75,673 area with one heavy 1h candle, tagged 73,502.6, and was bought straight back. Four of the last five candles are green, with higher lows, and price is now back near 75,494. The long wick below 73,502.6 shows sellers ran out of strength at that level.
**Trading Setup**
- **Entry Point:** 75,350 – 75,480 (current price, or a small pullback toward it)
- **Target Point:** TP1 75,673.0 / TP2 76,200.0
- **Stop Loss:** 74,913.8 (1h close below)
The setup stays valid while BTC holds above 74,913.8 and keeps printing higher lows. A 1h close below that level means the bounce has failed, and the long is off.
*Risk warning: TP1 is close to current price, so reward is limited until it clears. The big red candle shows how fast sellers can return, so wait for a clean hold above 75,673.0 to confirm, size small, and never risk more than you can afford to lose. Not financial advice.*
**Trade on $BTC**
**$BTC LONG SETUP: Buyers Defend the Flush Low**
BTC dumped from the 75,673 area with one heavy 1h candle, tagged 73,502.6, and was bought straight back. Four of the last five candles are green, with higher lows, and price is now back near 75,494. The long wick below 73,502.6 shows sellers ran out of strength at that level.
**Trading Setup**
- **Entry Point:** 75,350 – 75,480 (current price, or a small pullback toward it)
- **Target Point:** TP1 75,673.0 / TP2 76,200.0
- **Stop Loss:** 74,913.8 (1h close below)
The setup stays valid while BTC holds above 74,913.8 and keeps printing higher lows. A 1h close below that level means the bounce has failed, and the long is off.
*Risk warning: TP1 is close to current price, so reward is limited until it clears. The big red candle shows how fast sellers can return, so wait for a clean hold above 75,673.0 to confirm, size small, and never risk more than you can afford to lose. Not financial advice.*
**Trade on $BTC **
BTC dumped from the 75,673 area with one heavy 1h candle, tagged 73,502.6, and was bought straight back. Four of the last five candles are green, with higher lows, and price is now back near 75,494. The long wick below 73,502.6 shows sellers ran out of strength at that level.
**Trading Setup**
- **Entry Point:** 75,350 – 75,480 (current price, or a small pullback toward it)
- **Target Point:** TP1 75,673.0 / TP2 76,200.0
- **Stop Loss:** 74,913.8 (1h close below)
The setup stays valid while BTC holds above 74,913.8 and keeps printing higher lows. A 1h close below that level means the bounce has failed, and the long is off.
*Risk warning: TP1 is close to current price, so reward is limited until it clears. The big red candle shows how fast sellers can return, so wait for a clean hold above 75,673.0 to confirm, size small, and never risk more than you can afford to lose. Not financial advice.*
**Trade on $BTC **
159
·
--
Bullish
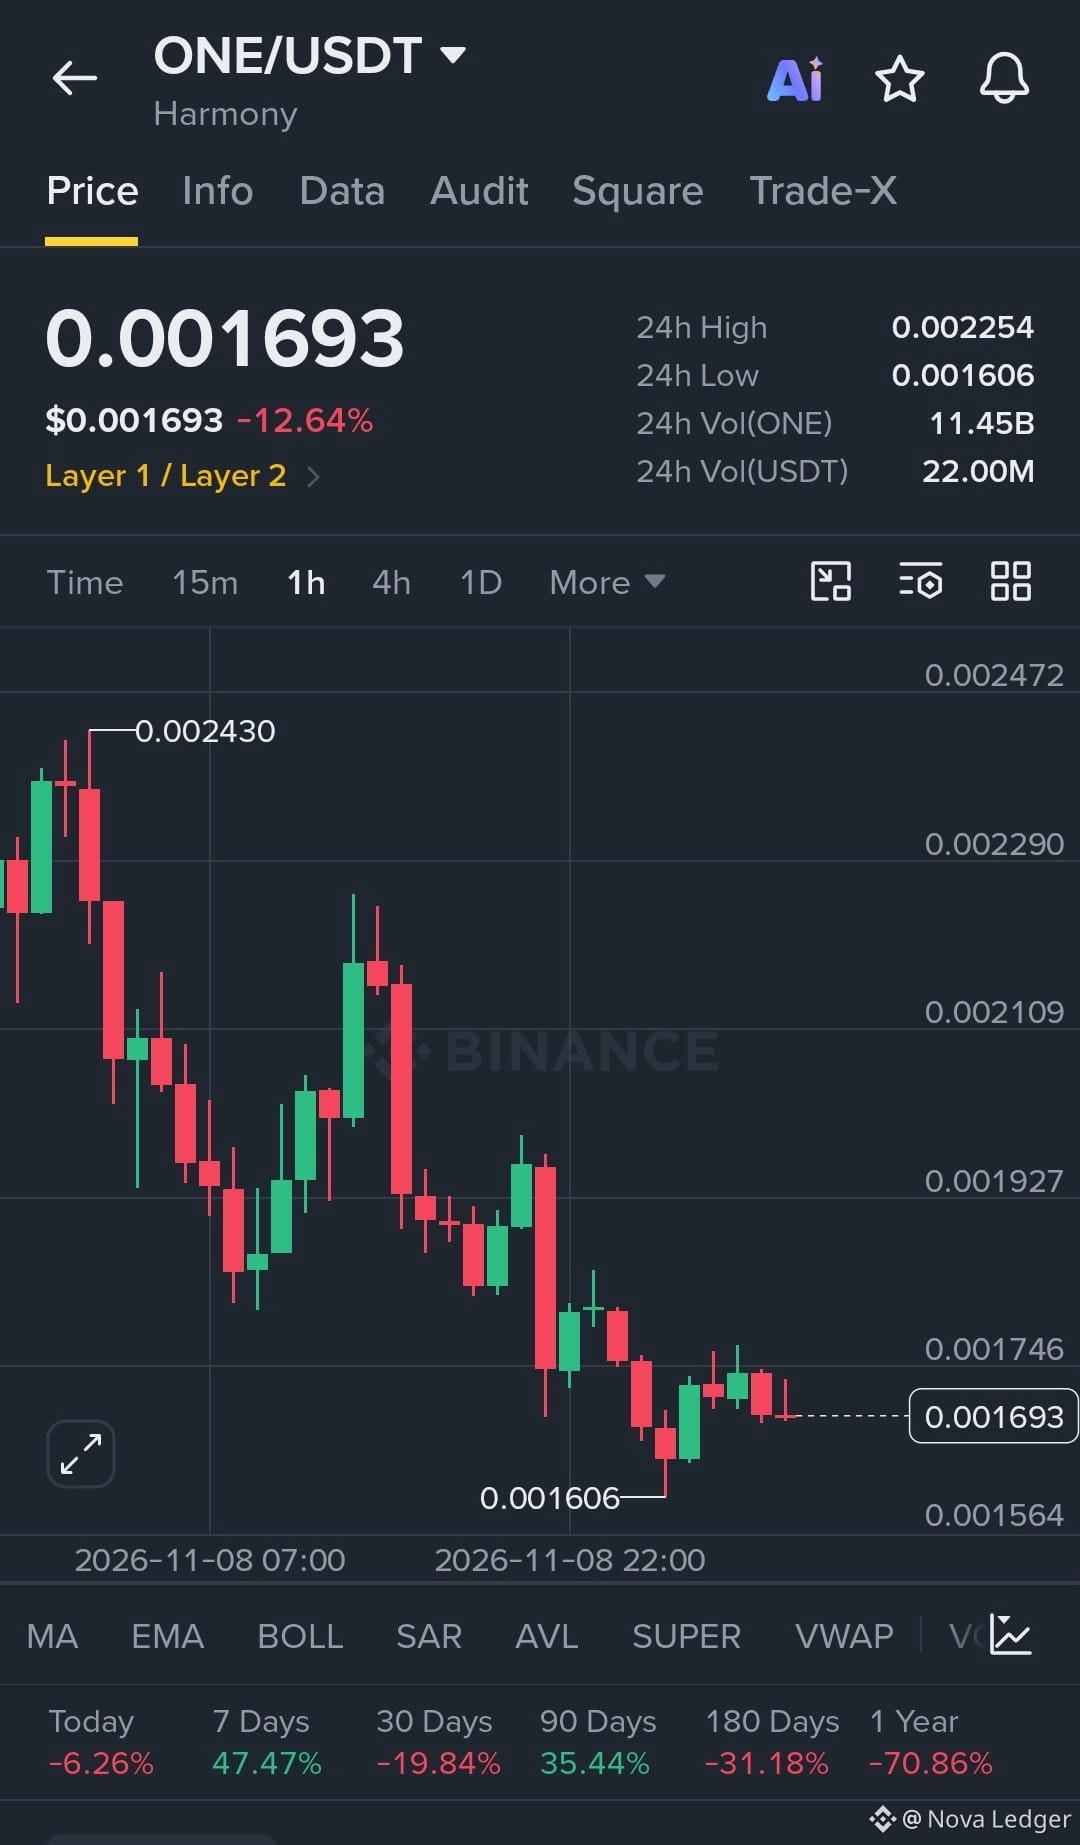
**I'M WATCHING A BIG SHORT ON $ONE .**
**EP:** 0.001717 – 0.001730
**TP:** 0.001609 (TP1) / 0.001574 (TP2)
**SL:** 0.001816 (1h close above)
**Price action:**
$ONE topped at 0.002467 and has been bleeding since. The 1h chart shows a clean sequence of lower highs and lower lows, with the 24h move at -12.84%.
**Buyers vs. sellers:**
Every bounce has been sold. The big red candles are wide and decisive, while the green rebounds are smaller and short-lived. The latest bounce off 0.001609 is small and hasn't reclaimed any meaningful level.
**Key levels:**
- Resistance: 0.001816, then 0.002057, then the 24h high at 0.002263
- Support: 0.001609 (24h low), then 0.001574
**Next move:**
Price is stuck under 0.001816 after the 0.001609 flush. If sellers keep defending that zone, I expect another test of 0.001609. A clean break below it opens 0.001574.
**What keeps it valid:**
Price stays below 0.001816 and the lower-high structure holds.
**What invalidates it:**
A 1h close above 0.001816. That would show buyers have broken the downtrend, and I'm out.
Trend is down, structure is clear, and risk is defined. I trade the chart, not hope.
*Not financial advice. R:R is roughly 1:1 to 1:1.4, so wait for confirmation and size accordingly.*
**I'M WATCHING A BIG SHORT ON $ONE .**
**EP:** 0.001717 – 0.001730
**TP:** 0.001609 (TP1) / 0.001574 (TP2)
**SL:** 0.001816 (1h close above)
**Price action:**
$ONE topped at 0.002467 and has been bleeding since. The 1h chart shows a clean sequence of lower highs and lower lows, with the 24h move at -12.84%.
**Buyers vs. sellers:**
Every bounce has been sold. The big red candles are wide and decisive, while the green rebounds are smaller and short-lived. The latest bounce off 0.001609 is small and hasn't reclaimed any meaningful level.
**Key levels:**
- Resistance: 0.001816, then 0.002057, then the 24h high at 0.002263
- Support: 0.001609 (24h low), then 0.001574
**Next move:**
Price is stuck under 0.001816 after the 0.001609 flush. If sellers keep defending that zone, I expect another test of 0.001609. A clean break below it opens 0.001574.
**What keeps it valid:**
Price stays below 0.001816 and the lower-high structure holds.
**What invalidates it:**
A 1h close above 0.001816. That would show buyers have broken the downtrend, and I'm out.
Trend is down, structure is clear, and risk is defined. I trade the chart, not hope.
*Not financial advice. R:R is roughly 1:1 to 1:1.4, so wait for confirmation and size accordingly.*
**EP:** 0.001717 – 0.001730
**TP:** 0.001609 (TP1) / 0.001574 (TP2)
**SL:** 0.001816 (1h close above)
**Price action:**
$ONE topped at 0.002467 and has been bleeding since. The 1h chart shows a clean sequence of lower highs and lower lows, with the 24h move at -12.84%.
**Buyers vs. sellers:**
Every bounce has been sold. The big red candles are wide and decisive, while the green rebounds are smaller and short-lived. The latest bounce off 0.001609 is small and hasn't reclaimed any meaningful level.
**Key levels:**
- Resistance: 0.001816, then 0.002057, then the 24h high at 0.002263
- Support: 0.001609 (24h low), then 0.001574
**Next move:**
Price is stuck under 0.001816 after the 0.001609 flush. If sellers keep defending that zone, I expect another test of 0.001609. A clean break below it opens 0.001574.
**What keeps it valid:**
Price stays below 0.001816 and the lower-high structure holds.
**What invalidates it:**
A 1h close above 0.001816. That would show buyers have broken the downtrend, and I'm out.
Trend is down, structure is clear, and risk is defined. I trade the chart, not hope.
*Not financial advice. R:R is roughly 1:1 to 1:1.4, so wait for confirmation and size accordingly.*
413
·
--
🎙️ Build Binance Square, Hold BNB | A New Monday—Has It Hit Bottom? Let’s Chat~

End
04 h 36 m 20 s
10.7k
46
39
·
--
Bullish
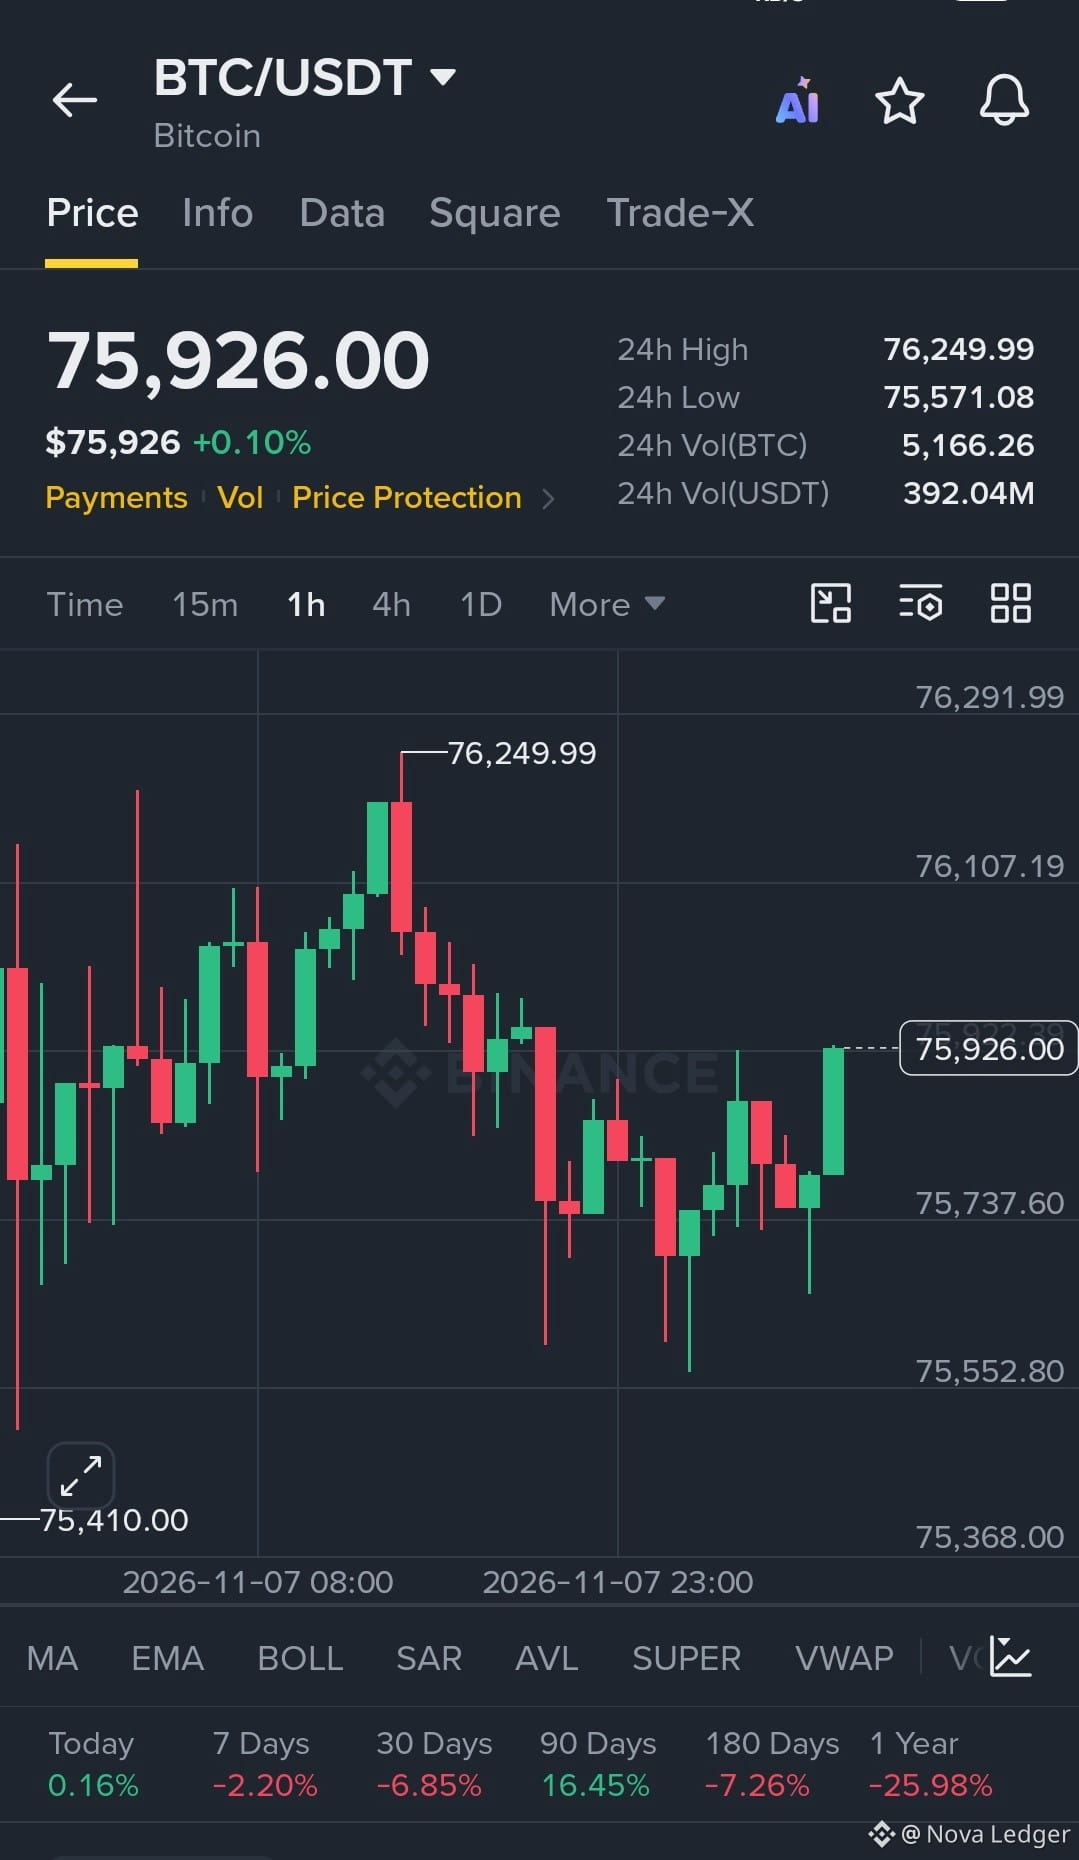
$BTC — NO TRADE YET | Waiting for Confirmation
BTC is trading at $75,926 after a strong short-term rebound. However, the broader 1H structure still shows lower highs and bearish pressure. Price is approaching resistance, but the latest bullish candle does not yet confirm a SHORT entry.
Trading Setup
* Entry Point: Wait for confirmation.
* Target Point: $75,737.60, then $75,552.80.
* Stop Loss: Not applicable until a valid entry is confirmed.
A SHORT becomes valid only if BTC rejects the $75,926 resistance area and confirms bearish momentum.
⚠️ Risk Warning: Avoid entering against strong bullish candles without confirmation.
Trade on $BTC
$BTC — NO TRADE YET | Waiting for Confirmation
BTC is trading at $75,926 after a strong short-term rebound. However, the broader 1H structure still shows lower highs and bearish pressure. Price is approaching resistance, but the latest bullish candle does not yet confirm a SHORT entry.
Trading Setup
* Entry Point: Wait for confirmation.
* Target Point: $75,737.60, then $75,552.80.
* Stop Loss: Not applicable until a valid entry is confirmed.
A SHORT becomes valid only if BTC rejects the $75,926 resistance area and confirms bearish momentum.
⚠️ Risk Warning: Avoid entering against strong bullish candles without confirmation.
Trade on $BTC
BTC is trading at $75,926 after a strong short-term rebound. However, the broader 1H structure still shows lower highs and bearish pressure. Price is approaching resistance, but the latest bullish candle does not yet confirm a SHORT entry.
Trading Setup
* Entry Point: Wait for confirmation.
* Target Point: $75,737.60, then $75,552.80.
* Stop Loss: Not applicable until a valid entry is confirmed.
A SHORT becomes valid only if BTC rejects the $75,926 resistance area and confirms bearish momentum.
⚠️ Risk Warning: Avoid entering against strong bullish candles without confirmation.
Trade on $BTC
77
·
--
Bullish
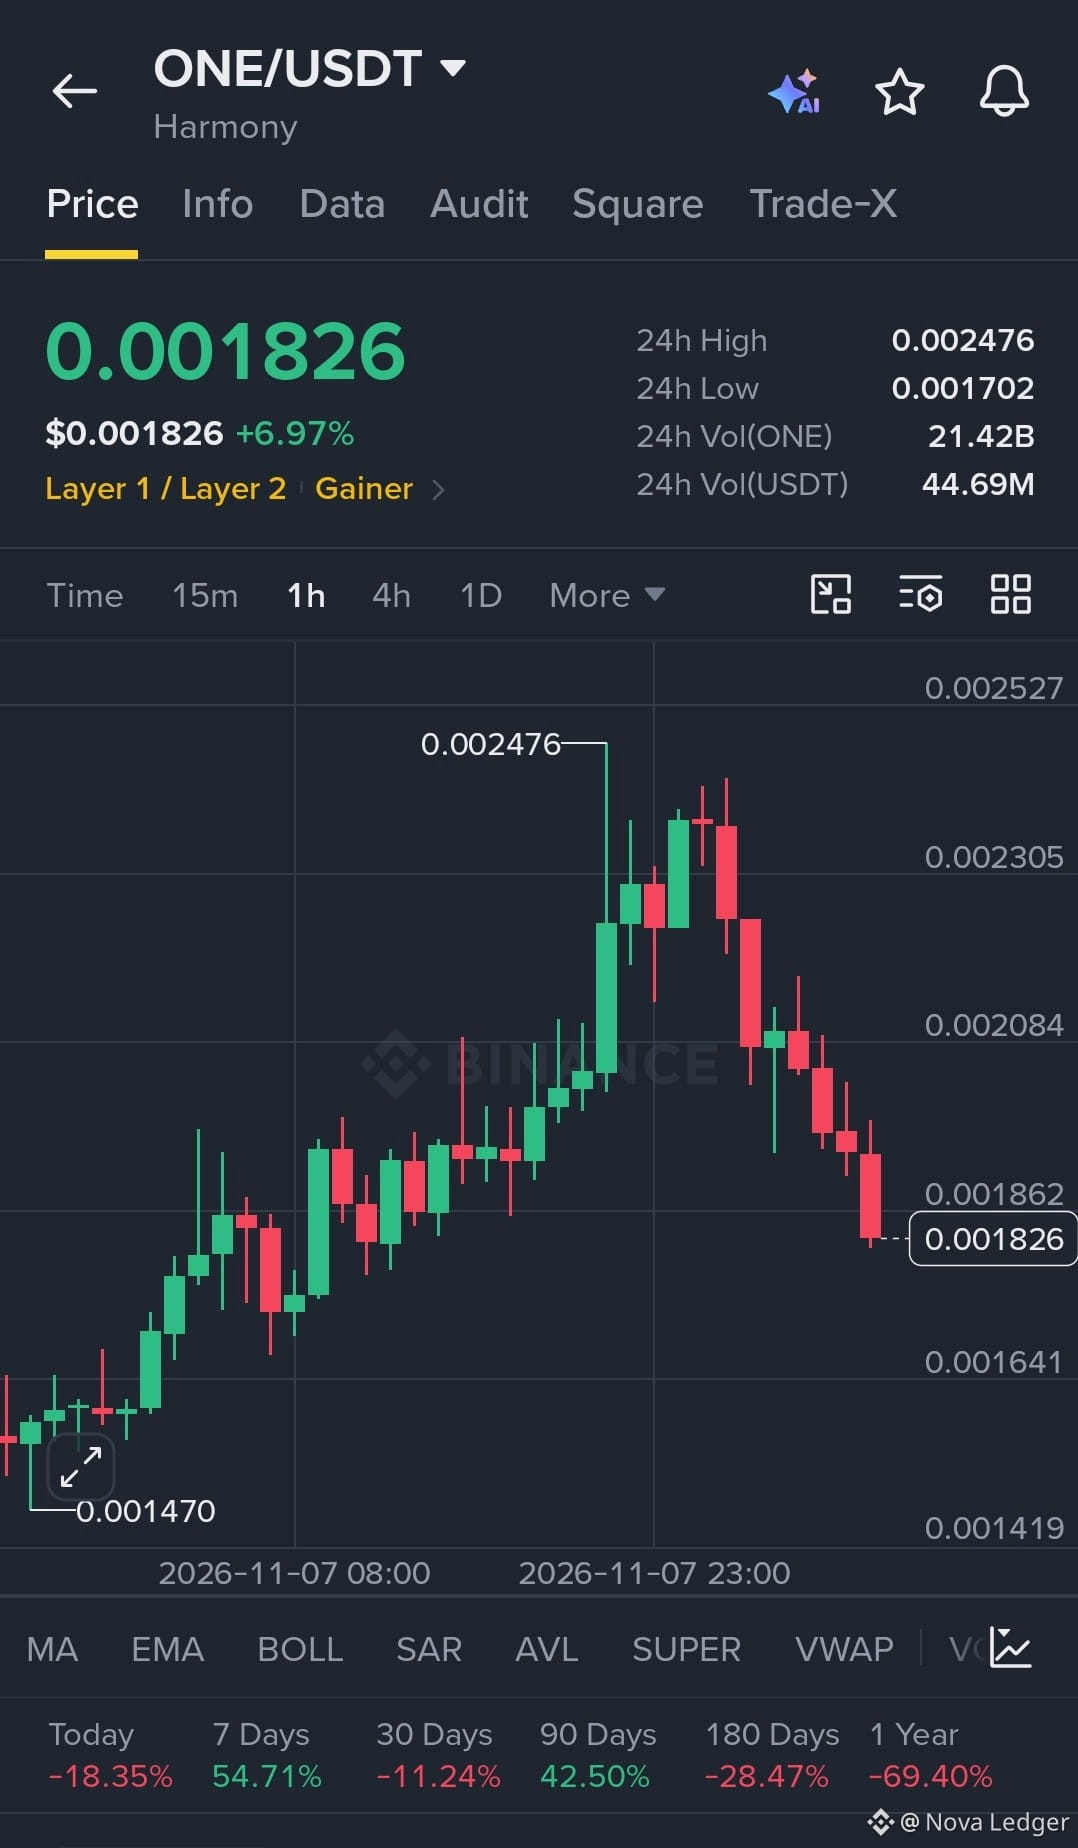
$ONE SHORT SETUP — Bearish Breakdown, Sellers Take Control
ONE is showing clear bearish momentum on the 1H chart after a sharp rejection from $0.002476. Price has broken below the $0.001862 support level, forming consecutive lower highs and lower lows. A retest of the broken support offers a potential SHORT opportunity.
Trading Setup
* Entry Point: $0.001862
* Target Point: $0.001641
* Stop Loss: $0.002084
The setup remains valid as long as price stays below $0.001862 and confirms bearish rejection on the retest.
⚠️ Risk Warning: Wait for confirmation before entry and manage your position size carefully.
Trade on $ONE
$ONE SHORT SETUP — Bearish Breakdown, Sellers Take Control
ONE is showing clear bearish momentum on the 1H chart after a sharp rejection from $0.002476. Price has broken below the $0.001862 support level, forming consecutive lower highs and lower lows. A retest of the broken support offers a potential SHORT opportunity.
Trading Setup
* Entry Point: $0.001862
* Target Point: $0.001641
* Stop Loss: $0.002084
The setup remains valid as long as price stays below $0.001862 and confirms bearish rejection on the retest.
⚠️ Risk Warning: Wait for confirmation before entry and manage your position size carefully.
Trade on $ONE
ONE is showing clear bearish momentum on the 1H chart after a sharp rejection from $0.002476. Price has broken below the $0.001862 support level, forming consecutive lower highs and lower lows. A retest of the broken support offers a potential SHORT opportunity.
Trading Setup
* Entry Point: $0.001862
* Target Point: $0.001641
* Stop Loss: $0.002084
The setup remains valid as long as price stays below $0.001862 and confirms bearish rejection on the retest.
⚠️ Risk Warning: Wait for confirmation before entry and manage your position size carefully.
Trade on $ONE
504
·
--
Bullish
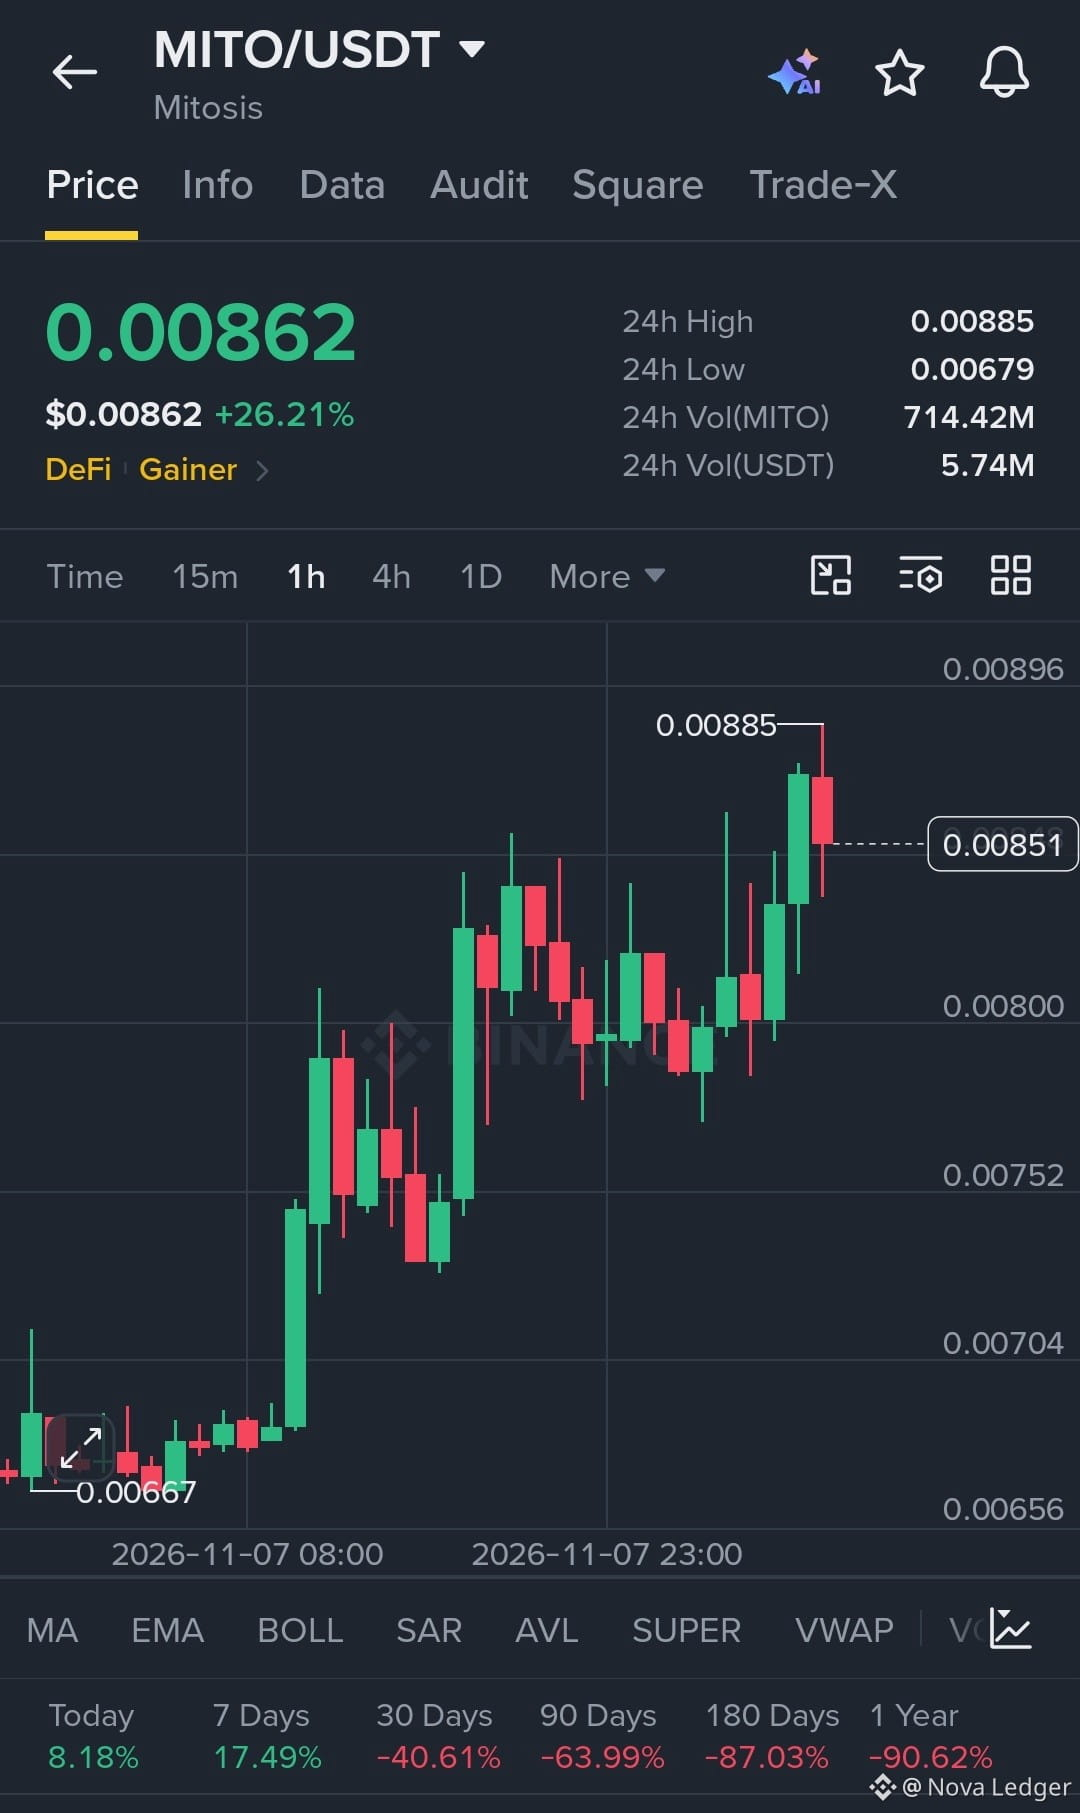
I'M WATCHING A BIG LONG ON $MITO .
EP: $0.00800–$0.00815 TP: $0.00885 SL: $0.00780
MITO is showing strong bullish market structure on the 1H chart, following a powerful breakout from the $0.00667 region. Buyers have reclaimed momentum, pushed price toward $0.00885 resistance, and established higher highs. A pullback toward the $0.00800–$0.00815 area could offer another LONG opportunity.
Key Levels: $0.00800 is the immediate support zone, while $0.00885 is the key resistance and breakout target.
The setup remains valid as long as buyers defend $0.00800. A confirmed breakdown below this level weakens the bullish structure and invalidates the entry idea.
Let the retest confirm the move. Trade the structure, not the emotion. ⚡
I'M WATCHING A BIG LONG ON $MITO .
EP: $0.00800–$0.00815 TP: $0.00885 SL: $0.00780
MITO is showing strong bullish market structure on the 1H chart, following a powerful breakout from the $0.00667 region. Buyers have reclaimed momentum, pushed price toward $0.00885 resistance, and established higher highs. A pullback toward the $0.00800–$0.00815 area could offer another LONG opportunity.
Key Levels: $0.00800 is the immediate support zone, while $0.00885 is the key resistance and breakout target.
The setup remains valid as long as buyers defend $0.00800. A confirmed breakdown below this level weakens the bullish structure and invalidates the entry idea.
Let the retest confirm the move. Trade the structure, not the emotion. ⚡
EP: $0.00800–$0.00815 TP: $0.00885 SL: $0.00780
MITO is showing strong bullish market structure on the 1H chart, following a powerful breakout from the $0.00667 region. Buyers have reclaimed momentum, pushed price toward $0.00885 resistance, and established higher highs. A pullback toward the $0.00800–$0.00815 area could offer another LONG opportunity.
Key Levels: $0.00800 is the immediate support zone, while $0.00885 is the key resistance and breakout target.
The setup remains valid as long as buyers defend $0.00800. A confirmed breakdown below this level weakens the bullish structure and invalidates the entry idea.
Let the retest confirm the move. Trade the structure, not the emotion. ⚡
168
·
--
Bullish
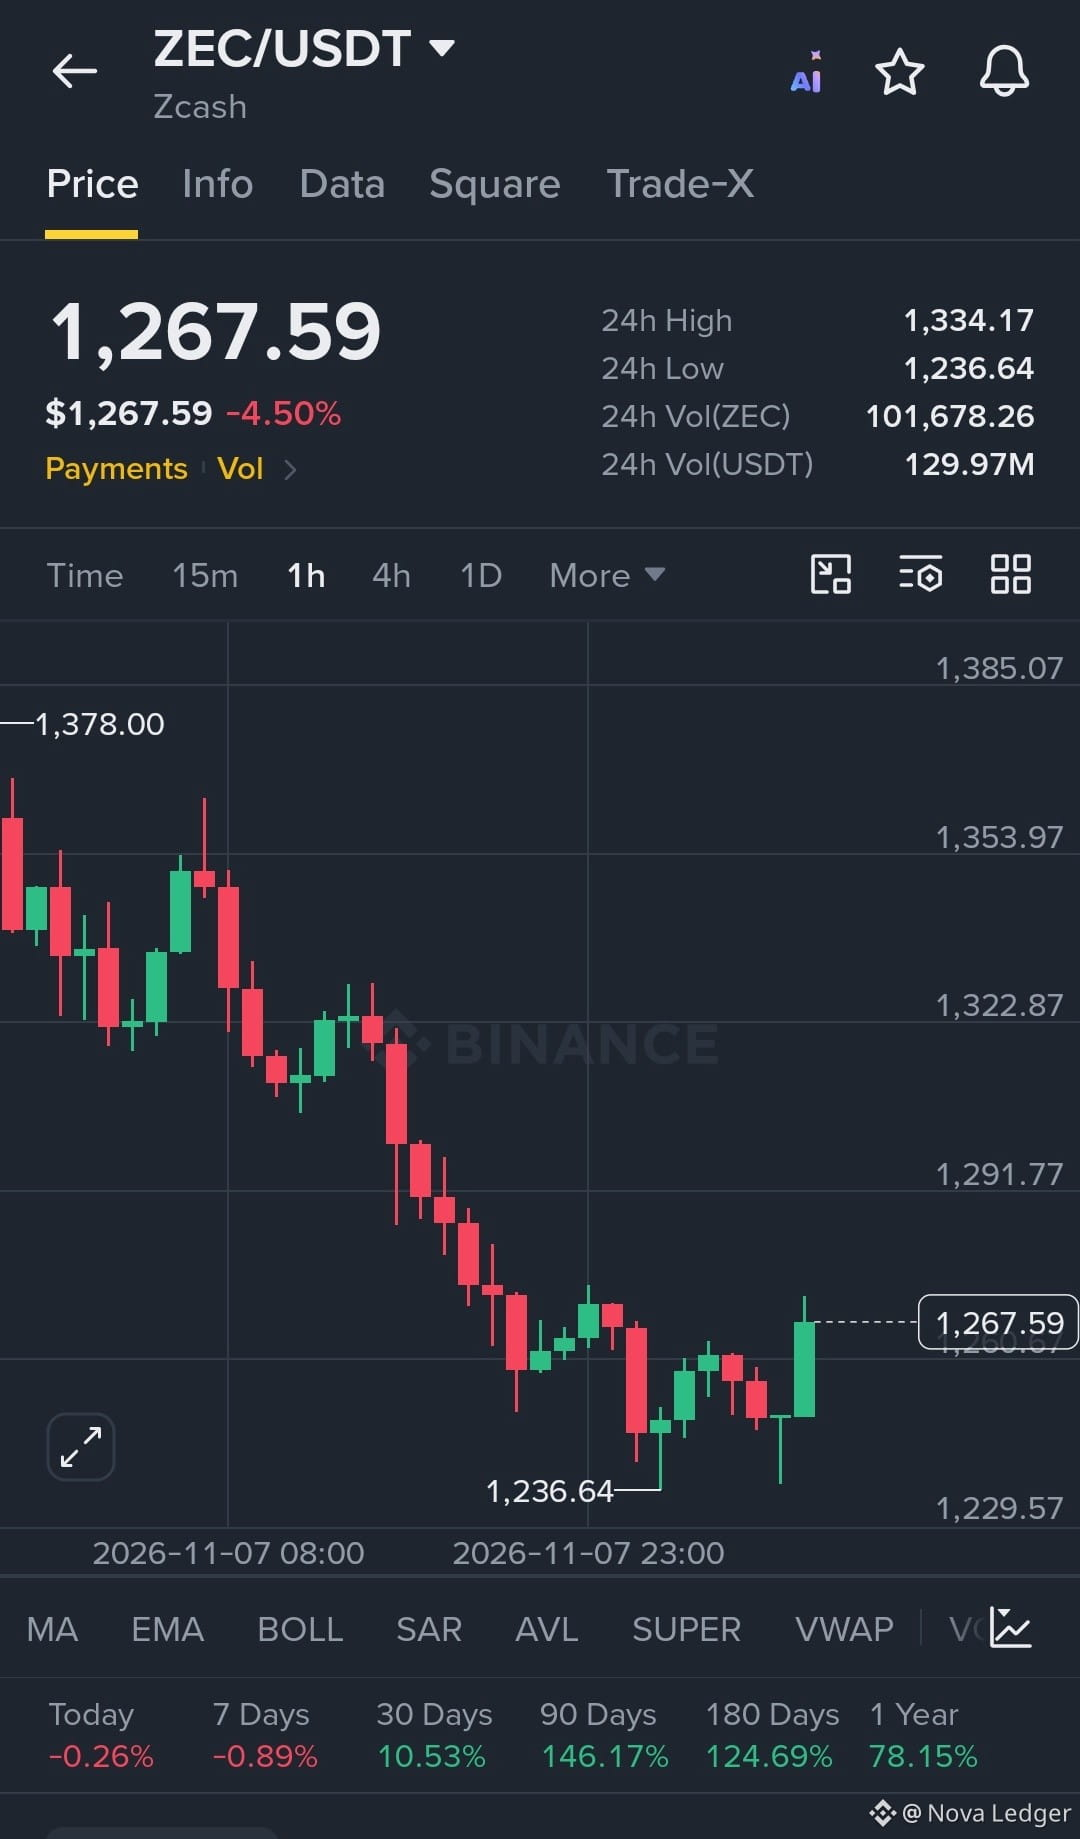
$ZEC SHORT SETUP — Bearish Trend, Weak Recovery
ZEC remains under strong bearish pressure on the 1H chart, with a clear sequence of lower highs and lower lows. Price has bounced from $1,236.64, but the recovery is approaching resistance around $1,267–$1,280. A rejection in this area could create another downside opportunity.
Trading Setup
* Entry Point: $1,267–$1,280 (after bearish rejection)
* Target Point: $1,236.64
* Stop Loss: $1,291.77
The setup remains valid while price stays below $1,291.77 and sellers defend the resistance zone.
⚠️ Risk Warning: Wait for bearish confirmation before entering. A strong breakout above resistance invalidates the setup.
Trade on $ZEC
$ZEC SHORT SETUP — Bearish Trend, Weak Recovery
ZEC remains under strong bearish pressure on the 1H chart, with a clear sequence of lower highs and lower lows. Price has bounced from $1,236.64, but the recovery is approaching resistance around $1,267–$1,280. A rejection in this area could create another downside opportunity.
Trading Setup
* Entry Point: $1,267–$1,280 (after bearish rejection)
* Target Point: $1,236.64
* Stop Loss: $1,291.77
The setup remains valid while price stays below $1,291.77 and sellers defend the resistance zone.
⚠️ Risk Warning: Wait for bearish confirmation before entering. A strong breakout above resistance invalidates the setup.
Trade on $ZEC
ZEC remains under strong bearish pressure on the 1H chart, with a clear sequence of lower highs and lower lows. Price has bounced from $1,236.64, but the recovery is approaching resistance around $1,267–$1,280. A rejection in this area could create another downside opportunity.
Trading Setup
* Entry Point: $1,267–$1,280 (after bearish rejection)
* Target Point: $1,236.64
* Stop Loss: $1,291.77
The setup remains valid while price stays below $1,291.77 and sellers defend the resistance zone.
⚠️ Risk Warning: Wait for bearish confirmation before entering. A strong breakout above resistance invalidates the setup.
Trade on $ZEC
308
·
--
Bullish
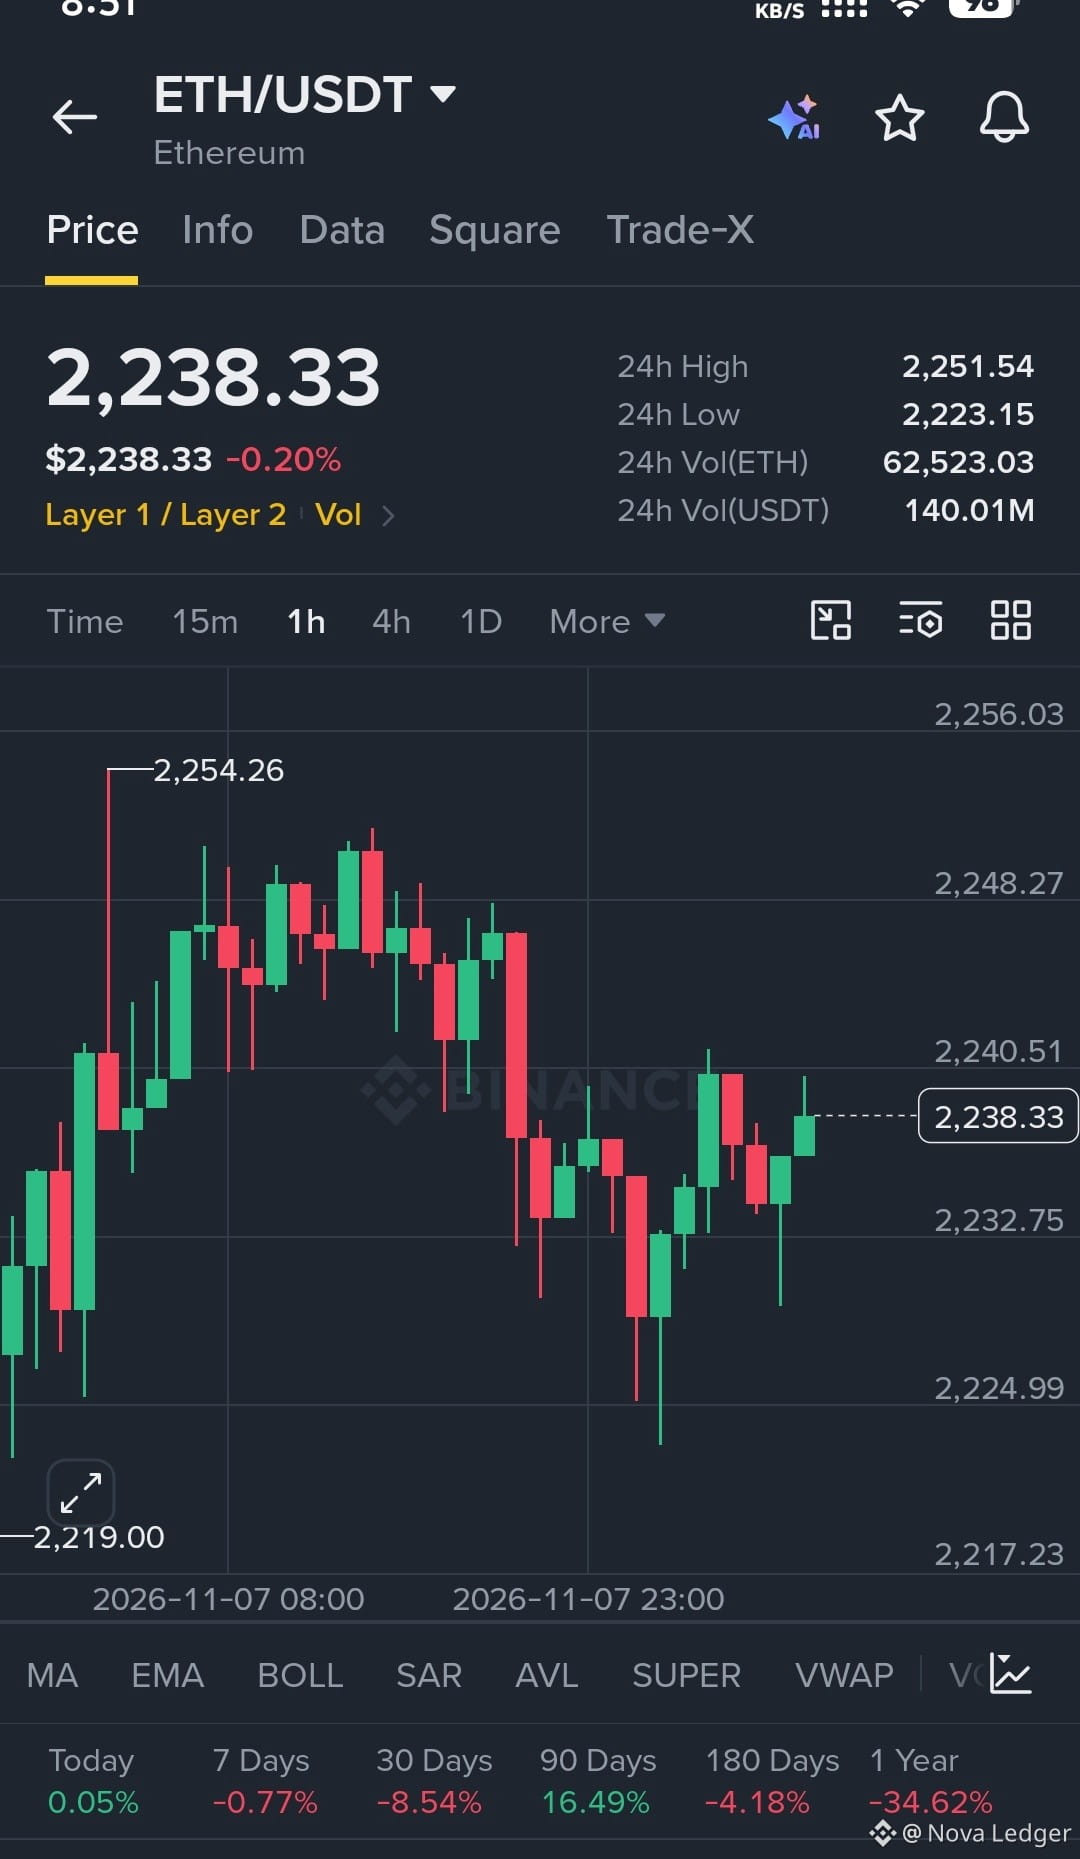
I'M WATCHING A BIG SHORT ON $ETH .
EP: $2,240.51–$2,248.27 (on bearish rejection) TP: $2,232.75 → $2,224.99 SL: $2,254.26
ETH is showing short-term bearish pressure after rejection from the $2,248–$2,254 resistance area. Buyers have attempted a recovery from $2,224.99, but price is now approaching another resistance zone around $2,240.51. A fresh rejection could trigger another move toward lower support.
Key Level: $2,232.75 is the immediate support to watch. If sellers break it, $2,224.99 becomes the next downside target.
The SHORT setup remains valid while ETH fails to reclaim $2,248.27. A sustained breakout above $2,254.26 invalidates the bearish idea.
Patience is key. Let price confirm the rejection before taking the trade. 🎯
I'M WATCHING A BIG SHORT ON $ETH .
EP: $2,240.51–$2,248.27 (on bearish rejection) TP: $2,232.75 → $2,224.99 SL: $2,254.26
ETH is showing short-term bearish pressure after rejection from the $2,248–$2,254 resistance area. Buyers have attempted a recovery from $2,224.99, but price is now approaching another resistance zone around $2,240.51. A fresh rejection could trigger another move toward lower support.
Key Level: $2,232.75 is the immediate support to watch. If sellers break it, $2,224.99 becomes the next downside target.
The SHORT setup remains valid while ETH fails to reclaim $2,248.27. A sustained breakout above $2,254.26 invalidates the bearish idea.
Patience is key. Let price confirm the rejection before taking the trade. 🎯
EP: $2,240.51–$2,248.27 (on bearish rejection) TP: $2,232.75 → $2,224.99 SL: $2,254.26
ETH is showing short-term bearish pressure after rejection from the $2,248–$2,254 resistance area. Buyers have attempted a recovery from $2,224.99, but price is now approaching another resistance zone around $2,240.51. A fresh rejection could trigger another move toward lower support.
Key Level: $2,232.75 is the immediate support to watch. If sellers break it, $2,224.99 becomes the next downside target.
The SHORT setup remains valid while ETH fails to reclaim $2,248.27. A sustained breakout above $2,254.26 invalidates the bearish idea.
Patience is key. Let price confirm the rejection before taking the trade. 🎯
131
·
--
Bullish
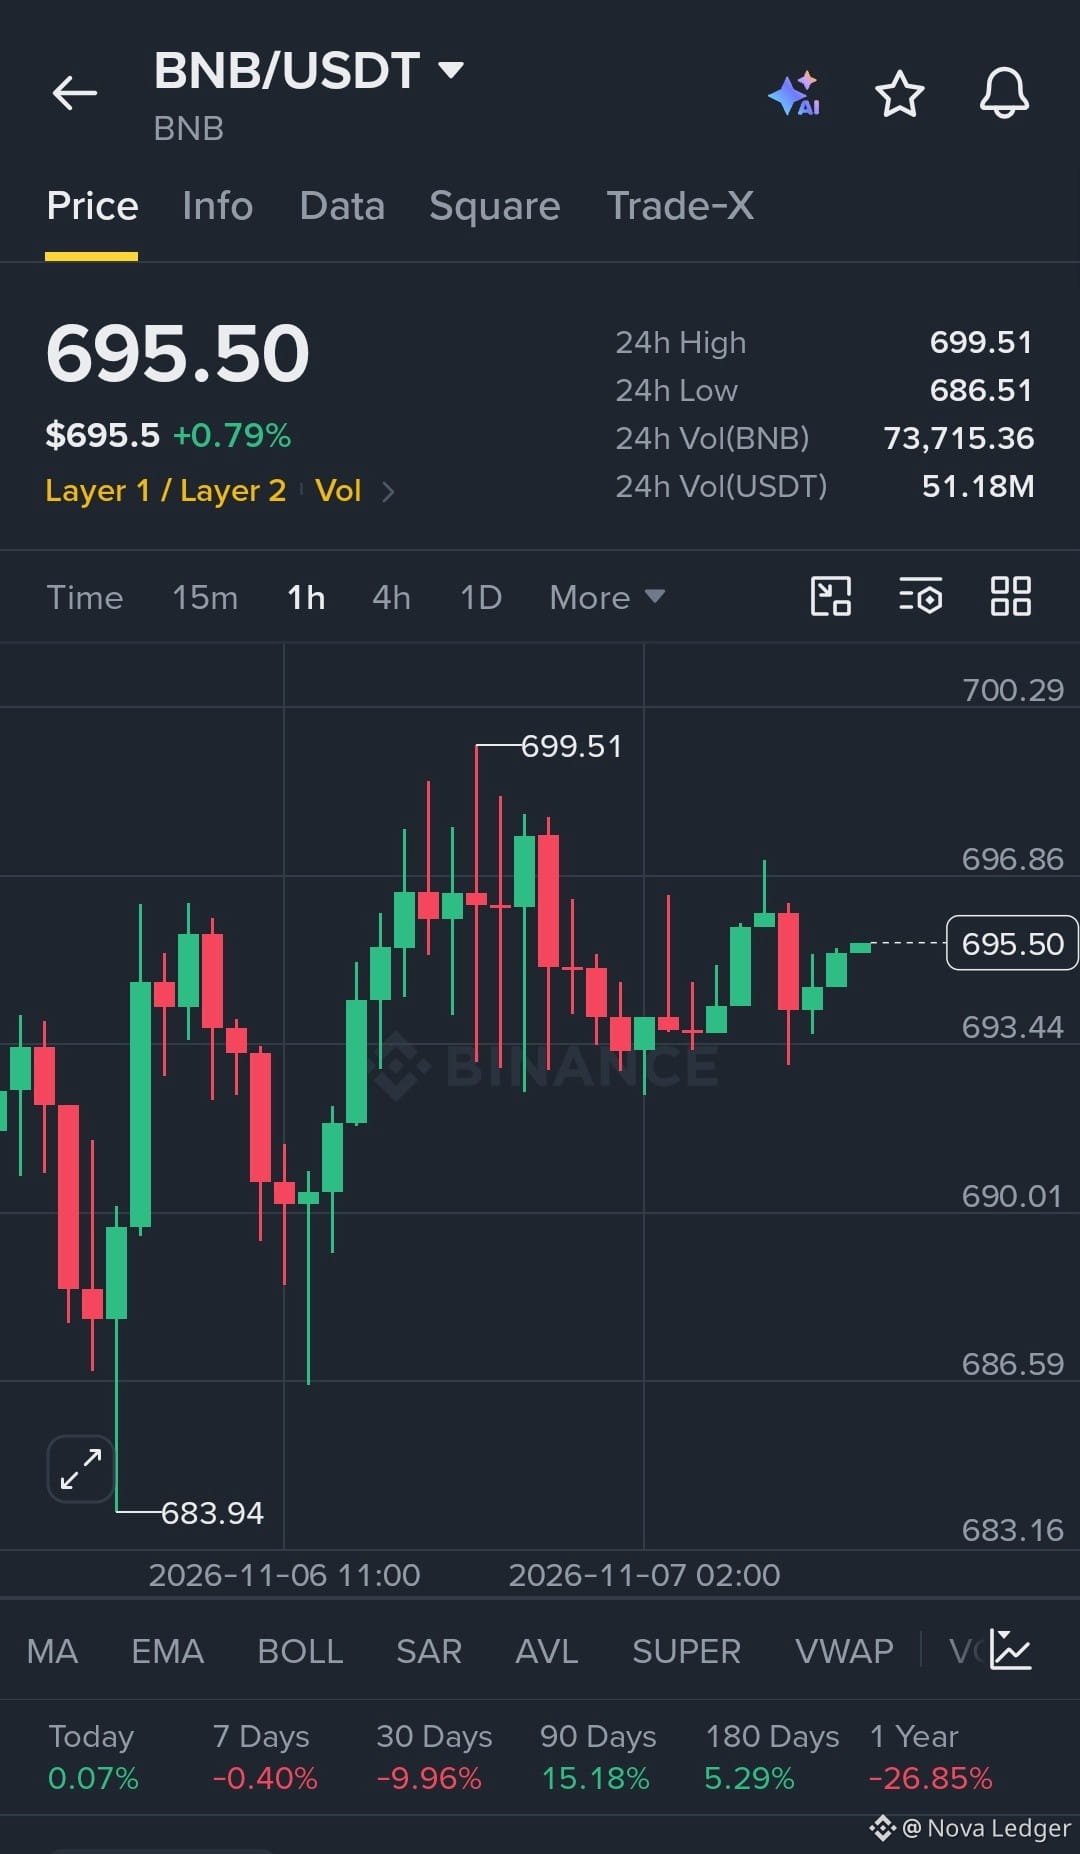
$BNB — NO TRADE SETUP | Waiting for a Confirmed Breakout
BNB is trading at $695.50 on the 1H chart, consolidating below resistance at $696.86. Price is showing a modest recovery, but neither buyers nor sellers have confirmed control. Entering now would mean trading inside the range without a clear directional edge.
Trading Setup
* Entry Point: Wait for a confirmed 1H breakout above $696.86 or breakdown below $693.44.
* Target Point: $699.51 on a bullish breakout.
* Stop Loss: Below $693.44 for a confirmed bullish entry (reassess risk before entry).
The setup remains valid only after a confirmed breakout and successful retest of the broken level.
⚠️ Risk Warning: Avoid entering during consolidation. Always manage position size and risk.
Trade on $BNB
$BNB — NO TRADE SETUP | Waiting for a Confirmed Breakout
BNB is trading at $695.50 on the 1H chart, consolidating below resistance at $696.86. Price is showing a modest recovery, but neither buyers nor sellers have confirmed control. Entering now would mean trading inside the range without a clear directional edge.
Trading Setup
* Entry Point: Wait for a confirmed 1H breakout above $696.86 or breakdown below $693.44.
* Target Point: $699.51 on a bullish breakout.
* Stop Loss: Below $693.44 for a confirmed bullish entry (reassess risk before entry).
The setup remains valid only after a confirmed breakout and successful retest of the broken level.
⚠️ Risk Warning: Avoid entering during consolidation. Always manage position size and risk.
Trade on $BNB
BNB is trading at $695.50 on the 1H chart, consolidating below resistance at $696.86. Price is showing a modest recovery, but neither buyers nor sellers have confirmed control. Entering now would mean trading inside the range without a clear directional edge.
Trading Setup
* Entry Point: Wait for a confirmed 1H breakout above $696.86 or breakdown below $693.44.
* Target Point: $699.51 on a bullish breakout.
* Stop Loss: Below $693.44 for a confirmed bullish entry (reassess risk before entry).
The setup remains valid only after a confirmed breakout and successful retest of the broken level.
⚠️ Risk Warning: Avoid entering during consolidation. Always manage position size and risk.
Trade on $BNB
105
Log in to explore more content
Join global crypto users on Binance Square
⚡️ Get latest and useful information about crypto.
💬 Trusted by the world’s largest crypto exchange.
👍 Discover real insights from verified creators.
Email / Phone number
Trending Topics
HotCPIDecemberHikePriced
82,659 views
976 Discussing
CPI Market Watch | US CPI Rises 0.4% in October, Hotter Than 0.3% Forecast
Binance News
·26 Likes
·41.2k views
AnthropicRejectsIPODelayValuationinQuestion
208,995 views
1,747 Discussing
NvidiaInvestigatesAfterHuang’sAffairApology
497,583 views
3,161 Discussing