**I'M WATCHING A BIG SHORT ON $ONE .**
**EP:** 0.001717 – 0.001730
**TP:** 0.001609 (TP1) / 0.001574 (TP2)
**SL:** 0.001816 (1h close above)
**Price action:**
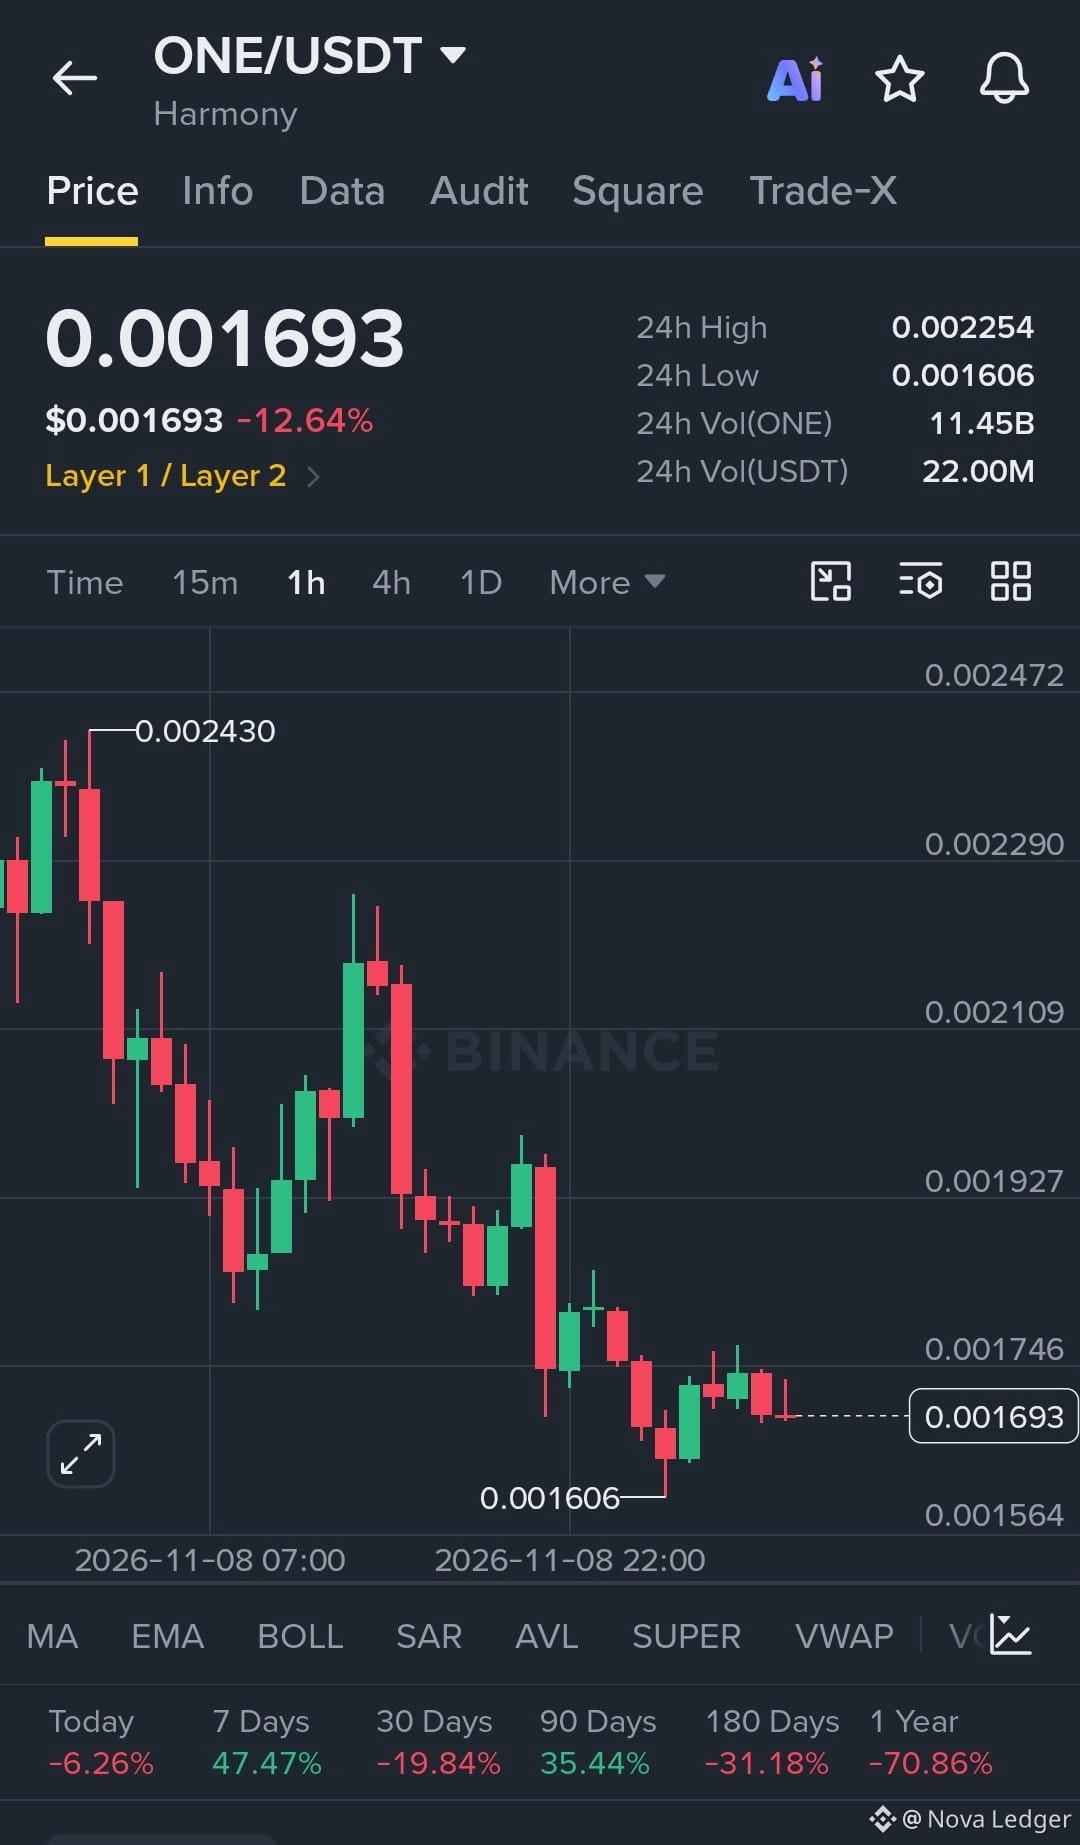
$ONE topped at 0.002467 and has been bleeding since. The 1h chart shows a clean sequence of lower highs and lower lows, with the 24h move at -12.84%.
**Buyers vs. sellers:**
Every bounce has been sold. The big red candles are wide and decisive, while the green rebounds are smaller and short-lived. The latest bounce off 0.001609 is small and hasn't reclaimed any meaningful level.
**Key levels:**
- Resistance: 0.001816, then 0.002057, then the 24h high at 0.002263
- Support: 0.001609 (24h low), then 0.001574
**Next move:**
Price is stuck under 0.001816 after the 0.001609 flush. If sellers keep defending that zone, I expect another test of 0.001609. A clean break below it opens 0.001574.
**What keeps it valid:**
Price stays below 0.001816 and the lower-high structure holds.
**What invalidates it:**
A 1h close above 0.001816. That would show buyers have broken the downtrend, and I'm out.
Trend is down, structure is clear, and risk is defined. I trade the chart, not hope.
*Not financial advice. R:R is roughly 1:1 to 1:1.4, so wait for confirmation and size accordingly.*
**EP:** 0.001717 – 0.001730
**TP:** 0.001609 (TP1) / 0.001574 (TP2)
**SL:** 0.001816 (1h close above)
**Price action:**
$ONE topped at 0.002467 and has been bleeding since. The 1h chart shows a clean sequence of lower highs and lower lows, with the 24h move at -12.84%.
**Buyers vs. sellers:**
Every bounce has been sold. The big red candles are wide and decisive, while the green rebounds are smaller and short-lived. The latest bounce off 0.001609 is small and hasn't reclaimed any meaningful level.
**Key levels:**
- Resistance: 0.001816, then 0.002057, then the 24h high at 0.002263
- Support: 0.001609 (24h low), then 0.001574
**Next move:**
Price is stuck under 0.001816 after the 0.001609 flush. If sellers keep defending that zone, I expect another test of 0.001609. A clean break below it opens 0.001574.
**What keeps it valid:**
Price stays below 0.001816 and the lower-high structure holds.
**What invalidates it:**
A 1h close above 0.001816. That would show buyers have broken the downtrend, and I'm out.
Trend is down, structure is clear, and risk is defined. I trade the chart, not hope.
*Not financial advice. R:R is roughly 1:1 to 1:1.4, so wait for confirmation and size accordingly.*