

Rose Sweet
16.9k Posts

Rose Sweet
Report
Block User
I'm crypto blogger sharing real time signal follow the page for more crypto signals and crypto details....
Open Trade
Frequent Trader
9.6 Months
44 Following
462 Followers
2.5K+ Liked
Posts
Portfolio
All
Videos
·
--
Bearish
$ENA Price trades at $0.1988, down 9.57% daily, testing immediate support at $0.1920 with deeper defense at $0.1850.
Resistance clusters at $0.2100 (breakdown zone) and $0.2250; breaking above requires sustained volume confirmation.
1h chart shows consolidation in a descending channel, while 4h structure confirms a broader downtrend with lower highs.
#BinancePick #KOSPISinks3.52%ToLowestCloseSinceApril
{future}(ENAUSDT)
$ENA Price trades at $0.1988, down 9.57% daily, testing immediate support at $0.1920 with deeper defense at $0.1850.
Resistance clusters at $0.2100 (breakdown zone) and $0.2250; breaking above requires sustained volume confirmation.
1h chart shows consolidation in a descending channel, while 4h structure confirms a broader downtrend with lower highs.
#BinancePick #KOSPISinks3.52%ToLowestCloseSinceApril
Resistance clusters at $0.2100 (breakdown zone) and $0.2250; breaking above requires sustained volume confirmation.
1h chart shows consolidation in a descending channel, while 4h structure confirms a broader downtrend with lower highs.
#BinancePick #KOSPISinks3.52%ToLowestCloseSinceApril
12
·
--
Bullish
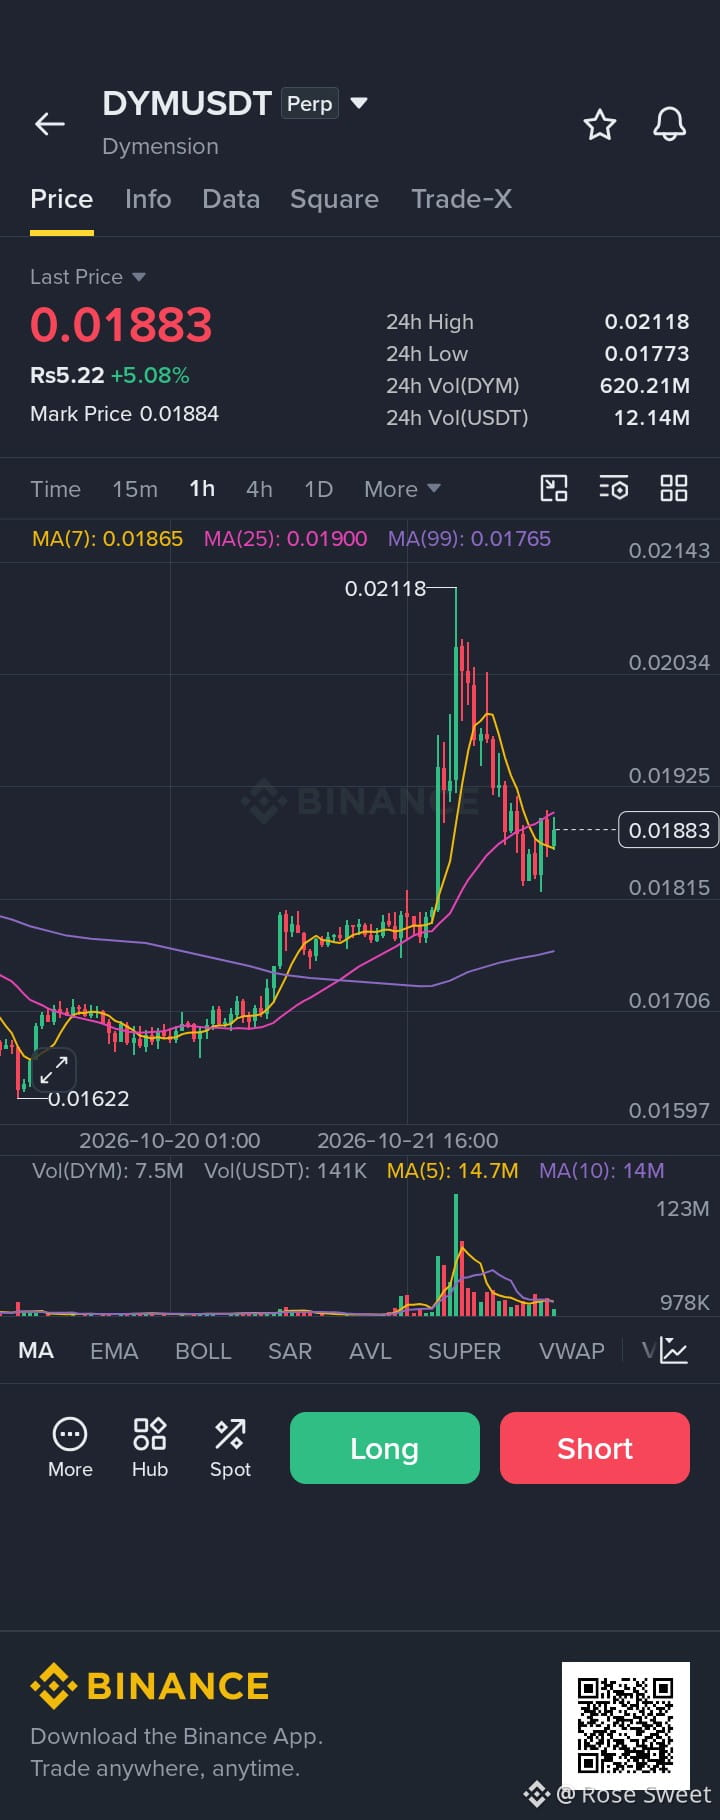
DYM Potential Reversal: Buyers Gaining Traction
Following a bounce off the $0.01835–$0.01850 support region, DYM is currently trading around $0.01896. Short-term bullish momentum is building, and a breakout above immediate resistance could spark further upside.
Buy Zone: $0.01890 – $0.01900
Target 1: $0.01920
Target 2: $0.01950
Target 3: $0.01980
Stop-Loss: $0.01850
$DYM
{future}(DYMUSDT)
$DOT
{future}(DOTUSDT)
$DASH
{future}(DASHUSDT)
#TeslaSlides5%PreMarket #ChinaSeeksToSeize61800BTC
DYM Potential Reversal: Buyers Gaining Traction
Following a bounce off the $0.01835–$0.01850 support region, DYM is currently trading around $0.01896. Short-term bullish momentum is building, and a breakout above immediate resistance could spark further upside.
Buy Zone: $0.01890 – $0.01900
Target 1: $0.01920
Target 2: $0.01950
Target 3: $0.01980
Stop-Loss: $0.01850
$DYM
$DOT
$DASH
#TeslaSlides5%PreMarket #ChinaSeeksToSeize61800BTC
12

·
--
Bearish
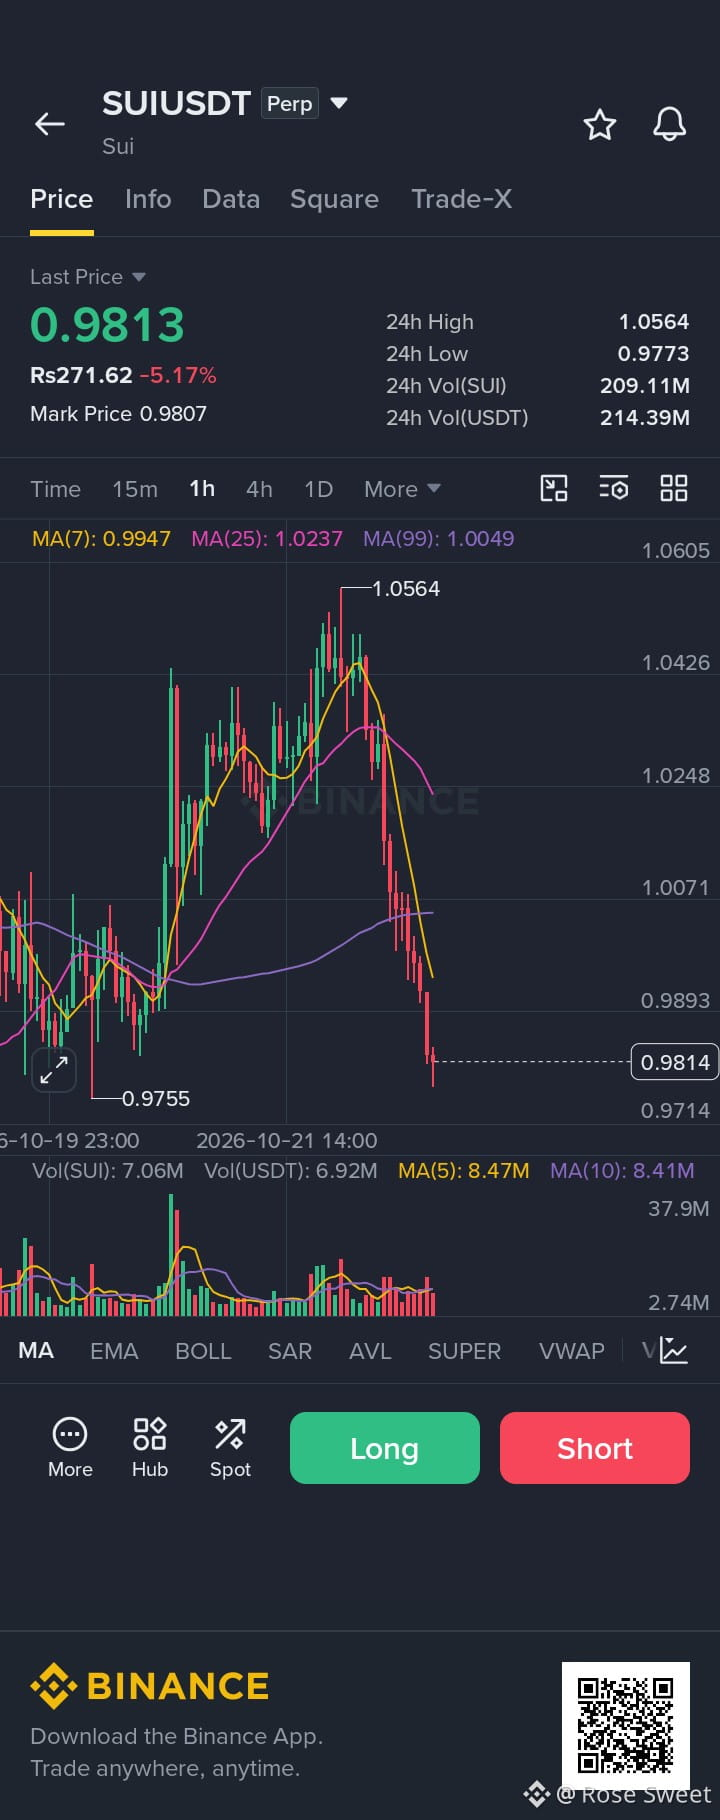
SUI / USDT — LONG Setup
SUI is pulling back toward a major support zone around $0.9770–$0.9800. A solid bounce off this level could set up a nice reversal toward $1.0090 and $1.0360.
Trade Plan:
Entry Zone: $0.9770 – $0.9820
Stop Loss (SL): $0.9570
Targets (TP): $0.9900 | $1.0000 | $1.0090 | $1.0250
$SUI
{future}(SUIUSDT)
$SOL
{future}(SOLUSDT)
#SUİ #solana
SUI / USDT — LONG Setup
SUI is pulling back toward a major support zone around $0.9770–$0.9800. A solid bounce off this level could set up a nice reversal toward $1.0090 and $1.0360.
Trade Plan:
Entry Zone: $0.9770 – $0.9820
Stop Loss (SL): $0.9570
Targets (TP): $0.9900 | $1.0000 | $1.0090 | $1.0250
$SUI
$SOL
#SUİ #solana
SUI is pulling back toward a major support zone around $0.9770–$0.9800. A solid bounce off this level could set up a nice reversal toward $1.0090 and $1.0360.
Trade Plan:
Entry Zone: $0.9770 – $0.9820
Stop Loss (SL): $0.9570
Targets (TP): $0.9900 | $1.0000 | $1.0090 | $1.0250
$SUI
$SOL
#SUİ #solana
24
·
--
Bearish
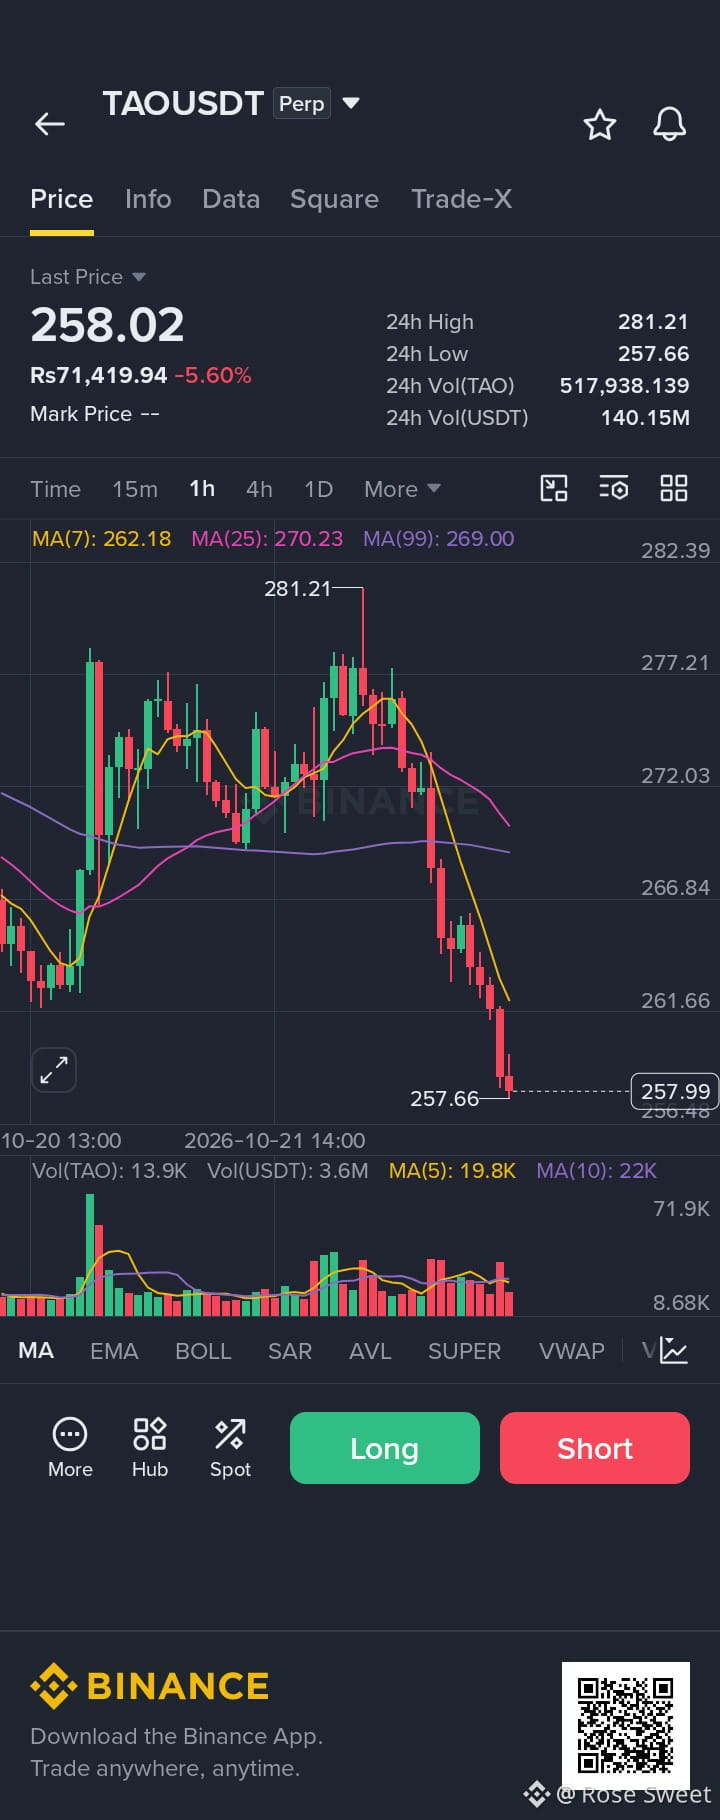
TAO Long Setup
TAO is currently closing in on key support between $254 and $258. If buyers hold this level, we could see a bounce back toward $264–$276. Keep in mind that bearish momentum is still present, so manage your risk closely.
Trade Details:
Direction: Long
Entry Zone: $258 – $260
Stop Loss (SL): $250
Targets:
TP1: $264
TP2: $268
TP3: $272
TP4: $276
📲 Trade $TAO here: 👇
$TAO
{future}(TAOUSDT)
#TAO $TRX
{future}(TRXUSDT)
TAO Long Setup
TAO is currently closing in on key support between $254 and $258. If buyers hold this level, we could see a bounce back toward $264–$276. Keep in mind that bearish momentum is still present, so manage your risk closely.
Trade Details:
Direction: Long
Entry Zone: $258 – $260
Stop Loss (SL): $250
Targets:
TP1: $264
TP2: $268
TP3: $272
TP4: $276
📲 Trade $TAO here: 👇
$TAO
#TAO $TRX
13
·
--
Bullish
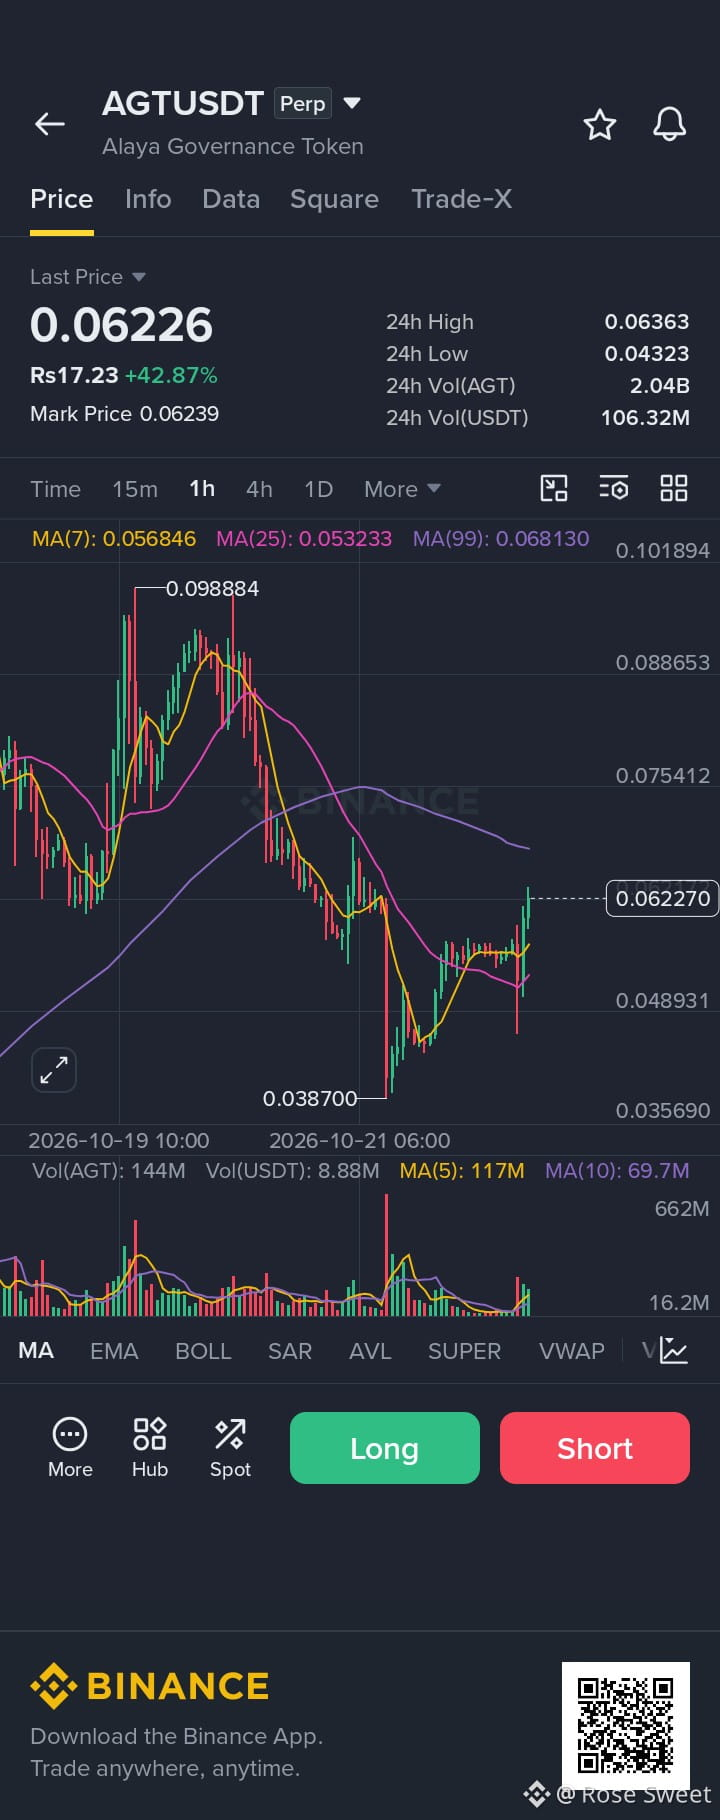
$AGT is breaking past the 25-day EMA. Once $0.065 falls, expect a strong continuation move."
$AGT
{future}(AGTUSDT)
$ADA
{future}(ADAUSDT)
#EarningsSeason #KoreanRetailLost6.3TrillionWonOnLeveragedETPs
$AGT is breaking past the 25-day EMA. Once $0.065 falls, expect a strong continuation move."
$AGT
$ADA
#EarningsSeason #KoreanRetailLost6.3TrillionWonOnLeveragedETPs
$AGT
$ADA
#EarningsSeason #KoreanRetailLost6.3TrillionWonOnLeveragedETPs
11
·
--
Bullish
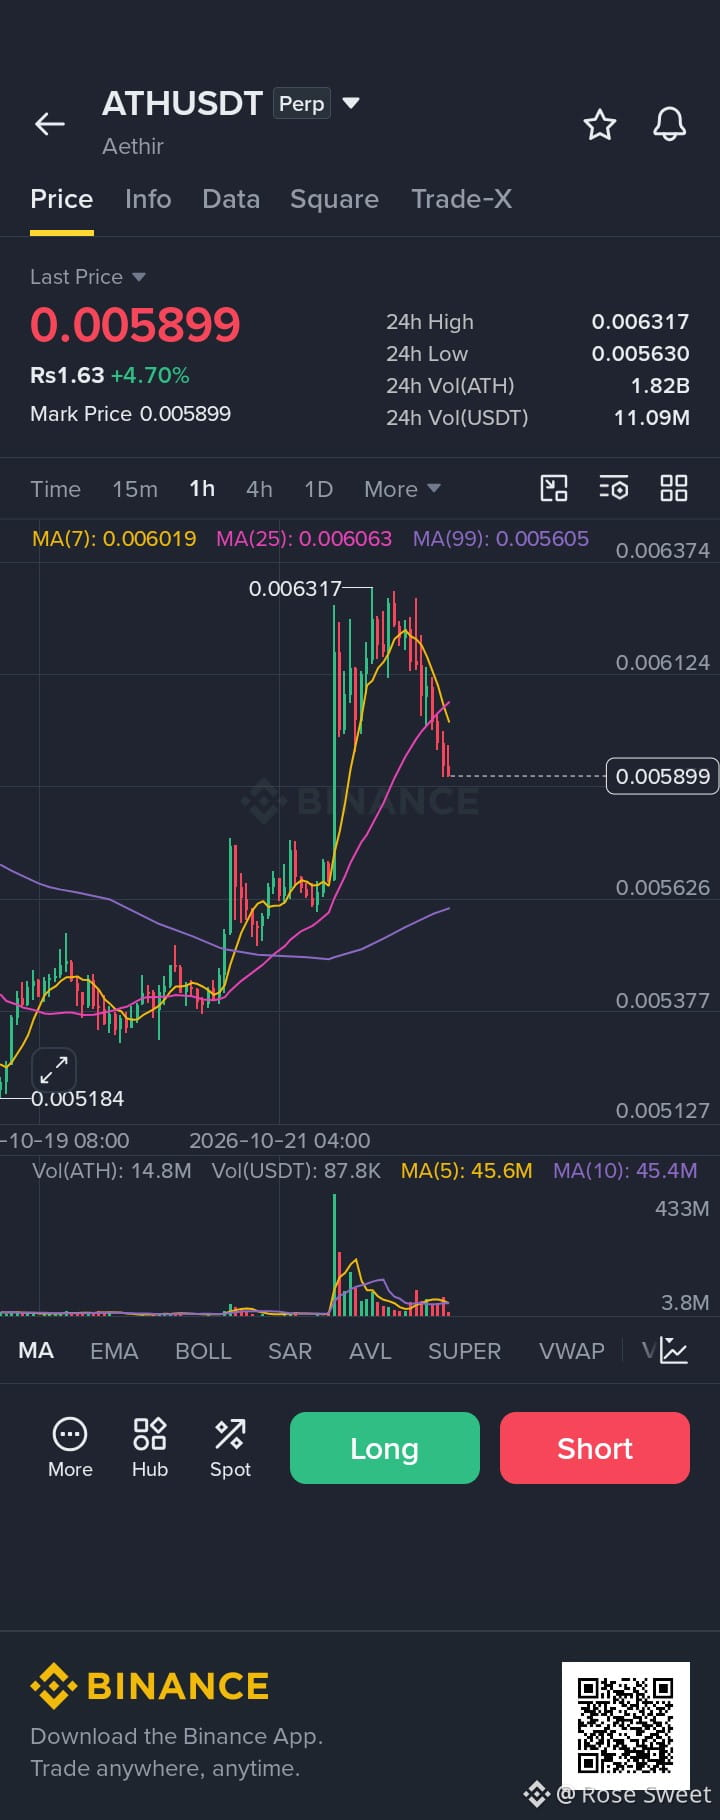
$ATH The chart shows a strong upward surge from a low of 0.005184 up to a peak of 0.006317.
Following the peak, the price has experienced a pullback and is currently consolidating around the 0.005899 mark.
.There was a massive spike in volume accompanying the breakout/rally phase, which has since tapered off as the price retraced from its daily high.
#EarningsSeason
{future}(ATHUSDT)
$ATH The chart shows a strong upward surge from a low of 0.005184 up to a peak of 0.006317.
Following the peak, the price has experienced a pullback and is currently consolidating around the 0.005899 mark.
.There was a massive spike in volume accompanying the breakout/rally phase, which has since tapered off as the price retraced from its daily high.
#EarningsSeason
Following the peak, the price has experienced a pullback and is currently consolidating around the 0.005899 mark.
.There was a massive spike in volume accompanying the breakout/rally phase, which has since tapered off as the price retraced from its daily high.
#EarningsSeason
40
·
--
Bullish
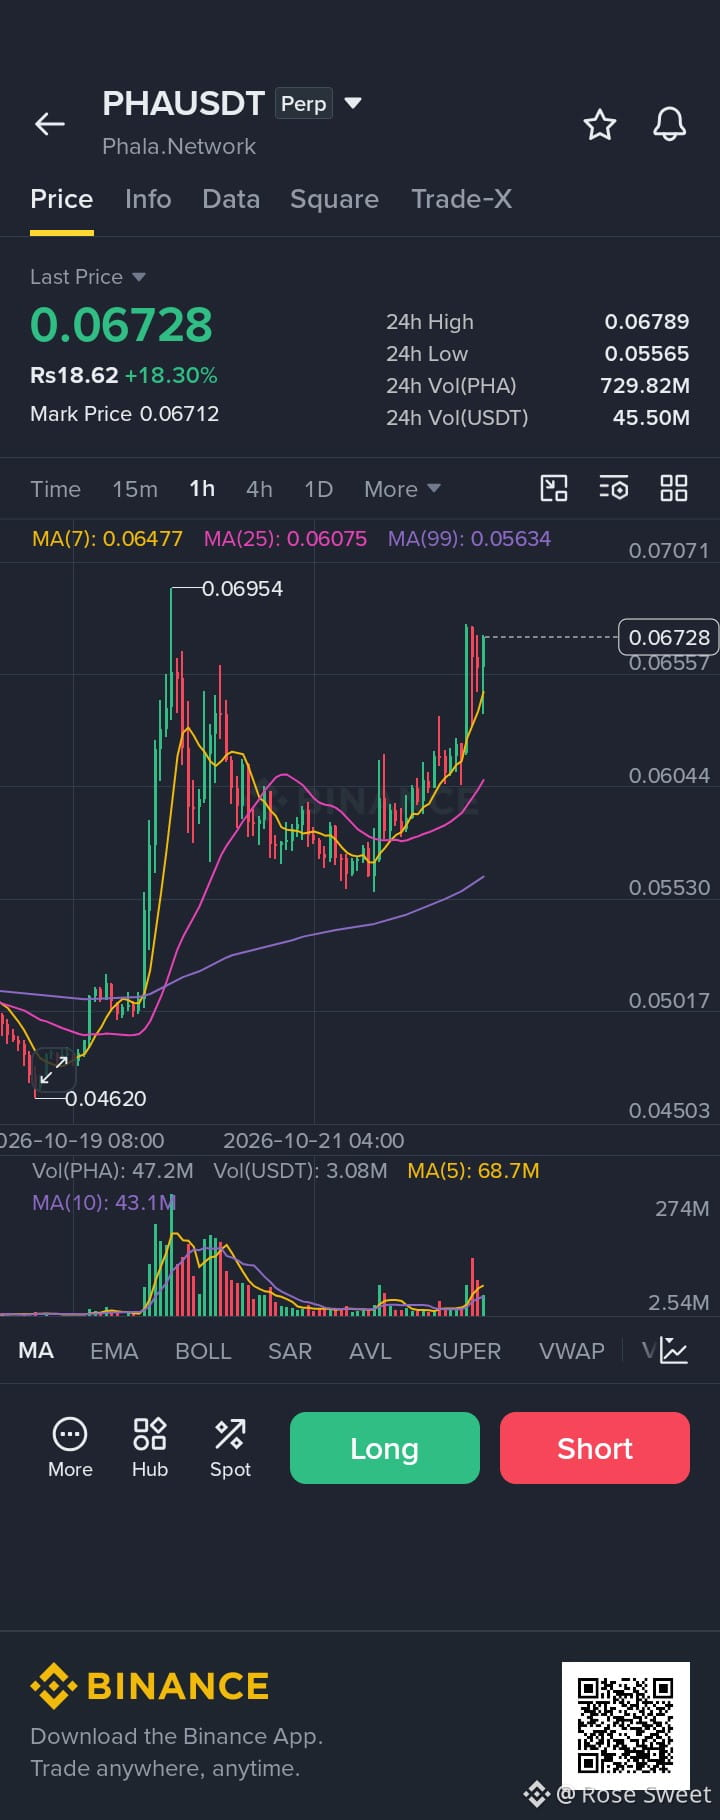
$PHA Bullish Momentum Ahead
PHA is pushing back up toward the $0.0655 resistance level. A successful breakout above this point could drive the price toward $0.0695, provided buying pressure holds strong.
Long Setup: $PHA
Entry Range: $0.0640 – $0.0648
Stop Loss: $0.0600
Target 1: $0.0660
Target 2: $0.0675
Target 3: $0.0695
Target 4: $0.0720
🔗 Trade $PHA here: 👇
#ZcashDevelopersConfirmNovemberDateForNU7Upgrade
{future}(PHAUSDT)
$PHA Bullish Momentum Ahead
PHA is pushing back up toward the $0.0655 resistance level. A successful breakout above this point could drive the price toward $0.0695, provided buying pressure holds strong.
Long Setup: $PHA
Entry Range: $0.0640 – $0.0648
Stop Loss: $0.0600
Target 1: $0.0660
Target 2: $0.0675
Target 3: $0.0695
Target 4: $0.0720
🔗 Trade $PHA here: 👇
#ZcashDevelopersConfirmNovemberDateForNU7Upgrade
33
·
--
Bearish
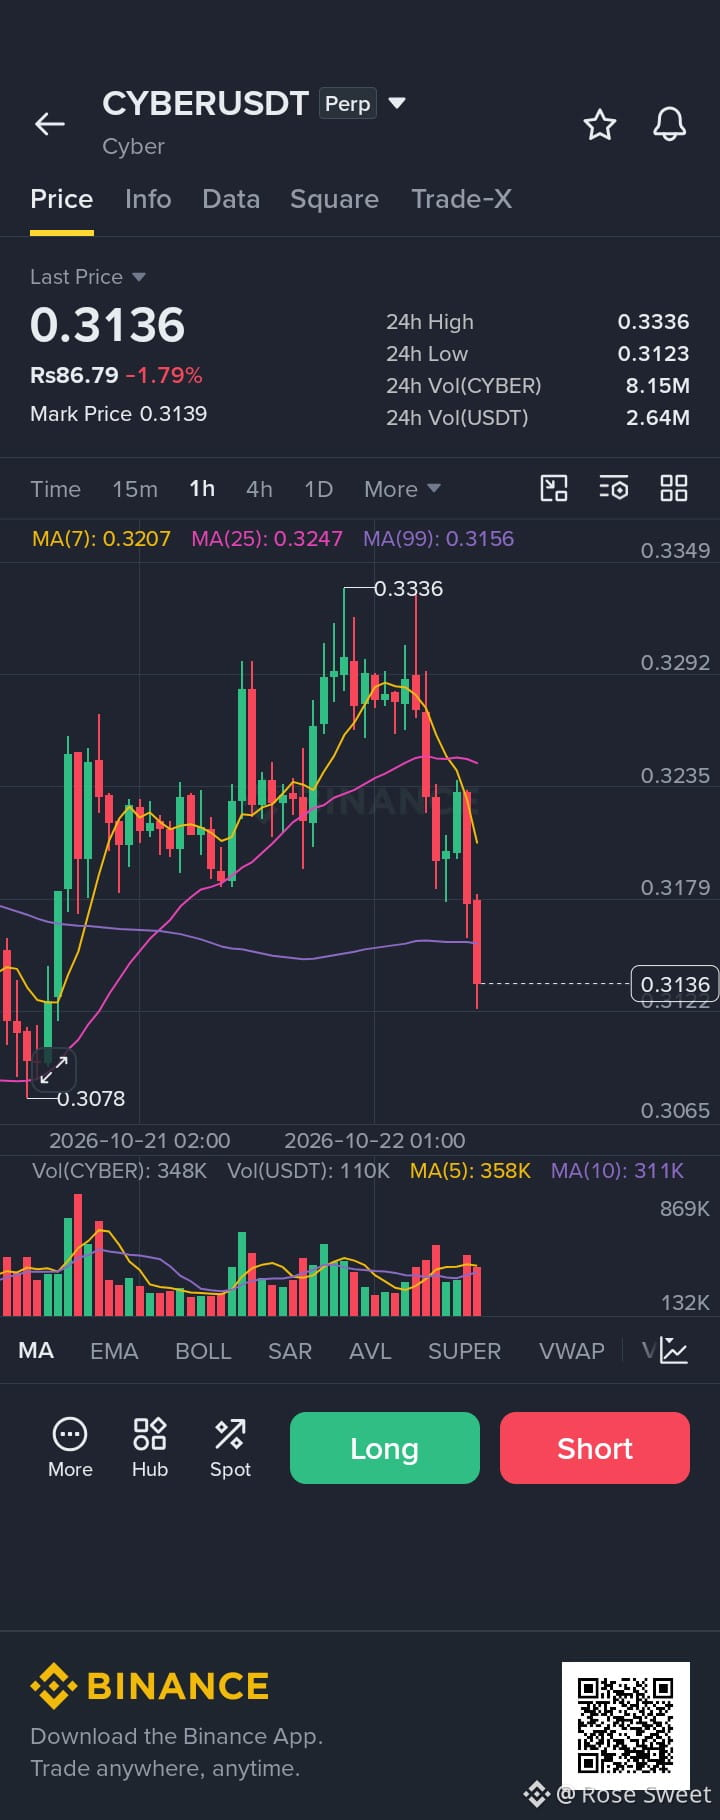
$CYBER Shorts Gaining Traction... Downward Pressure Mounting
Price is hovering near $0.314 following a clear rejection at the $0.330 resistance zone. With selling volume picking up, a clean break below $0.314 is likely to open the door to deeper downside targets.
Entry Range: $0.314 – $0.318
Target 1: $0.310
Target 2: $0.305
Target 3: $0.300
Stop Loss: $0.321
Bias: Short / Sell Target
$CYBER
{future}(CYBERUSDT)
#EarningsSeason
$CYBER Shorts Gaining Traction... Downward Pressure Mounting
Price is hovering near $0.314 following a clear rejection at the $0.330 resistance zone. With selling volume picking up, a clean break below $0.314 is likely to open the door to deeper downside targets.
Entry Range: $0.314 – $0.318
Target 1: $0.310
Target 2: $0.305
Target 3: $0.300
Stop Loss: $0.321
Bias: Short / Sell Target
$CYBER
#EarningsSeason
53
·
--
Bullish
$TAKE :
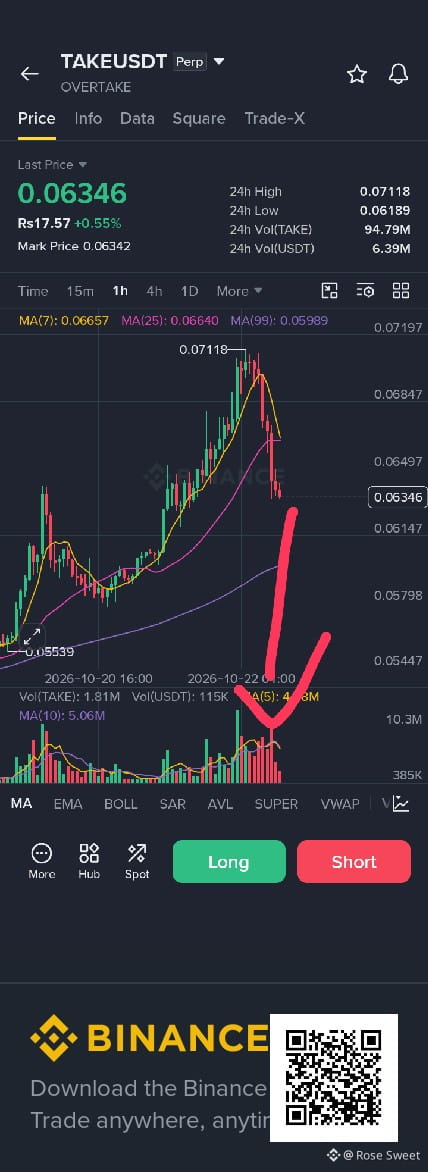
Current Price & Performance: The last traded price is 0.06346 (up +0.55% over the last 24 hours), with a 24-hour high of 0.07118 and a low of 0.06189.
Price Trend (1-Hour Timeframe): The asset recently experienced a strong rally peaking at the 0.07118 resistance level, followed by a sharp pullback/correction.
Moving Averages (MA):
Short-term MAs like MA(7) at 0.06657 and MA(25) at 0.06640 are trending downward and are currently above the price, indicating short-term bearish pressure.
The longer-term MA(99) sits lower at 0.05989.
.
Volume Activity: The red arrow points to a cluster of red volume bars at the bottom, highlighting an increase in selling volume during the recent price decline.
$TAKE
{future}(TAKEUSDT)
#KoreanRetailLost6.3TrillionWonOnLeveragedETPs
$TAKE :
Current Price & Performance: The last traded price is 0.06346 (up +0.55% over the last 24 hours), with a 24-hour high of 0.07118 and a low of 0.06189.
Price Trend (1-Hour Timeframe): The asset recently experienced a strong rally peaking at the 0.07118 resistance level, followed by a sharp pullback/correction.
Moving Averages (MA):
Short-term MAs like MA(7) at 0.06657 and MA(25) at 0.06640 are trending downward and are currently above the price, indicating short-term bearish pressure.
The longer-term MA(99) sits lower at 0.05989.
.
Volume Activity: The red arrow points to a cluster of red volume bars at the bottom, highlighting an increase in selling volume during the recent price decline.
$TAKE
#KoreanRetailLost6.3TrillionWonOnLeveragedETPs
64
·
--
Bearish
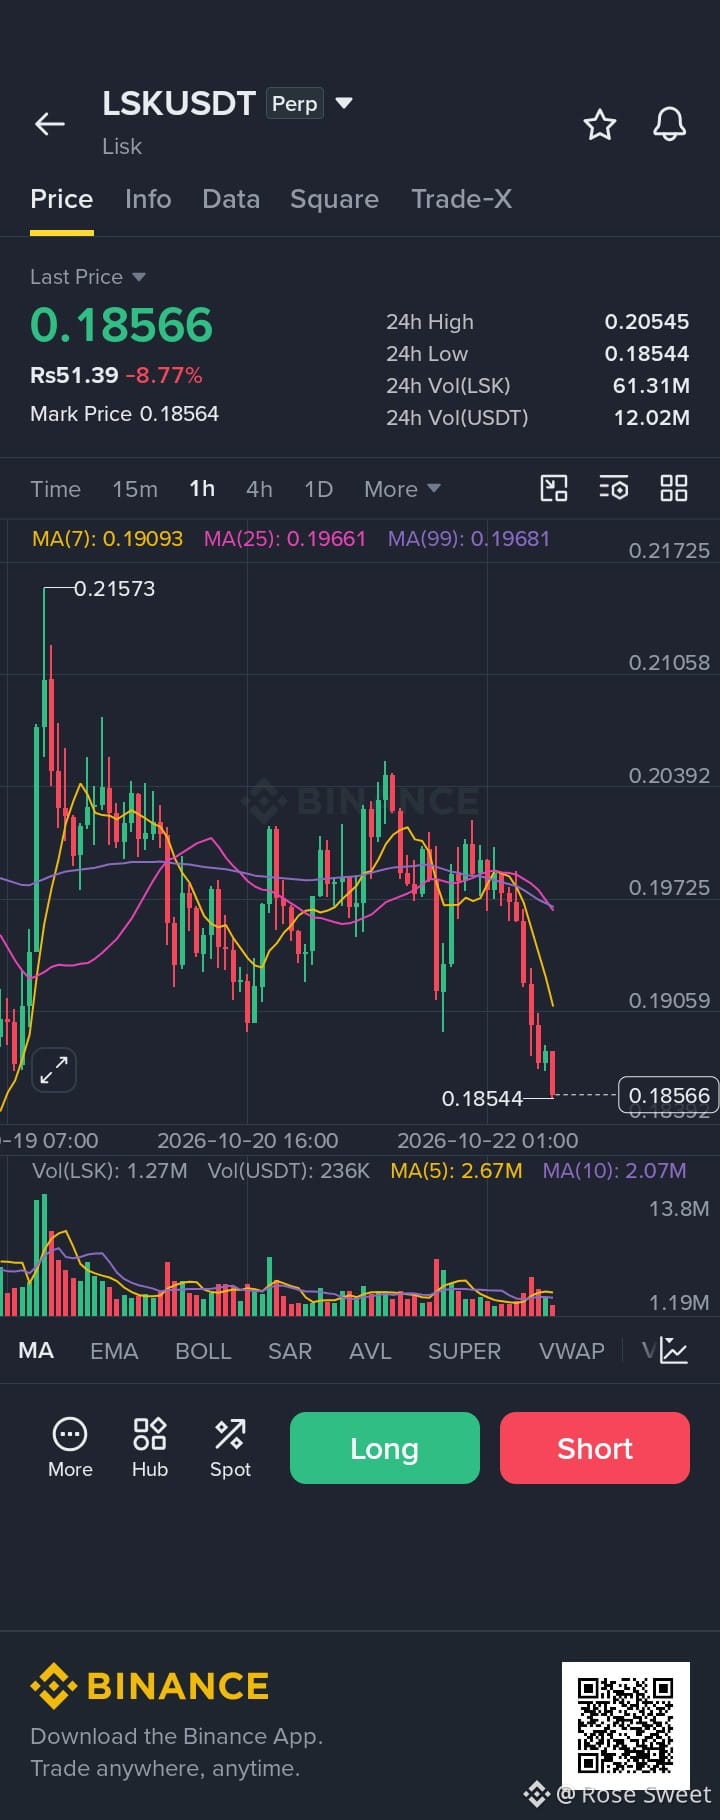
looking at the 1-hour chart for LSKUSDT, price action has rolled over aggressively from the $0.21573 high, breaking down below the key moving averages with increasing momentum.
Trend & Momentum: The 1-hour candles are showing a sharp impulsive drop down to a low of $0.18544, currently hovering around $0.18566 (-8.77%). The MA(7) has crossed sharply below the longer-term MAs, confirming short-term bearish control.
Support & Resistance: Immediate support is being tested right at that $0.18544 low zone. If this gives way, we could see a deeper liquidity sweep. On the flip side, any recovery rally will face heavy overhead resistance around the previous consolidation shelf and moving average convergence near $0.192–$0.196.
$LSK
{future}(LSKUSDT)
$LINK
{future}(LINKUSDT)
#ZcashDevelopersConfirmNovemberDateForNU7Upgrade
looking at the 1-hour chart for LSKUSDT, price action has rolled over aggressively from the $0.21573 high, breaking down below the key moving averages with increasing momentum.
Trend & Momentum: The 1-hour candles are showing a sharp impulsive drop down to a low of $0.18544, currently hovering around $0.18566 (-8.77%). The MA(7) has crossed sharply below the longer-term MAs, confirming short-term bearish control.
Support & Resistance: Immediate support is being tested right at that $0.18544 low zone. If this gives way, we could see a deeper liquidity sweep. On the flip side, any recovery rally will face heavy overhead resistance around the previous consolidation shelf and moving average convergence near $0.192–$0.196.
$LSK
$LINK
#ZcashDevelopersConfirmNovemberDateForNU7Upgrade
85
·
--
Bullish
Found my new obsession. A watch that sparkles almost as much as my weekend plans.
$SOL
{future}(SOLUSDT)
$DOT
{future}(DOTUSDT)
$DOGE
{future}(DOGEUSDT)
#EarningsSeason #NEAROpensVoteToCutAnnualIssuanceTo1.6% #EliceReboundsToDailyLimit
Found my new obsession. A watch that sparkles almost as much as my weekend plans.
$SOL
$DOT
$DOGE
#EarningsSeason #NEAROpensVoteToCutAnnualIssuanceTo1.6% #EliceReboundsToDailyLimit
$SOL
$DOT
$DOGE
#EarningsSeason #NEAROpensVoteToCutAnnualIssuanceTo1.6% #EliceReboundsToDailyLimit

1
52
·
--
Bullish
$ZEC Bearish Reversal Alert! 📉
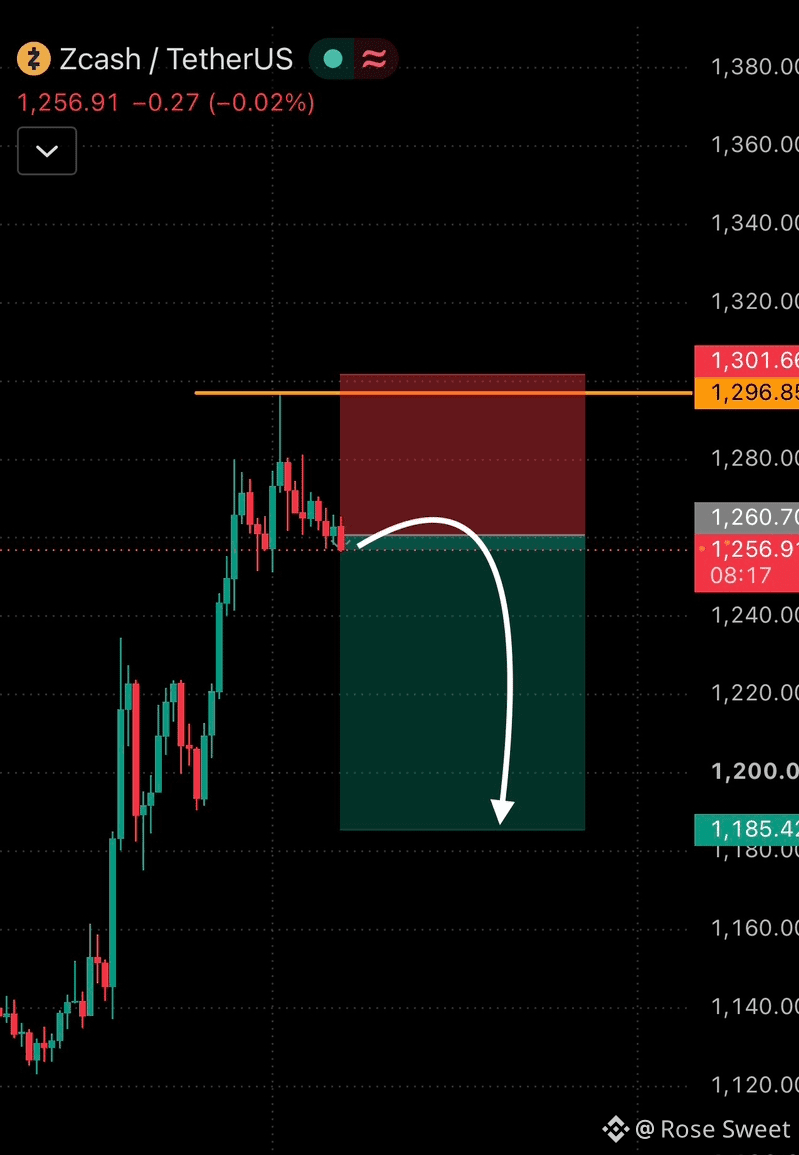
Following a massive rally, $ZEC is showing signs of potential exhaustion. I'm targeting a sharp pullback toward $1,185 and opening a heavy short position to capture the impending sell-off.
Momentum is fading around $1,257 after buyers failed to hold higher levels. A breakdown here could trigger an accelerated drop toward $1,200.
Entry: $1,256 – $1,261
Targets: $1,235 / $1,210 / $1,185
Stop-Loss: $1,301.66
Note: This is a high-risk countertrend setup, so strictly adhering to the stop-loss is essential. A push above $1,296.85 invalidates the bearish bias.
$ZEC
{future}(ZECUSDT)
#ZECUSDT
$ZEC Bearish Reversal Alert! 📉
Following a massive rally, $ZEC is showing signs of potential exhaustion. I'm targeting a sharp pullback toward $1,185 and opening a heavy short position to capture the impending sell-off.
Momentum is fading around $1,257 after buyers failed to hold higher levels. A breakdown here could trigger an accelerated drop toward $1,200.
Entry: $1,256 – $1,261
Targets: $1,235 / $1,210 / $1,185
Stop-Loss: $1,301.66
Note: This is a high-risk countertrend setup, so strictly adhering to the stop-loss is essential. A push above $1,296.85 invalidates the bearish bias.
$ZEC
#ZECUSDT
1
54
·
--
Bullish
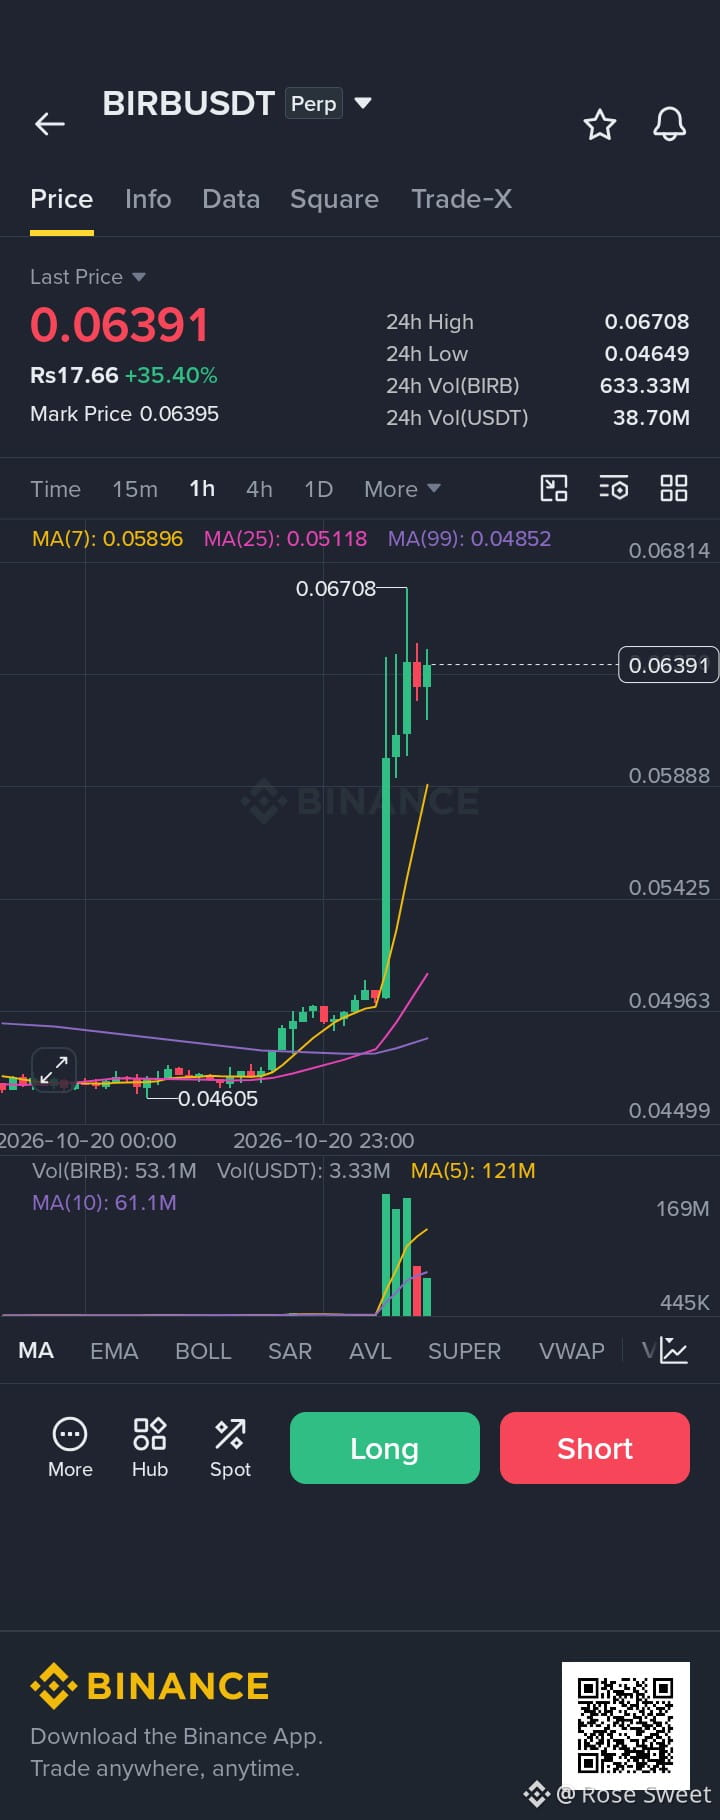
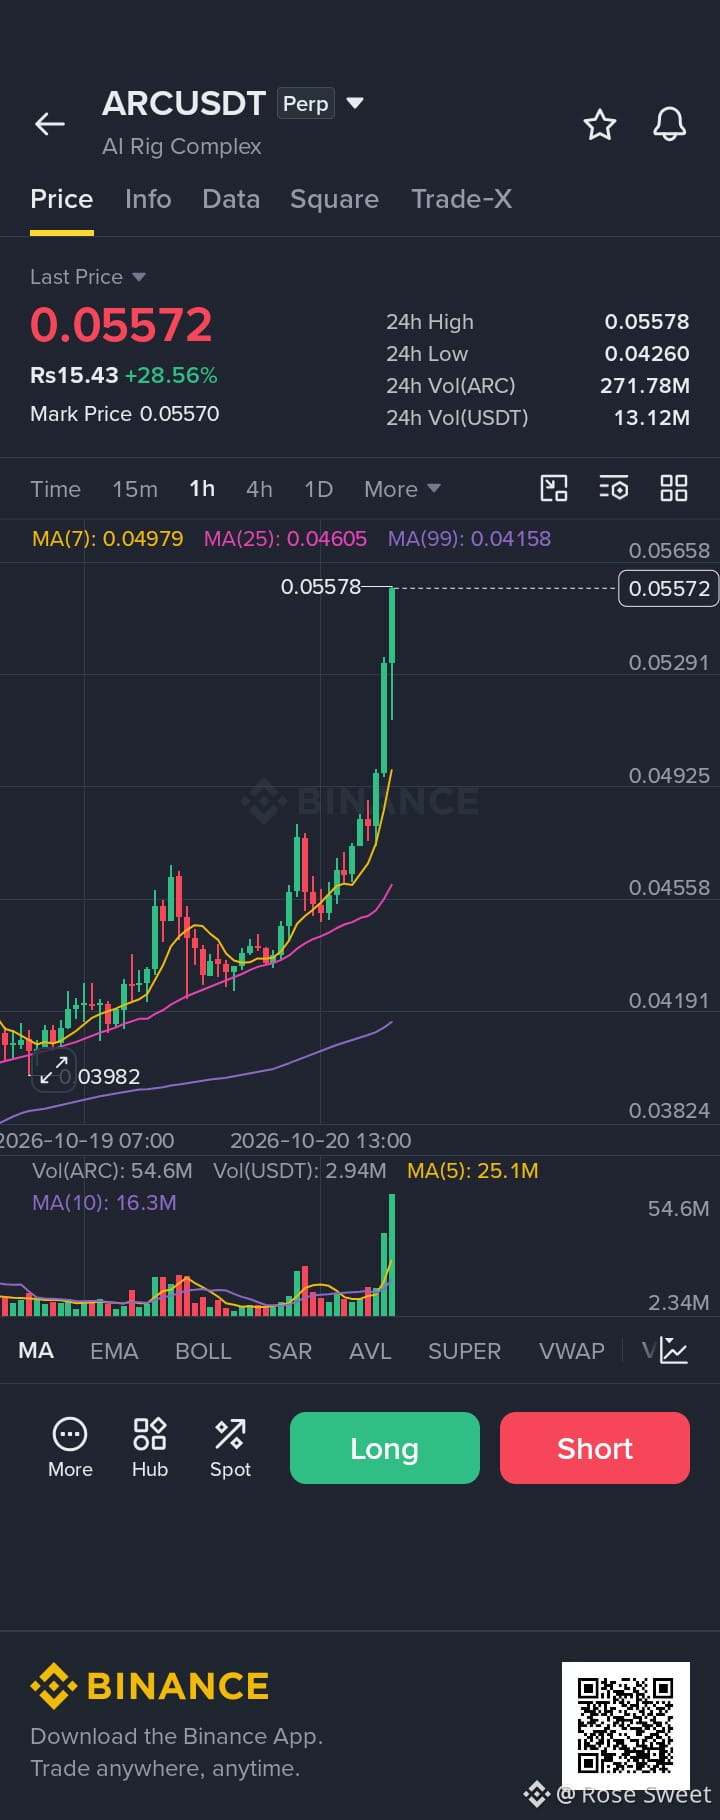
$BIRB 24-Hour Range: The price reached a 24-hour high of 0.06708 and a low of 0.04649.
Trading Volume: Strong market activity, with a 24-hour volume of 633.33M BIRB (or 38.70M USDT).
Trend Analysis: The 1-hour candle chart shows a sharp bullish breakout/spike following a period of consolidation around the 0.04605 mark.
Moving Averages (MA): Short-term moving averages (MA(7): 0.05896, MA(25): 0.05118, and MA(99): 0.04852) are aligned in a bullish stack below the current price, confirming strong upward momentum.
{future}(BIRBUSDT)
#BIRB
$BIRB 24-Hour Range: The price reached a 24-hour high of 0.06708 and a low of 0.04649.
Trading Volume: Strong market activity, with a 24-hour volume of 633.33M BIRB (or 38.70M USDT).
Trend Analysis: The 1-hour candle chart shows a sharp bullish breakout/spike following a period of consolidation around the 0.04605 mark.
Moving Averages (MA): Short-term moving averages (MA(7): 0.05896, MA(25): 0.05118, and MA(99): 0.04852) are aligned in a bullish stack below the current price, confirming strong upward momentum.
#BIRB
1
72
·
--
Bullish
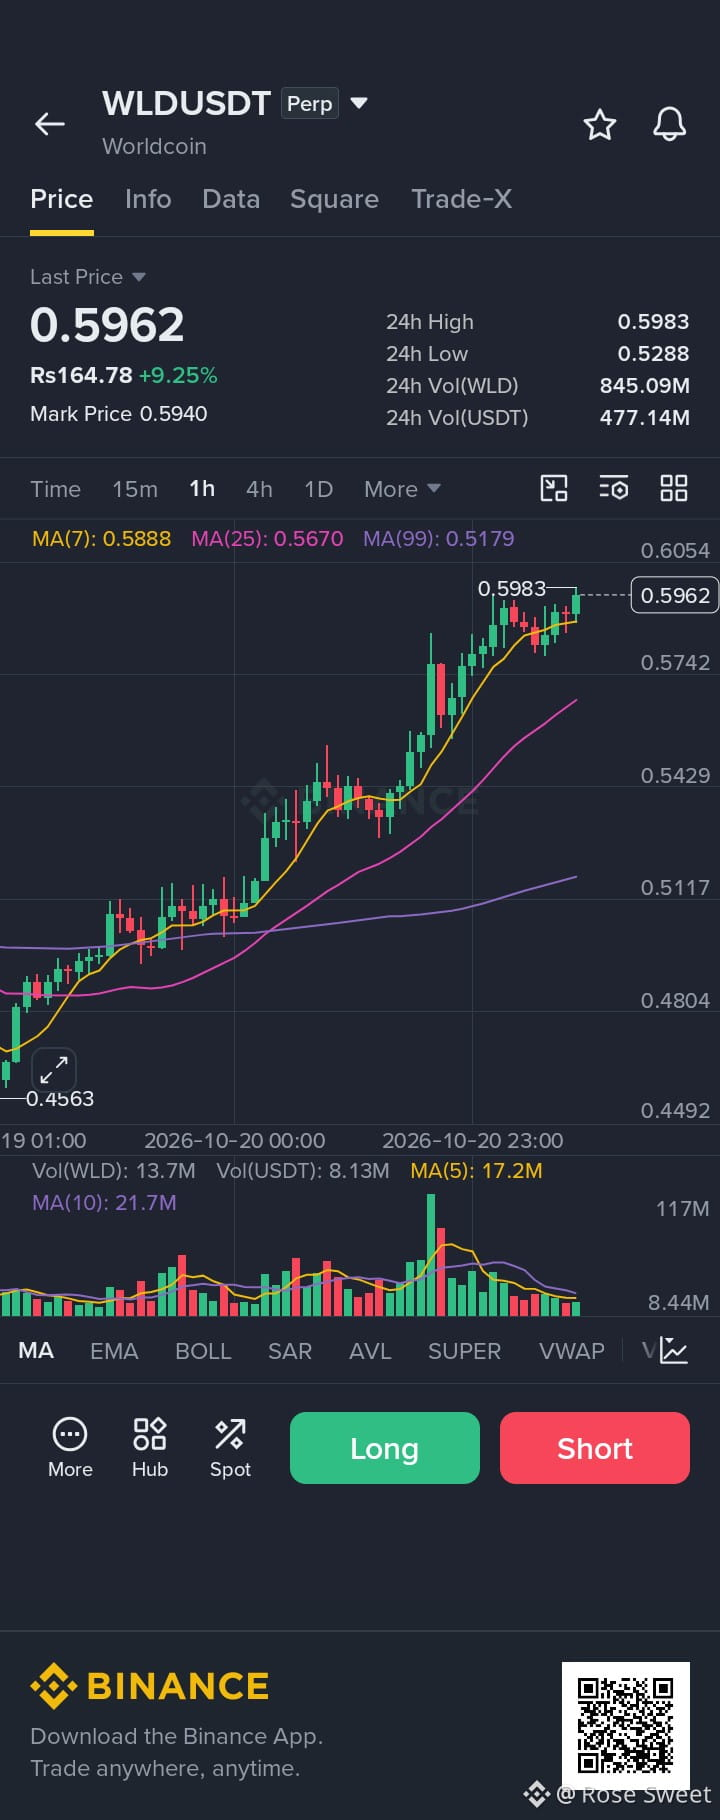
$WLD is approaching a critical resistance level at $0.60. A break above this level is essential for sustained upside momentum, and a bullish breakout looks imminent. Entering a long position here remains favorable ahead of a potential 20%–30% surge.
Long Trade Setup:
Entry Zone: $0.58 – $0.60
Targets (TP): $0.70 | $0.80 | $0.90 | $1.00
Stop Loss (SL): $0.535
$WLD
{future}(WLDUSDT)
#WLD
$WLD is approaching a critical resistance level at $0.60. A break above this level is essential for sustained upside momentum, and a bullish breakout looks imminent. Entering a long position here remains favorable ahead of a potential 20%–30% surge.
Long Trade Setup:
Entry Zone: $0.58 – $0.60
Targets (TP): $0.70 | $0.80 | $0.90 | $1.00
Stop Loss (SL): $0.535
$WLD
#WLD
Long Trade Setup:
Entry Zone: $0.58 – $0.60
Targets (TP): $0.70 | $0.80 | $0.90 | $1.00
Stop Loss (SL): $0.535
$WLD
#WLD
1
85
·
--
Bullish
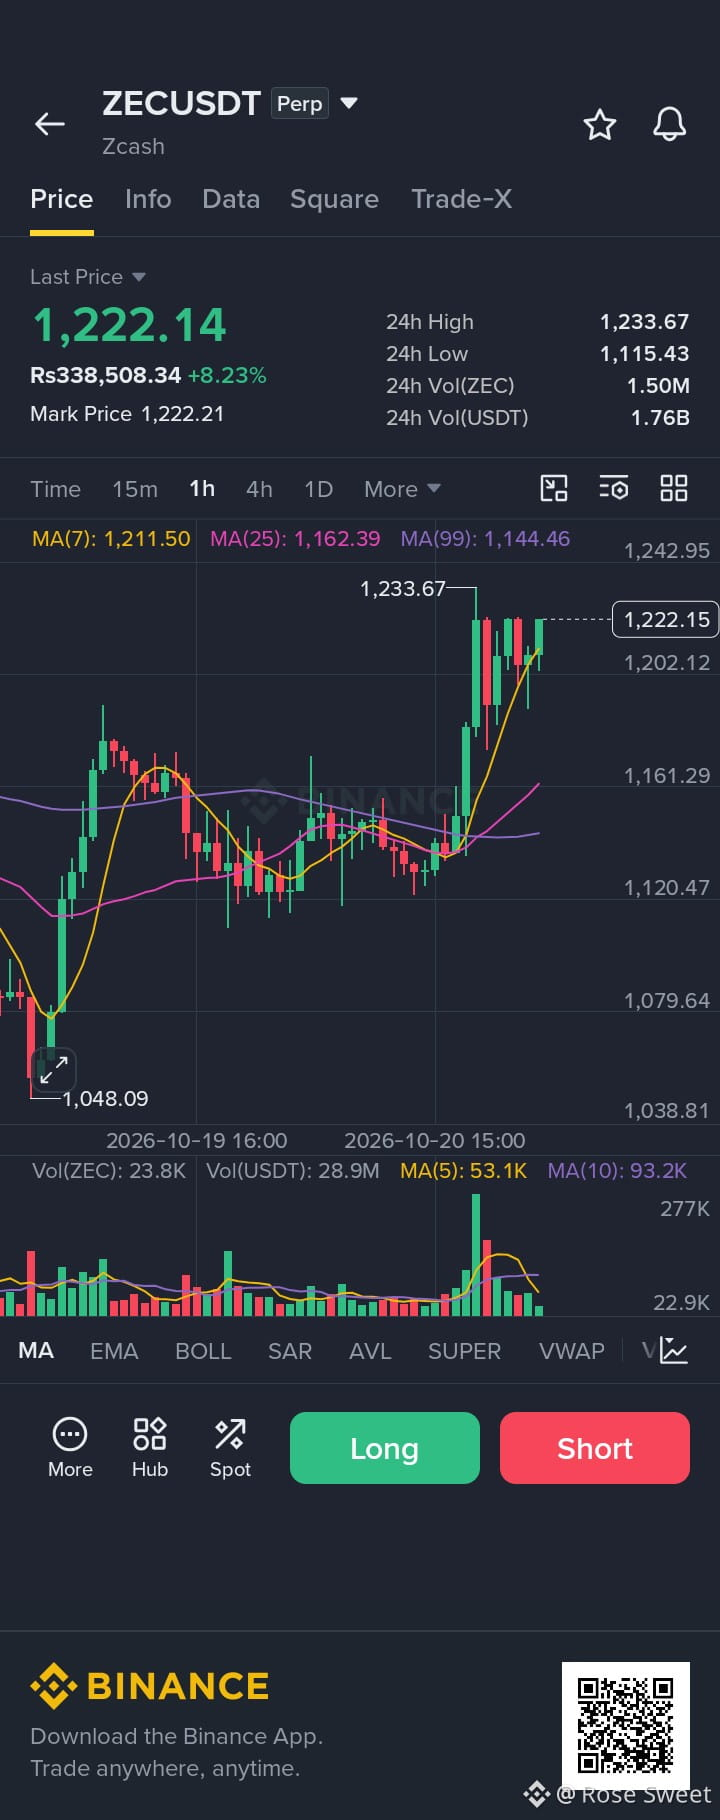
Attention spot traders. We are currently observing a high-probability accumulation phase on the 4-hour chart for ZEC.
Following a significant correction from the $1,600 resistance down to the $1,000 support level, the asset has established a solid base. It has since rebounded strongly, currently trading near $1,219 with an 8% gain on the day, supported by substantial trading volume exceeding $1.70 billion USDT. This price action suggests seller exhaustion and institutional interest around these lower levels.
For spot participants, a tranche-based Dollar-Cost Averaging (DCA) strategy minimizes volatility risk while building a strong medium-to-long-term position.
Execution Plan
First Tranche Entry: $1,200 – $1,220 (Current Market Price)
Secondary Accumulation Zone: $1,100 – $1,150 (Reserved for potential market wicks)
Target 1: $1,400
Target 2: $1,600
Target 3: $1,800
Invalidation Level: A confirmed weekly close below $1,000 invalidates the current bullish structure. (Note: Spot allocations typically utilize structural invalidation rather than tight leverage stop-losses).
As always, manage your risk accordingly and size your positions based on your individual portfolio strategy.
What are your thoughts on ZEC's current market structure and your allocation plan for this setup?
$ZEC
{future}(ZECUSDT)
#ZECUSDT
Attention spot traders. We are currently observing a high-probability accumulation phase on the 4-hour chart for ZEC.
Following a significant correction from the $1,600 resistance down to the $1,000 support level, the asset has established a solid base. It has since rebounded strongly, currently trading near $1,219 with an 8% gain on the day, supported by substantial trading volume exceeding $1.70 billion USDT. This price action suggests seller exhaustion and institutional interest around these lower levels.
For spot participants, a tranche-based Dollar-Cost Averaging (DCA) strategy minimizes volatility risk while building a strong medium-to-long-term position.
Execution Plan
First Tranche Entry: $1,200 – $1,220 (Current Market Price)
Secondary Accumulation Zone: $1,100 – $1,150 (Reserved for potential market wicks)
Target 1: $1,400
Target 2: $1,600
Target 3: $1,800
Invalidation Level: A confirmed weekly close below $1,000 invalidates the current bullish structure. (Note: Spot allocations typically utilize structural invalidation rather than tight leverage stop-losses).
As always, manage your risk accordingly and size your positions based on your individual portfolio strategy.
What are your thoughts on ZEC's current market structure and your allocation plan for this setup?
$ZEC
#ZECUSDT
1
12
·
--
Bullish
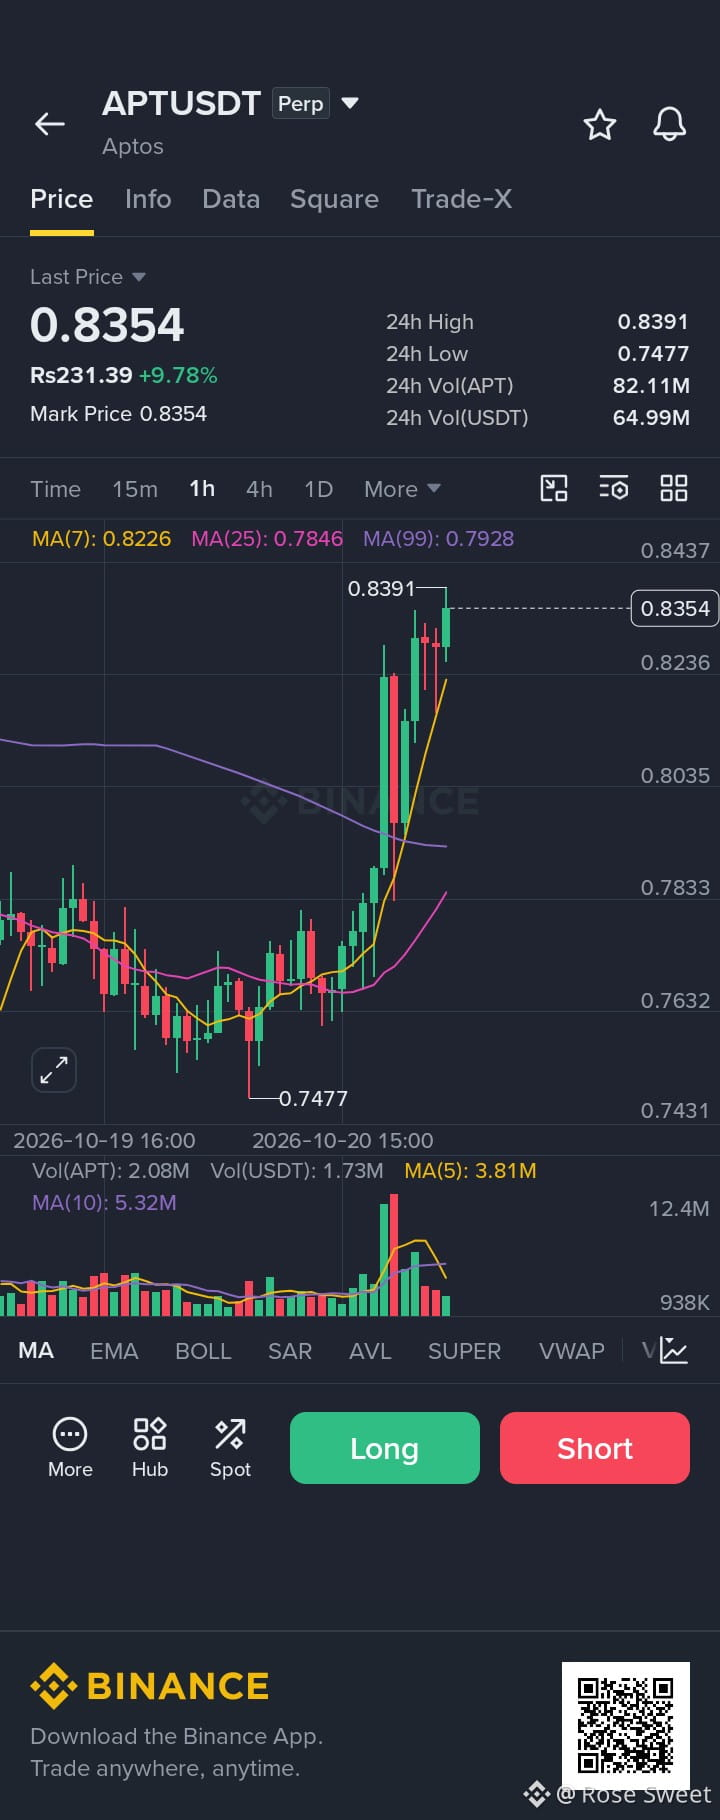
$APT showing strong bullish momentum! 🚀
I’m going LONG as price continues to hold firm above key support. Looking for another potential breakout to the upside!
Entry Zone: $0.8280 – $0.8340
Targets: $0.8420 / $0.8500 / $0.8600
Stop Loss: $0.8160
$APT
{future}(APTUSDT)
$LINK
{future}(LINKUSDT)
#KOSPIFallsMoreThan2%
$APT showing strong bullish momentum! 🚀
I’m going LONG as price continues to hold firm above key support. Looking for another potential breakout to the upside!
Entry Zone: $0.8280 – $0.8340
Targets: $0.8420 / $0.8500 / $0.8600
Stop Loss: $0.8160
$APT
$LINK
#KOSPIFallsMoreThan2%
I’m going LONG as price continues to hold firm above key support. Looking for another potential breakout to the upside!
Entry Zone: $0.8280 – $0.8340
Targets: $0.8420 / $0.8500 / $0.8600
Stop Loss: $0.8160
$APT
$LINK
#KOSPIFallsMoreThan2%
1
9
·
--
Bullish
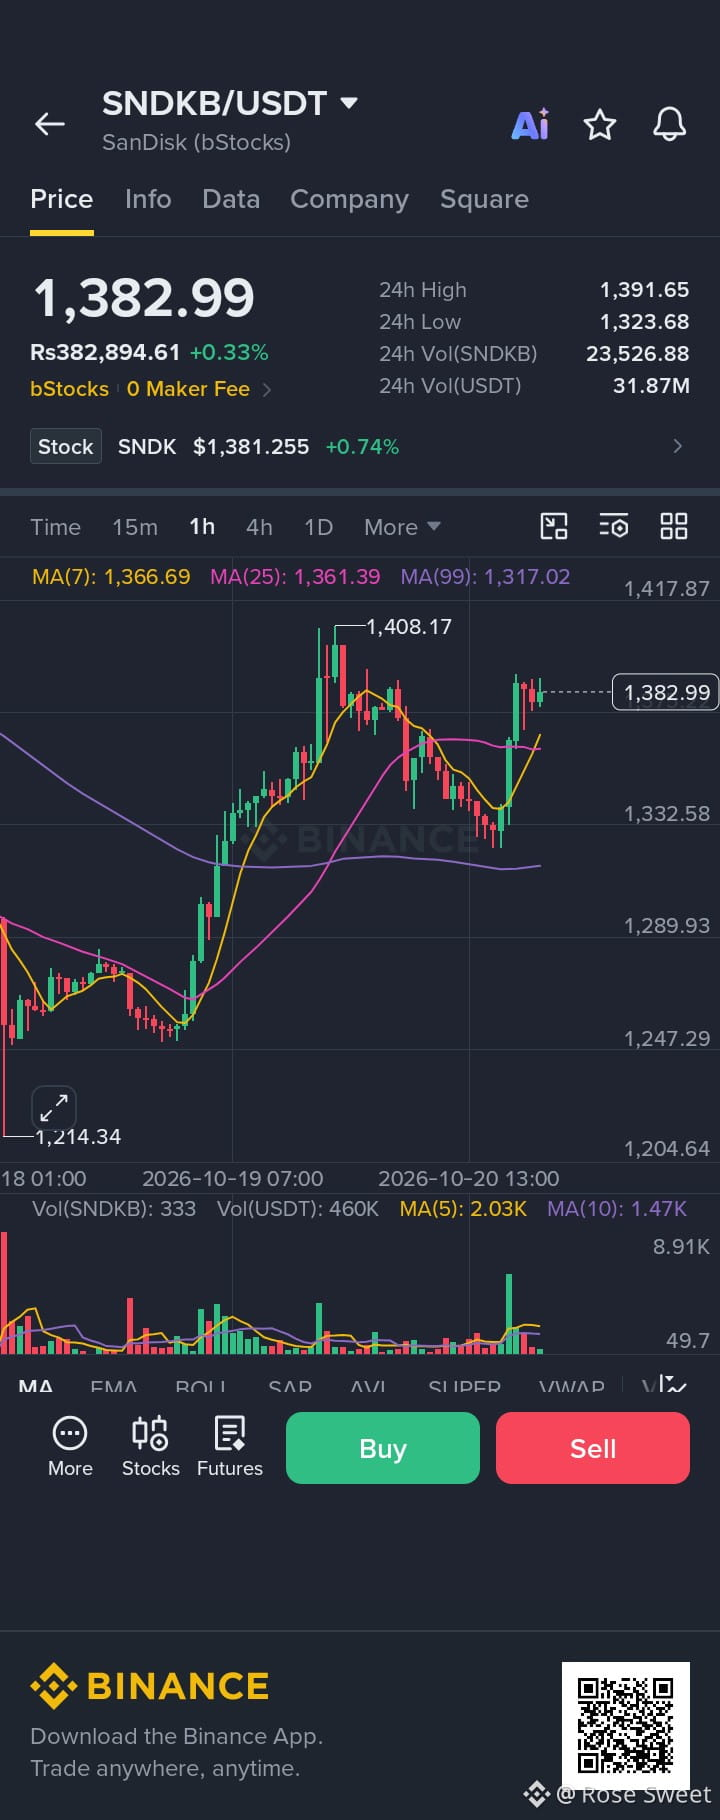
$SNDK Price consolidates at $1382.77 within a defined range, supported by the $1369.40 EMA cluster and capped by the $1401.50 4h supply zone.
1h structure shows bullish alignment with EMA5 crossing EMA10, but momentum faces resistance as RSI approaches overbought territory near 73.
Multi-timeframe tension persists: 5m/1h show recovery attempts, but 4h remains neutral-rangebound until a decisive close above $1401 confirms breakout.
{future}(SNDKUSDT)
$SNDKB
{spot}(SNDKBUSDT)
#SNDK
$SNDK Price consolidates at $1382.77 within a defined range, supported by the $1369.40 EMA cluster and capped by the $1401.50 4h supply zone.
1h structure shows bullish alignment with EMA5 crossing EMA10, but momentum faces resistance as RSI approaches overbought territory near 73.
Multi-timeframe tension persists: 5m/1h show recovery attempts, but 4h remains neutral-rangebound until a decisive close above $1401 confirms breakout.
$SNDKB
#SNDK
1
1
Log in to explore more content
Join global crypto users on Binance Square
⚡️ Get latest and useful information about crypto.
💬 Trusted by the world’s largest crypto exchange.
👍 Discover real insights from verified creators.
Email / Phone number
Trending Topics
EarningsSeason
6.6M views
32,803 Discussing
Earnings Season Session 3: Will Google & Microsoft Beat Earnings Expectations?
Binance Square Official
·184 Likes
·109.3k views
USMidtermElections
75,802 views
963 Discussing
StrategySTRCReaches$99.95ForFirstTimeIn165Days
229 views
14 Discussing