
特拉弗-105278
147 Posts

特拉弗-105278
Report
Block User
9.0K+ Following
2.4K+ Followers
1.4K+ Liked
Posts
All
Quotes
Live
·
--
Bearish
$JCT
{future}(JCTUSDT)
1st TP Target 🎯 ✅
185%+ Profit
$JCT
1st TP Target 🎯 ✅
185%+ Profit
1st TP Target 🎯 ✅
185%+ Profit
特拉弗-105278
·
--
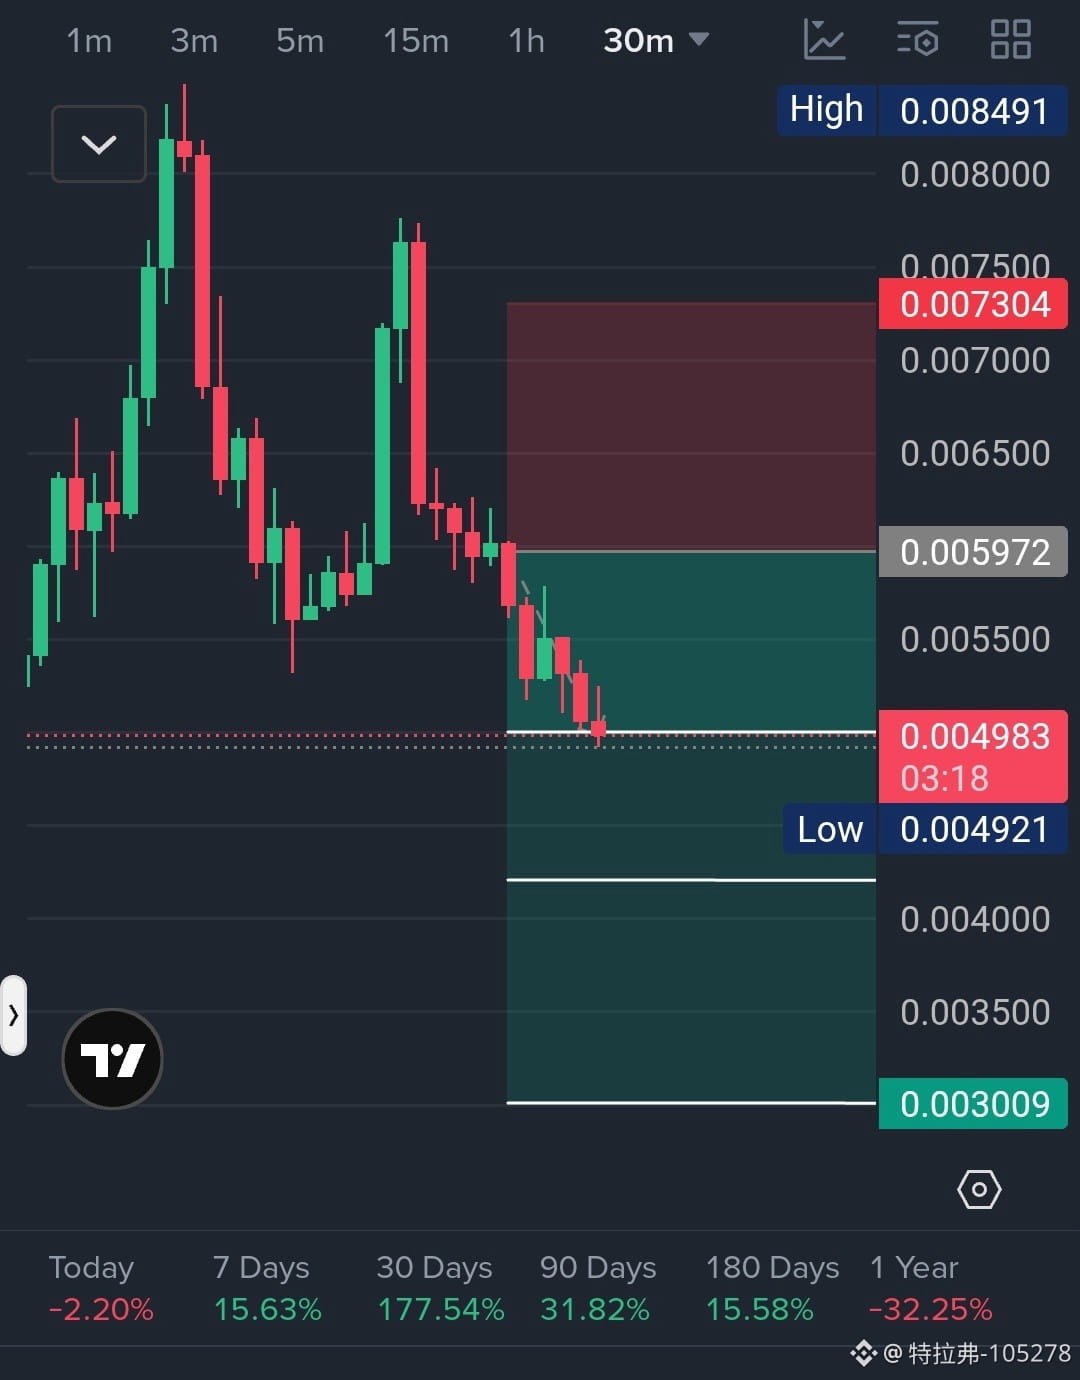
Bearish🔴 JCT/USDT — SHORT Signal,
JCT is showing weakness after another rejection from the $0.0078 area. The 1H chart is making lower highs, while the 4H structure remains under pressure after the huge spike.
SHORT ENTRY: $0.0059 – $0.0061
🎯 TP1: $0.0050
🎯 TP2: $0.0042
🎯 TP3: $0.0030
🛑 STOP LOSS: $0.0073
The bearish structure remains intact, and the current price is below the planned entry zone. The strategy is to look for a move back into $0.0059–$0.0061 for the short entry.
Risk Management:
Use appropriate leverage and position sizing. If price breaks above $0.0073, the setup is invalidated.
$JCT
#HotCPIDecemberHikePriced
JCT is showing weakness after another rejection from the $0.0078 area. The 1H chart is making lower highs, while the 4H structure remains under pressure after the huge spike.
SHORT ENTRY: $0.0059 – $0.0061
🎯 TP1: $0.0050
🎯 TP2: $0.0042
🎯 TP3: $0.0030
🛑 STOP LOSS: $0.0073
The bearish structure remains intact, and the current price is below the planned entry zone. The strategy is to look for a move back into $0.0059–$0.0061 for the short entry.
Risk Management:
Use appropriate leverage and position sizing. If price breaks above $0.0073, the setup is invalidated.
$JCT
#HotCPIDecemberHikePriced
325
·
--
Stablecoin Supply Falls $14.2B in Biggest Contraction Since 2022 Bear Market;
The crypto market is facing a liquidity warning not seen at this scale since the 2022 bear market.
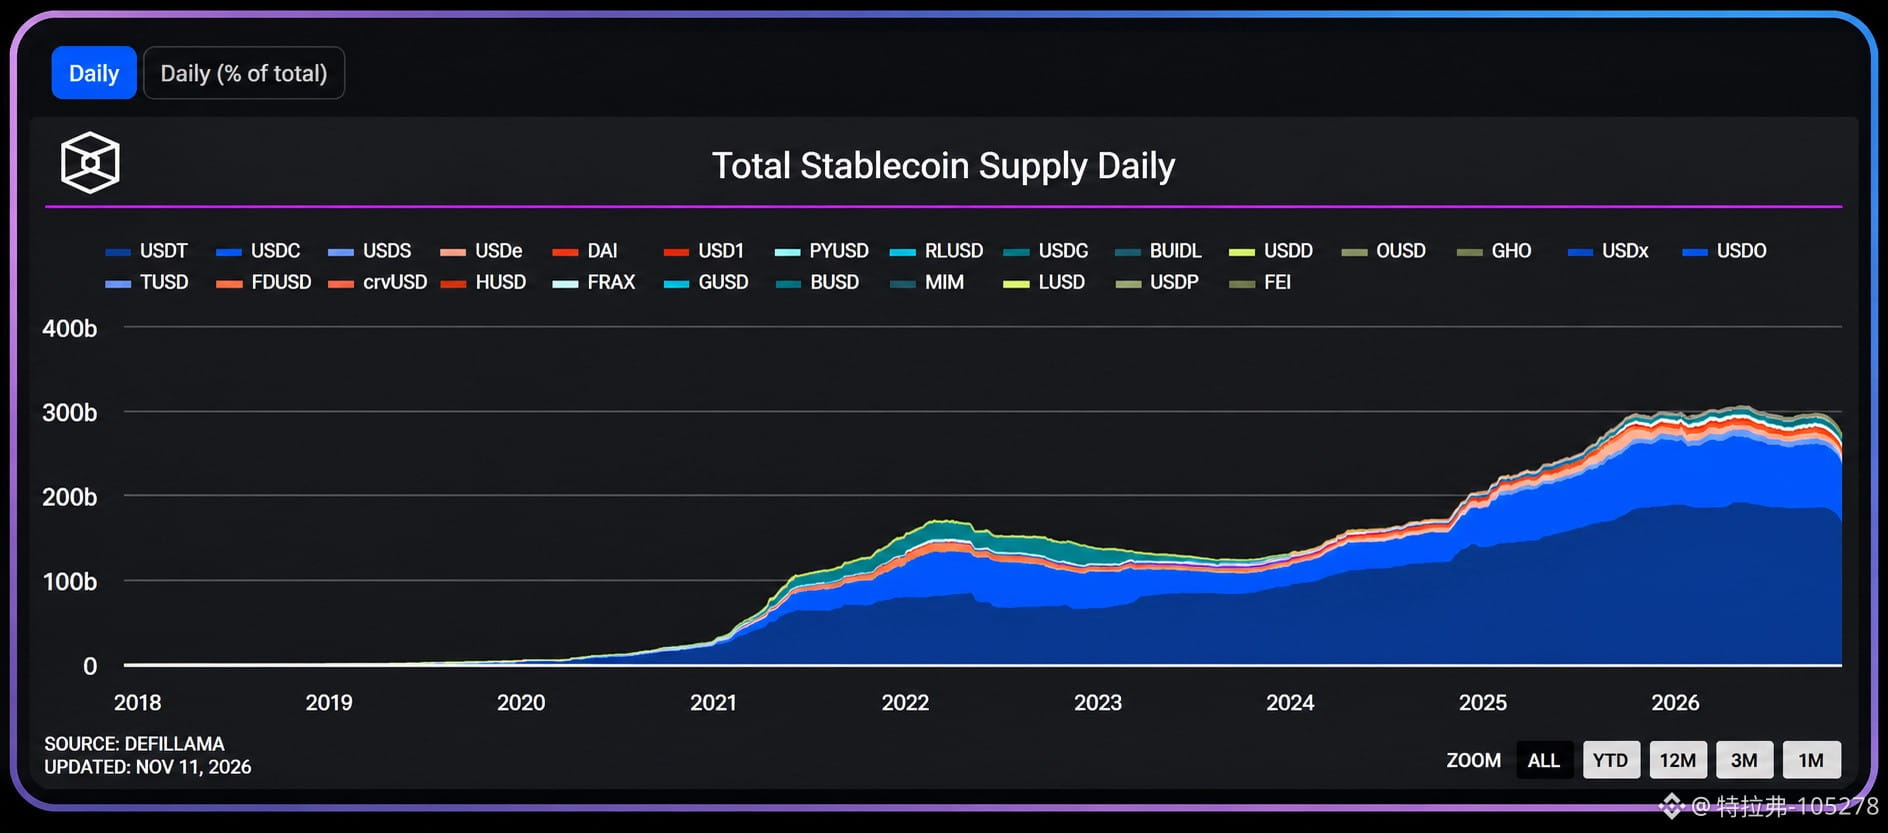
According to Glassnode, major stablecoin supply has fallen by $14.2 billion over the past 30 days, the largest monthly contraction since 2022. Total stablecoin supply has dropped below $280 billion, levels last seen in September 2025.
Stablecoins like USDT and USDC are a major source of liquidity across crypto markets. Traders use them to buy assets, provide liquidity, move capital between exchanges and DeFi, or wait for opportunities.
When stablecoin supply contracts, it can indicate investors are redeeming stablecoins for traditional dollars and moving capital out of crypto.
_________
USDT has lost around $6.6 billion in market capitalization over the past 60 days, according to CryptoQuant — more than twice the comparable decline after the FTX collapse in December 2022.
USDT currently represents roughly 62.8% of the stablecoin market, while USDC accounts for about 25.1%.
The contraction is occurring while the broader crypto recovery remains stalled, making the liquidity trend particularly important.
_____
In June 2022, stablecoin supply fell nearly $30 billion in 30 days, several months before Bitcoin eventually reached its bear-market low near $15,500.
That does not mean history will repeat itself. The current contraction is smaller in percentage terms, and today's stablecoin market is structurally different.
Meanwhile, gold-backed tokens have remained relatively stable, with combined market capitalization around $5.61 billion.
• Crypto liquidity is shrinking.
• Capital is leaving stablecoins faster than new supply is being created.
• 👀 A reversal in stablecoin supply could become an important signal for the next major market move.
This is a metric worth watching alongside Bitcoin price action, ETF flows and overall market liquidity.
$USDT $USDC
#HotCPIDecemberHikePriced
Stablecoin Supply Falls $14.2B in Biggest Contraction Since 2022 Bear Market;
The crypto market is facing a liquidity warning not seen at this scale since the 2022 bear market.
According to Glassnode, major stablecoin supply has fallen by $14.2 billion over the past 30 days, the largest monthly contraction since 2022. Total stablecoin supply has dropped below $280 billion, levels last seen in September 2025.
Stablecoins like USDT and USDC are a major source of liquidity across crypto markets. Traders use them to buy assets, provide liquidity, move capital between exchanges and DeFi, or wait for opportunities.
When stablecoin supply contracts, it can indicate investors are redeeming stablecoins for traditional dollars and moving capital out of crypto.
_________
USDT has lost around $6.6 billion in market capitalization over the past 60 days, according to CryptoQuant — more than twice the comparable decline after the FTX collapse in December 2022.
USDT currently represents roughly 62.8% of the stablecoin market, while USDC accounts for about 25.1%.
The contraction is occurring while the broader crypto recovery remains stalled, making the liquidity trend particularly important.
_____
In June 2022, stablecoin supply fell nearly $30 billion in 30 days, several months before Bitcoin eventually reached its bear-market low near $15,500.
That does not mean history will repeat itself. The current contraction is smaller in percentage terms, and today's stablecoin market is structurally different.
Meanwhile, gold-backed tokens have remained relatively stable, with combined market capitalization around $5.61 billion.
• Crypto liquidity is shrinking.
• Capital is leaving stablecoins faster than new supply is being created.
• 👀 A reversal in stablecoin supply could become an important signal for the next major market move.
This is a metric worth watching alongside Bitcoin price action, ETF flows and overall market liquidity.
$USDT $USDC
#HotCPIDecemberHikePriced
The crypto market is facing a liquidity warning not seen at this scale since the 2022 bear market.
According to Glassnode, major stablecoin supply has fallen by $14.2 billion over the past 30 days, the largest monthly contraction since 2022. Total stablecoin supply has dropped below $280 billion, levels last seen in September 2025.
Stablecoins like USDT and USDC are a major source of liquidity across crypto markets. Traders use them to buy assets, provide liquidity, move capital between exchanges and DeFi, or wait for opportunities.
When stablecoin supply contracts, it can indicate investors are redeeming stablecoins for traditional dollars and moving capital out of crypto.
_________
USDT has lost around $6.6 billion in market capitalization over the past 60 days, according to CryptoQuant — more than twice the comparable decline after the FTX collapse in December 2022.
USDT currently represents roughly 62.8% of the stablecoin market, while USDC accounts for about 25.1%.
The contraction is occurring while the broader crypto recovery remains stalled, making the liquidity trend particularly important.
_____
In June 2022, stablecoin supply fell nearly $30 billion in 30 days, several months before Bitcoin eventually reached its bear-market low near $15,500.
That does not mean history will repeat itself. The current contraction is smaller in percentage terms, and today's stablecoin market is structurally different.
Meanwhile, gold-backed tokens have remained relatively stable, with combined market capitalization around $5.61 billion.
• Crypto liquidity is shrinking.
• Capital is leaving stablecoins faster than new supply is being created.
• 👀 A reversal in stablecoin supply could become an important signal for the next major market move.
This is a metric worth watching alongside Bitcoin price action, ETF flows and overall market liquidity.
$USDT $USDC
#HotCPIDecemberHikePriced
78
·
--
Verified
Wall Street Is Moving Toward 24/7 Trading;
A major step toward merging traditional markets with crypto infrastructure is coming on November 23, 2026.
OKX and Intercontinental Exchange (ICE), the parent company of the NYSE, are launching OKXICE, a joint venture designed to offer 24/7 trading of tokenized U.S. securities.
The platform is expected to launch with 70+ tokenized assets, including shares linked to companies such as Coinbase, Circle and Robinhood, along with 59 Direxion ETFs.
The bigger story isn't just the number of assets.
Traditional stock markets normally operate within fixed trading hours. Tokenization can potentially make financial assets available around the clock, while blockchain infrastructure can provide a different way to issue, transfer and trade those assets.
For crypto investors, this is significant because it shows traditional financial institutions are increasingly exploring blockchain-based markets rather than treating crypto infrastructure as a separate world.
⚠️ One important distinction: this doesn't mean the NYSE itself is simply becoming a 24/7 crypto exchange. OKXICE is a separate joint venture between OKX and ICE.
If tokenized securities continue gaining regulatory approval and adoption, the boundary between crypto markets and traditional finance could become much thinner.
November 23 could be an important date to watch. 👀
$ICE.US
{stock_us}(ICE.US)
#HotCPIDecemberHikePriced
Wall Street Is Moving Toward 24/7 Trading;
A major step toward merging traditional markets with crypto infrastructure is coming on November 23, 2026.
OKX and Intercontinental Exchange (ICE), the parent company of the NYSE, are launching OKXICE, a joint venture designed to offer 24/7 trading of tokenized U.S. securities.
The platform is expected to launch with 70+ tokenized assets, including shares linked to companies such as Coinbase, Circle and Robinhood, along with 59 Direxion ETFs.
The bigger story isn't just the number of assets.
Traditional stock markets normally operate within fixed trading hours. Tokenization can potentially make financial assets available around the clock, while blockchain infrastructure can provide a different way to issue, transfer and trade those assets.
For crypto investors, this is significant because it shows traditional financial institutions are increasingly exploring blockchain-based markets rather than treating crypto infrastructure as a separate world.
⚠️ One important distinction: this doesn't mean the NYSE itself is simply becoming a 24/7 crypto exchange. OKXICE is a separate joint venture between OKX and ICE.
If tokenized securities continue gaining regulatory approval and adoption, the boundary between crypto markets and traditional finance could become much thinner.
November 23 could be an important date to watch. 👀
$ICE.US
#HotCPIDecemberHikePriced
A major step toward merging traditional markets with crypto infrastructure is coming on November 23, 2026.
OKX and Intercontinental Exchange (ICE), the parent company of the NYSE, are launching OKXICE, a joint venture designed to offer 24/7 trading of tokenized U.S. securities.
The platform is expected to launch with 70+ tokenized assets, including shares linked to companies such as Coinbase, Circle and Robinhood, along with 59 Direxion ETFs.
The bigger story isn't just the number of assets.
Traditional stock markets normally operate within fixed trading hours. Tokenization can potentially make financial assets available around the clock, while blockchain infrastructure can provide a different way to issue, transfer and trade those assets.
For crypto investors, this is significant because it shows traditional financial institutions are increasingly exploring blockchain-based markets rather than treating crypto infrastructure as a separate world.
⚠️ One important distinction: this doesn't mean the NYSE itself is simply becoming a 24/7 crypto exchange. OKXICE is a separate joint venture between OKX and ICE.
If tokenized securities continue gaining regulatory approval and adoption, the boundary between crypto markets and traditional finance could become much thinner.
November 23 could be an important date to watch. 👀
$ICE.US
#HotCPIDecemberHikePriced

ICEUS+1.96%
39
·
--
Bullish
🇫🇮 Tesla Gets Another European Green Light — But There’s a Catch
Tesla just moved another step forward in Europe.
Finland’s transport regulator has granted provisional approval for Tesla Assisted Driving (TAD), allowing Tesla to immediately offer the system to customers on Finnish roads.
The system can handle tasks such as steering, acceleration and braking, but drivers are still responsible for the vehicle and must remain alert and ready to intervene.
There’s also an important change behind the approval: Tesla’s European “Full Self-Driving (Supervised)” branding has been changed to “Tesla Assisted Driving.” Regulators also tightened the speed-control settings, including removing the ability to continuously maintain speeds far above the posted limit.
But Finland’s approval is NOT EU-wide approval.
A broader European Union decision is still pending. The next possible vote is expected in December, and Finland has made it clear that its national approval does not automatically mean it will support the technology in the EU-wide vote.
For Tesla, this is still meaningful.
More European markets adopting the technology could help Tesla expand its software-based revenue beyond vehicle sales — but the bigger catalyst would be EU-wide regulatory approval.
Tesla’s European autonomous-driving story is moving forward. The real test comes next. 🚗⚡
$TSLA
{future}(TSLAUSDT)
#CoreWeaveJumps10%On168%RevenueGrowth
🇫🇮 Tesla Gets Another European Green Light — But There’s a Catch
Tesla just moved another step forward in Europe.
Finland’s transport regulator has granted provisional approval for Tesla Assisted Driving (TAD), allowing Tesla to immediately offer the system to customers on Finnish roads.
The system can handle tasks such as steering, acceleration and braking, but drivers are still responsible for the vehicle and must remain alert and ready to intervene.
There’s also an important change behind the approval: Tesla’s European “Full Self-Driving (Supervised)” branding has been changed to “Tesla Assisted Driving.” Regulators also tightened the speed-control settings, including removing the ability to continuously maintain speeds far above the posted limit.
But Finland’s approval is NOT EU-wide approval.
A broader European Union decision is still pending. The next possible vote is expected in December, and Finland has made it clear that its national approval does not automatically mean it will support the technology in the EU-wide vote.
For Tesla, this is still meaningful.
More European markets adopting the technology could help Tesla expand its software-based revenue beyond vehicle sales — but the bigger catalyst would be EU-wide regulatory approval.
Tesla’s European autonomous-driving story is moving forward. The real test comes next. 🚗⚡
$TSLA
#CoreWeaveJumps10%On168%RevenueGrowth
Tesla just moved another step forward in Europe.
Finland’s transport regulator has granted provisional approval for Tesla Assisted Driving (TAD), allowing Tesla to immediately offer the system to customers on Finnish roads.
The system can handle tasks such as steering, acceleration and braking, but drivers are still responsible for the vehicle and must remain alert and ready to intervene.
There’s also an important change behind the approval: Tesla’s European “Full Self-Driving (Supervised)” branding has been changed to “Tesla Assisted Driving.” Regulators also tightened the speed-control settings, including removing the ability to continuously maintain speeds far above the posted limit.
But Finland’s approval is NOT EU-wide approval.
A broader European Union decision is still pending. The next possible vote is expected in December, and Finland has made it clear that its national approval does not automatically mean it will support the technology in the EU-wide vote.
For Tesla, this is still meaningful.
More European markets adopting the technology could help Tesla expand its software-based revenue beyond vehicle sales — but the bigger catalyst would be EU-wide regulatory approval.
Tesla’s European autonomous-driving story is moving forward. The real test comes next. 🚗⚡
$TSLA
#CoreWeaveJumps10%On168%RevenueGrowth

1
110
·
--
🇷🇺 Russia Opens the Door to Bitcoin — Despite U.S. Sanctions;
Russia is moving toward regulated cryptocurrency trading — a major shift from its earlier stance on crypto exchanges.
Starting November 22, Russian exchanges can begin offering cryptocurrency trading, provided their trading rules receive approval from the Bank of Russia. Exchanges will also have to register participants, keep detailed records of orders and transactions, calculate pricing indicators, and report activity to the central bank.
For ordinary investors, the Bank of Russia has approved just three assets for public trading:
₿ Bitcoin (BTC)
◆ Ethereum (ETH)
💵 Tether (USDT)
The approved list takes effect November 17. Retail investors must pass a test and can purchase up to ₽300,000 per year through a single intermediary — roughly $3,600–$3,700 at current exchange rates. Qualified investors face no equivalent purchase cap.
Russia’s largest exchange, Moscow Exchange, plans to launch its organized crypto market on December 1.
The initial lineup is expected to include BTC, ETH and USDT, with trading using existing exchange infrastructure and clearing handled through the National Clearing Centre (NCC).
⚠️ The Sanctions Twist
There is a major geopolitical complication:
Moscow Exchange and the National Clearing Centre are both under U.S. sanctions.
That raises questions about international participation, liquidity, trading costs and — particularly — how USDT’s sanctions-related wallet-freezing policies could interact with assets held through the sanctioned clearing infrastructure.
Some analysts also question whether the new market will attract enough demand and whether retail traders could face wide spreads.
__________________
This doesn't automatically mean Russia will create massive new demand for Bitcoin.
But it is significant because a major economy is moving toward regulated domestic access to BTC and other cryptocurrencies, while simultaneously trying to build its own infrastructure around a market affected by international sanctions.
$BTC
{future}(BTCUSDT)
🇷🇺 Russia Opens the Door to Bitcoin — Despite U.S. Sanctions;
Russia is moving toward regulated cryptocurrency trading — a major shift from its earlier stance on crypto exchanges.
Starting November 22, Russian exchanges can begin offering cryptocurrency trading, provided their trading rules receive approval from the Bank of Russia. Exchanges will also have to register participants, keep detailed records of orders and transactions, calculate pricing indicators, and report activity to the central bank.
For ordinary investors, the Bank of Russia has approved just three assets for public trading:
₿ Bitcoin (BTC)
◆ Ethereum (ETH)
💵 Tether (USDT)
The approved list takes effect November 17. Retail investors must pass a test and can purchase up to ₽300,000 per year through a single intermediary — roughly $3,600–$3,700 at current exchange rates. Qualified investors face no equivalent purchase cap.
Russia’s largest exchange, Moscow Exchange, plans to launch its organized crypto market on December 1.
The initial lineup is expected to include BTC, ETH and USDT, with trading using existing exchange infrastructure and clearing handled through the National Clearing Centre (NCC).
⚠️ The Sanctions Twist
There is a major geopolitical complication:
Moscow Exchange and the National Clearing Centre are both under U.S. sanctions.
That raises questions about international participation, liquidity, trading costs and — particularly — how USDT’s sanctions-related wallet-freezing policies could interact with assets held through the sanctioned clearing infrastructure.
Some analysts also question whether the new market will attract enough demand and whether retail traders could face wide spreads.
__________________
This doesn't automatically mean Russia will create massive new demand for Bitcoin.
But it is significant because a major economy is moving toward regulated domestic access to BTC and other cryptocurrencies, while simultaneously trying to build its own infrastructure around a market affected by international sanctions.
$BTC
Russia is moving toward regulated cryptocurrency trading — a major shift from its earlier stance on crypto exchanges.
Starting November 22, Russian exchanges can begin offering cryptocurrency trading, provided their trading rules receive approval from the Bank of Russia. Exchanges will also have to register participants, keep detailed records of orders and transactions, calculate pricing indicators, and report activity to the central bank.
For ordinary investors, the Bank of Russia has approved just three assets for public trading:
₿ Bitcoin (BTC)
◆ Ethereum (ETH)
💵 Tether (USDT)
The approved list takes effect November 17. Retail investors must pass a test and can purchase up to ₽300,000 per year through a single intermediary — roughly $3,600–$3,700 at current exchange rates. Qualified investors face no equivalent purchase cap.
Russia’s largest exchange, Moscow Exchange, plans to launch its organized crypto market on December 1.
The initial lineup is expected to include BTC, ETH and USDT, with trading using existing exchange infrastructure and clearing handled through the National Clearing Centre (NCC).
⚠️ The Sanctions Twist
There is a major geopolitical complication:
Moscow Exchange and the National Clearing Centre are both under U.S. sanctions.
That raises questions about international participation, liquidity, trading costs and — particularly — how USDT’s sanctions-related wallet-freezing policies could interact with assets held through the sanctioned clearing infrastructure.
Some analysts also question whether the new market will attract enough demand and whether retail traders could face wide spreads.
__________________
This doesn't automatically mean Russia will create massive new demand for Bitcoin.
But it is significant because a major economy is moving toward regulated domestic access to BTC and other cryptocurrencies, while simultaneously trying to build its own infrastructure around a market affected by international sanctions.
$BTC

201
·
--
Bullish
OPG just went vertical 🚀
Looking at the bigger picture, this move didn’t really come out of nowhere.
For weeks, OPG was building a base around the $0.09–$0.13 area. The daily chart gradually started forming higher lows, while price kept testing the upper part of that range.
Then the breakout came.
Once OPG pushed through the $0.13–$0.14 zone, momentum picked up fast. The 1H chart shows the acceleration clearly — from roughly $0.13 to above $0.16 in a relatively short period.
That’s why the move suddenly looks so explosive:
➡️ Long consolidation
➡️ Resistance finally breaks
➡️ Momentum traders jump in
➡️ Price accelerates as nearby resistance gets cleared
OPG is now testing the $0.16 area, with the 24H high around $0.1620 on the chart.
The interesting part is whether bulls can actually hold above the breakout zone. A rejection could send price back toward the $0.14–$0.13 area, while a clean continuation could open the way toward higher resistance.
So far, the chart is saying breakout + momentum, but after a move this fast, volatility can get crazy.
Watching OPG closely_👀
$OPG
{future}(OPGUSDT)
#HotCPIDecemberHikePriced
OPG just went vertical 🚀
Looking at the bigger picture, this move didn’t really come out of nowhere.
For weeks, OPG was building a base around the $0.09–$0.13 area. The daily chart gradually started forming higher lows, while price kept testing the upper part of that range.
Then the breakout came.
Once OPG pushed through the $0.13–$0.14 zone, momentum picked up fast. The 1H chart shows the acceleration clearly — from roughly $0.13 to above $0.16 in a relatively short period.
That’s why the move suddenly looks so explosive:
➡️ Long consolidation
➡️ Resistance finally breaks
➡️ Momentum traders jump in
➡️ Price accelerates as nearby resistance gets cleared
OPG is now testing the $0.16 area, with the 24H high around $0.1620 on the chart.
The interesting part is whether bulls can actually hold above the breakout zone. A rejection could send price back toward the $0.14–$0.13 area, while a clean continuation could open the way toward higher resistance.
So far, the chart is saying breakout + momentum, but after a move this fast, volatility can get crazy.
Watching OPG closely_👀
$OPG
#HotCPIDecemberHikePriced
Looking at the bigger picture, this move didn’t really come out of nowhere.
For weeks, OPG was building a base around the $0.09–$0.13 area. The daily chart gradually started forming higher lows, while price kept testing the upper part of that range.
Then the breakout came.
Once OPG pushed through the $0.13–$0.14 zone, momentum picked up fast. The 1H chart shows the acceleration clearly — from roughly $0.13 to above $0.16 in a relatively short period.
That’s why the move suddenly looks so explosive:
➡️ Long consolidation
➡️ Resistance finally breaks
➡️ Momentum traders jump in
➡️ Price accelerates as nearby resistance gets cleared
OPG is now testing the $0.16 area, with the 24H high around $0.1620 on the chart.
The interesting part is whether bulls can actually hold above the breakout zone. A rejection could send price back toward the $0.14–$0.13 area, while a clean continuation could open the way toward higher resistance.
So far, the chart is saying breakout + momentum, but after a move this fast, volatility can get crazy.
Watching OPG closely_👀
$OPG
#HotCPIDecemberHikePriced

197
·
--
Bearish
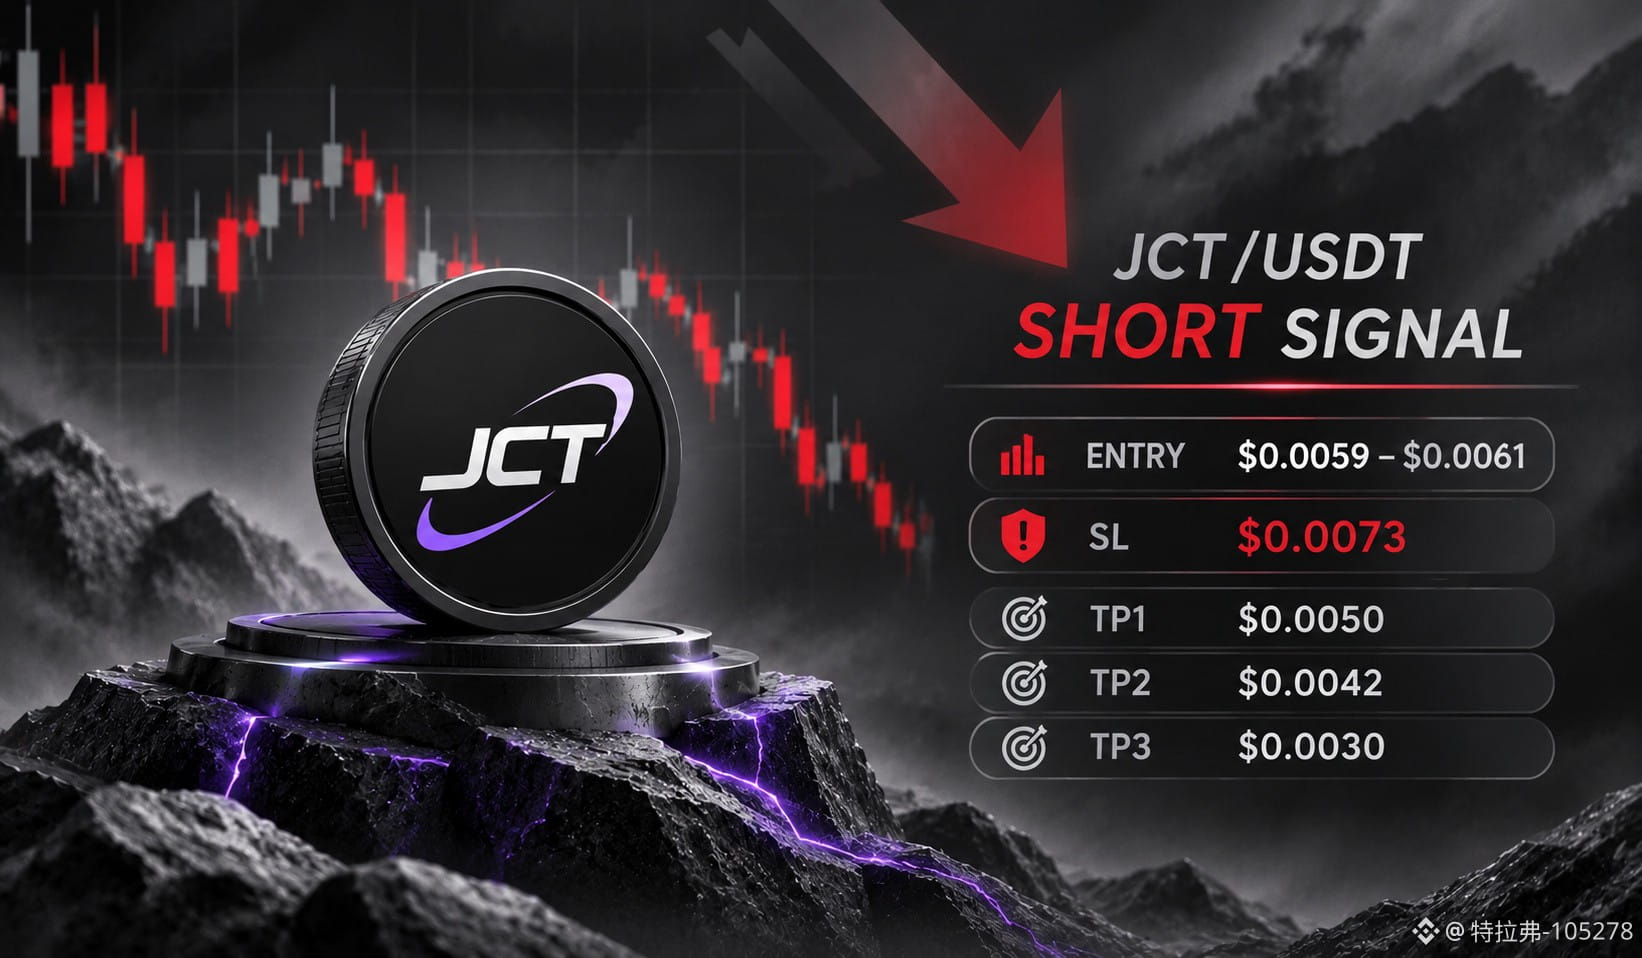
🔴 JCT/USDT — SHORT Signal,
JCT is showing weakness after another rejection from the $0.0078 area. The 1H chart is making lower highs, while the 4H structure remains under pressure after the huge spike.
SHORT ENTRY: $0.0059 – $0.0061
🎯 TP1: $0.0050
🎯 TP2: $0.0042
🎯 TP3: $0.0030
🛑 STOP LOSS: $0.0073
The bearish structure remains intact, and the current price is below the planned entry zone. The strategy is to look for a move back into $0.0059–$0.0061 for the short entry.
Risk Management:
Use appropriate leverage and position sizing. If price breaks above $0.0073, the setup is invalidated.
$JCT
{future}(JCTUSDT)
#HotCPIDecemberHikePriced
🔴 JCT/USDT — SHORT Signal,
JCT is showing weakness after another rejection from the $0.0078 area. The 1H chart is making lower highs, while the 4H structure remains under pressure after the huge spike.
SHORT ENTRY: $0.0059 – $0.0061
🎯 TP1: $0.0050
🎯 TP2: $0.0042
🎯 TP3: $0.0030
🛑 STOP LOSS: $0.0073
The bearish structure remains intact, and the current price is below the planned entry zone. The strategy is to look for a move back into $0.0059–$0.0061 for the short entry.
Risk Management:
Use appropriate leverage and position sizing. If price breaks above $0.0073, the setup is invalidated.
$JCT
#HotCPIDecemberHikePriced
JCT is showing weakness after another rejection from the $0.0078 area. The 1H chart is making lower highs, while the 4H structure remains under pressure after the huge spike.
SHORT ENTRY: $0.0059 – $0.0061
🎯 TP1: $0.0050
🎯 TP2: $0.0042
🎯 TP3: $0.0030
🛑 STOP LOSS: $0.0073
The bearish structure remains intact, and the current price is below the planned entry zone. The strategy is to look for a move back into $0.0059–$0.0061 for the short entry.
Risk Management:
Use appropriate leverage and position sizing. If price breaks above $0.0073, the setup is invalidated.
$JCT
#HotCPIDecemberHikePriced
1
518
·
--
Article
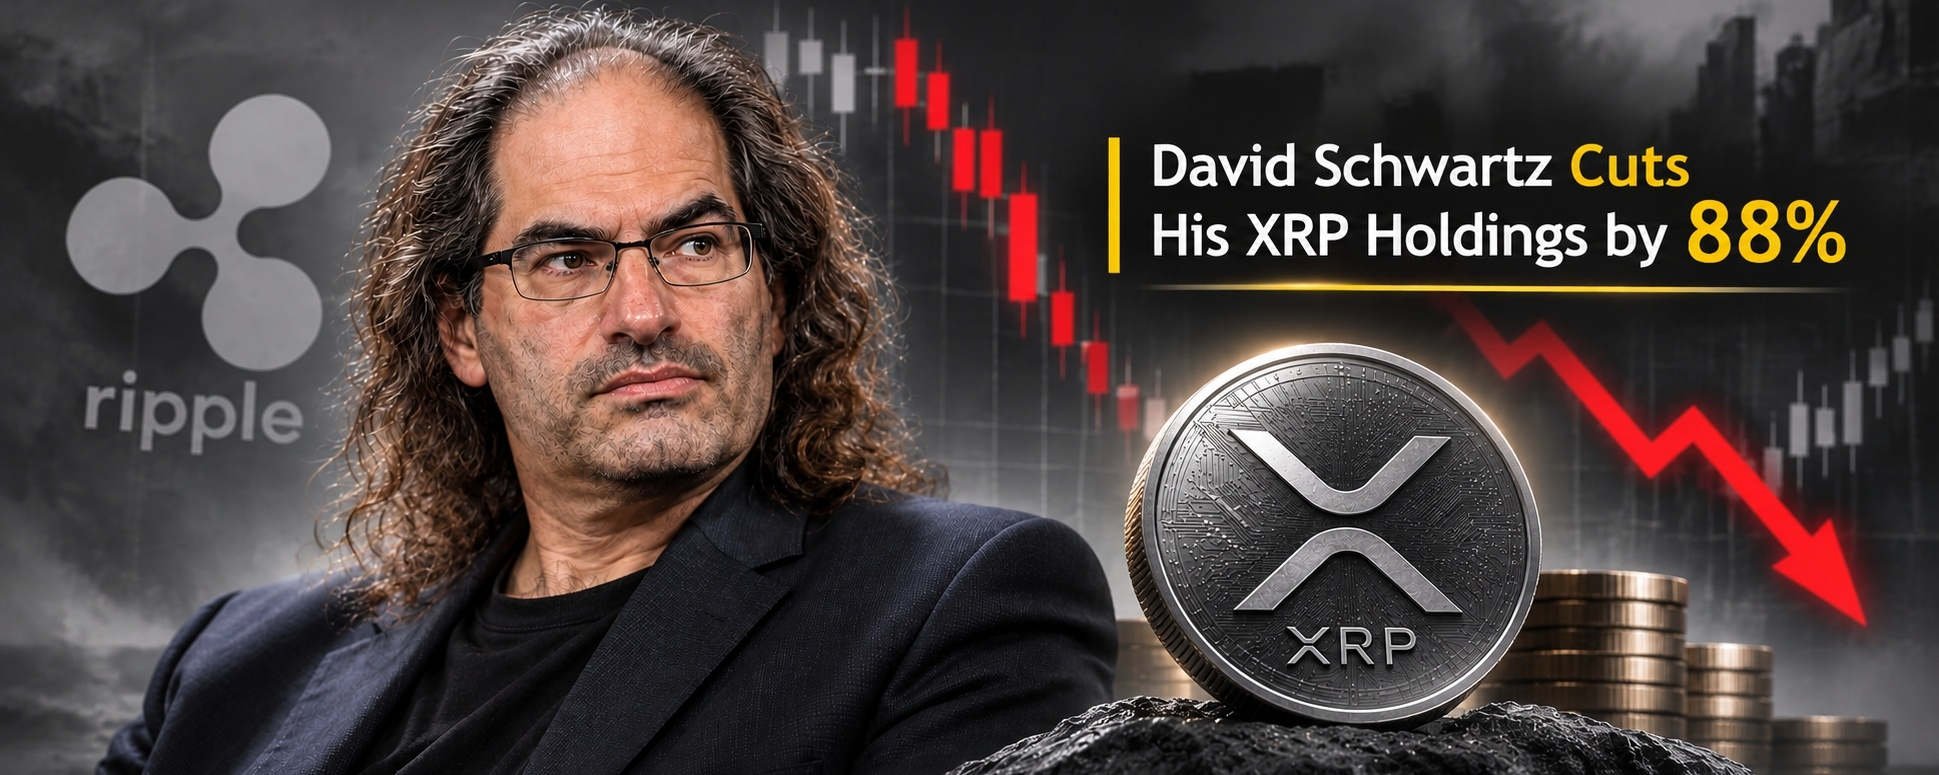
XRP ALERT: Ripple’s David Schwartz Reveals an 88% Cut in His XRP Holdings;A major XRP story is getting attention after David Schwartz, Ripple’s CTO Emeritus and a key figure behind the XRP Ledger, revealed just how much his personal XRP position has changed.
His XRP position reportedly fell from a peak of around 26 million XRP to approximately 3 million XRP — a reduction of roughly 23 million XRP, or more than 88%.
But there’s an important detail: Schwartz says this was not a sudden dump.
He has explained that he has been selling gradually according to a personal risk-management strategy. He previously said he and his wife agreed that he would sell whenever an asset reached a new all-time high because he is highly uncomfortable with financial risk.
HIS CRYPTO HOLDINGS HAVE SHRUNK ACROSS THE BOARD,
• XRP: ~26M → ~3M
• Bitcoin: ~1,500 BTC → 1 BTC
• Ethereum: ~40,000 ETH → 6 ETH
So this isn't simply an XRP-specific decision.
Schwartz has said he has sold nearly all of the digital assets he has ever held and hasn't bought XRP in a long time. He also continues to hold a substantial amount of Ripple stock, despite saying that even this exposure represents more risk than he would personally prefer.
THE 2025 XRP SALES
Schwartz also disclosed that he sold around 2.5 million XRP during 2025, most of which he had received in 2020 and 2023.
Those sales reportedly generated approximately $1.7 million in capital-gains taxes.
He has also described a formal process for his XRP sales: he arranges written plans with an attorney at least 30 days before execution. According to Schwartz, the procedure is designed to reduce concerns about trading on non-public information, including potential knowledge of XRP Ledger issues.
________________________
The timing is certainly uncomfortable for XRP holders.
XRP is trading around $1.06, down sharply from its 2025 record near $3.65. The token has also been trading below its major daily moving averages.
According to the TradingView analysis, key levels are:
🔴 Resistance: $1.089 → $1.130 → $1.284
🟢 Support: $1.031 → $1.009 → $0.986
A daily close above $1.13 could improve the short-term structure, while losing $1.031 could expose XRP to further downside toward $1.009 and potentially $0.986.
There is also broader selling pressure in the market. U.S. spot XRP ETFs recorded roughly $10.42 million in net outflows on November 9, adding another layer of pressure around the token.
________________________
BUT HERE'S THE IMPORTANT PART
Schwartz's selling does not necessarily mean he has lost confidence in XRP.
His own explanation points toward personal risk management rather than a fundamental rejection of XRP.
In fact, he still owns approximately 3 million XRP, worth roughly $3.2 million at the price cited in the TradingView report.
His sales also happened over an extended period rather than representing one massive market dump.
For investors, the bigger question is therefore not simply:
“Why did Schwartz sell?”
It is:
“Does his personal risk tolerance tell us anything about XRP’s long-term fundamentals?”
Right now, the evidence does not prove that his sales represent a bearish signal for XRP.
The market still needs to determine whether XRP can reclaim key resistance levels or whether the current selling pressure pushes it below the $1 psychological zone.
___________________ :
David Schwartz has dramatically reduced his crypto exposure — including an 88%+ reduction in XRP.
That is definitely worth watching.
But considering that he also reduced Bitcoin from ~1,500 to 1 BTC and Ethereum from ~40,000 to 6 ETH, the move appears much more consistent with his long-standing strategy of reducing financial risk than a specific bet against XRP.
For XRP traders, $1.031 remains an important near-term level to watch, while $1.13 is the first major hurdle bulls need to reclaim.
$XRP
{future}(XRPUSDT)
#HotCPIDecemberHikePriced
XRP ALERT: Ripple’s David Schwartz Reveals an 88% Cut in His XRP Holdings;
A major XRP story is getting attention after David Schwartz, Ripple’s CTO Emeritus and a key figure behind the XRP Ledger, revealed just how much his personal XRP position has changed.
His XRP position reportedly fell from a peak of around 26 million XRP to approximately 3 million XRP — a reduction of roughly 23 million XRP, or more than 88%.
But there’s an important detail: Schwartz says this was not a sudden dump.
He has explained that he has been selling gradually according to a personal risk-management strategy. He previously said he and his wife agreed that he would sell whenever an asset reached a new all-time high because he is highly uncomfortable with financial risk.
HIS CRYPTO HOLDINGS HAVE SHRUNK ACROSS THE BOARD,
• XRP: ~26M → ~3M
• Bitcoin: ~1,500 BTC → 1 BTC
• Ethereum: ~40,000 ETH → 6 ETH
So this isn't simply an XRP-specific decision.
Schwartz has said he has sold nearly all of the digital assets he has ever held and hasn't bought XRP in a long time. He also continues to hold a substantial amount of Ripple stock, despite saying that even this exposure represents more risk than he would personally prefer.
THE 2025 XRP SALES
Schwartz also disclosed that he sold around 2.5 million XRP during 2025, most of which he had received in 2020 and 2023.
Those sales reportedly generated approximately $1.7 million in capital-gains taxes.
He has also described a formal process for his XRP sales: he arranges written plans with an attorney at least 30 days before execution. According to Schwartz, the procedure is designed to reduce concerns about trading on non-public information, including potential knowledge of XRP Ledger issues.
________________________
The timing is certainly uncomfortable for XRP holders.
XRP is trading around $1.06, down sharply from its 2025 record near $3.65. The token has also been trading below its major daily moving averages.
According to the TradingView analysis, key levels are:
🔴 Resistance: $1.089 → $1.130 → $1.284
🟢 Support: $1.031 → $1.009 → $0.986
A daily close above $1.13 could improve the short-term structure, while losing $1.031 could expose XRP to further downside toward $1.009 and potentially $0.986.
There is also broader selling pressure in the market. U.S. spot XRP ETFs recorded roughly $10.42 million in net outflows on November 9, adding another layer of pressure around the token.
________________________
BUT HERE'S THE IMPORTANT PART
Schwartz's selling does not necessarily mean he has lost confidence in XRP.
His own explanation points toward personal risk management rather than a fundamental rejection of XRP.
In fact, he still owns approximately 3 million XRP, worth roughly $3.2 million at the price cited in the TradingView report.
His sales also happened over an extended period rather than representing one massive market dump.
For investors, the bigger question is therefore not simply:
“Why did Schwartz sell?”
It is:
“Does his personal risk tolerance tell us anything about XRP’s long-term fundamentals?”
Right now, the evidence does not prove that his sales represent a bearish signal for XRP.
The market still needs to determine whether XRP can reclaim key resistance levels or whether the current selling pressure pushes it below the $1 psychological zone.
___________________ :
David Schwartz has dramatically reduced his crypto exposure — including an 88%+ reduction in XRP.
That is definitely worth watching.
But considering that he also reduced Bitcoin from ~1,500 to 1 BTC and Ethereum from ~40,000 to 6 ETH, the move appears much more consistent with his long-standing strategy of reducing financial risk than a specific bet against XRP.
For XRP traders, $1.031 remains an important near-term level to watch, while $1.13 is the first major hurdle bulls need to reclaim.
$XRP
#HotCPIDecemberHikePriced
His XRP position reportedly fell from a peak of around 26 million XRP to approximately 3 million XRP — a reduction of roughly 23 million XRP, or more than 88%.
But there’s an important detail: Schwartz says this was not a sudden dump.
He has explained that he has been selling gradually according to a personal risk-management strategy. He previously said he and his wife agreed that he would sell whenever an asset reached a new all-time high because he is highly uncomfortable with financial risk.
HIS CRYPTO HOLDINGS HAVE SHRUNK ACROSS THE BOARD,
• XRP: ~26M → ~3M
• Bitcoin: ~1,500 BTC → 1 BTC
• Ethereum: ~40,000 ETH → 6 ETH
So this isn't simply an XRP-specific decision.
Schwartz has said he has sold nearly all of the digital assets he has ever held and hasn't bought XRP in a long time. He also continues to hold a substantial amount of Ripple stock, despite saying that even this exposure represents more risk than he would personally prefer.
THE 2025 XRP SALES
Schwartz also disclosed that he sold around 2.5 million XRP during 2025, most of which he had received in 2020 and 2023.
Those sales reportedly generated approximately $1.7 million in capital-gains taxes.
He has also described a formal process for his XRP sales: he arranges written plans with an attorney at least 30 days before execution. According to Schwartz, the procedure is designed to reduce concerns about trading on non-public information, including potential knowledge of XRP Ledger issues.
________________________
The timing is certainly uncomfortable for XRP holders.
XRP is trading around $1.06, down sharply from its 2025 record near $3.65. The token has also been trading below its major daily moving averages.
According to the TradingView analysis, key levels are:
🔴 Resistance: $1.089 → $1.130 → $1.284
🟢 Support: $1.031 → $1.009 → $0.986
A daily close above $1.13 could improve the short-term structure, while losing $1.031 could expose XRP to further downside toward $1.009 and potentially $0.986.
There is also broader selling pressure in the market. U.S. spot XRP ETFs recorded roughly $10.42 million in net outflows on November 9, adding another layer of pressure around the token.
________________________
BUT HERE'S THE IMPORTANT PART
Schwartz's selling does not necessarily mean he has lost confidence in XRP.
His own explanation points toward personal risk management rather than a fundamental rejection of XRP.
In fact, he still owns approximately 3 million XRP, worth roughly $3.2 million at the price cited in the TradingView report.
His sales also happened over an extended period rather than representing one massive market dump.
For investors, the bigger question is therefore not simply:
“Why did Schwartz sell?”
It is:
“Does his personal risk tolerance tell us anything about XRP’s long-term fundamentals?”
Right now, the evidence does not prove that his sales represent a bearish signal for XRP.
The market still needs to determine whether XRP can reclaim key resistance levels or whether the current selling pressure pushes it below the $1 psychological zone.
___________________ :
David Schwartz has dramatically reduced his crypto exposure — including an 88%+ reduction in XRP.
That is definitely worth watching.
But considering that he also reduced Bitcoin from ~1,500 to 1 BTC and Ethereum from ~40,000 to 6 ETH, the move appears much more consistent with his long-standing strategy of reducing financial risk than a specific bet against XRP.
For XRP traders, $1.031 remains an important near-term level to watch, while $1.13 is the first major hurdle bulls need to reclaim.
$XRP
#HotCPIDecemberHikePriced
2
306
·
--
Bearish
$CAP
{future}(CAPUSDT)
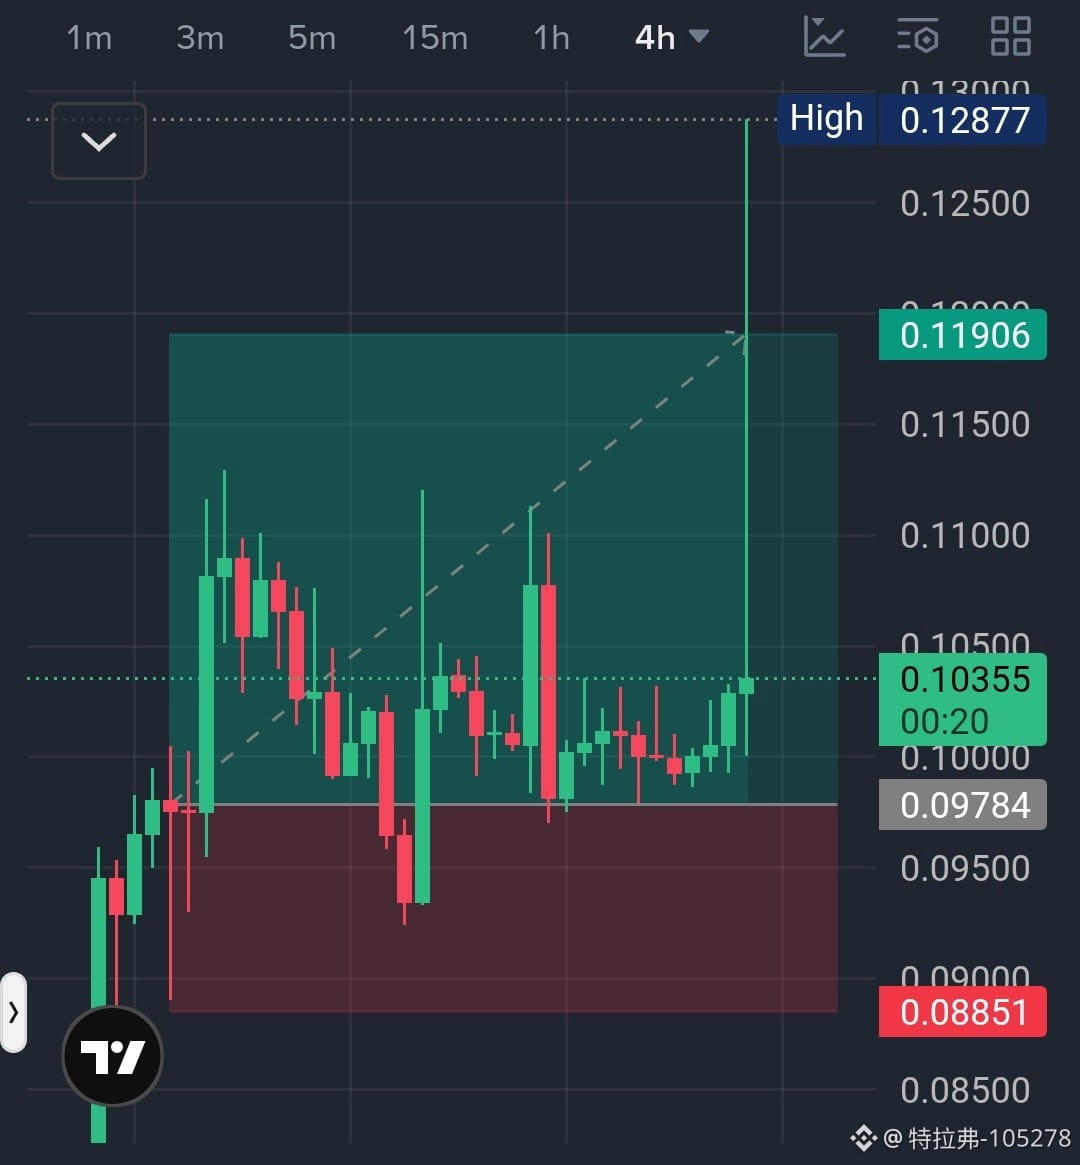
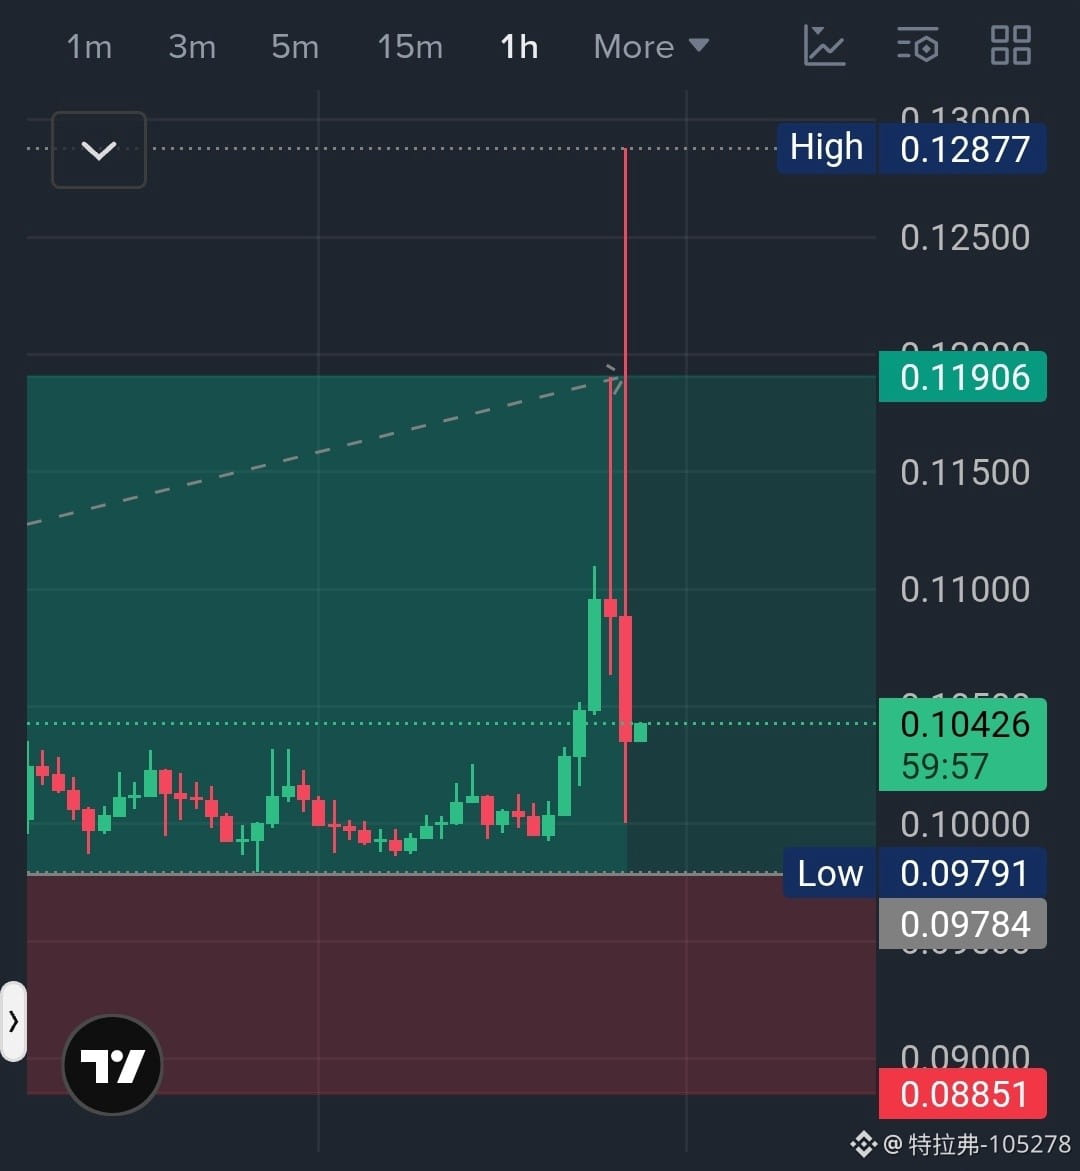
All TP Target 🎯 Done ✅
After Long Time,
After Hit All Target's and Then CAP just Crash.
$CAP
All TP Target 🎯 Done ✅
After Long Time,
After Hit All Target's and Then CAP just Crash.
All TP Target 🎯 Done ✅
After Long Time,
After Hit All Target's and Then CAP just Crash.
特拉弗-105278
·
--
BullishAfter opening the trade, it narrowly avoided hitting the stop-loss; subsequently, two take-profit targets were reached, but the third target remains.
it's struggling.
$CAP
#BinanceReopensWithdrawalsForMoreAssets
it's struggling.
$CAP
#BinanceReopensWithdrawalsForMoreAssets
1
510
·
--
Bullish
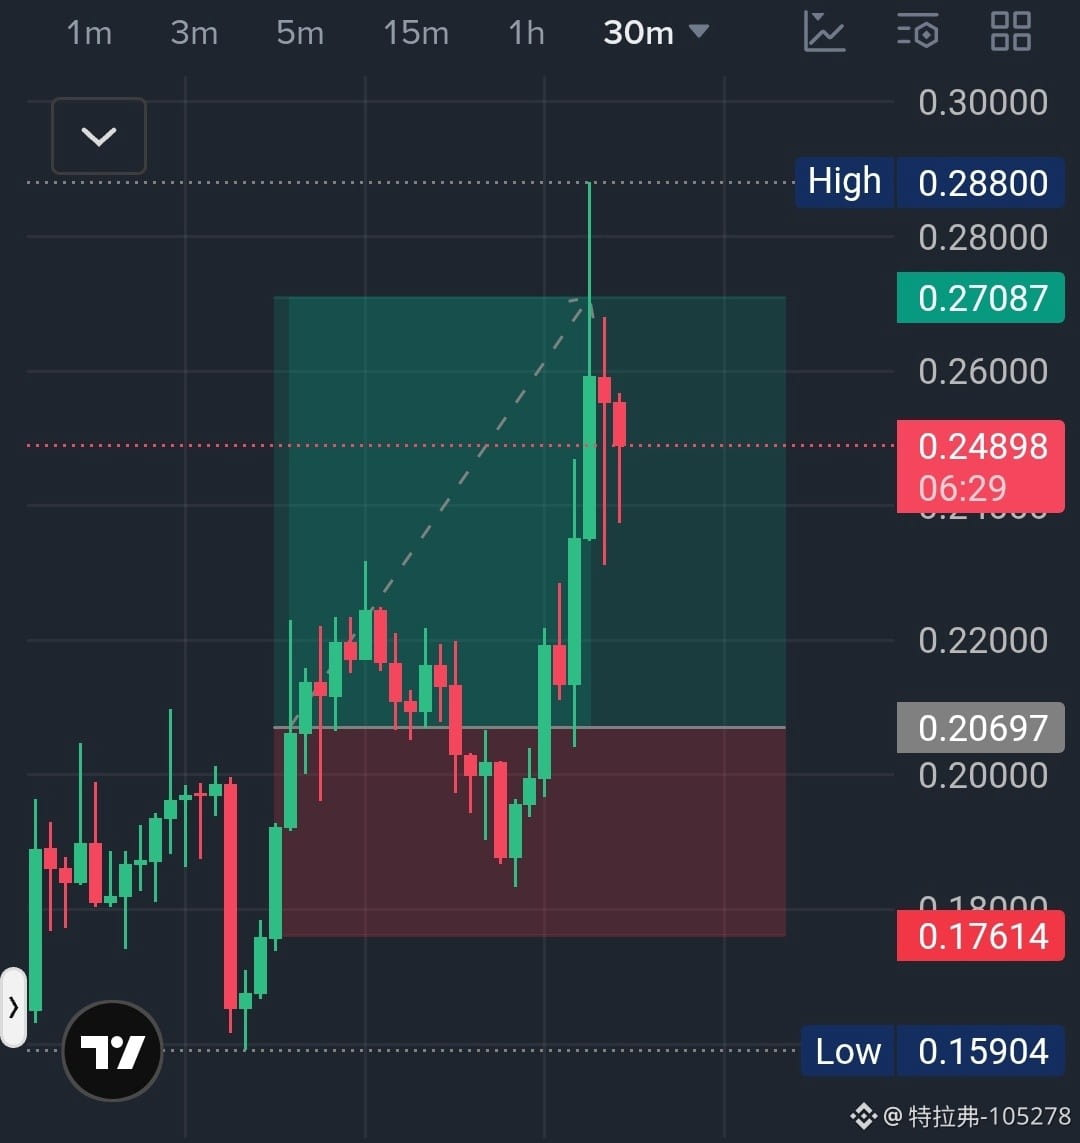
$INIT All TP Target 🎯 Done ✅
{future}(INITUSDT)
$INIT All TP Target 🎯 Done ✅
特拉弗-105278
·
--
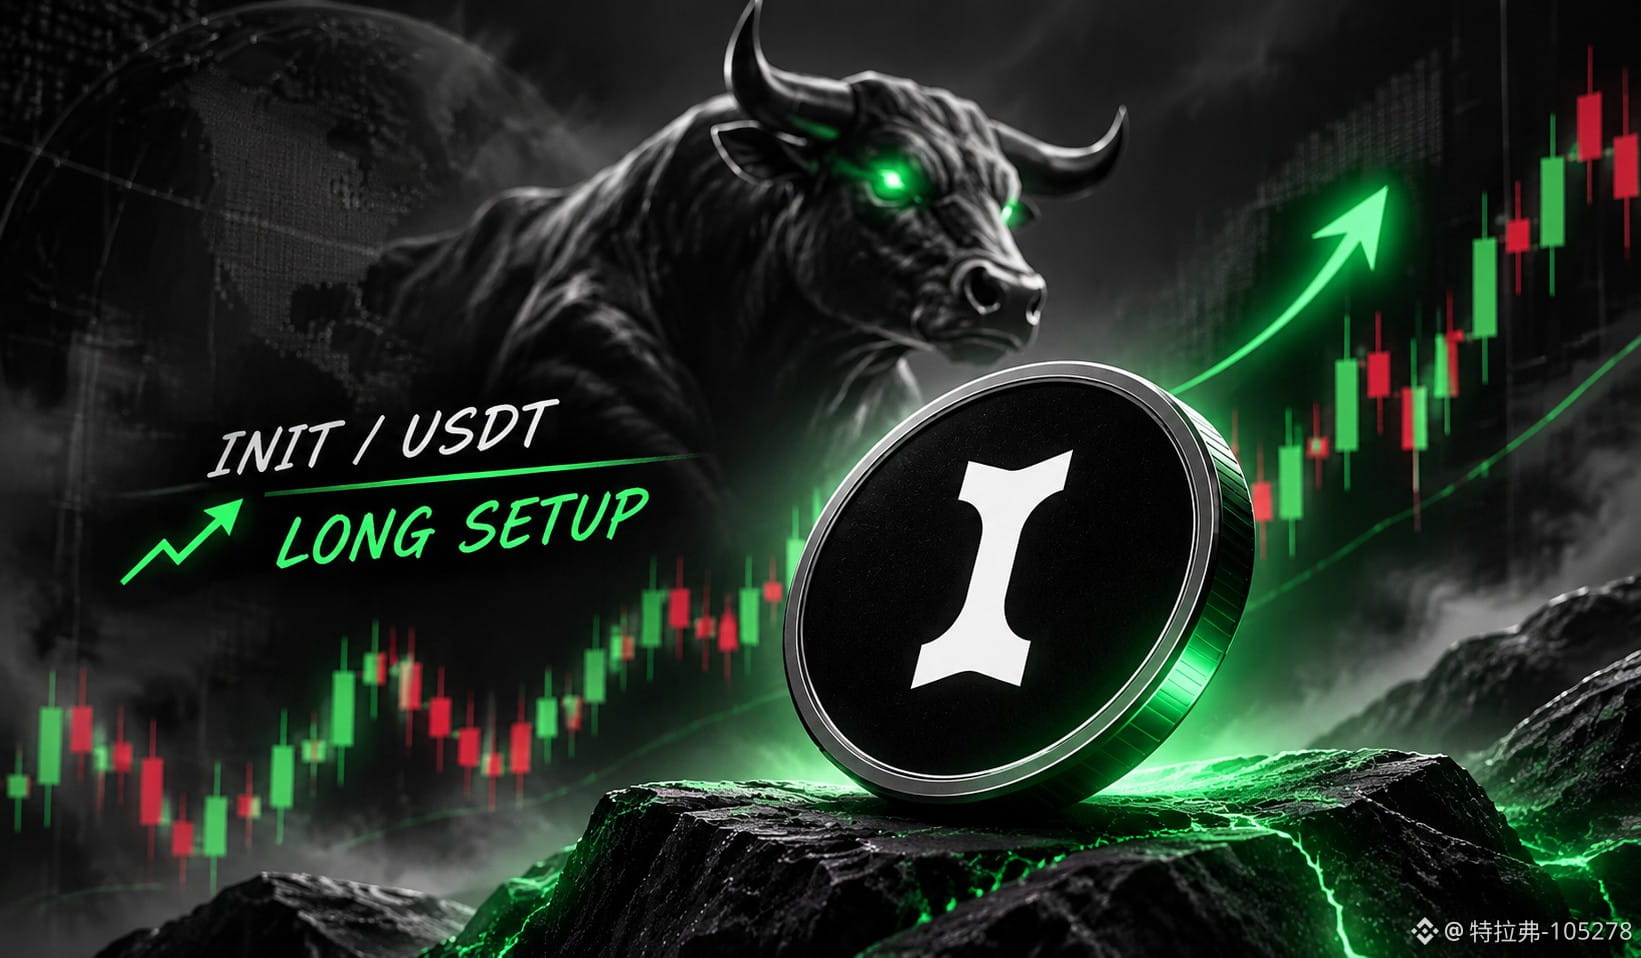
Bullish🟢 INIT/USDT — BUY SETUP.
INIT is showing strong bullish momentum across the 1H, 4H and 1D charts. After spending several sessions near the $0.12 area, price broke out aggressively and reclaimed the $0.18–$0.19 zone.
The important part now is whether buyers can hold the breakout instead of giving back the entire move.
📌 LONG ENTRY
$0.198 – $0.20
🎯 TAKE PROFITS
TP1: $0.225
TP2: $0.240
TP3: $0.255
TP4: $0.270
🛑 STOP LOSS
$0.176
.
• 1H structure has shifted strongly upward after the breakout.
• Price is holding above the previous $0.18–$0.19 resistance area.
• 4H momentum has changed from a prolonged decline into a strong recovery.
• Daily structure remains bullish after the sharp rebound from around $0.12.
• $0.210 is the first major resistance. A clean break and hold above it could open the way toward $0.225–$0.255.
Don't FOMO into a vertical candle.
A strong 1H close above $0.210 would also confirm continuation.
If price loses $0.176, the bullish setup is invalidated.
Risk management first. Don't over-leverage a volatile move.
$INIT
#CPITestsDecemberRateOutlook
INIT is showing strong bullish momentum across the 1H, 4H and 1D charts. After spending several sessions near the $0.12 area, price broke out aggressively and reclaimed the $0.18–$0.19 zone.
The important part now is whether buyers can hold the breakout instead of giving back the entire move.
📌 LONG ENTRY
$0.198 – $0.20
🎯 TAKE PROFITS
TP1: $0.225
TP2: $0.240
TP3: $0.255
TP4: $0.270
🛑 STOP LOSS
$0.176
.
• 1H structure has shifted strongly upward after the breakout.
• Price is holding above the previous $0.18–$0.19 resistance area.
• 4H momentum has changed from a prolonged decline into a strong recovery.
• Daily structure remains bullish after the sharp rebound from around $0.12.
• $0.210 is the first major resistance. A clean break and hold above it could open the way toward $0.225–$0.255.
Don't FOMO into a vertical candle.
A strong 1H close above $0.210 would also confirm continuation.
If price loses $0.176, the bullish setup is invalidated.
Risk management first. Don't over-leverage a volatile move.
$INIT
#CPITestsDecemberRateOutlook
1
430
·
--
Verified
CAKE BURN IS COMING — NOVEMBER 16
BUY CAKE and HOLD;
PancakeSwap is preparing for another CAKE token burn on November 16, putting the spotlight back on one of the most important parts of CAKE’s tokenomics: reducing supply through protocol-generated fees.
The upcoming event was recently rescheduled as PancakeSwap carries out security upgrades and internal checks on the contracts involved in the buyback process.
_____________________
PancakeSwap has already maintained a long-running deflationary trend. In October, around 1.79M CAKE was burned, while roughly 674K CAKE was minted — resulting in a net reduction of more than 1.11M CAKE.
That means the upcoming burn isn't an isolated event. It is part of PancakeSwap's broader strategy to keep CAKE supply under control.
CAKE also has a 400M maximum supply, with PancakeSwap targeting continued long-term supply reduction through its tokenomics model.
But there is one important point traders should keep in mind:
A burn does not automatically mean price goes up.
The actual impact depends on the amount of CAKE removed, market demand, liquidity and the broader crypto market. The exact size of the November 16 burn has not been disclosed yet, so anyone giving a guaranteed price target based solely on the burn is getting ahead of the data.
_________________________
If CAKE continues reducing circulating supply while PancakeSwap activity and fee generation remain strong, the long-term supply-demand equation could become increasingly favorable.
• November 16 — CAKE burn
• Focus: Supply reduction
• Key factor: Actual burn size
• Watch: CAKE volume, DEX activity and market reaction
For me, the interesting part isn't simply the headline “CAKE burn.”
It's whether real protocol activity can continue generating enough fees to consistently remove more CAKE from supply.
That is the metric worth watching beyond November 16.
$CAKE
{future}(CAKEUSDT)
#CPITestsDecemberRateOutlook
CAKE BURN IS COMING — NOVEMBER 16
BUY CAKE and HOLD;
PancakeSwap is preparing for another CAKE token burn on November 16, putting the spotlight back on one of the most important parts of CAKE’s tokenomics: reducing supply through protocol-generated fees.
The upcoming event was recently rescheduled as PancakeSwap carries out security upgrades and internal checks on the contracts involved in the buyback process.
_____________________
PancakeSwap has already maintained a long-running deflationary trend. In October, around 1.79M CAKE was burned, while roughly 674K CAKE was minted — resulting in a net reduction of more than 1.11M CAKE.
That means the upcoming burn isn't an isolated event. It is part of PancakeSwap's broader strategy to keep CAKE supply under control.
CAKE also has a 400M maximum supply, with PancakeSwap targeting continued long-term supply reduction through its tokenomics model.
But there is one important point traders should keep in mind:
A burn does not automatically mean price goes up.
The actual impact depends on the amount of CAKE removed, market demand, liquidity and the broader crypto market. The exact size of the November 16 burn has not been disclosed yet, so anyone giving a guaranteed price target based solely on the burn is getting ahead of the data.
_________________________
If CAKE continues reducing circulating supply while PancakeSwap activity and fee generation remain strong, the long-term supply-demand equation could become increasingly favorable.
• November 16 — CAKE burn
• Focus: Supply reduction
• Key factor: Actual burn size
• Watch: CAKE volume, DEX activity and market reaction
For me, the interesting part isn't simply the headline “CAKE burn.”
It's whether real protocol activity can continue generating enough fees to consistently remove more CAKE from supply.
That is the metric worth watching beyond November 16.
$CAKE
#CPITestsDecemberRateOutlook
BUY CAKE and HOLD;
PancakeSwap is preparing for another CAKE token burn on November 16, putting the spotlight back on one of the most important parts of CAKE’s tokenomics: reducing supply through protocol-generated fees.
The upcoming event was recently rescheduled as PancakeSwap carries out security upgrades and internal checks on the contracts involved in the buyback process.
_____________________
PancakeSwap has already maintained a long-running deflationary trend. In October, around 1.79M CAKE was burned, while roughly 674K CAKE was minted — resulting in a net reduction of more than 1.11M CAKE.
That means the upcoming burn isn't an isolated event. It is part of PancakeSwap's broader strategy to keep CAKE supply under control.
CAKE also has a 400M maximum supply, with PancakeSwap targeting continued long-term supply reduction through its tokenomics model.
But there is one important point traders should keep in mind:
A burn does not automatically mean price goes up.
The actual impact depends on the amount of CAKE removed, market demand, liquidity and the broader crypto market. The exact size of the November 16 burn has not been disclosed yet, so anyone giving a guaranteed price target based solely on the burn is getting ahead of the data.
_________________________
If CAKE continues reducing circulating supply while PancakeSwap activity and fee generation remain strong, the long-term supply-demand equation could become increasingly favorable.
• November 16 — CAKE burn
• Focus: Supply reduction
• Key factor: Actual burn size
• Watch: CAKE volume, DEX activity and market reaction
For me, the interesting part isn't simply the headline “CAKE burn.”
It's whether real protocol activity can continue generating enough fees to consistently remove more CAKE from supply.
That is the metric worth watching beyond November 16.
$CAKE
#CPITestsDecemberRateOutlook

1
813
·
--
Bullish
🟢 INIT/USDT — BUY SETUP.
INIT is showing strong bullish momentum across the 1H, 4H and 1D charts. After spending several sessions near the $0.12 area, price broke out aggressively and reclaimed the $0.18–$0.19 zone.
The important part now is whether buyers can hold the breakout instead of giving back the entire move.
📌 LONG ENTRY
$0.198 – $0.20
🎯 TAKE PROFITS
TP1: $0.225
TP2: $0.240
TP3: $0.255
TP4: $0.270
🛑 STOP LOSS
$0.176
.
• 1H structure has shifted strongly upward after the breakout.
• Price is holding above the previous $0.18–$0.19 resistance area.
• 4H momentum has changed from a prolonged decline into a strong recovery.
• Daily structure remains bullish after the sharp rebound from around $0.12.
• $0.210 is the first major resistance. A clean break and hold above it could open the way toward $0.225–$0.255.
Don't FOMO into a vertical candle.
A strong 1H close above $0.210 would also confirm continuation.
If price loses $0.176, the bullish setup is invalidated.
Risk management first. Don't over-leverage a volatile move.
$INIT
{future}(INITUSDT)
#CPITestsDecemberRateOutlook
🟢 INIT/USDT — BUY SETUP.
INIT is showing strong bullish momentum across the 1H, 4H and 1D charts. After spending several sessions near the $0.12 area, price broke out aggressively and reclaimed the $0.18–$0.19 zone.
The important part now is whether buyers can hold the breakout instead of giving back the entire move.
📌 LONG ENTRY
$0.198 – $0.20
🎯 TAKE PROFITS
TP1: $0.225
TP2: $0.240
TP3: $0.255
TP4: $0.270
🛑 STOP LOSS
$0.176
.
• 1H structure has shifted strongly upward after the breakout.
• Price is holding above the previous $0.18–$0.19 resistance area.
• 4H momentum has changed from a prolonged decline into a strong recovery.
• Daily structure remains bullish after the sharp rebound from around $0.12.
• $0.210 is the first major resistance. A clean break and hold above it could open the way toward $0.225–$0.255.
Don't FOMO into a vertical candle.
A strong 1H close above $0.210 would also confirm continuation.
If price loses $0.176, the bullish setup is invalidated.
Risk management first. Don't over-leverage a volatile move.
$INIT
#CPITestsDecemberRateOutlook
INIT is showing strong bullish momentum across the 1H, 4H and 1D charts. After spending several sessions near the $0.12 area, price broke out aggressively and reclaimed the $0.18–$0.19 zone.
The important part now is whether buyers can hold the breakout instead of giving back the entire move.
📌 LONG ENTRY
$0.198 – $0.20
🎯 TAKE PROFITS
TP1: $0.225
TP2: $0.240
TP3: $0.255
TP4: $0.270
🛑 STOP LOSS
$0.176
.
• 1H structure has shifted strongly upward after the breakout.
• Price is holding above the previous $0.18–$0.19 resistance area.
• 4H momentum has changed from a prolonged decline into a strong recovery.
• Daily structure remains bullish after the sharp rebound from around $0.12.
• $0.210 is the first major resistance. A clean break and hold above it could open the way toward $0.225–$0.255.
Don't FOMO into a vertical candle.
A strong 1H close above $0.210 would also confirm continuation.
If price loses $0.176, the bullish setup is invalidated.
Risk management first. Don't over-leverage a volatile move.
$INIT
#CPITestsDecemberRateOutlook
1
2
452
·
--

Article
XRP Recorded 18 Oversold Signals Since 2023. What Does History Reveal About a Possible Recovery?XRP is facing significant selling pressure, with its price trading 55.2% below its one-year high. However, new research from Bitrue Research Institute highlights an interesting historical pattern: XRP has frequently recovered over the following 90 days after reaching deeply oversold conditions.
The study examines XRP/USDT data dating back to January 2023 and identifies several important signals traders should monitor.
___________________________
The research identified 18 occasions since 2023 when XRP's daily Relative Strength Index (RSI) dropped below 35.
Among the 17 readings with complete 90-day data:
- 12 cases ended with XRP trading higher.
- Historical recovery frequency: approximately 70.6%.
- Across all days during the same period, XRP was higher after 90 days in approximately 53.5% of cases.
However, the results were not equally strong across every timeframe. Over 60 days, oversold readings did not outperform ordinary trading days.
The study also found that recoveries rarely happened immediately. XRP frequently experienced additional declines before eventually moving higher.
______________________________
Bitrue AI identifies deeply oversold conditions on both the daily and 4-hour charts.
Key observations:
- 4-hour RSI: 24.
- XRP remains significantly below its one-year high.
- Current AI working price range: $1.0365–$1.1803.
- The market still faces risks of both a sharp rebound and further downside.
The RSI reading indicates strong selling pressure, but it does not independently confirm that XRP has reached a market bottom.
Historical Recovery Pattern: Base First, Then Rebound,
One of the study's most important findings concerns how XRP historically transitions from oversold conditions into recovery.
The research found that XRP never moved directly from similar conditions into a confirmed uptrend.
Within 10 days:
- A trading range formed first in 43.9% of cases.
- A confirmed downtrend came first in 49.6% of cases.
This suggests that sideways consolidation and base-building have often played an important role before a sustainable recovery begins.
___________________________
Bitrue Research Institute identifies three conditions that could indicate buyers are returning:
1. Volume Confirmation: Buying volume on up days needs to exceed selling volume on down days. Over the past 20 days, down-day volume has been approximately twice up-day volume.
2. OBV Recovery: On-Balance Volume (OBV) needs to turn positive while price stabilizes. Currently, OBV is still declining, suggesting accumulation has not been confirmed.
3. Price Breakout: XRP needs a daily close above $1.1803, the upper boundary of Bitrue AI's current working range.
Importantly, none of these three confirmation signals was present when the report was published.
______________________________
Historical data suggests that XRP's oversold conditions could create recovery opportunities, but the research does not confirm that a bottom is already in place.
The most important development will be whether XRP establishes a stable trading range, buying volume improves, OBV turns higher, and price eventually breaks above $1.1803.
Consideration: The historical sample contains fewer than 20 events, so its recovery statistics should be treated as context rather than a prediction. Further downside remains possible before any sustained rebound.
Past performance does not guarantee future results.
$XRP
{future}(XRPUSDT)
#BitcoinFiveWeeklyLosses
XRP Recorded 18 Oversold Signals Since 2023. What Does History Reveal About a Possible Recovery?
XRP is facing significant selling pressure, with its price trading 55.2% below its one-year high. However, new research from Bitrue Research Institute highlights an interesting historical pattern: XRP has frequently recovered over the following 90 days after reaching deeply oversold conditions.
The study examines XRP/USDT data dating back to January 2023 and identifies several important signals traders should monitor.
___________________________
The research identified 18 occasions since 2023 when XRP's daily Relative Strength Index (RSI) dropped below 35.
Among the 17 readings with complete 90-day data:
- 12 cases ended with XRP trading higher.
- Historical recovery frequency: approximately 70.6%.
- Across all days during the same period, XRP was higher after 90 days in approximately 53.5% of cases.
However, the results were not equally strong across every timeframe. Over 60 days, oversold readings did not outperform ordinary trading days.
The study also found that recoveries rarely happened immediately. XRP frequently experienced additional declines before eventually moving higher.
______________________________
Bitrue AI identifies deeply oversold conditions on both the daily and 4-hour charts.
Key observations:
- 4-hour RSI: 24.
- XRP remains significantly below its one-year high.
- Current AI working price range: $1.0365–$1.1803.
- The market still faces risks of both a sharp rebound and further downside.
The RSI reading indicates strong selling pressure, but it does not independently confirm that XRP has reached a market bottom.
Historical Recovery Pattern: Base First, Then Rebound,
One of the study's most important findings concerns how XRP historically transitions from oversold conditions into recovery.
The research found that XRP never moved directly from similar conditions into a confirmed uptrend.
Within 10 days:
- A trading range formed first in 43.9% of cases.
- A confirmed downtrend came first in 49.6% of cases.
This suggests that sideways consolidation and base-building have often played an important role before a sustainable recovery begins.
___________________________
Bitrue Research Institute identifies three conditions that could indicate buyers are returning:
1. Volume Confirmation: Buying volume on up days needs to exceed selling volume on down days. Over the past 20 days, down-day volume has been approximately twice up-day volume.
2. OBV Recovery: On-Balance Volume (OBV) needs to turn positive while price stabilizes. Currently, OBV is still declining, suggesting accumulation has not been confirmed.
3. Price Breakout: XRP needs a daily close above $1.1803, the upper boundary of Bitrue AI's current working range.
Importantly, none of these three confirmation signals was present when the report was published.
______________________________
Historical data suggests that XRP's oversold conditions could create recovery opportunities, but the research does not confirm that a bottom is already in place.
The most important development will be whether XRP establishes a stable trading range, buying volume improves, OBV turns higher, and price eventually breaks above $1.1803.
Consideration: The historical sample contains fewer than 20 events, so its recovery statistics should be treated as context rather than a prediction. Further downside remains possible before any sustained rebound.
Past performance does not guarantee future results.
$XRP
#BitcoinFiveWeeklyLosses
The study examines XRP/USDT data dating back to January 2023 and identifies several important signals traders should monitor.
___________________________
The research identified 18 occasions since 2023 when XRP's daily Relative Strength Index (RSI) dropped below 35.
Among the 17 readings with complete 90-day data:
- 12 cases ended with XRP trading higher.
- Historical recovery frequency: approximately 70.6%.
- Across all days during the same period, XRP was higher after 90 days in approximately 53.5% of cases.
However, the results were not equally strong across every timeframe. Over 60 days, oversold readings did not outperform ordinary trading days.
The study also found that recoveries rarely happened immediately. XRP frequently experienced additional declines before eventually moving higher.
______________________________
Bitrue AI identifies deeply oversold conditions on both the daily and 4-hour charts.
Key observations:
- 4-hour RSI: 24.
- XRP remains significantly below its one-year high.
- Current AI working price range: $1.0365–$1.1803.
- The market still faces risks of both a sharp rebound and further downside.
The RSI reading indicates strong selling pressure, but it does not independently confirm that XRP has reached a market bottom.
Historical Recovery Pattern: Base First, Then Rebound,
One of the study's most important findings concerns how XRP historically transitions from oversold conditions into recovery.
The research found that XRP never moved directly from similar conditions into a confirmed uptrend.
Within 10 days:
- A trading range formed first in 43.9% of cases.
- A confirmed downtrend came first in 49.6% of cases.
This suggests that sideways consolidation and base-building have often played an important role before a sustainable recovery begins.
___________________________
Bitrue Research Institute identifies three conditions that could indicate buyers are returning:
1. Volume Confirmation: Buying volume on up days needs to exceed selling volume on down days. Over the past 20 days, down-day volume has been approximately twice up-day volume.
2. OBV Recovery: On-Balance Volume (OBV) needs to turn positive while price stabilizes. Currently, OBV is still declining, suggesting accumulation has not been confirmed.
3. Price Breakout: XRP needs a daily close above $1.1803, the upper boundary of Bitrue AI's current working range.
Importantly, none of these three confirmation signals was present when the report was published.
______________________________
Historical data suggests that XRP's oversold conditions could create recovery opportunities, but the research does not confirm that a bottom is already in place.
The most important development will be whether XRP establishes a stable trading range, buying volume improves, OBV turns higher, and price eventually breaks above $1.1803.
Consideration: The historical sample contains fewer than 20 events, so its recovery statistics should be treated as context rather than a prediction. Further downside remains possible before any sustained rebound.
Past performance does not guarantee future results.
$XRP
#BitcoinFiveWeeklyLosses
2
1.1k
·
--
Article
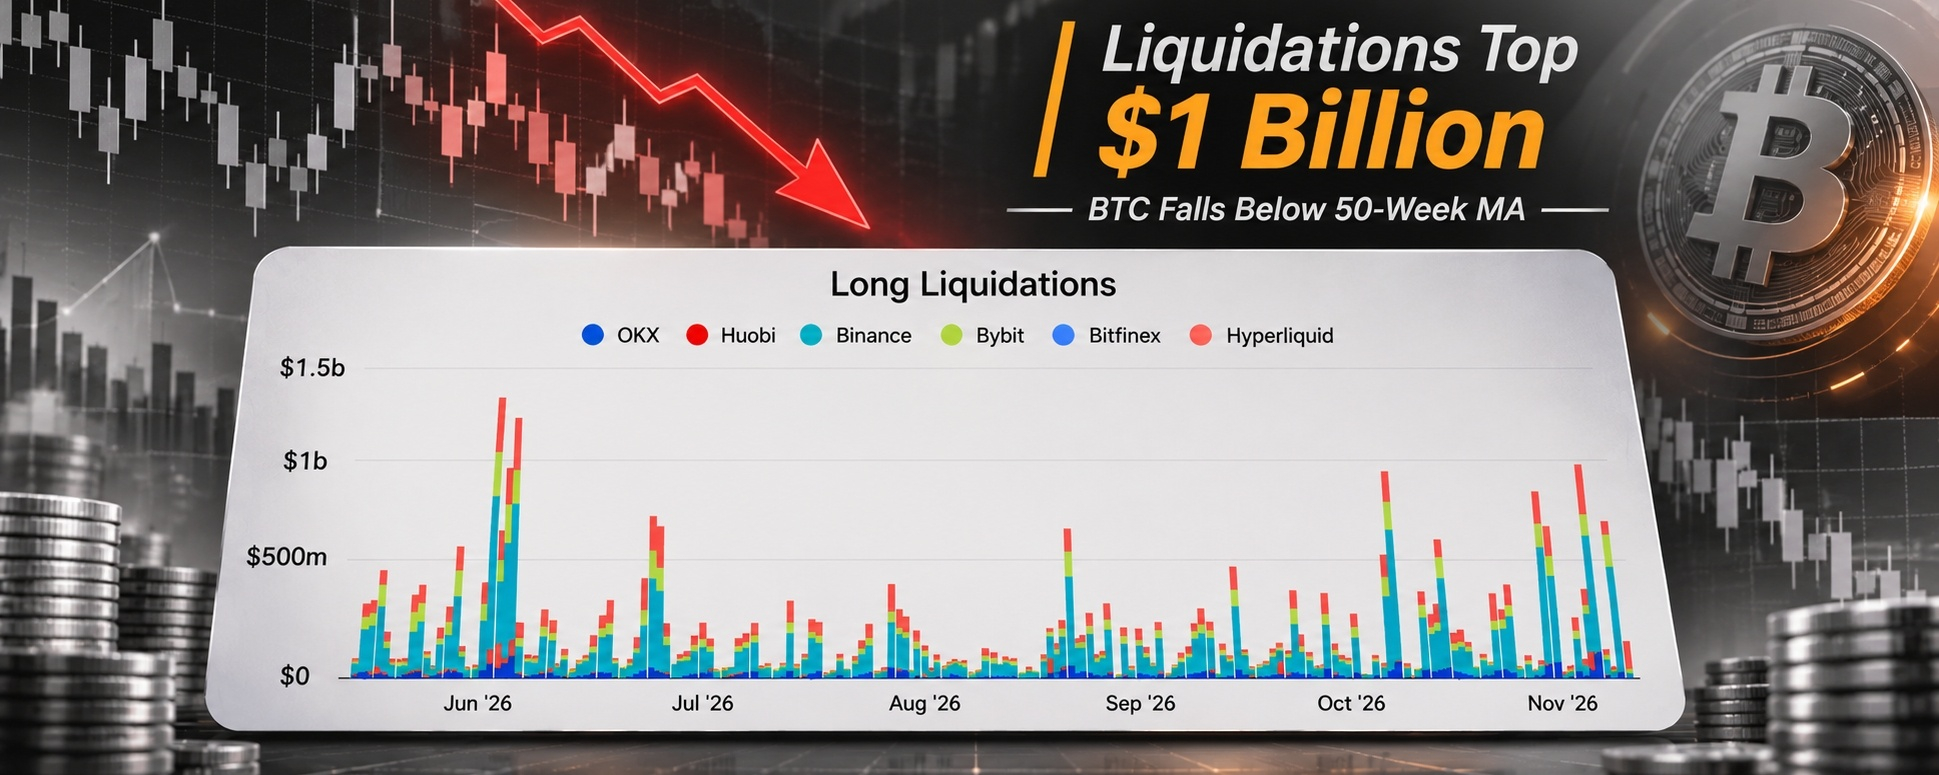
Bitcoin Breaks Below Its 50-Week Moving Average as Crypto Liquidations Exceed $1.15 Billion;Bitcoin is facing renewed selling pressure after losing a major long-term technical level, while more than $1.15 billion in leveraged crypto positions were liquidated within 24 hours.
The latest decline has raised concerns about market structure, particularly as leveraged traders continue to face significant losses.
__________________
Bitcoin closed the weekly candle below its 50-week moving average for the first time in eight weeks.
- 50-week moving average: approximately $75,488
- Weekly closing price: approximately $74,851
- Distance below the average: approximately 0.7%
This level had previously acted as an important trend indicator. Losing it suggests that bullish momentum is weakening and sellers are gaining greater control.
However, one weekly close below the moving average does not automatically confirm a long-term bear market. Bitcoin's ability to reclaim this level will be important.
_____________
The market downturn triggered a major liquidation event across cryptocurrency derivatives markets.
According to CoinGlass data reported by The Block:
- Total liquidations: $1.15 billion
- Long liquidations: $1.04 billion
- Short liquidations: $117 million
- Traders liquidated: approximately 167,764
Long positions accounted for the overwhelming majority of forced closures.
Ethereum traders experienced more than $500 million in liquidations, while Bitcoin accounted for approximately $309 million.
The largest individual liquidation was a $48.2 million ETH-USDT long position on Binance.
These figures highlight how excessive leverage can accelerate market declines when prices move against crowded positions.
__________
Institutional investment flows are another important factor.
U.S. spot Bitcoin ETFs recorded approximately $1.28 billion in net outflows during the previous week, marking their largest weekly outflow since late June.
The funds experienced outflows on four of the five trading days, while total net outflows for 2026 reached approximately $914.1 million.
BlackRock's IBIT alone recorded around $403 million in outflows on Friday.
This suggests that institutional demand has weakened alongside the broader market correction.
__________________
Bitcoin's next moves will depend heavily on whether buyers can defend nearby support and reclaim lost resistance.
Resistance levels:
- $75,488 – 50-week moving average
- $76,000 – Short-term recovery area
- $80,000 – Major psychological resistance
Support levels:
- $74,000 – Immediate psychological support
- $73,000 – Important downside reference
- $68,000 – Further downside level if selling pressure continues
A sustained recovery above the 50-week moving average could improve market sentiment. However, continued rejection below this level may increase the possibility of another downward move.
.
The combination of weakening technical structure, substantial ETF outflows and heavy long liquidations presents a challenging environment for bullish traders.
However, the liquidation event could also reduce excessive leverage and create conditions for a more stable market if selling pressure begins to fade.
For now, traders should monitor weekly closing prices, trading volume, ETF flows and derivatives positioning rather than rushing into leveraged positions.
The key question is whether Bitcoin can reclaim its 50-week moving average or whether this breakdown develops into a deeper correction.
$BTC
{future}(BTCUSDT)
#BitcoinFiveWeeklyLosses
Bitcoin Breaks Below Its 50-Week Moving Average as Crypto Liquidations Exceed $1.15 Billion;
Bitcoin is facing renewed selling pressure after losing a major long-term technical level, while more than $1.15 billion in leveraged crypto positions were liquidated within 24 hours.
The latest decline has raised concerns about market structure, particularly as leveraged traders continue to face significant losses.
__________________
Bitcoin closed the weekly candle below its 50-week moving average for the first time in eight weeks.
- 50-week moving average: approximately $75,488
- Weekly closing price: approximately $74,851
- Distance below the average: approximately 0.7%
This level had previously acted as an important trend indicator. Losing it suggests that bullish momentum is weakening and sellers are gaining greater control.
However, one weekly close below the moving average does not automatically confirm a long-term bear market. Bitcoin's ability to reclaim this level will be important.
_____________
The market downturn triggered a major liquidation event across cryptocurrency derivatives markets.
According to CoinGlass data reported by The Block:
- Total liquidations: $1.15 billion
- Long liquidations: $1.04 billion
- Short liquidations: $117 million
- Traders liquidated: approximately 167,764
Long positions accounted for the overwhelming majority of forced closures.
Ethereum traders experienced more than $500 million in liquidations, while Bitcoin accounted for approximately $309 million.
The largest individual liquidation was a $48.2 million ETH-USDT long position on Binance.
These figures highlight how excessive leverage can accelerate market declines when prices move against crowded positions.
__________
Institutional investment flows are another important factor.
U.S. spot Bitcoin ETFs recorded approximately $1.28 billion in net outflows during the previous week, marking their largest weekly outflow since late June.
The funds experienced outflows on four of the five trading days, while total net outflows for 2026 reached approximately $914.1 million.
BlackRock's IBIT alone recorded around $403 million in outflows on Friday.
This suggests that institutional demand has weakened alongside the broader market correction.
__________________
Bitcoin's next moves will depend heavily on whether buyers can defend nearby support and reclaim lost resistance.
Resistance levels:
- $75,488 – 50-week moving average
- $76,000 – Short-term recovery area
- $80,000 – Major psychological resistance
Support levels:
- $74,000 – Immediate psychological support
- $73,000 – Important downside reference
- $68,000 – Further downside level if selling pressure continues
A sustained recovery above the 50-week moving average could improve market sentiment. However, continued rejection below this level may increase the possibility of another downward move.
.
The combination of weakening technical structure, substantial ETF outflows and heavy long liquidations presents a challenging environment for bullish traders.
However, the liquidation event could also reduce excessive leverage and create conditions for a more stable market if selling pressure begins to fade.
For now, traders should monitor weekly closing prices, trading volume, ETF flows and derivatives positioning rather than rushing into leveraged positions.
The key question is whether Bitcoin can reclaim its 50-week moving average or whether this breakdown develops into a deeper correction.
$BTC
#BitcoinFiveWeeklyLosses
The latest decline has raised concerns about market structure, particularly as leveraged traders continue to face significant losses.
__________________
Bitcoin closed the weekly candle below its 50-week moving average for the first time in eight weeks.
- 50-week moving average: approximately $75,488
- Weekly closing price: approximately $74,851
- Distance below the average: approximately 0.7%
This level had previously acted as an important trend indicator. Losing it suggests that bullish momentum is weakening and sellers are gaining greater control.
However, one weekly close below the moving average does not automatically confirm a long-term bear market. Bitcoin's ability to reclaim this level will be important.
_____________
The market downturn triggered a major liquidation event across cryptocurrency derivatives markets.
According to CoinGlass data reported by The Block:
- Total liquidations: $1.15 billion
- Long liquidations: $1.04 billion
- Short liquidations: $117 million
- Traders liquidated: approximately 167,764
Long positions accounted for the overwhelming majority of forced closures.
Ethereum traders experienced more than $500 million in liquidations, while Bitcoin accounted for approximately $309 million.
The largest individual liquidation was a $48.2 million ETH-USDT long position on Binance.
These figures highlight how excessive leverage can accelerate market declines when prices move against crowded positions.
__________
Institutional investment flows are another important factor.
U.S. spot Bitcoin ETFs recorded approximately $1.28 billion in net outflows during the previous week, marking their largest weekly outflow since late June.
The funds experienced outflows on four of the five trading days, while total net outflows for 2026 reached approximately $914.1 million.
BlackRock's IBIT alone recorded around $403 million in outflows on Friday.
This suggests that institutional demand has weakened alongside the broader market correction.
__________________
Bitcoin's next moves will depend heavily on whether buyers can defend nearby support and reclaim lost resistance.
Resistance levels:
- $75,488 – 50-week moving average
- $76,000 – Short-term recovery area
- $80,000 – Major psychological resistance
Support levels:
- $74,000 – Immediate psychological support
- $73,000 – Important downside reference
- $68,000 – Further downside level if selling pressure continues
A sustained recovery above the 50-week moving average could improve market sentiment. However, continued rejection below this level may increase the possibility of another downward move.
.
The combination of weakening technical structure, substantial ETF outflows and heavy long liquidations presents a challenging environment for bullish traders.
However, the liquidation event could also reduce excessive leverage and create conditions for a more stable market if selling pressure begins to fade.
For now, traders should monitor weekly closing prices, trading volume, ETF flows and derivatives positioning rather than rushing into leveraged positions.
The key question is whether Bitcoin can reclaim its 50-week moving average or whether this breakdown develops into a deeper correction.
$BTC
#BitcoinFiveWeeklyLosses
BTC+1.28%
BLKUS+0.56%
130
·
--
Bearish
Bitcoin ETFs Record $1.28 Billion in Weekly Outflows as Institutional Selling Intensifies;
The US spot Bitcoin ETF market has experienced its largest weekly capital outflow since late June 2026, highlighting a significant shift in institutional investment sentiment.
According to the latest report, spot Bitcoin ETFs recorded approximately $1.28 billion in net outflows last week.
:
- Total ETF outflows: Approximately $1.28 billion.
- BlackRock IBIT: Accounted for roughly $1.21 billion in withdrawals.
- Fidelity FBTC: Recorded approximately $93 million in net inflows, showing that not all funds experienced selling pressure.
- October outflows: Around $515 million.
- 2026 cumulative outflows: Approximately $919 million.
?
The scale of these withdrawals suggests that institutional demand for Bitcoin exposure through ETFs has weakened considerably.
BlackRock's IBIT accounted for the overwhelming majority of the latest weekly outflows, making its fund activity particularly important to monitor.
Meanwhile, Bitcoin's price weakness adds another concern for market participants. The $74,400–$75,000 region has emerged as an important support zone.
:
If ETF outflows continue, Bitcoin could face additional selling pressure as institutional demand remains under pressure.
However, a recovery in ETF inflows could signal improving investor confidence and potentially support a market rebound.
:
- Support: $74,400–$75,000
- Key development: A sustained recovery in ETF inflows.
- Bearish signal: Continued large-scale institutional withdrawals.
:
The latest ETF figures deserve attention. Institutional capital flows are an important part of Bitcoin's market structure, and sustained withdrawals could make recovery more difficult.
However, one week of heavy outflows does not confirm a long-term bearish trend. Traders should monitor upcoming ETF flow data alongside Bitcoin's price action and trading volume.
$BTC
{future}(BTCUSDT)
#BitcoinFiveWeeklyLosses
Bitcoin ETFs Record $1.28 Billion in Weekly Outflows as Institutional Selling Intensifies;
The US spot Bitcoin ETF market has experienced its largest weekly capital outflow since late June 2026, highlighting a significant shift in institutional investment sentiment.
According to the latest report, spot Bitcoin ETFs recorded approximately $1.28 billion in net outflows last week.
:
- Total ETF outflows: Approximately $1.28 billion.
- BlackRock IBIT: Accounted for roughly $1.21 billion in withdrawals.
- Fidelity FBTC: Recorded approximately $93 million in net inflows, showing that not all funds experienced selling pressure.
- October outflows: Around $515 million.
- 2026 cumulative outflows: Approximately $919 million.
?
The scale of these withdrawals suggests that institutional demand for Bitcoin exposure through ETFs has weakened considerably.
BlackRock's IBIT accounted for the overwhelming majority of the latest weekly outflows, making its fund activity particularly important to monitor.
Meanwhile, Bitcoin's price weakness adds another concern for market participants. The $74,400–$75,000 region has emerged as an important support zone.
:
If ETF outflows continue, Bitcoin could face additional selling pressure as institutional demand remains under pressure.
However, a recovery in ETF inflows could signal improving investor confidence and potentially support a market rebound.
:
- Support: $74,400–$75,000
- Key development: A sustained recovery in ETF inflows.
- Bearish signal: Continued large-scale institutional withdrawals.
:
The latest ETF figures deserve attention. Institutional capital flows are an important part of Bitcoin's market structure, and sustained withdrawals could make recovery more difficult.
However, one week of heavy outflows does not confirm a long-term bearish trend. Traders should monitor upcoming ETF flow data alongside Bitcoin's price action and trading volume.
$BTC
#BitcoinFiveWeeklyLosses
The US spot Bitcoin ETF market has experienced its largest weekly capital outflow since late June 2026, highlighting a significant shift in institutional investment sentiment.
According to the latest report, spot Bitcoin ETFs recorded approximately $1.28 billion in net outflows last week.
:
- Total ETF outflows: Approximately $1.28 billion.
- BlackRock IBIT: Accounted for roughly $1.21 billion in withdrawals.
- Fidelity FBTC: Recorded approximately $93 million in net inflows, showing that not all funds experienced selling pressure.
- October outflows: Around $515 million.
- 2026 cumulative outflows: Approximately $919 million.
?
The scale of these withdrawals suggests that institutional demand for Bitcoin exposure through ETFs has weakened considerably.
BlackRock's IBIT accounted for the overwhelming majority of the latest weekly outflows, making its fund activity particularly important to monitor.
Meanwhile, Bitcoin's price weakness adds another concern for market participants. The $74,400–$75,000 region has emerged as an important support zone.
:
If ETF outflows continue, Bitcoin could face additional selling pressure as institutional demand remains under pressure.
However, a recovery in ETF inflows could signal improving investor confidence and potentially support a market rebound.
:
- Support: $74,400–$75,000
- Key development: A sustained recovery in ETF inflows.
- Bearish signal: Continued large-scale institutional withdrawals.
:
The latest ETF figures deserve attention. Institutional capital flows are an important part of Bitcoin's market structure, and sustained withdrawals could make recovery more difficult.
However, one week of heavy outflows does not confirm a long-term bearish trend. Traders should monitor upcoming ETF flow data alongside Bitcoin's price action and trading volume.
$BTC
#BitcoinFiveWeeklyLosses
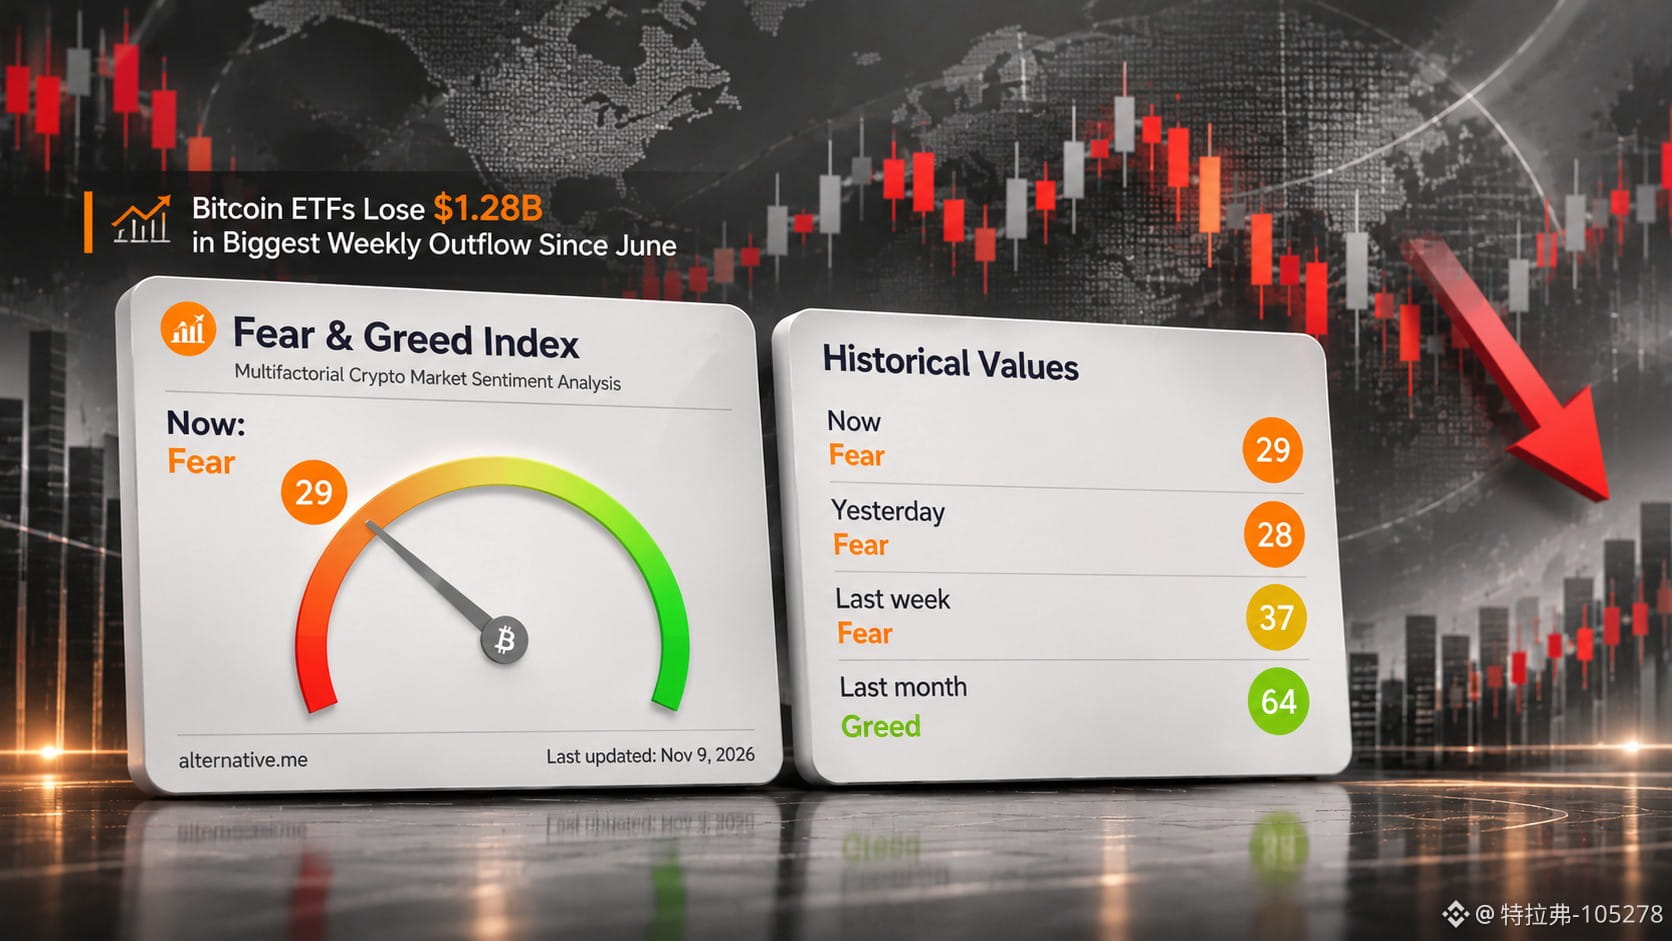
130
·
--

Article
Tesla to Refund Cybertruck Deposits as Orders Exceed Production Capacity;Tesla is facing an unusual situation with its Cybertruck program. Elon Musk says the company has more customer orders than it can fulfill before the planned production-line shutdown in mid-2027.
According to Reuters, Tesla plans to wind down Cybertruck production around June–July 2027. With the remaining production capacity unable to cover all outstanding orders, many customers are expected to receive refunds on their deposits.
__________________________?
• Musk claims existing orders exceed the number of vehicles Tesla can produce before the shutdown.
• Tesla is working to maximize Cybertruck production before the production line closes.
• Customers whose orders cannot be fulfilled within the remaining production period will receive their deposits back.
__________________________
•2024 US sales: 38,965 vehicles.
•2025 US sales: 20,237 vehicles.
•Year-over-year decline: Approximately 48%.
Musk had previously projected that Cybertruck could eventually reach annual sales of around 250,000 vehicles.
__________________________
The situation raises questions about Tesla's Cybertruck demand, production planning, and long-term strategy.
Although Musk describes demand as exceeding available production, the planned shutdown creates uncertainty about the vehicle's future manufacturing prospects.
________
This development highlights the challenges of balancing customer demand, manufacturing capacity, and production decisions in the competitive electric vehicle market.
What do you think: Is Tesla struggling with production capacity, or does the Cybertruck program need a different strategy?
$TSLA
{future}(TSLAUSDT)
#BitcoinFiveWeeklyLosses
Tesla to Refund Cybertruck Deposits as Orders Exceed Production Capacity;
Tesla is facing an unusual situation with its Cybertruck program. Elon Musk says the company has more customer orders than it can fulfill before the planned production-line shutdown in mid-2027.
According to Reuters, Tesla plans to wind down Cybertruck production around June–July 2027. With the remaining production capacity unable to cover all outstanding orders, many customers are expected to receive refunds on their deposits.
__________________________?
• Musk claims existing orders exceed the number of vehicles Tesla can produce before the shutdown.
• Tesla is working to maximize Cybertruck production before the production line closes.
• Customers whose orders cannot be fulfilled within the remaining production period will receive their deposits back.
__________________________
•2024 US sales: 38,965 vehicles.
•2025 US sales: 20,237 vehicles.
•Year-over-year decline: Approximately 48%.
Musk had previously projected that Cybertruck could eventually reach annual sales of around 250,000 vehicles.
__________________________
The situation raises questions about Tesla's Cybertruck demand, production planning, and long-term strategy.
Although Musk describes demand as exceeding available production, the planned shutdown creates uncertainty about the vehicle's future manufacturing prospects.
________
This development highlights the challenges of balancing customer demand, manufacturing capacity, and production decisions in the competitive electric vehicle market.
What do you think: Is Tesla struggling with production capacity, or does the Cybertruck program need a different strategy?
$TSLA
#BitcoinFiveWeeklyLosses
According to Reuters, Tesla plans to wind down Cybertruck production around June–July 2027. With the remaining production capacity unable to cover all outstanding orders, many customers are expected to receive refunds on their deposits.
__________________________?
• Musk claims existing orders exceed the number of vehicles Tesla can produce before the shutdown.
• Tesla is working to maximize Cybertruck production before the production line closes.
• Customers whose orders cannot be fulfilled within the remaining production period will receive their deposits back.
__________________________
•2024 US sales: 38,965 vehicles.
•2025 US sales: 20,237 vehicles.
•Year-over-year decline: Approximately 48%.
Musk had previously projected that Cybertruck could eventually reach annual sales of around 250,000 vehicles.
__________________________
The situation raises questions about Tesla's Cybertruck demand, production planning, and long-term strategy.
Although Musk describes demand as exceeding available production, the planned shutdown creates uncertainty about the vehicle's future manufacturing prospects.
________
This development highlights the challenges of balancing customer demand, manufacturing capacity, and production decisions in the competitive electric vehicle market.
What do you think: Is Tesla struggling with production capacity, or does the Cybertruck program need a different strategy?
$TSLA
#BitcoinFiveWeeklyLosses
1
970
·
--
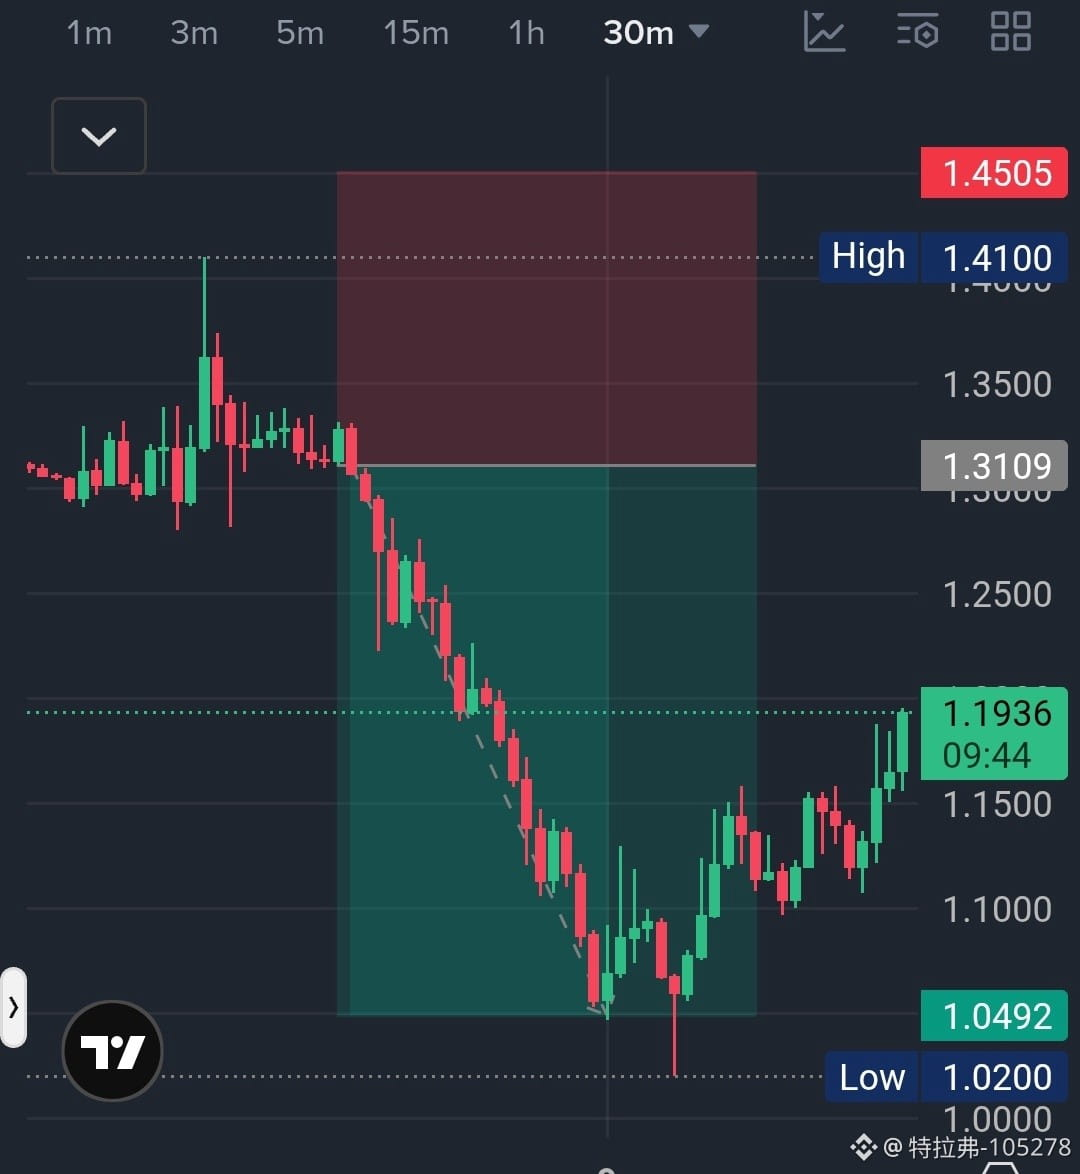
特拉弗-105278
·
--
BearishEVAA/USDT SHORT SIGNAL 🔴
The $1.35–$1.40 zone is an important resistance area. A rejection from this region could create an opportunity for another downward move.
STOP LOSS: $1.45
🎯 TAKE PROFIT TARGETS
- TP1: $1.28
- TP2: $1.24
- TP3: $1.15
- TP4: $1.10
- TP5: $1.05
________________
EVAA is showing weakening momentum after its massive rally. The 4H chart is forming lower highs, while the 1H chart indicates continued selling pressure.
⚠️ Trade Confirmation:
Wait for bearish rejection inside the entry zone before opening a position. Avoid chasing the price.
Risk Management: Use appropriate leverage and manage your position carefully. Do not risk more than you can afford to lose.
Good luck, traders! 📉
$EVAA
#BinanceReopensWithdrawalsForHYPE&APT
The $1.35–$1.40 zone is an important resistance area. A rejection from this region could create an opportunity for another downward move.
STOP LOSS: $1.45
🎯 TAKE PROFIT TARGETS
- TP1: $1.28
- TP2: $1.24
- TP3: $1.15
- TP4: $1.10
- TP5: $1.05
________________
EVAA is showing weakening momentum after its massive rally. The 4H chart is forming lower highs, while the 1H chart indicates continued selling pressure.
⚠️ Trade Confirmation:
Wait for bearish rejection inside the entry zone before opening a position. Avoid chasing the price.
Risk Management: Use appropriate leverage and manage your position carefully. Do not risk more than you can afford to lose.
Good luck, traders! 📉
$EVAA
#BinanceReopensWithdrawalsForHYPE&APT
1
1
339
·
--
Bearish
EVAA/USDT SHORT SIGNAL 🔴
The $1.35–$1.40 zone is an important resistance area. A rejection from this region could create an opportunity for another downward move.
STOP LOSS: $1.45
🎯 TAKE PROFIT TARGETS
- TP1: $1.28
- TP2: $1.24
- TP3: $1.15
- TP4: $1.10
- TP5: $1.05
________________
EVAA is showing weakening momentum after its massive rally. The 4H chart is forming lower highs, while the 1H chart indicates continued selling pressure.
⚠️ Trade Confirmation:
Wait for bearish rejection inside the entry zone before opening a position. Avoid chasing the price.
Risk Management: Use appropriate leverage and manage your position carefully. Do not risk more than you can afford to lose.
Good luck, traders! 📉
$EVAA
{future}(EVAAUSDT)
#BinanceReopensWithdrawalsForHYPE&APT
EVAA/USDT SHORT SIGNAL 🔴
The $1.35–$1.40 zone is an important resistance area. A rejection from this region could create an opportunity for another downward move.
STOP LOSS: $1.45
🎯 TAKE PROFIT TARGETS
- TP1: $1.28
- TP2: $1.24
- TP3: $1.15
- TP4: $1.10
- TP5: $1.05
________________
EVAA is showing weakening momentum after its massive rally. The 4H chart is forming lower highs, while the 1H chart indicates continued selling pressure.
⚠️ Trade Confirmation:
Wait for bearish rejection inside the entry zone before opening a position. Avoid chasing the price.
Risk Management: Use appropriate leverage and manage your position carefully. Do not risk more than you can afford to lose.
Good luck, traders! 📉
$EVAA
#BinanceReopensWithdrawalsForHYPE&APT
The $1.35–$1.40 zone is an important resistance area. A rejection from this region could create an opportunity for another downward move.
STOP LOSS: $1.45
🎯 TAKE PROFIT TARGETS
- TP1: $1.28
- TP2: $1.24
- TP3: $1.15
- TP4: $1.10
- TP5: $1.05
________________
EVAA is showing weakening momentum after its massive rally. The 4H chart is forming lower highs, while the 1H chart indicates continued selling pressure.
⚠️ Trade Confirmation:
Wait for bearish rejection inside the entry zone before opening a position. Avoid chasing the price.
Risk Management: Use appropriate leverage and manage your position carefully. Do not risk more than you can afford to lose.
Good luck, traders! 📉
$EVAA
#BinanceReopensWithdrawalsForHYPE&APT

1
5
791
·
--
Bullish
🟢 BMT/USDT — BUY Signal;
Buying momentum is improving, and a breakout above $0.02620 could trigger another upward move.
📍 ENTRY ZONE:
- Entry 1: $0.0250
- Entry 2: $0.0245
🛑 STOP LOSS: $0.0235
🎯 TAKE PROFIT TARGETS:
- TP1: $0.0270
- TP2: $0.0280
- TP3: $0.0295
- TP4: $0.0310
______________
BMT is showing signs of bullish recovery across the 1H and 4H timeframes after bouncing from the $0.01948 support area.
Key Levels to Watch:
- Support: $0.0240
- Resistance: $0.0262
- Breakout Target: $0.0280–$0.0300
⚠️ Risk Management: Avoid chasing the price. Wait for an entry confirmation and always manage your leverage.
🚀
$BMT
{future}(BMTUSDT)
#KeplrAdvisesSocialLoginUsersToTransferAssets
🟢 BMT/USDT — BUY Signal;
Buying momentum is improving, and a breakout above $0.02620 could trigger another upward move.
📍 ENTRY ZONE:
- Entry 1: $0.0250
- Entry 2: $0.0245
🛑 STOP LOSS: $0.0235
🎯 TAKE PROFIT TARGETS:
- TP1: $0.0270
- TP2: $0.0280
- TP3: $0.0295
- TP4: $0.0310
______________
BMT is showing signs of bullish recovery across the 1H and 4H timeframes after bouncing from the $0.01948 support area.
Key Levels to Watch:
- Support: $0.0240
- Resistance: $0.0262
- Breakout Target: $0.0280–$0.0300
⚠️ Risk Management: Avoid chasing the price. Wait for an entry confirmation and always manage your leverage.
🚀
$BMT
#KeplrAdvisesSocialLoginUsersToTransferAssets
Buying momentum is improving, and a breakout above $0.02620 could trigger another upward move.
📍 ENTRY ZONE:
- Entry 1: $0.0250
- Entry 2: $0.0245
🛑 STOP LOSS: $0.0235
🎯 TAKE PROFIT TARGETS:
- TP1: $0.0270
- TP2: $0.0280
- TP3: $0.0295
- TP4: $0.0310
______________
BMT is showing signs of bullish recovery across the 1H and 4H timeframes after bouncing from the $0.01948 support area.
Key Levels to Watch:
- Support: $0.0240
- Resistance: $0.0262
- Breakout Target: $0.0280–$0.0300
⚠️ Risk Management: Avoid chasing the price. Wait for an entry confirmation and always manage your leverage.
🚀
$BMT
#KeplrAdvisesSocialLoginUsersToTransferAssets
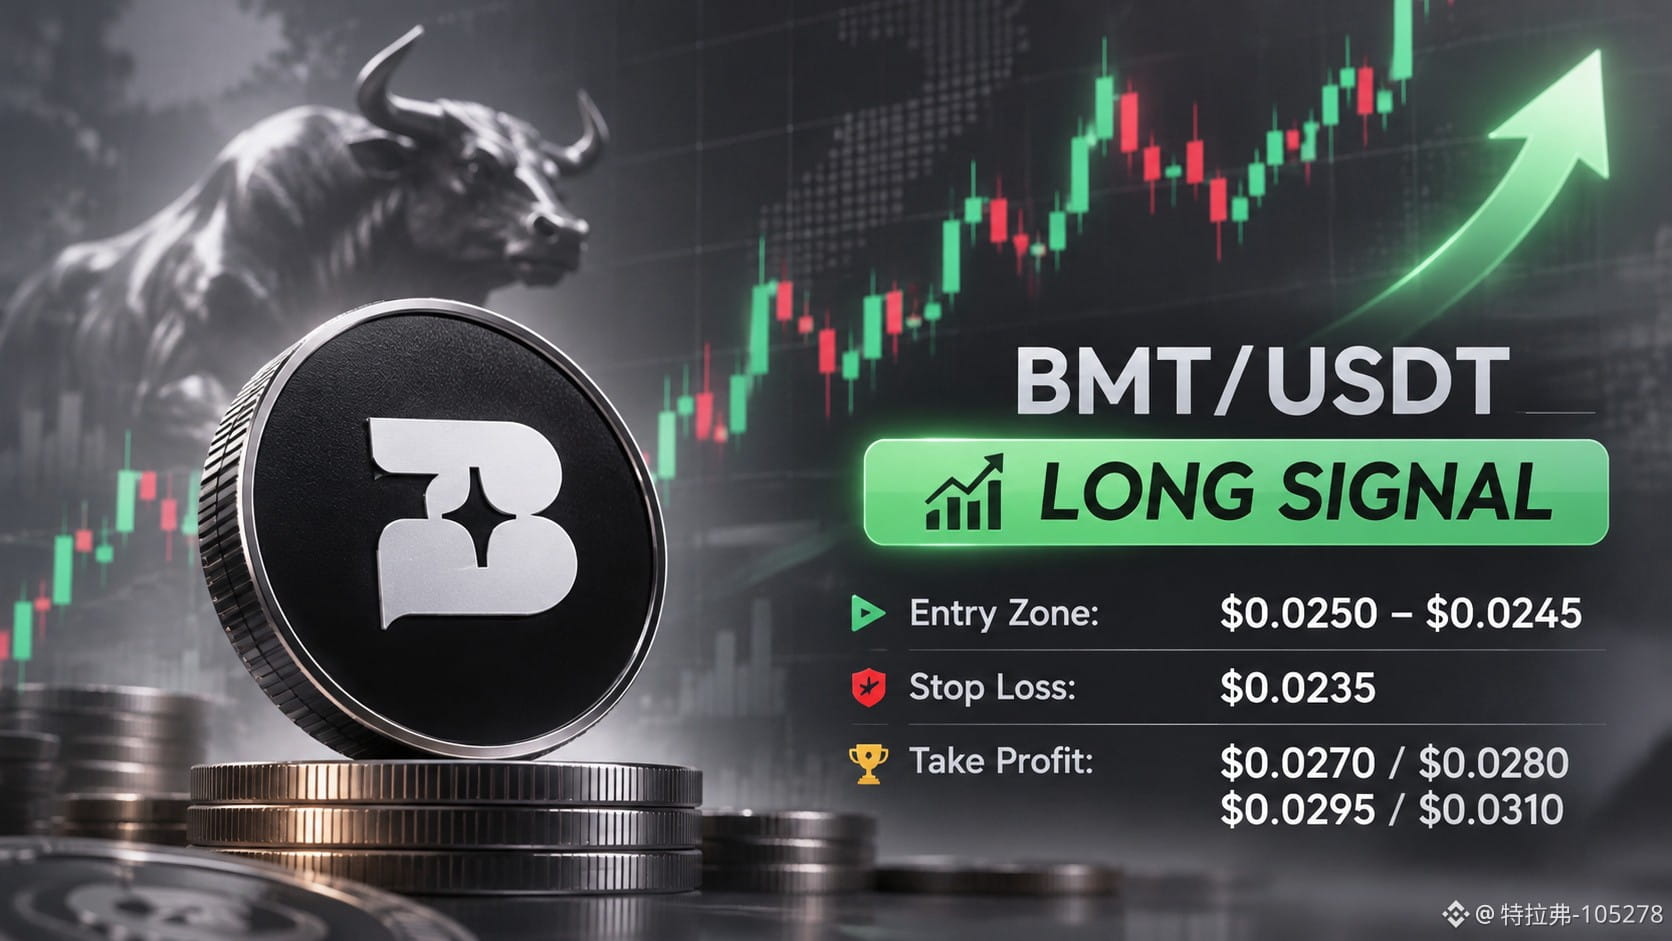
11
3
168
·
--
Bullish
$ONE 2 TP Target 🎯 Done, 3rd one Remains;
{future}(ONEUSDT)
$ONE 2 TP Target 🎯 Done, 3rd one Remains;
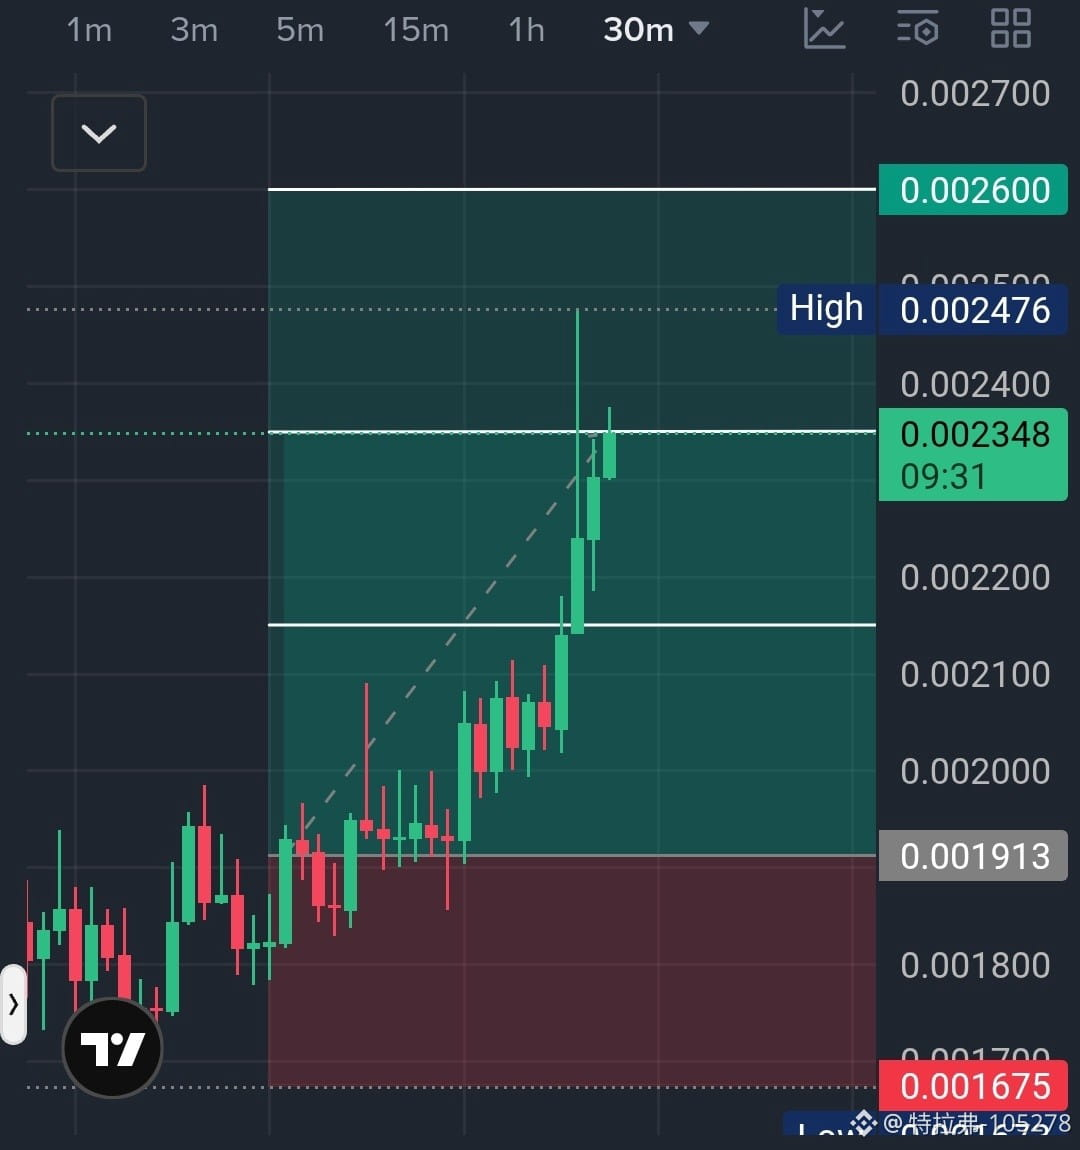
特拉弗-105278
·
--
Bullish🟢ONE/USDT — LONG SIGNAL
ONE is showing strong bullish momentum after a powerful breakout from its previous consolidation zone. Buyers have pushed the price toward $0.001968, with trading activity increasing significantly.
📊 Trade Setup
- Entry Zone: $0.00190 – $0.00197
- Stop Loss: $0.001675
🎯 Take Profit Targets
- TP1: $0.00215
- TP2: $0.00235
- TP3: $0.00260
📈 Technical Outlook
The 1H and 4H charts show strong buying pressure and bullish momentum. The daily chart also shows a significant recovery from recent lows.
The key resistance is $0.001968. A confirmed breakout above this level, followed by a successful retest, could trigger another upward move.
⚠️ Trade Confirmation: Avoid chasing the price. Enter only after breakout confirmation and a successful retest. If the price loses $0.00178 on a 4H closing basis, the bullish setup is invalidated.
Manage your risk and avoid excessive leverage.
$ONE
#JobsReportRaisesHikeOdds
ONE is showing strong bullish momentum after a powerful breakout from its previous consolidation zone. Buyers have pushed the price toward $0.001968, with trading activity increasing significantly.
📊 Trade Setup
- Entry Zone: $0.00190 – $0.00197
- Stop Loss: $0.001675
🎯 Take Profit Targets
- TP1: $0.00215
- TP2: $0.00235
- TP3: $0.00260
📈 Technical Outlook
The 1H and 4H charts show strong buying pressure and bullish momentum. The daily chart also shows a significant recovery from recent lows.
The key resistance is $0.001968. A confirmed breakout above this level, followed by a successful retest, could trigger another upward move.
⚠️ Trade Confirmation: Avoid chasing the price. Enter only after breakout confirmation and a successful retest. If the price loses $0.00178 on a 4H closing basis, the bullish setup is invalidated.
Manage your risk and avoid excessive leverage.
$ONE
#JobsReportRaisesHikeOdds
1
2
328
Log in to explore more content
Join global crypto users on Binance Square
⚡️ Get latest and useful information about crypto.
💬 Trusted by the world’s largest crypto exchange.
👍 Discover real insights from verified creators.
Email / Phone number
Trending Topics
HotCPIDecemberHikePriced
337,542 views
3,289 Discussing
CPI Market Watch | US CPI Rises 0.4% in October, Hotter Than 0.3% Forecast
Binance News
·34 Likes
·48.7k views
ZcashFallsBelow$1000ForFirstTimeSinceSeptember
11,038 views
64 Discussing
StrategyFaces$2.8BSelloffRiskFromMSCIRemoval
21,839 views
143 Discussing