
马多克斯
22 Posts
马多克斯
Report
Block User
Frequent Trader
7 Days
1 Following
0 Followers
2 Liked
Posts
·
--
The most grueling thing isn’t a sharp drop—it’s Bitcoin grinding back and forth around $78,000 all day.
It ticks up, then falls back; dips a little, then bounces back. It looks like it’s about to move, but it never goes anywhere.
This kind of market makes it easiest to get itchy fingers—constantly switching positions, chasing rallies and selling dips. You end up paying plenty in fees, and your nerves give out first.
My thinking is simple for now: until a clear direction emerges, I’ll trade less and wait for it to break out of the $77,000–$78,000 range.
Sideways trading doesn’t wear down the price—it wears down your patience.
$BTC
#比特币 #CryptoMarket
The most grueling thing isn’t a sharp drop—it’s Bitcoin grinding back and forth around $78,000 all day.
It ticks up, then falls back; dips a little, then bounces back. It looks like it’s about to move, but it never goes anywhere.
This kind of market makes it easiest to get itchy fingers—constantly switching positions, chasing rallies and selling dips. You end up paying plenty in fees, and your nerves give out first.
My thinking is simple for now: until a clear direction emerges, I’ll trade less and wait for it to break out of the $77,000–$78,000 range.
Sideways trading doesn’t wear down the price—it wears down your patience.
$BTC
#比特币 #CryptoMarket
It ticks up, then falls back; dips a little, then bounces back. It looks like it’s about to move, but it never goes anywhere.
This kind of market makes it easiest to get itchy fingers—constantly switching positions, chasing rallies and selling dips. You end up paying plenty in fees, and your nerves give out first.
My thinking is simple for now: until a clear direction emerges, I’ll trade less and wait for it to break out of the $77,000–$78,000 range.
Sideways trading doesn’t wear down the price—it wears down your patience.
$BTC
#比特币 #CryptoMarket
62
·
--
In the morning, AVAX was leading the Layer 1 pack, climbing to around $8.69.
By the afternoon, the picture had changed: Binance spot fell back to $8.56, basically right above the intraday low of $8.54.
The broader market didn’t drag it down—BTC was still holding steady around $78,000.
Put simply, the morning’s buying couldn’t hold, and afternoon selling erased the gains.
I don’t see this as a reversal signal, just a failed breakout.
First, watch whether $8.54 holds. If it doesn’t, the weakness is likely to continue;
only a move back above the intraday high of $8.98 would signal a return to strength.
$AVAX $BTC
#Avalanche #CryptoMarket
In the morning, AVAX was leading the Layer 1 pack, climbing to around $8.69.
By the afternoon, the picture had changed: Binance spot fell back to $8.56, basically right above the intraday low of $8.54.
The broader market didn’t drag it down—BTC was still holding steady around $78,000.
Put simply, the morning’s buying couldn’t hold, and afternoon selling erased the gains.
I don’t see this as a reversal signal, just a failed breakout.
First, watch whether $8.54 holds. If it doesn’t, the weakness is likely to continue;
only a move back above the intraday high of $8.98 would signal a return to strength.
$AVAX $BTC
#Avalanche #CryptoMarket
By the afternoon, the picture had changed: Binance spot fell back to $8.56, basically right above the intraday low of $8.54.
The broader market didn’t drag it down—BTC was still holding steady around $78,000.
Put simply, the morning’s buying couldn’t hold, and afternoon selling erased the gains.
I don’t see this as a reversal signal, just a failed breakout.
First, watch whether $8.54 holds. If it doesn’t, the weakness is likely to continue;
only a move back above the intraday high of $8.98 would signal a return to strength.
$AVAX $BTC
#Avalanche #CryptoMarket
284
·
--
LINK is looking interesting today: good news arrived, but the price dipped first.
On November 2, LINK was around $11.31 on Binance spot, down about 4.22% over 24 hours.
The intraday range was about $11.23 to $11.87, with the price closing near the lower end.
It is trading below the short-term moving averages: the 7-day average is about $11.41, and the 20-day average is about $11.82.
The lower Bollinger Band is around $10.88, and the price is already near the lower half of the band.
That same day, Chainlink Standard added 8 integrations across 5 service categories and 3 chains.
The list includes Anchorage, Polymarket, and S&P Global Ratings.
But the market reacted coolly: the latest LINK spot ETF flow still showed a net outflow of about $1.77 million.
I think the adoption story and short-term capital flows are pulling in opposite directions. Adoption is a slow-moving variable; capital flows are the fast-moving one.
The invalidation level is clear: a daily close above $11.59 would signal a short-term turnaround.
Conversely, a break below $10.88 could mean the weakness continues toward $10.04.
Which do you think we’ll see first: a move back above $11.59, or a break below $10.88?
$LINK $BTC $ETH
#Chainlink #CryptoMarket
LINK is looking interesting today: good news arrived, but the price dipped first.
On November 2, LINK was around $11.31 on Binance spot, down about 4.22% over 24 hours.
The intraday range was about $11.23 to $11.87, with the price closing near the lower end.
It is trading below the short-term moving averages: the 7-day average is about $11.41, and the 20-day average is about $11.82.
The lower Bollinger Band is around $10.88, and the price is already near the lower half of the band.
That same day, Chainlink Standard added 8 integrations across 5 service categories and 3 chains.
The list includes Anchorage, Polymarket, and S&P Global Ratings.
But the market reacted coolly: the latest LINK spot ETF flow still showed a net outflow of about $1.77 million.
I think the adoption story and short-term capital flows are pulling in opposite directions. Adoption is a slow-moving variable; capital flows are the fast-moving one.
The invalidation level is clear: a daily close above $11.59 would signal a short-term turnaround.
Conversely, a break below $10.88 could mean the weakness continues toward $10.04.
Which do you think we’ll see first: a move back above $11.59, or a break below $10.88?
$LINK $BTC $ETH
#Chainlink #CryptoMarket
On November 2, LINK was around $11.31 on Binance spot, down about 4.22% over 24 hours.
The intraday range was about $11.23 to $11.87, with the price closing near the lower end.
It is trading below the short-term moving averages: the 7-day average is about $11.41, and the 20-day average is about $11.82.
The lower Bollinger Band is around $10.88, and the price is already near the lower half of the band.
That same day, Chainlink Standard added 8 integrations across 5 service categories and 3 chains.
The list includes Anchorage, Polymarket, and S&P Global Ratings.
But the market reacted coolly: the latest LINK spot ETF flow still showed a net outflow of about $1.77 million.
I think the adoption story and short-term capital flows are pulling in opposite directions. Adoption is a slow-moving variable; capital flows are the fast-moving one.
The invalidation level is clear: a daily close above $11.59 would signal a short-term turnaround.
Conversely, a break below $10.88 could mean the weakness continues toward $10.04.
Which do you think we’ll see first: a move back above $11.59, or a break below $10.88?
$LINK $BTC $ETH
#Chainlink #CryptoMarket
174
·
--
Today ADA is stuck below $0.20 again
On Nov. 2, Binance spot was trading at around $0.19
It’s now below the 7-day, 20-day, 50-day, and 200-day moving averages
Those averages are between $0.20 and $0.23
In other words, every level above is resistance
Aggressive selling is still outweighing buying
taker buy/sell ratio is only 0.7691
Selling volume is about 18.44 million tokens, versus buying volume of about 14.18 million
At the same time, BTC is around $78,207 and is also below its short-term moving averages
So ADA isn’t the only one showing weakness
I think ADA is weak and moving sideways near the lows, waiting for direction rather than having already chosen one
The invalidation conditions are also clear
If the daily close gets back above $0.21, this resistance thesis is invalidated for now
If the daily close confirms a break below the $0.21 lower boundary, the $0.17 level mentioned by some analysts will become the next level to watch
Do you think ADA will get back above $0.21 first, or go test $0.17 first?
$ADA $BTC $ETH
#Cardano #CryptoMarket
Today ADA is stuck below $0.20 again
On Nov. 2, Binance spot was trading at around $0.19
It’s now below the 7-day, 20-day, 50-day, and 200-day moving averages
Those averages are between $0.20 and $0.23
In other words, every level above is resistance
Aggressive selling is still outweighing buying
taker buy/sell ratio is only 0.7691
Selling volume is about 18.44 million tokens, versus buying volume of about 14.18 million
At the same time, BTC is around $78,207 and is also below its short-term moving averages
So ADA isn’t the only one showing weakness
I think ADA is weak and moving sideways near the lows, waiting for direction rather than having already chosen one
The invalidation conditions are also clear
If the daily close gets back above $0.21, this resistance thesis is invalidated for now
If the daily close confirms a break below the $0.21 lower boundary, the $0.17 level mentioned by some analysts will become the next level to watch
Do you think ADA will get back above $0.21 first, or go test $0.17 first?
$ADA $BTC $ETH
#Cardano #CryptoMarket
On Nov. 2, Binance spot was trading at around $0.19
It’s now below the 7-day, 20-day, 50-day, and 200-day moving averages
Those averages are between $0.20 and $0.23
In other words, every level above is resistance
Aggressive selling is still outweighing buying
taker buy/sell ratio is only 0.7691
Selling volume is about 18.44 million tokens, versus buying volume of about 14.18 million
At the same time, BTC is around $78,207 and is also below its short-term moving averages
So ADA isn’t the only one showing weakness
I think ADA is weak and moving sideways near the lows, waiting for direction rather than having already chosen one
The invalidation conditions are also clear
If the daily close gets back above $0.21, this resistance thesis is invalidated for now
If the daily close confirms a break below the $0.21 lower boundary, the $0.17 level mentioned by some analysts will become the next level to watch
Do you think ADA will get back above $0.21 first, or go test $0.17 first?
$ADA $BTC $ETH
#Cardano #CryptoMarket
1
1
298
·
--
Dogecoin has been particularly frustrating today—you can tell at a glance.
On November 2, DOGE was around $0.0753, down about 0.4% over 24 hours.
That same day, BTC climbed back above roughly $78,295, up about 1.16%.
ETH was also around $2,278, up about 1.18%.
DOGE, by contrast, failed to keep pace with the broader market rebound.
Its intraday range was only about $0.0754 to $0.0761, with volatility squeezed into a very narrow band.
One analysis that day noted that both its 50-day and 200-day moving averages were above roughly $0.09.
The 14-period RSI was around 35—not yet in traditional oversold territory, but momentum was clearly weak.
I think this looks more like investors waiting for direction than having already chosen one.
The invalidation conditions are clear: DOGE closes back above around $0.09 on the daily chart, or drops below around $0.075.
Would you watch for it to break out of this narrowing range first, or wait for BTC to hold above $80,000 before taking another look at DOGE?
$DOGE $BTC $ETH
#狗狗币 #CryptoMarket
Dogecoin has been particularly frustrating today—you can tell at a glance.
On November 2, DOGE was around $0.0753, down about 0.4% over 24 hours.
That same day, BTC climbed back above roughly $78,295, up about 1.16%.
ETH was also around $2,278, up about 1.18%.
DOGE, by contrast, failed to keep pace with the broader market rebound.
Its intraday range was only about $0.0754 to $0.0761, with volatility squeezed into a very narrow band.
One analysis that day noted that both its 50-day and 200-day moving averages were above roughly $0.09.
The 14-period RSI was around 35—not yet in traditional oversold territory, but momentum was clearly weak.
I think this looks more like investors waiting for direction than having already chosen one.
The invalidation conditions are clear: DOGE closes back above around $0.09 on the daily chart, or drops below around $0.075.
Would you watch for it to break out of this narrowing range first, or wait for BTC to hold above $80,000 before taking another look at DOGE?
$DOGE $BTC $ETH
#狗狗币 #CryptoMarket
On November 2, DOGE was around $0.0753, down about 0.4% over 24 hours.
That same day, BTC climbed back above roughly $78,295, up about 1.16%.
ETH was also around $2,278, up about 1.18%.
DOGE, by contrast, failed to keep pace with the broader market rebound.
Its intraday range was only about $0.0754 to $0.0761, with volatility squeezed into a very narrow band.
One analysis that day noted that both its 50-day and 200-day moving averages were above roughly $0.09.
The 14-period RSI was around 35—not yet in traditional oversold territory, but momentum was clearly weak.
I think this looks more like investors waiting for direction than having already chosen one.
The invalidation conditions are clear: DOGE closes back above around $0.09 on the daily chart, or drops below around $0.075.
Would you watch for it to break out of this narrowing range first, or wait for BTC to hold above $80,000 before taking another look at DOGE?
$DOGE $BTC $ETH
#狗狗币 #CryptoMarket
384
·
--
XRP has run into the same wall again today.
For the fourth day in a row, the price has failed to break above the $1.26 area.
Resistance is stacked in a row: $1.26, $1.28, and $1.31.
The intraday high was $1.2646, the low was $1.2423, and the current price is around $1.25.
The exchange price gap is even more noteworthy.
According to CryptoQuant, XRP’s Coinbase Premium Index fell to around -0.16%, its lowest level in eight months.
A negative reading means the same XRP sells for less on Coinbase than on Binance.
I don’t think a single candlestick can explain this; buyers haven’t truly committed to stepping in yet.
There was also an on-chain move the same day: an address with transaction links to the Binance hacker transferred 40 million XRP, worth about $50.48 million.
The transfer itself doesn’t necessarily mean a sell-off, but near a resistance level, it’s only natural for the market to take a closer look.
The invalidation condition is clear: if XRP closes above $1.31 on the daily chart, this “hitting a wall” thesis is off the table.
On the other hand, a drop below the $1.2423 area would show that the weakness is continuing.
Which do you think will happen first: a break above $1.31 or a drop below $1.24?
$XRP $BTC $ETH
#XRP #CryptoMarket
XRP has run into the same wall again today.
For the fourth day in a row, the price has failed to break above the $1.26 area.
Resistance is stacked in a row: $1.26, $1.28, and $1.31.
The intraday high was $1.2646, the low was $1.2423, and the current price is around $1.25.
The exchange price gap is even more noteworthy.
According to CryptoQuant, XRP’s Coinbase Premium Index fell to around -0.16%, its lowest level in eight months.
A negative reading means the same XRP sells for less on Coinbase than on Binance.
I don’t think a single candlestick can explain this; buyers haven’t truly committed to stepping in yet.
There was also an on-chain move the same day: an address with transaction links to the Binance hacker transferred 40 million XRP, worth about $50.48 million.
The transfer itself doesn’t necessarily mean a sell-off, but near a resistance level, it’s only natural for the market to take a closer look.
The invalidation condition is clear: if XRP closes above $1.31 on the daily chart, this “hitting a wall” thesis is off the table.
On the other hand, a drop below the $1.2423 area would show that the weakness is continuing.
Which do you think will happen first: a break above $1.31 or a drop below $1.24?
$XRP $BTC $ETH
#XRP #CryptoMarket
For the fourth day in a row, the price has failed to break above the $1.26 area.
Resistance is stacked in a row: $1.26, $1.28, and $1.31.
The intraday high was $1.2646, the low was $1.2423, and the current price is around $1.25.
The exchange price gap is even more noteworthy.
According to CryptoQuant, XRP’s Coinbase Premium Index fell to around -0.16%, its lowest level in eight months.
A negative reading means the same XRP sells for less on Coinbase than on Binance.
I don’t think a single candlestick can explain this; buyers haven’t truly committed to stepping in yet.
There was also an on-chain move the same day: an address with transaction links to the Binance hacker transferred 40 million XRP, worth about $50.48 million.
The transfer itself doesn’t necessarily mean a sell-off, but near a resistance level, it’s only natural for the market to take a closer look.
The invalidation condition is clear: if XRP closes above $1.31 on the daily chart, this “hitting a wall” thesis is off the table.
On the other hand, a drop below the $1.2423 area would show that the weakness is continuing.
Which do you think will happen first: a break above $1.31 or a drop below $1.24?
$XRP $BTC $ETH
#XRP #CryptoMarket
77
·
--
When the broader market is up just 1%, one coin has surged more than 8% in a single day. Did you notice?
According to CoinMarketCap data on the morning of November 2, Korea time, TRUMP was up 8.43%—the biggest gainer among the top 100 coins by market cap.
At the same time, BTC rose 1.16% to $78,295 and ETH gained 1.18% to $2,278. Major coins were only showing a modest recovery.
The more interesting comparison: SoSoValue data showed the Meme sector was still down 0.25% overall, while TRUMP briefly surged 10.16% intraday.
In other words, it’s not the Meme sector rising as a whole—TRUMP is moving against the sector.
I think this looks more like short-term capital seeking volatility than a sign that the market is strengthening across the board.
After all, TRUMP has already fallen about 98% from its previous high, and today’s gains aren’t enough to reverse the trend.
The invalidation condition is clear: if TRUMP’s gains quickly narrow and it falls back to the sector average, this divergence will no longer hold.
Which do you favor: TRUMP continuing to lead the gains, or the broader market reclaiming the top spot?
$TRUMP $BTC $ETH
#TRUMP #CryptoMarket
When the broader market is up just 1%, one coin has surged more than 8% in a single day. Did you notice?
According to CoinMarketCap data on the morning of November 2, Korea time, TRUMP was up 8.43%—the biggest gainer among the top 100 coins by market cap.
At the same time, BTC rose 1.16% to $78,295 and ETH gained 1.18% to $2,278. Major coins were only showing a modest recovery.
The more interesting comparison: SoSoValue data showed the Meme sector was still down 0.25% overall, while TRUMP briefly surged 10.16% intraday.
In other words, it’s not the Meme sector rising as a whole—TRUMP is moving against the sector.
I think this looks more like short-term capital seeking volatility than a sign that the market is strengthening across the board.
After all, TRUMP has already fallen about 98% from its previous high, and today’s gains aren’t enough to reverse the trend.
The invalidation condition is clear: if TRUMP’s gains quickly narrow and it falls back to the sector average, this divergence will no longer hold.
Which do you favor: TRUMP continuing to lead the gains, or the broader market reclaiming the top spot?
$TRUMP $BTC $ETH
#TRUMP #CryptoMarket
According to CoinMarketCap data on the morning of November 2, Korea time, TRUMP was up 8.43%—the biggest gainer among the top 100 coins by market cap.
At the same time, BTC rose 1.16% to $78,295 and ETH gained 1.18% to $2,278. Major coins were only showing a modest recovery.
The more interesting comparison: SoSoValue data showed the Meme sector was still down 0.25% overall, while TRUMP briefly surged 10.16% intraday.
In other words, it’s not the Meme sector rising as a whole—TRUMP is moving against the sector.
I think this looks more like short-term capital seeking volatility than a sign that the market is strengthening across the board.
After all, TRUMP has already fallen about 98% from its previous high, and today’s gains aren’t enough to reverse the trend.
The invalidation condition is clear: if TRUMP’s gains quickly narrow and it falls back to the sector average, this divergence will no longer hold.
Which do you favor: TRUMP continuing to lead the gains, or the broader market reclaiming the top spot?
$TRUMP $BTC $ETH
#TRUMP #CryptoMarket
372
·
--
The broader market is recovering today, but BTC isn’t leading the gains.
Data as of 9:00 a.m. Korea time on November 2: BTC is up 1.16% at $78,295.
ETH is up 1.18% to $2,278, broadly keeping pace with the market.
TRX, however, is up 3.42% to $0.3128, clearly outperforming BTC and ETH.
Over the same period, SOL is down 0.82% at $94.57, while XRP has edged down 0.01% to $1.24.
DOGE has barely moved, at $0.07551, up just 0.01%.
I don’t think this is a broad-based recovery. Rather, funds are favoring the major coin with steadier gains.
Against the broader market, TRX’s gains stand out even more.
This outlook would be invalidated if TRX’s gains narrow or turn negative while BTC falls back below $78,000.
If both signals appear at the same time, then the claim that TRX is leading today no longer holds.
Which side are you more bullish on: TRX continuing to lead, or BTC reclaiming the top spot for gains?
$TRX $BTC $SOL
#波场 #CryptoMarket
The broader market is recovering today, but BTC isn’t leading the gains.
Data as of 9:00 a.m. Korea time on November 2: BTC is up 1.16% at $78,295.
ETH is up 1.18% to $2,278, broadly keeping pace with the market.
TRX, however, is up 3.42% to $0.3128, clearly outperforming BTC and ETH.
Over the same period, SOL is down 0.82% at $94.57, while XRP has edged down 0.01% to $1.24.
DOGE has barely moved, at $0.07551, up just 0.01%.
I don’t think this is a broad-based recovery. Rather, funds are favoring the major coin with steadier gains.
Against the broader market, TRX’s gains stand out even more.
This outlook would be invalidated if TRX’s gains narrow or turn negative while BTC falls back below $78,000.
If both signals appear at the same time, then the claim that TRX is leading today no longer holds.
Which side are you more bullish on: TRX continuing to lead, or BTC reclaiming the top spot for gains?
$TRX $BTC $SOL
#波场 #CryptoMarket
Data as of 9:00 a.m. Korea time on November 2: BTC is up 1.16% at $78,295.
ETH is up 1.18% to $2,278, broadly keeping pace with the market.
TRX, however, is up 3.42% to $0.3128, clearly outperforming BTC and ETH.
Over the same period, SOL is down 0.82% at $94.57, while XRP has edged down 0.01% to $1.24.
DOGE has barely moved, at $0.07551, up just 0.01%.
I don’t think this is a broad-based recovery. Rather, funds are favoring the major coin with steadier gains.
Against the broader market, TRX’s gains stand out even more.
This outlook would be invalidated if TRX’s gains narrow or turn negative while BTC falls back below $78,000.
If both signals appear at the same time, then the claim that TRX is leading today no longer holds.
Which side are you more bullish on: TRX continuing to lead, or BTC reclaiming the top spot for gains?
$TRX $BTC $SOL
#波场 #CryptoMarket
314
·
--
This rebound has been uneven: the gap between the leaders and the laggards has become especially clear today.
In early trading today, ZEC led the large-cap market, gaining about 3% to nearly $1,280.
At the same time, BTC returned to around $78,600, up about 1%.
ETH climbed back above $2,300, up about 2%.
SOL, meanwhile, was still hovering around $95, essentially unchanged.
There’s something interesting about this mix: the broader market is stabilizing, but money isn’t being spread evenly across every coin.
I think this looks more like capital picking its direction than a sign of a broad recovery.
If the leading coins are only seeing a one-day spike, the excitement will fade quickly.
So watch for follow-through rather than focusing only on today’s gains.
The invalidation conditions are clear: if ZEC’s gains are erased while BTC falls back below $78,000, this view of market divergence no longer holds.
Next, watch two things: whether the leaders can hold their gains, and whether BTC can stay above $78,000.
Would you chase today’s leaders, or wait for BTC to hold above $80,000 before making a move?
$ZEC $BTC $SOL
#zcash #加密市场
This rebound has been uneven: the gap between the leaders and the laggards has become especially clear today.
In early trading today, ZEC led the large-cap market, gaining about 3% to nearly $1,280.
At the same time, BTC returned to around $78,600, up about 1%.
ETH climbed back above $2,300, up about 2%.
SOL, meanwhile, was still hovering around $95, essentially unchanged.
There’s something interesting about this mix: the broader market is stabilizing, but money isn’t being spread evenly across every coin.
I think this looks more like capital picking its direction than a sign of a broad recovery.
If the leading coins are only seeing a one-day spike, the excitement will fade quickly.
So watch for follow-through rather than focusing only on today’s gains.
The invalidation conditions are clear: if ZEC’s gains are erased while BTC falls back below $78,000, this view of market divergence no longer holds.
Next, watch two things: whether the leaders can hold their gains, and whether BTC can stay above $78,000.
Would you chase today’s leaders, or wait for BTC to hold above $80,000 before making a move?
$ZEC $BTC $SOL
#zcash #加密市场
In early trading today, ZEC led the large-cap market, gaining about 3% to nearly $1,280.
At the same time, BTC returned to around $78,600, up about 1%.
ETH climbed back above $2,300, up about 2%.
SOL, meanwhile, was still hovering around $95, essentially unchanged.
There’s something interesting about this mix: the broader market is stabilizing, but money isn’t being spread evenly across every coin.
I think this looks more like capital picking its direction than a sign of a broad recovery.
If the leading coins are only seeing a one-day spike, the excitement will fade quickly.
So watch for follow-through rather than focusing only on today’s gains.
The invalidation conditions are clear: if ZEC’s gains are erased while BTC falls back below $78,000, this view of market divergence no longer holds.
Next, watch two things: whether the leaders can hold their gains, and whether BTC can stay above $78,000.
Would you chase today’s leaders, or wait for BTC to hold above $80,000 before making a move?
$ZEC $BTC $SOL
#zcash #加密市场
6
·
--
A whale bought 18,600 ETH in two hours—the giant is making another move.
A Nov. 2 update reported that a whale or institution bought 18,643.42 ETH within two hours at an average price of about $2,274.
At today's price of around $2,293, the position is currently only slightly in the green—not exactly a huge profit.
Interestingly, ETH fell 16.06% in October, its worst October performance since 2016.
In other words, this purchase came after a sharp monthly drop. It wasn't chasing the rally; it looks more like buying the dip.
I think a whale willing to buy this much at this level isn't too worried about short-term volatility and is more focused on the opportunity created by the drop.
But that doesn't mean the market is about to reverse. Whales can buy too early and end up holding losses, so blindly copying them is risky.
The invalidation point is clear: if ETH falls below the $2,274 average entry price for this batch, or even drops back below $2,250, then this dip-buying attempt should be considered a failure for now.
Conversely, as long as it holds above $2,274, the idea that the price is stabilizing after the drop remains plausible.
Which side would you choose: follow the whale and look for a rebound as the price stabilizes, or wait until it breaks below
$2,274 before deciding?
$ETH $BTC $SOL
#以太坊突破2300美元 #巨鲸动向
A whale bought 18,600 ETH in two hours—the giant is making another move.
A Nov. 2 update reported that a whale or institution bought 18,643.42 ETH within two hours at an average price of about $2,274.
At today's price of around $2,293, the position is currently only slightly in the green—not exactly a huge profit.
Interestingly, ETH fell 16.06% in October, its worst October performance since 2016.
In other words, this purchase came after a sharp monthly drop. It wasn't chasing the rally; it looks more like buying the dip.
I think a whale willing to buy this much at this level isn't too worried about short-term volatility and is more focused on the opportunity created by the drop.
But that doesn't mean the market is about to reverse. Whales can buy too early and end up holding losses, so blindly copying them is risky.
The invalidation point is clear: if ETH falls below the $2,274 average entry price for this batch, or even drops back below $2,250, then this dip-buying attempt should be considered a failure for now.
Conversely, as long as it holds above $2,274, the idea that the price is stabilizing after the drop remains plausible.
Which side would you choose: follow the whale and look for a rebound as the price stabilizes, or wait until it breaks below
$2,274 before deciding?
$ETH $BTC $SOL
#以太坊突破2300美元 #巨鲸动向
A Nov. 2 update reported that a whale or institution bought 18,643.42 ETH within two hours at an average price of about $2,274.
At today's price of around $2,293, the position is currently only slightly in the green—not exactly a huge profit.
Interestingly, ETH fell 16.06% in October, its worst October performance since 2016.
In other words, this purchase came after a sharp monthly drop. It wasn't chasing the rally; it looks more like buying the dip.
I think a whale willing to buy this much at this level isn't too worried about short-term volatility and is more focused on the opportunity created by the drop.
But that doesn't mean the market is about to reverse. Whales can buy too early and end up holding losses, so blindly copying them is risky.
The invalidation point is clear: if ETH falls below the $2,274 average entry price for this batch, or even drops back below $2,250, then this dip-buying attempt should be considered a failure for now.
Conversely, as long as it holds above $2,274, the idea that the price is stabilizing after the drop remains plausible.
Which side would you choose: follow the whale and look for a rebound as the price stabilizes, or wait until it breaks below
$2,274 before deciding?
$ETH $BTC $SOL
#以太坊突破2300美元 #巨鲸动向
139
·
--
Verified
Today, Binance is set to deliver an answer the entire market is waiting for.
On November 2, Binance plans to publish its full proof of reserves.
After the October 29 hack, what the market fears most isn’t a price drop—it’s not knowing how much is left in the accounts.
The data from November 1 offers an initial point of reference.
From 14:00 to 23:30 that day, $4.649 billion was withdrawn and $1.01 billion was deposited.
Net outflows were about $3.64 billion, or 2.10% of total assets worth $171 billion.
Binance said withdrawal volumes surged initially, then fell back and stabilized.
A new proof-of-reserves snapshot was completed at 8:00 on October 31.
In my view, the key isn’t the net outflows themselves, but whether today’s report matches the snapshot.
If the report is complete and its methodology is clear, there’ll be one less reason to panic.
If it’s vague, delayed, or inconsistent in its methodology, rebuilding trust will take longer.
As for prices, BTC is around $78,223, ETH around $2,271, and SOL around $94.27.
The invalidation condition is clear: if a complete report isn’t published today, or the data clearly doesn’t match what was said before, my assessment is no longer valid.
Which matters more to you: whether the report itself is complete
, or whether prices can hold steady first?
$BNB $BTC $ETH
#币安 #储备证明
Today, Binance is set to deliver an answer the entire market is waiting for.
On November 2, Binance plans to publish its full proof of reserves.
After the October 29 hack, what the market fears most isn’t a price drop—it’s not knowing how much is left in the accounts.
The data from November 1 offers an initial point of reference.
From 14:00 to 23:30 that day, $4.649 billion was withdrawn and $1.01 billion was deposited.
Net outflows were about $3.64 billion, or 2.10% of total assets worth $171 billion.
Binance said withdrawal volumes surged initially, then fell back and stabilized.
A new proof-of-reserves snapshot was completed at 8:00 on October 31.
In my view, the key isn’t the net outflows themselves, but whether today’s report matches the snapshot.
If the report is complete and its methodology is clear, there’ll be one less reason to panic.
If it’s vague, delayed, or inconsistent in its methodology, rebuilding trust will take longer.
As for prices, BTC is around $78,223, ETH around $2,271, and SOL around $94.27.
The invalidation condition is clear: if a complete report isn’t published today, or the data clearly doesn’t match what was said before, my assessment is no longer valid.
Which matters more to you: whether the report itself is complete
, or whether prices can hold steady first?
$BNB $BTC $ETH
#币安 #储备证明
On November 2, Binance plans to publish its full proof of reserves.
After the October 29 hack, what the market fears most isn’t a price drop—it’s not knowing how much is left in the accounts.
The data from November 1 offers an initial point of reference.
From 14:00 to 23:30 that day, $4.649 billion was withdrawn and $1.01 billion was deposited.
Net outflows were about $3.64 billion, or 2.10% of total assets worth $171 billion.
Binance said withdrawal volumes surged initially, then fell back and stabilized.
A new proof-of-reserves snapshot was completed at 8:00 on October 31.
In my view, the key isn’t the net outflows themselves, but whether today’s report matches the snapshot.
If the report is complete and its methodology is clear, there’ll be one less reason to panic.
If it’s vague, delayed, or inconsistent in its methodology, rebuilding trust will take longer.
As for prices, BTC is around $78,223, ETH around $2,271, and SOL around $94.27.
The invalidation condition is clear: if a complete report isn’t published today, or the data clearly doesn’t match what was said before, my assessment is no longer valid.
Which matters more to you: whether the report itself is complete
, or whether prices can hold steady first?
$BNB $BTC $ETH
#币安 #储备证明
384
·
--
SOL underperformed the market again today, and its weakness is becoming hard to ignore.
SOL was around $94 this morning, down about 1.9% on the day.
It has fallen about 7% to 8% over the past 7 days and about 22% over the past 30 days.
Over the same periods, BTC fell only about 3.5% and ETH about 4%—a stark difference.
During the week of October 26 to 30, SOL spot ETFs saw net outflows of about $71.5 million.
Investors are voting with their feet; this can't be explained away as mere sentiment.
I think SOL is still in a weak short-term structure. Don't rush to buy the dip before funds start flowing back in.
First, watch whether it can hold around $94. A move back above $96 would be a sign of recovery.
The invalidation point is simple: if it falls below around $93, the weakness is likely to continue.
Would you wait for it to reclaim $96 before taking another look, or step aside if it breaks below $93?
$SOL $BTC $ETH
#Solana #CryptoMarket
SOL underperformed the market again today, and its weakness is becoming hard to ignore.
SOL was around $94 this morning, down about 1.9% on the day.
It has fallen about 7% to 8% over the past 7 days and about 22% over the past 30 days.
Over the same periods, BTC fell only about 3.5% and ETH about 4%—a stark difference.
During the week of October 26 to 30, SOL spot ETFs saw net outflows of about $71.5 million.
Investors are voting with their feet; this can't be explained away as mere sentiment.
I think SOL is still in a weak short-term structure. Don't rush to buy the dip before funds start flowing back in.
First, watch whether it can hold around $94. A move back above $96 would be a sign of recovery.
The invalidation point is simple: if it falls below around $93, the weakness is likely to continue.
Would you wait for it to reclaim $96 before taking another look, or step aside if it breaks below $93?
$SOL $BTC $ETH
#Solana #CryptoMarket
SOL was around $94 this morning, down about 1.9% on the day.
It has fallen about 7% to 8% over the past 7 days and about 22% over the past 30 days.
Over the same periods, BTC fell only about 3.5% and ETH about 4%—a stark difference.
During the week of October 26 to 30, SOL spot ETFs saw net outflows of about $71.5 million.
Investors are voting with their feet; this can't be explained away as mere sentiment.
I think SOL is still in a weak short-term structure. Don't rush to buy the dip before funds start flowing back in.
First, watch whether it can hold around $94. A move back above $96 would be a sign of recovery.
The invalidation point is simple: if it falls below around $93, the weakness is likely to continue.
Would you wait for it to reclaim $96 before taking another look, or step aside if it breaks below $93?
$SOL $BTC $ETH
#Solana #CryptoMarket
264
·
--
While everyone was watching Bitcoin fall below $78,000, I first took a look at last week’s winners.
The result was a bit surprising: Bitcoin fell 3.1% over the week, closing near $77,874.
Meanwhile, Hyperliquid’s HYPE rose 15.3% over the week, closing near $88.13.
It wasn’t driven by a one-day surge—it outperformed the broader market all week.
The backdrop isn’t hard to understand: on October 29, news emerged that ICE and trade[XYZ] were planning to use Hyperliquid for a U.S.-compliant perpetuals market.
But the plan hasn’t received regulatory approval yet, so for now it’s only a proposed direction, not a reality.
I think this move is more about money seeking out a few assets with a compelling story in a weak market than a broad-based market rebound.
So don’t just look at the gains—watch whether it can hold above the line between strength and weakness.
My invalidation condition is simple: if the daily close falls below $82.62, this countertrend thesis is off the table for now.
Until then, it remains this week’s most interesting countertrend example to watch.
After that, don’t keep giving it credit based on last week’s story.
What would you choose: keep watching HYPE’s countertrend move, or wait for Bitcoin to stabilize first?$HYPE $BTC $ETH
#Hyperliquid #Cryptocurrency
While everyone was watching Bitcoin fall below $78,000, I first took a look at last week’s winners.
The result was a bit surprising: Bitcoin fell 3.1% over the week, closing near $77,874.
Meanwhile, Hyperliquid’s HYPE rose 15.3% over the week, closing near $88.13.
It wasn’t driven by a one-day surge—it outperformed the broader market all week.
The backdrop isn’t hard to understand: on October 29, news emerged that ICE and trade[XYZ] were planning to use Hyperliquid for a U.S.-compliant perpetuals market.
But the plan hasn’t received regulatory approval yet, so for now it’s only a proposed direction, not a reality.
I think this move is more about money seeking out a few assets with a compelling story in a weak market than a broad-based market rebound.
So don’t just look at the gains—watch whether it can hold above the line between strength and weakness.
My invalidation condition is simple: if the daily close falls below $82.62, this countertrend thesis is off the table for now.
Until then, it remains this week’s most interesting countertrend example to watch.
After that, don’t keep giving it credit based on last week’s story.
What would you choose: keep watching HYPE’s countertrend move, or wait for Bitcoin to stabilize first?$HYPE $BTC $ETH
#Hyperliquid #Cryptocurrency
The result was a bit surprising: Bitcoin fell 3.1% over the week, closing near $77,874.
Meanwhile, Hyperliquid’s HYPE rose 15.3% over the week, closing near $88.13.
It wasn’t driven by a one-day surge—it outperformed the broader market all week.
The backdrop isn’t hard to understand: on October 29, news emerged that ICE and trade[XYZ] were planning to use Hyperliquid for a U.S.-compliant perpetuals market.
But the plan hasn’t received regulatory approval yet, so for now it’s only a proposed direction, not a reality.
I think this move is more about money seeking out a few assets with a compelling story in a weak market than a broad-based market rebound.
So don’t just look at the gains—watch whether it can hold above the line between strength and weakness.
My invalidation condition is simple: if the daily close falls below $82.62, this countertrend thesis is off the table for now.
Until then, it remains this week’s most interesting countertrend example to watch.
After that, don’t keep giving it credit based on last week’s story.
What would you choose: keep watching HYPE’s countertrend move, or wait for Bitcoin to stabilize first?$HYPE $BTC $ETH
#Hyperliquid #Cryptocurrency
373
·
--
ETH spot ETFs have seen outflows for five straight days, yet the price hasn’t collapsed. That contrast is worth watching.
Yesterday saw a net outflow of $156 million, marking the fifth consecutive day of outflows.
But ETH is still hovering around $2,261 today. It opened at $2,254, reached an intraday high of $2,278 and a low of $2,247, and is up about 0.28%.
At the same time, ETH/BTC is at 0.02898, with ETH outperforming BTC by about 1.5% on the day.
I think this suggests the selling pressure is mainly coming from ETF redemptions, rather than a broad-based capitulation in spot markets.
If this is just a rotation of funds, ETH holding around $2,247 would leave room for another attempt to move above $2,278.
The invalidation condition is clear too: if it falls below $2,247 and can’t recover, the case for resilience no longer holds.
Then we’ll see whether ETF outflows ease or whether further losses follow the breakdown.
Which would you choose: wait for ETF outflows to ease, or exit if ETH breaks below $2,247?
$ETH $BTC $SOL
#以太坊 #ETF
ETH spot ETFs have seen outflows for five straight days, yet the price hasn’t collapsed. That contrast is worth watching.
Yesterday saw a net outflow of $156 million, marking the fifth consecutive day of outflows.
But ETH is still hovering around $2,261 today. It opened at $2,254, reached an intraday high of $2,278 and a low of $2,247, and is up about 0.28%.
At the same time, ETH/BTC is at 0.02898, with ETH outperforming BTC by about 1.5% on the day.
I think this suggests the selling pressure is mainly coming from ETF redemptions, rather than a broad-based capitulation in spot markets.
If this is just a rotation of funds, ETH holding around $2,247 would leave room for another attempt to move above $2,278.
The invalidation condition is clear too: if it falls below $2,247 and can’t recover, the case for resilience no longer holds.
Then we’ll see whether ETF outflows ease or whether further losses follow the breakdown.
Which would you choose: wait for ETF outflows to ease, or exit if ETH breaks below $2,247?
$ETH $BTC $SOL
#以太坊 #ETF
Yesterday saw a net outflow of $156 million, marking the fifth consecutive day of outflows.
But ETH is still hovering around $2,261 today. It opened at $2,254, reached an intraday high of $2,278 and a low of $2,247, and is up about 0.28%.
At the same time, ETH/BTC is at 0.02898, with ETH outperforming BTC by about 1.5% on the day.
I think this suggests the selling pressure is mainly coming from ETF redemptions, rather than a broad-based capitulation in spot markets.
If this is just a rotation of funds, ETH holding around $2,247 would leave room for another attempt to move above $2,278.
The invalidation condition is clear too: if it falls below $2,247 and can’t recover, the case for resilience no longer holds.
Then we’ll see whether ETF outflows ease or whether further losses follow the breakdown.
Which would you choose: wait for ETF outflows to ease, or exit if ETH breaks below $2,247?
$ETH $BTC $SOL
#以太坊 #ETF
34
·
--
SOL funds have been moving in two opposite directions over the past two days.
On October 31, Whale Alert reported that two unknown wallets transferred SOL to Coinbase Prime.
One transfer was worth about $58.5 million, the other about $52.7 million, for a combined total of roughly $111.2 million.
In the opposite direction, on October 30, a newly created wallet withdrew about $6.7 million worth of SOL from OKX, Kraken, and Bybit and moved it into self-custody.
Some funds are going into institutional custody, while others are being withdrawn into holders’ own hands.
Meanwhile, U.S. SOL ETFs saw net outflows of $71.5 million over the five days from October 26 to 30. Outflows on the 27th alone totaled $19.16 million, the largest single-day outflow since December 3, 2025.
As of the afternoon of November 1, SOL was trading at about $94.62, down 6.8% over seven days and 21.1% over 30 days.
I don’t think this is panic in just one direction. It looks more like big money is reconsidering where to hold its assets.
Invalidation condition: If SOL falls below $90 and ETF outflows continue to grow, this view is invalidated.
Which side do you favor: is institutional custody the signal, or is self-custody?
$SOL $BTC $ETH
#Solana #加密市场
SOL funds have been moving in two opposite directions over the past two days.
On October 31, Whale Alert reported that two unknown wallets transferred SOL to Coinbase Prime.
One transfer was worth about $58.5 million, the other about $52.7 million, for a combined total of roughly $111.2 million.
In the opposite direction, on October 30, a newly created wallet withdrew about $6.7 million worth of SOL from OKX, Kraken, and Bybit and moved it into self-custody.
Some funds are going into institutional custody, while others are being withdrawn into holders’ own hands.
Meanwhile, U.S. SOL ETFs saw net outflows of $71.5 million over the five days from October 26 to 30. Outflows on the 27th alone totaled $19.16 million, the largest single-day outflow since December 3, 2025.
As of the afternoon of November 1, SOL was trading at about $94.62, down 6.8% over seven days and 21.1% over 30 days.
I don’t think this is panic in just one direction. It looks more like big money is reconsidering where to hold its assets.
Invalidation condition: If SOL falls below $90 and ETF outflows continue to grow, this view is invalidated.
Which side do you favor: is institutional custody the signal, or is self-custody?
$SOL $BTC $ETH
#Solana #加密市场
On October 31, Whale Alert reported that two unknown wallets transferred SOL to Coinbase Prime.
One transfer was worth about $58.5 million, the other about $52.7 million, for a combined total of roughly $111.2 million.
In the opposite direction, on October 30, a newly created wallet withdrew about $6.7 million worth of SOL from OKX, Kraken, and Bybit and moved it into self-custody.
Some funds are going into institutional custody, while others are being withdrawn into holders’ own hands.
Meanwhile, U.S. SOL ETFs saw net outflows of $71.5 million over the five days from October 26 to 30. Outflows on the 27th alone totaled $19.16 million, the largest single-day outflow since December 3, 2025.
As of the afternoon of November 1, SOL was trading at about $94.62, down 6.8% over seven days and 21.1% over 30 days.
I don’t think this is panic in just one direction. It looks more like big money is reconsidering where to hold its assets.
Invalidation condition: If SOL falls below $90 and ETF outflows continue to grow, this view is invalidated.
Which side do you favor: is institutional custody the signal, or is self-custody?
$SOL $BTC $ETH
#Solana #加密市场
183
·
--
Binance processed $4.65 billion in withdrawals in one day. Was this a bank run, or was the system undergoing a stress test?
After Binance restored withdrawals, it processed $4.65 billion in withdrawals, with net outflows of $3.64 billion.
That figure represents 2.1% of its total assets of $171 billion.
$4.65 billion may sound alarming on its own, but viewed against the total of $171 billion, the story looks completely different.
On the same day, withdrawals were restored on 15 networks in the first phase.
A 2.1% fluctuation in a single day is hardly out of control for any major platform.
I think this looks more like a return to normal after a concentrated wave of withdrawals than a solvency crisis at the platform itself.
The key is not the total amount withdrawn, but whether withdrawal channels can continue to come back online.
If network restoration stalls or withdrawals are suspended on a large scale again, then my assessment will no longer hold.
Which way would you see it: as a stress test passed, or as a sign that the risk isn't over yet?$BNB $ETH $USDT
#币安已处理46.5亿美元提款
Binance processed $4.65 billion in withdrawals in one day. Was this a bank run, or was the system undergoing a stress test?
After Binance restored withdrawals, it processed $4.65 billion in withdrawals, with net outflows of $3.64 billion.
That figure represents 2.1% of its total assets of $171 billion.
$4.65 billion may sound alarming on its own, but viewed against the total of $171 billion, the story looks completely different.
On the same day, withdrawals were restored on 15 networks in the first phase.
A 2.1% fluctuation in a single day is hardly out of control for any major platform.
I think this looks more like a return to normal after a concentrated wave of withdrawals than a solvency crisis at the platform itself.
The key is not the total amount withdrawn, but whether withdrawal channels can continue to come back online.
If network restoration stalls or withdrawals are suspended on a large scale again, then my assessment will no longer hold.
Which way would you see it: as a stress test passed, or as a sign that the risk isn't over yet?$BNB $ETH $USDT
#币安已处理46.5亿美元提款
After Binance restored withdrawals, it processed $4.65 billion in withdrawals, with net outflows of $3.64 billion.
That figure represents 2.1% of its total assets of $171 billion.
$4.65 billion may sound alarming on its own, but viewed against the total of $171 billion, the story looks completely different.
On the same day, withdrawals were restored on 15 networks in the first phase.
A 2.1% fluctuation in a single day is hardly out of control for any major platform.
I think this looks more like a return to normal after a concentrated wave of withdrawals than a solvency crisis at the platform itself.
The key is not the total amount withdrawn, but whether withdrawal channels can continue to come back online.
If network restoration stalls or withdrawals are suspended on a large scale again, then my assessment will no longer hold.
Which way would you see it: as a stress test passed, or as a sign that the risk isn't over yet?$BNB $ETH $USDT
#币安已处理46.5亿美元提款
212
·
--
SOL is lagging a bit today—have you noticed?
BTC is back above $78,000 and ETH has climbed above $2,270, but SOL is still hovering around $95, down about 1% over the past 24 hours.
Even more striking are the October figures: U.S. spot SOL ETFs saw $143.7 million in outflows for the month, their largest monthly outflow since launching last October.
But on-chain activity tells a different story that same day: USDC Treasury minted another 250 million USDC on Solana, so liquidity on-chain hasn’t dried up completely.
I don’t think this is an issue with SOL alone. It looks more like funds are returning to BTC and ETH first now that the broader market has found a floor, while SOL is still waiting for confirmation.
The invalidation levels are clear: watch $93.72, SOL’s 14-day low—if it breaks below that, weakness is continuing. A move back above $96 would mean it’s catching up with the broader market again.
Which do you think will happen first: SOL breaks below $93.72, or climbs back above $96?
$SOL $BTC $ETH
#Solana #CryptoMarket
SOL is lagging a bit today—have you noticed?
BTC is back above $78,000 and ETH has climbed above $2,270, but SOL is still hovering around $95, down about 1% over the past 24 hours.
Even more striking are the October figures: U.S. spot SOL ETFs saw $143.7 million in outflows for the month, their largest monthly outflow since launching last October.
But on-chain activity tells a different story that same day: USDC Treasury minted another 250 million USDC on Solana, so liquidity on-chain hasn’t dried up completely.
I don’t think this is an issue with SOL alone. It looks more like funds are returning to BTC and ETH first now that the broader market has found a floor, while SOL is still waiting for confirmation.
The invalidation levels are clear: watch $93.72, SOL’s 14-day low—if it breaks below that, weakness is continuing. A move back above $96 would mean it’s catching up with the broader market again.
Which do you think will happen first: SOL breaks below $93.72, or climbs back above $96?
$SOL $BTC $ETH
#Solana #CryptoMarket
BTC is back above $78,000 and ETH has climbed above $2,270, but SOL is still hovering around $95, down about 1% over the past 24 hours.
Even more striking are the October figures: U.S. spot SOL ETFs saw $143.7 million in outflows for the month, their largest monthly outflow since launching last October.
But on-chain activity tells a different story that same day: USDC Treasury minted another 250 million USDC on Solana, so liquidity on-chain hasn’t dried up completely.
I don’t think this is an issue with SOL alone. It looks more like funds are returning to BTC and ETH first now that the broader market has found a floor, while SOL is still waiting for confirmation.
The invalidation levels are clear: watch $93.72, SOL’s 14-day low—if it breaks below that, weakness is continuing. A move back above $96 would mean it’s catching up with the broader market again.
Which do you think will happen first: SOL breaks below $93.72, or climbs back above $96?
$SOL $BTC $ETH
#Solana #CryptoMarket
287
·
--
The sector divergence was pretty clear today—not a broad-based rally or sell-off.
The CeFi sector rose 1.34% over the past 24 hours, making it the strongest performer today.
Within the sector, OKB gained 2.72% and BNB rose 1.56%, both outperforming the broader market.
Meanwhile, BTC gained 1.04%, moving back above $78,000.
ETH rose 1.06% and is approaching $2,300.
But things looked less positive elsewhere.
The AI sector fell 1.61%, DeFi dropped 0.75%, and Layer 2 declined 0.34%.
I think this suggests that today, investors preferred to stay in areas with greater certainty rather than chase high-volatility themes.
Whether this divergence will continue remains to be seen tomorrow.
If CeFi can't hold on to today's gains tomorrow, or BTC falls back below $78,000, then my take will be invalidated.
Which side are you more bullish on: sticking with CeFi, or waiting to see if the AI sector drops enough to present an opportunity?
$BNB $OKB $BTC
#CeFi #CryptoMarket
The sector divergence was pretty clear today—not a broad-based rally or sell-off.
The CeFi sector rose 1.34% over the past 24 hours, making it the strongest performer today.
Within the sector, OKB gained 2.72% and BNB rose 1.56%, both outperforming the broader market.
Meanwhile, BTC gained 1.04%, moving back above $78,000.
ETH rose 1.06% and is approaching $2,300.
But things looked less positive elsewhere.
The AI sector fell 1.61%, DeFi dropped 0.75%, and Layer 2 declined 0.34%.
I think this suggests that today, investors preferred to stay in areas with greater certainty rather than chase high-volatility themes.
Whether this divergence will continue remains to be seen tomorrow.
If CeFi can't hold on to today's gains tomorrow, or BTC falls back below $78,000, then my take will be invalidated.
Which side are you more bullish on: sticking with CeFi, or waiting to see if the AI sector drops enough to present an opportunity?
$BNB $OKB $BTC
#CeFi #CryptoMarket
The CeFi sector rose 1.34% over the past 24 hours, making it the strongest performer today.
Within the sector, OKB gained 2.72% and BNB rose 1.56%, both outperforming the broader market.
Meanwhile, BTC gained 1.04%, moving back above $78,000.
ETH rose 1.06% and is approaching $2,300.
But things looked less positive elsewhere.
The AI sector fell 1.61%, DeFi dropped 0.75%, and Layer 2 declined 0.34%.
I think this suggests that today, investors preferred to stay in areas with greater certainty rather than chase high-volatility themes.
Whether this divergence will continue remains to be seen tomorrow.
If CeFi can't hold on to today's gains tomorrow, or BTC falls back below $78,000, then my take will be invalidated.
Which side are you more bullish on: sticking with CeFi, or waiting to see if the AI sector drops enough to present an opportunity?
$BNB $OKB $BTC
#CeFi #CryptoMarket
69
·
--
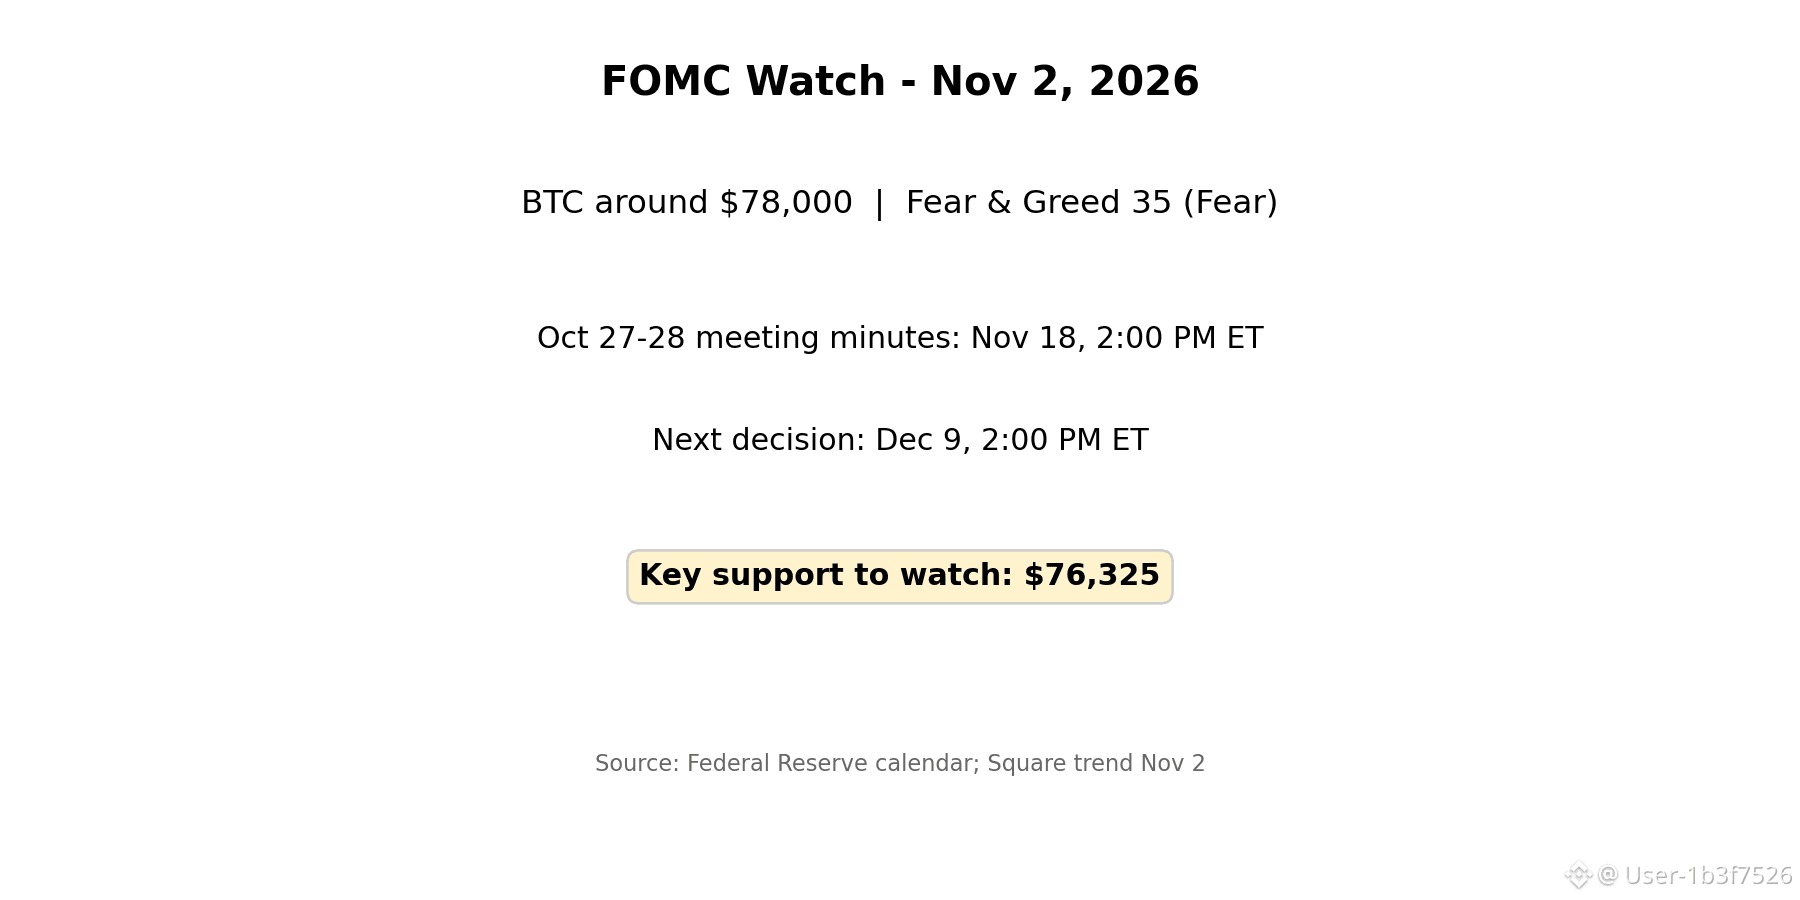
Fear Index at 35: When others are afraid, what are traders waiting for?
Bitcoin was still around $78,000 yesterday, while the Fear and Greed Index was only 35.
The minutes from the October 27–28 meeting won’t be released until November 18, and the next decision is on December 9. Volatility is most likely to pick up during the stretch in between.
The key levels are clear: first, watch whether the price can reclaim $78,000; support below is at $76,325.
I don’t think this is the time to chase a rally. It’s time to wait for direction. Once a direction emerges, those who hesitate are most likely to chase the price halfway up.
Here’s my plan: if $76,325 holds, I’ll look for a rebound above $78,000. If it falls below $76,325, my view is invalidated, so I’ll stay on the sidelines for now.
What would you choose: wait for it to reclaim $78,000 before joining in, or step aside and wait if it breaks below $76,325?$BTC $ETH $SOL #FOMC会议 #比特币
Fear Index at 35: When others are afraid, what are traders waiting for?
Bitcoin was still around $78,000 yesterday, while the Fear and Greed Index was only 35.
The minutes from the October 27–28 meeting won’t be released until November 18, and the next decision is on December 9. Volatility is most likely to pick up during the stretch in between.
The key levels are clear: first, watch whether the price can reclaim $78,000; support below is at $76,325.
I don’t think this is the time to chase a rally. It’s time to wait for direction. Once a direction emerges, those who hesitate are most likely to chase the price halfway up.
Here’s my plan: if $76,325 holds, I’ll look for a rebound above $78,000. If it falls below $76,325, my view is invalidated, so I’ll stay on the sidelines for now.
What would you choose: wait for it to reclaim $78,000 before joining in, or step aside and wait if it breaks below $76,325?$BTC $ETH $SOL #FOMC会议 #比特币
Bitcoin was still around $78,000 yesterday, while the Fear and Greed Index was only 35.
The minutes from the October 27–28 meeting won’t be released until November 18, and the next decision is on December 9. Volatility is most likely to pick up during the stretch in between.
The key levels are clear: first, watch whether the price can reclaim $78,000; support below is at $76,325.
I don’t think this is the time to chase a rally. It’s time to wait for direction. Once a direction emerges, those who hesitate are most likely to chase the price halfway up.
Here’s my plan: if $76,325 holds, I’ll look for a rebound above $78,000. If it falls below $76,325, my view is invalidated, so I’ll stay on the sidelines for now.
What would you choose: wait for it to reclaim $78,000 before joining in, or step aside and wait if it breaks below $76,325?$BTC $ETH $SOL #FOMC会议 #比特币
1
83
·
--
The FOMC minutes won’t be released until November 18—should I make a move now or not?
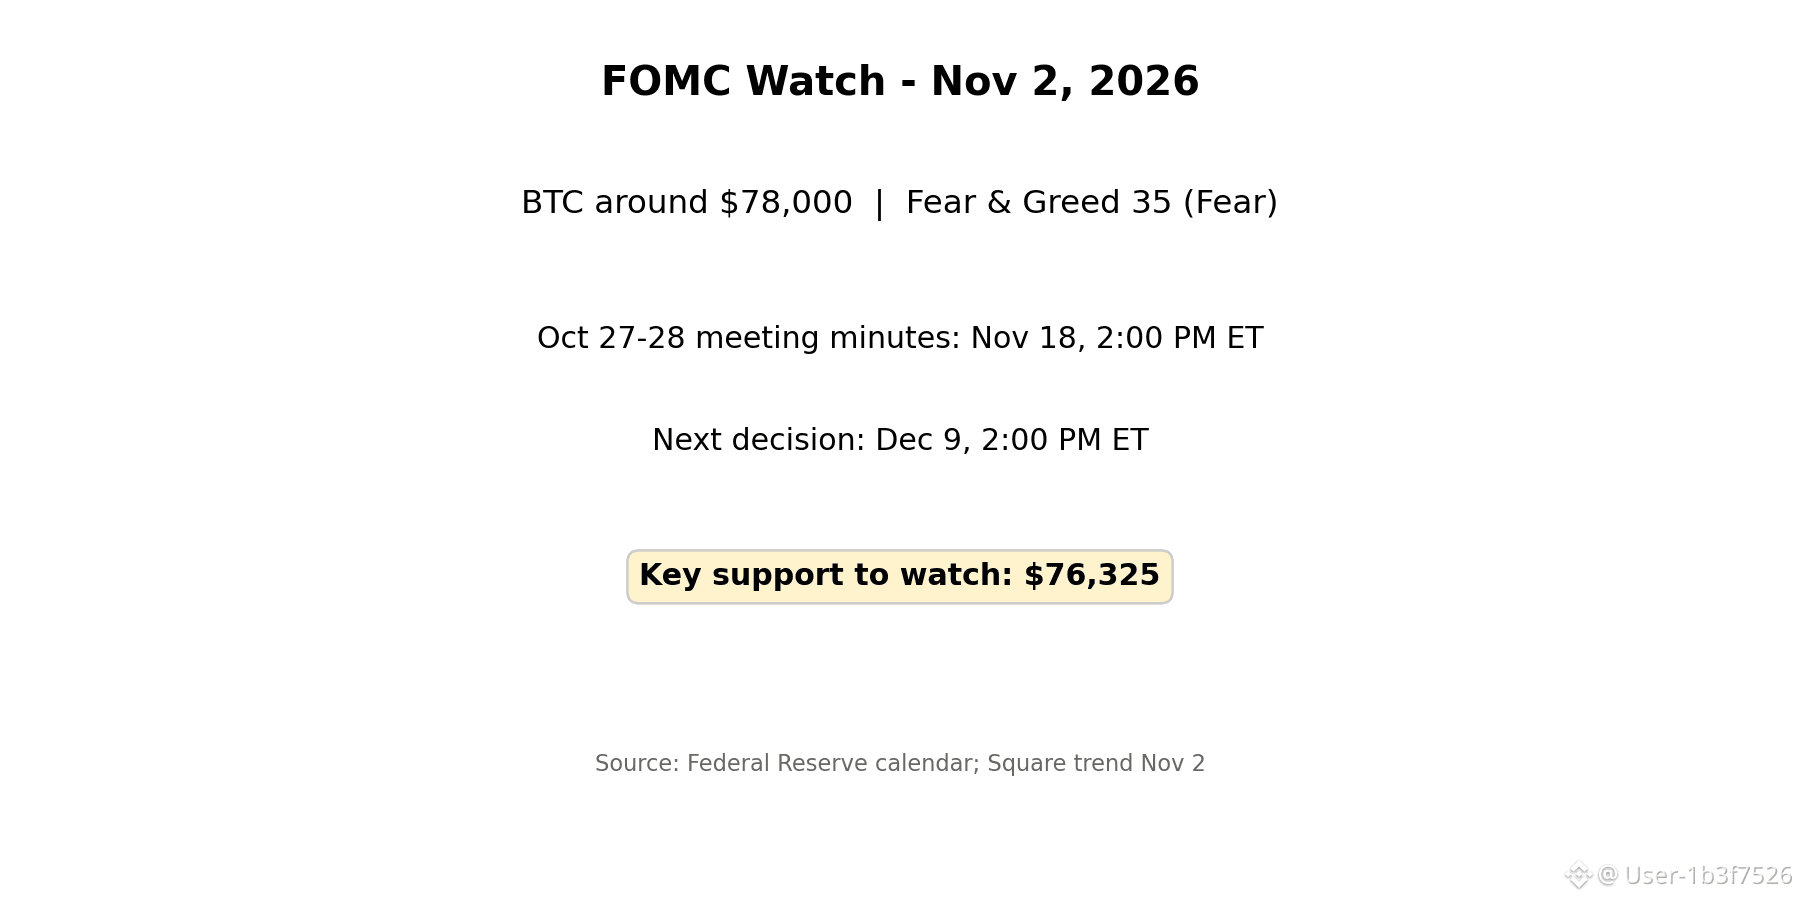
There are 2,440 people discussing FOMC on the plaza today, making it the day’s hottest topic.
Bitcoin was still around $78,000 yesterday, and the Fear & Greed Index was just 35, indicating fear.
The minutes from the October 27–28 meeting won’t be released until 2 p.m. ET on November 18. The next decision is on December 9.
I think prices are more likely to move sideways before the minutes come out. Chasing either a rally or a drop could easily get you whipsawed.
Here’s what I’m doing: first, I’m watching to see whether Bitcoin can hold $76,325. If it can’t, I’ll sit tight for now.
If it falls below $76,325, my “wait for the minutes” call is no longer valid.
What would you do: wait until the November 18 minutes to make a move, or make a small move now?
$BTC $ETH $SOL
#FOMCMeeting #Bitcoin
The FOMC minutes won’t be released until November 18—should I make a move now or not?
There are 2,440 people discussing FOMC on the plaza today, making it the day’s hottest topic.
Bitcoin was still around $78,000 yesterday, and the Fear & Greed Index was just 35, indicating fear.
The minutes from the October 27–28 meeting won’t be released until 2 p.m. ET on November 18. The next decision is on December 9.
I think prices are more likely to move sideways before the minutes come out. Chasing either a rally or a drop could easily get you whipsawed.
Here’s what I’m doing: first, I’m watching to see whether Bitcoin can hold $76,325. If it can’t, I’ll sit tight for now.
If it falls below $76,325, my “wait for the minutes” call is no longer valid.
What would you do: wait until the November 18 minutes to make a move, or make a small move now?
$BTC $ETH $SOL
#FOMCMeeting #Bitcoin
There are 2,440 people discussing FOMC on the plaza today, making it the day’s hottest topic.
Bitcoin was still around $78,000 yesterday, and the Fear & Greed Index was just 35, indicating fear.
The minutes from the October 27–28 meeting won’t be released until 2 p.m. ET on November 18. The next decision is on December 9.
I think prices are more likely to move sideways before the minutes come out. Chasing either a rally or a drop could easily get you whipsawed.
Here’s what I’m doing: first, I’m watching to see whether Bitcoin can hold $76,325. If it can’t, I’ll sit tight for now.
If it falls below $76,325, my “wait for the minutes” call is no longer valid.
What would you do: wait until the November 18 minutes to make a move, or make a small move now?
$BTC $ETH $SOL
#FOMCMeeting #Bitcoin
1
1.1k
Log in to explore more content
Join global crypto users on Binance Square
⚡️ Get latest and useful information about crypto.
💬 Trusted by the world’s largest crypto exchange.
👍 Discover real insights from verified creators.
Email / Phone number
Trending Topics
BinanceWithdrawalScamWarning
20,976 views
494 Discussing
Binance Warns Users of Withdrawal Scams as Services Resume: It Will Never Charge Fees, Sell Queue Spots or Ask You to Move Funds to a “Vault”
Binance News
·10 Likes
·6.2k views
USMidtermElections
575,534 views
3,069 Discussing
USOctoberNFP-AreRateCutsStillPossible
29,400 views
437 Discussing